1. Introduction
Residential solar power is rapidly expanding in the United States (U.S.). In 2018, there was a 7% increase in residential distributed solar photovoltaic (DPV) deployment [
1]. Such large increases in the deployment of DPV in the U.S. over the previous 5–7 years has been attributed to significant declines in equipment costs [
2], state and federal tax credits, and electric utility net-energy metering (NEM) compensation programs [
3]. NEM is a billing mechanism that credits customers with distributed generation systems for any electricity they export to the grid [
4]. Use of NEM in conjunction with volumetric retail electricity pricing (i.e., uniform compensation of generation in excess of consumption, regardless of its characteristics such as time of generation), however, has also raised concerns among utilities and regulators of higher retail electric power rates and shifting of costs from DPV to non-DPV customers [
5]. While current amounts of DPV in many jurisdictions are small and thus any retail rate and cost-shifting concerns may be anticipatory in nature, NEM reforms have been proposed and, in certain cases, adopted by state public utility commissions [
6]. Importantly, most reforms change the DPV system payback periods and have the potential to reduce distributed solar PV deployment [
7]. Barbose et al. [
8], for example, modeled effects of a reduction in NEM compensation for grid exports from retail to wholesale electric power rates. They found that this reduction in NEM compensation would reduce residential 2050 solar PV deployment by approximately 20%.
Electric investor-owned utilities (IOUs), particularly those in the United States, are concerned about the effects of DPV on future earnings opportunities from deferred or avoided capital investments under existing regulatory and business models [
9]. IOUs increase their earnings base by investing in capital, which may be growth-related (e.g., new distribution system investments and generating plants to serve increasing load) [
10]. Thus, stagnant or declining sales as a result of DPV, as well as energy efficiency [
11] and other forms of other forms of distributed energy resources (DERs), may reduce these future earnings opportunities [
12]. Future growth in electric vehicle penetration, among other sources of electrification which increase electricity consumption, may counter the prevailing trend of declining sales.
Furthermore, the decrease in DPV and other forms of DER costs (e.g., battery storage) has led to increased financial pressure on the utility from customer self-supply [
13]. Many utilities around the world typically allocate a significant portion of their fixed costs to volumetric energy charges. As a result, any reduction in electricity sales without a similar reduction in fixed costs erodes a utility’s net revenues. Such impacts are especially disconcerting to utility shareholders due to the reduction in achieved earnings and return on equity (ROE) [
14].
At the same time, utility regulators are increasingly concerned about possible increases in retail rates and cost-shifting from customers with DPV (i.e., participants) to non-DPV customers (i.e., non-participants) [
15]. In instances where costs increase faster than sales, there is upward pressure on retail rates. In addition, customers who invest in DPV and can significantly reduce or even eliminate the volumetric portion of their bills via NEM may not adequately pay their full share of the utility’s fixed costs, which places an increased cost burden on non-participating customers.
Regulators of any utility in such a situation must weigh utility and ratepayer concerns as they consider changes to NEM and retail rate design that directly affects DPV, battery storage, and other forms of DER. Ultimately, they must make a determination that they believe serves the broader public interest based on the information they have available to them.
While these concerns are qualitatively understood, there is a lack of empirical and quantitative analysis to bound the magnitude of these concerns and the efficacy of alternative utility regulatory and business models. Instead, most quantitative analyses evaluating DPV impacts on an electric utility exclusively focus on a simplified cost and/or benefit analysis without considering the financial implications on a utility [
16]. Those studies which focus on DPV costs find incremental electric system costs which range from
$0–25/MWh [
17,
18,
19,
20,
21,
22,
23,
24]. On the other hand, those studies which focus on DPV benefits find electric system benefits which range from
$0–53/MWh [
25,
26,
27,
28,
29,
30,
31,
32]. In general, these analyses focus on system costs and benefits without considering the role of a regulated utility and their accompanying business practices.
Another subset of the literature evaluates how NEM and DPV adoption impacts utility ratepayers but notably does not incorporate a fully-integrated pro forma financial model. Poulilkkas [
33] studied the effect of NEM on DPV adoption at one representative household while Christoforidis et al. [
34] performed a similar analysis across a broader set of 31 customers. Neither study evaluated the impact on electric utility collected revenues or earnings. Eid et al. [
35] and Picciariello et al. [
36] expanded on this work by evaluating the cross-subsidization due to NEM between PV owners and non-owners. Furthermore, Johnson et al. [
37] added an analysis of the DPV impact on utility load shape into the analysis of NEM cross-subsidization between PV owners and non-owners. However, none of the above quantitative studies: (1) calculate utility shareholder impacts, (2) take into account regulatory lag and other artifacts of utility regulation (e.g., test years), or (3) integrate a long-term analysis horizon that incorporates feedback effects between PV hourly loads and utility costs that accumulate over time to impact electricity rates.
Many of the concerns expressed by utilities and regulators, though, depend critically on the specific changes in costs and revenues that are a function of utility cost compositions (e.g., proportion of fixed versus variable costs), physical system attributes (e.g., hourly loads), and fixed cost recovery mechanisms, among others, which interact with PV adoption and utility regulatory considerations over time. Most of the prior studies reviewed above do not perform a comprehensive financial analysis using these key utility characteristics and do not incorporate a robust review of the costs and benefits of DPV in retail electricity rates.
To fill this research gap, this study quantifies the financial impacts of net-metered DPV on a prototypical Western U.S. IOU and identifies the key sensitivities driving lesser or greater magnitude of impacts. While we integrate the above cost-benefit studies into our financial modeling, we use a financial framework that better assesses the implications for a regulated IOU. Furthermore, we build on prior quantitative analysis of the financial impacts of net-metered PV [
38,
39] by assessing a wider range of sensitivities specific to the ability of DPV to avoid or defer utility costs (i.e., “DPV value”). Although the costs, revenue, and regulatory accounting assumptions are based on the U.S. context, we believe the results are generalizable and relevant for other utility circumstances around the world.
2. Materials and Methods
We quantify the shareholder and ratepayer impacts for a Western U.S., vertically-integrated IOU (i.e., that owns generation, transmission, and distribution assets) at two DPV deployment levels (i.e., 4%, and 8% of 2027 retail sales) representing the range of forecasted DPV deployment among Western states [
40] using a proprietary pro forma financial model.
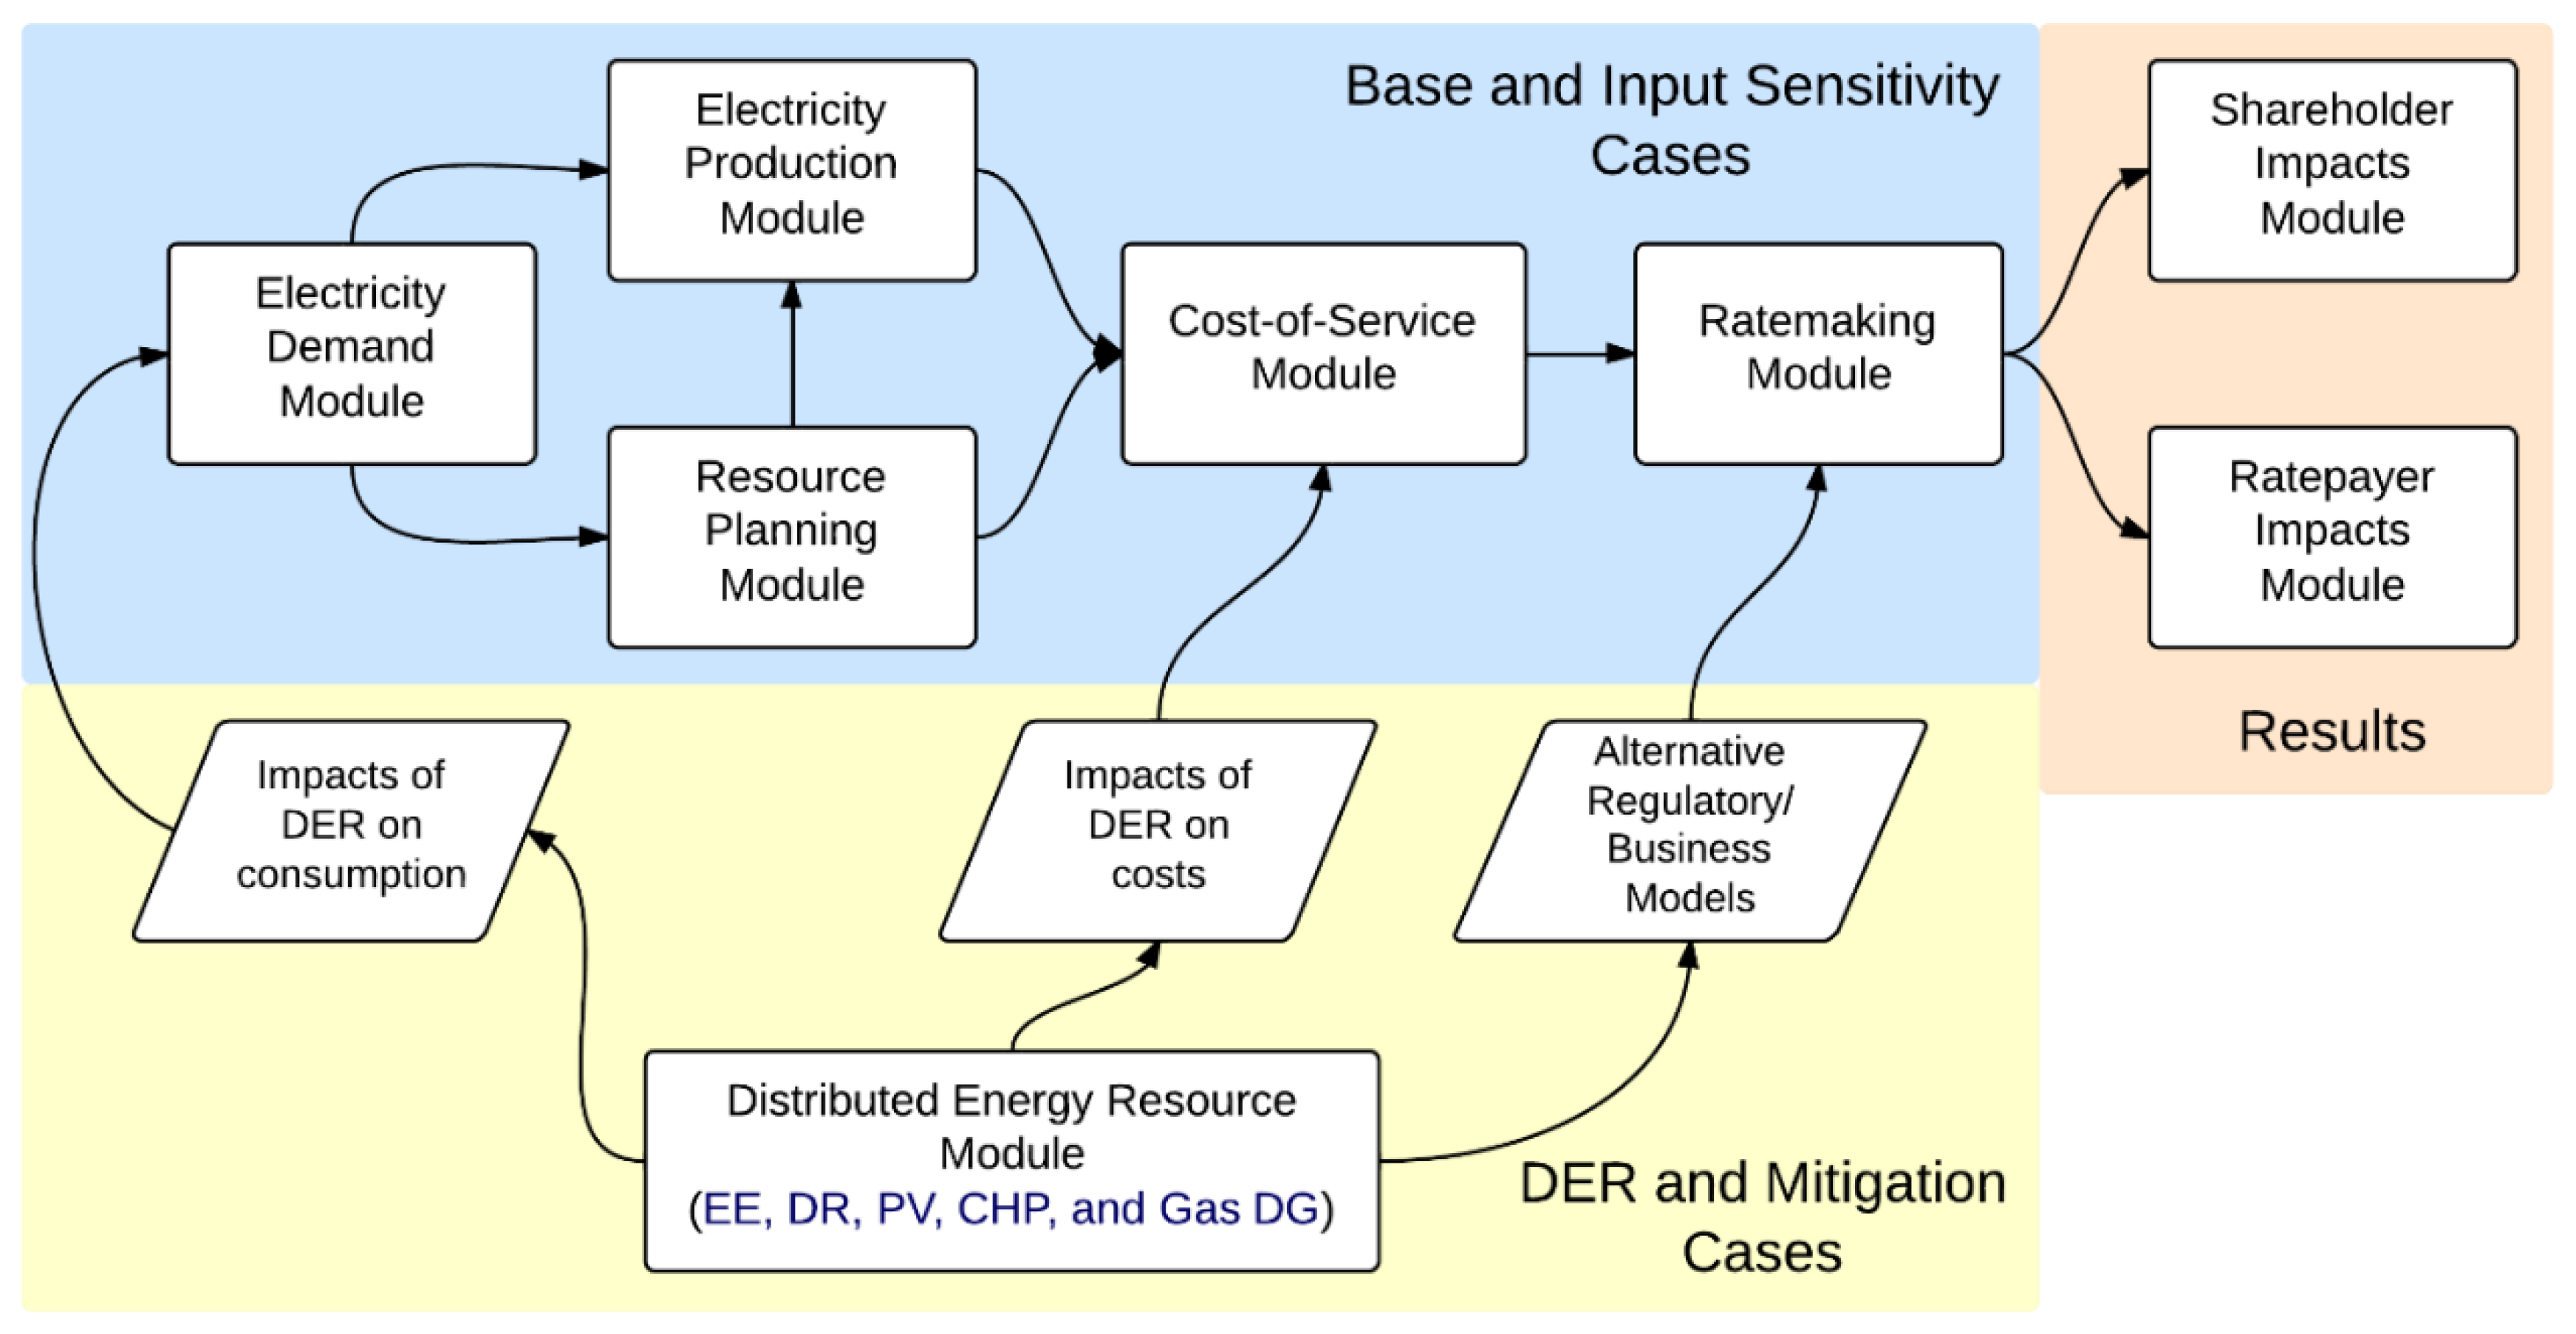
The FINancial impacts of Distributed Energy Resources (FINDER) pro forma financial model quantifies the utility’s annual costs and revenues over a pre-defined analysis period. See
Appendix A for a more detailed description of the pro forma financial model used in this analysis. The model performs all cost calculations at the total utility level but has the ability to allocate those costs to different rate classes in order to assess differential revenue impacts. Key outputs include achieved ROE and earnings, average all-in retail rates and customer bills, which can be used by utilities, policymakers, customer groups, and other stakeholders when assessing the impacts and implications of policy proposals and decisions.
Because the model derives customer class level ratepayer metrics, a more comprehensive bill impact analysis across different customer types, which assumes different hourly consumption profiles for customers and different DPV production profiles for participants, was not possible. A number of other studies have sought to quantify participant and/or non-participant bill impacts in substantial detail, but without any associated feedback effects on rates [
41,
42,
43]. However, our estimates of the percentage change in average all-in retail rates can be used as a proxy for the percentage change in a non-participants’ bill assuming there are no associated changes in their electricity consumption.
Results of our analysis using this pro forma financial model are compared against a case without DPV, incremental energy efficiency, or other DERs in order to isolate the DPV impacts. The DPV is installed linearly over ten years to reach its terminal deployment level (as a percentage of retail electricity sales) with impacts measured over 20 years to capture utility system economic end-effects (i.e., cost avoidance or deferral). We limit our analysis to 20 years despite DPV system lifetimes in excess of 20 years due to the effects of discounting costs and revenues, in addition to increasing uncertainty in utility cost and load forecasts. We also assess the sensitivity of impacts to different assumptions about the “DPV value” (i.e., ability of DPV to avoid or defer utility costs). Each of these different cases are discussed in more detail below.
2.1. Prototypical Western Utility Characterization—Base Case
We developed a 20-year cost and load forecast for a prototypical Western utility by starting with the 2014 general rate case filing of Public Service of Colorado. The general rate case filing was the most recent for the utility that included a cost-of-service study and provided reasonable starting year cost levels, starting year class-level retail sales, peak demand, and customer counts, and class-level cost allocation and rate design. Growth in retail sales, peak demand, and customers are based on Public Service of Colorado’s 2016 integrated resource plan (IRP), which was the most recent one available. Growth in utility cost categories, specifically generation capital expenditures (CapEx), distribution CapEx, and operations and maintenance (O & M), are based on historical 5-year average annual growth rates among Western utilities derived from their FERC Form 1 filings. Last, the Western utility’s hourly load shape is based on Public Service of Colorado’s 2017 hourly load (reported in EIA Form 930) and we used a simple average of load in hours before and after missing values to derive a complete 8760-h load shape. Importantly, while many of the input assumptions were seeded with a single utility’s data, the utility in this analysis is not meant to represent Public Service of Colorado specifically.
We refer to four key assumptions in the Western utility characterization when describing financial impacts. First, non-fuel costs (inclusive return of (i.e., depreciation) and on capital investments, fixed O & M, interest expense, and taxes) grow by 3.3% per year over the 20-year analysis period (2018–2037) (see
Figure 1). Western utilities have seen median generation, transmission, and distribution CapEx costs increase by 6.4%, 3.6%, and 3.8% per year from 2012 to 2016, respectively (calculated based on utility FERC Form 1 data), and we assume similar, rounded CapEx cost escalations (i.e., 6%, 4%, and 4% annual growth in generation, transmission and distribution CapEx costs, respectively). Utility fuel and purchased power (energy and capacity) costs grow by 2.6% per year over the same 20-year analysis period. Our fuel and purchased power costs for non-renewable generation technologies are based on EIA fuel, heat rate, and variable O & M cost assumptions [
44]. Wind and solar PPA costs are based on NREL’s Annual Technology Baseline LCOEs in the “Wind TRG 4” and “Solar CF 20%” forecasts [
45].
Second, the Western utility’s retail sales grow by about 1.0% per year and annual peak demand grows by about 0.9% per year. Our load growth assumptions are based on a specific utility’s IRP forecasts in order to match any incremental generation or purchased power, though the retail sales forecasts are higher than historical, median sales growth among Western utilities. From 2012 to 2016, Western utility median sales slightly declined by about 0.3% per year based on EIA-861 data.
Third, we assume no incremental generation additions in the Base case analysis, as Public Service of Colorado is forecasting PPAs to meet incremental load in its 2016 IRP. We make this assumption about no incremental generation additions in order to maintain consistency between our load and cost assumptions. Given that Western utilities averaged flat, or declining, load growth over the last 5-years, we believe our assumption is reasonable. Nevertheless, we consider the case of incremental generation additions in our sensitivity analysis. We also assume retirement of three generating units during the 20-year analysis period to maintain consistency with Public Service of Colorado’s IRP loads and resources table. These are all input assumptions used to develop a pro forma revenue requirement and were not derived as part of a system planning module within FINDER. As such, the impacts of DPV on utility capital costs are based on a coarser set of assumptions than might be possible with planning models representing the utility’s generation dispatch and power flows on distribution feeders.
Fourth, we assume a flat retail rate design for all customer classes (as opposed to inclining block or time-of-use rates). Residential customer rates and bills collect 90% of revenues via volumetric energy rates with the remainder of revenues (10%) collected via a monthly, fixed customer charge. Commercial and industrial (C & I) customer rates and bills collect about 40% of revenues via an energy charge, 55% of revenues via a demand charge (based on class monthly non-coincident peak), and the remaining via a fixed, monthly customer charge.
2.2. Alternative Assumptions in Utility Characterization—Sensitivity Cases
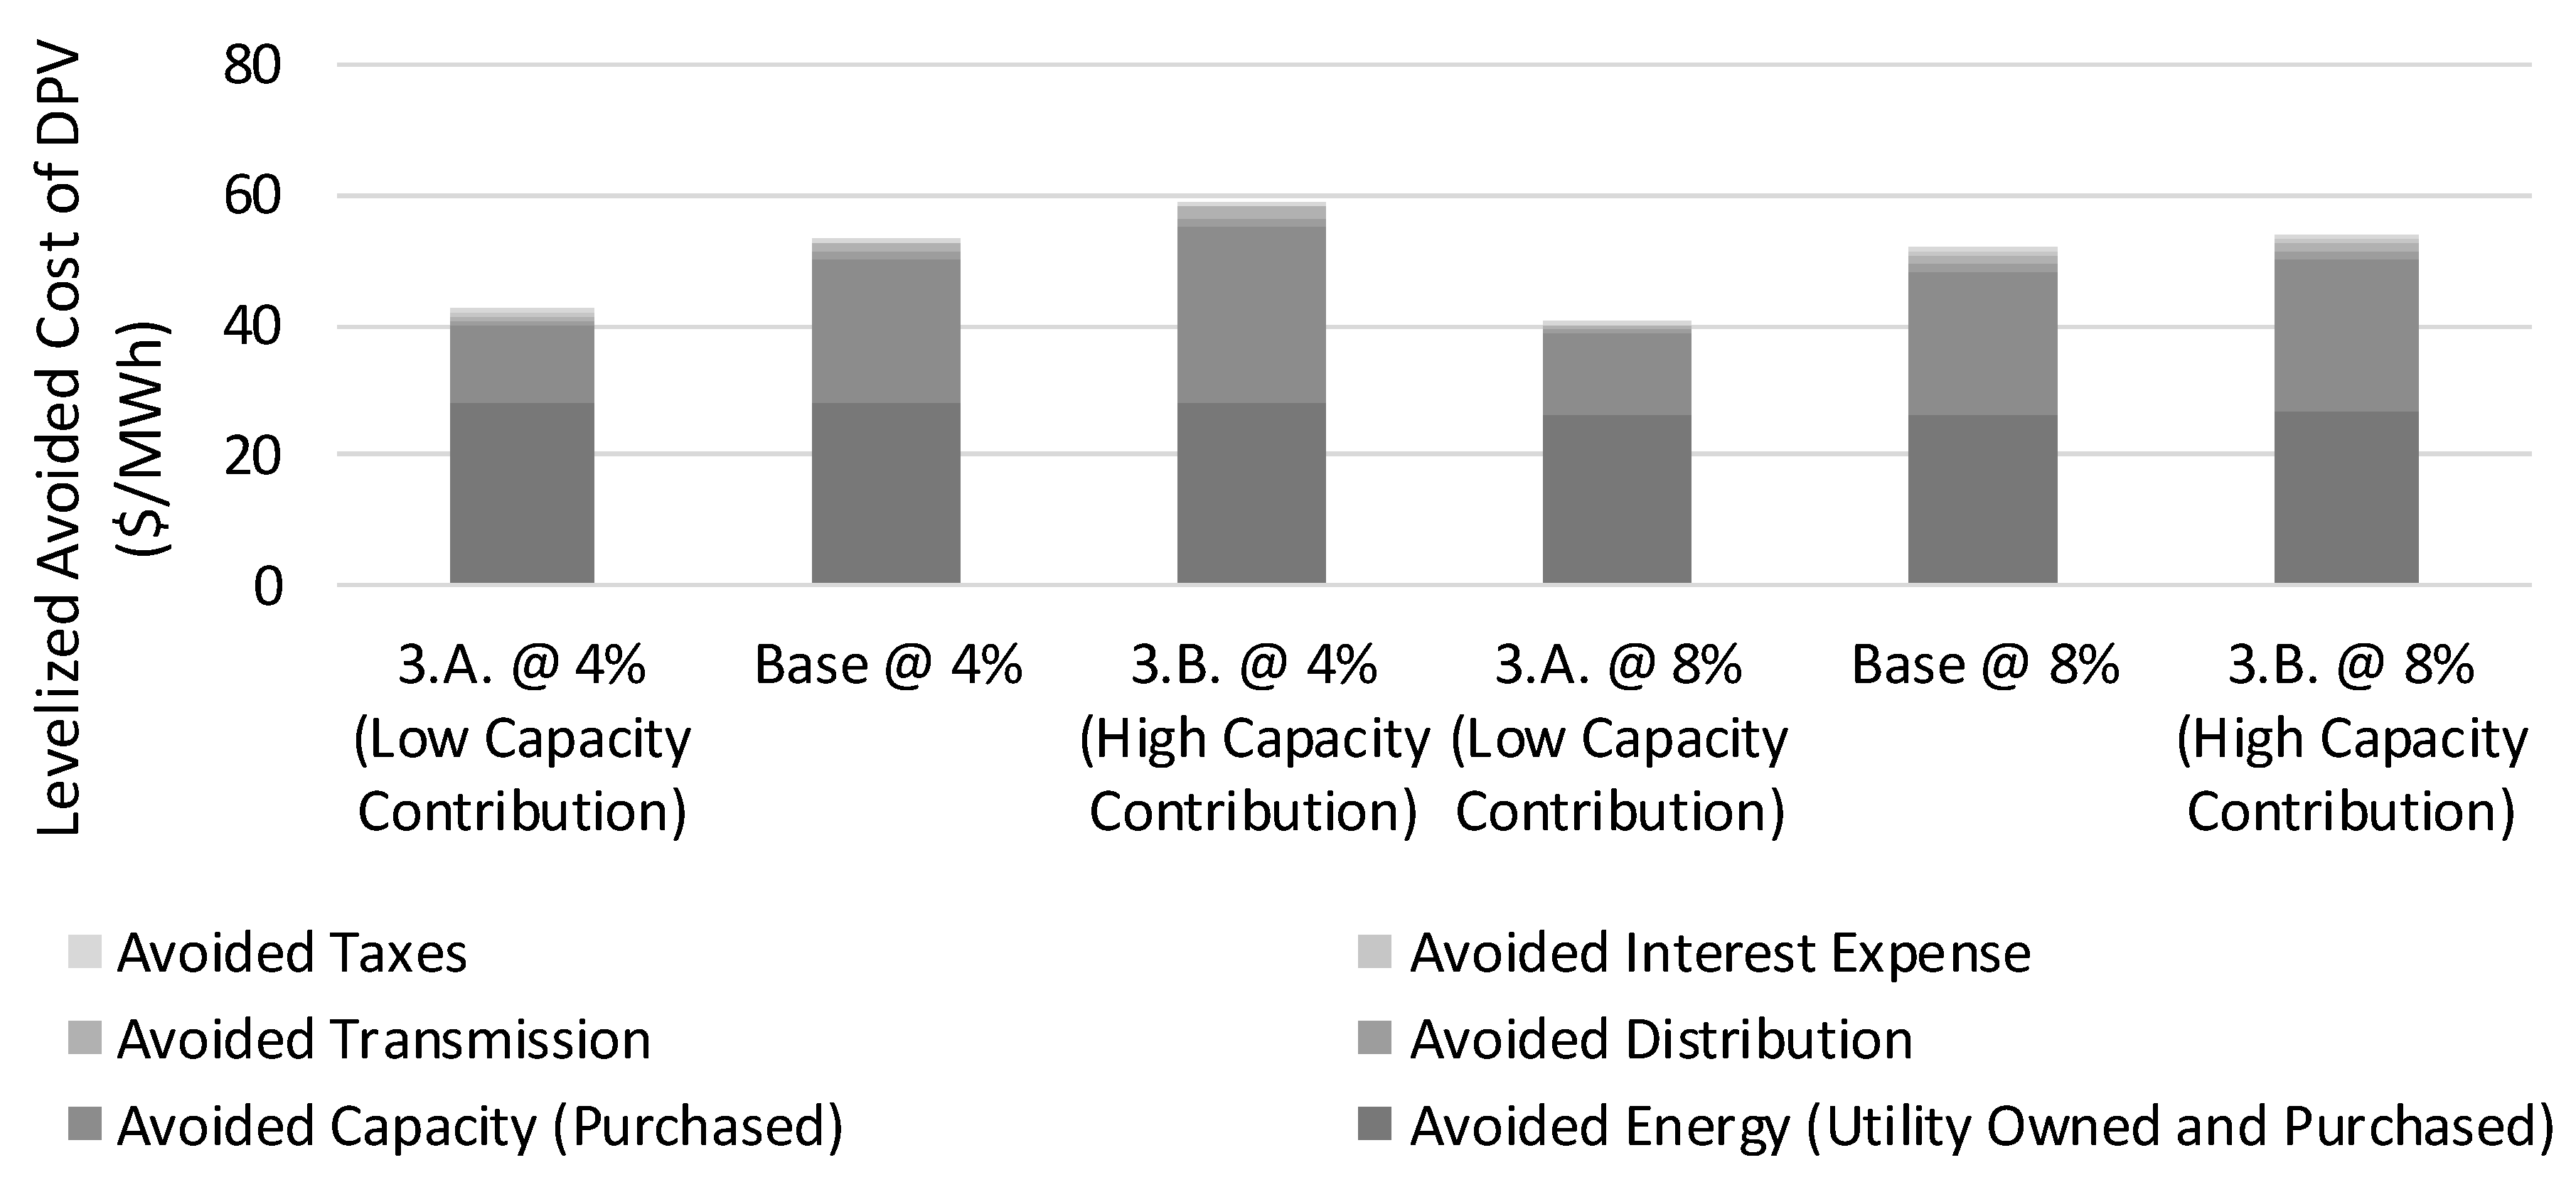
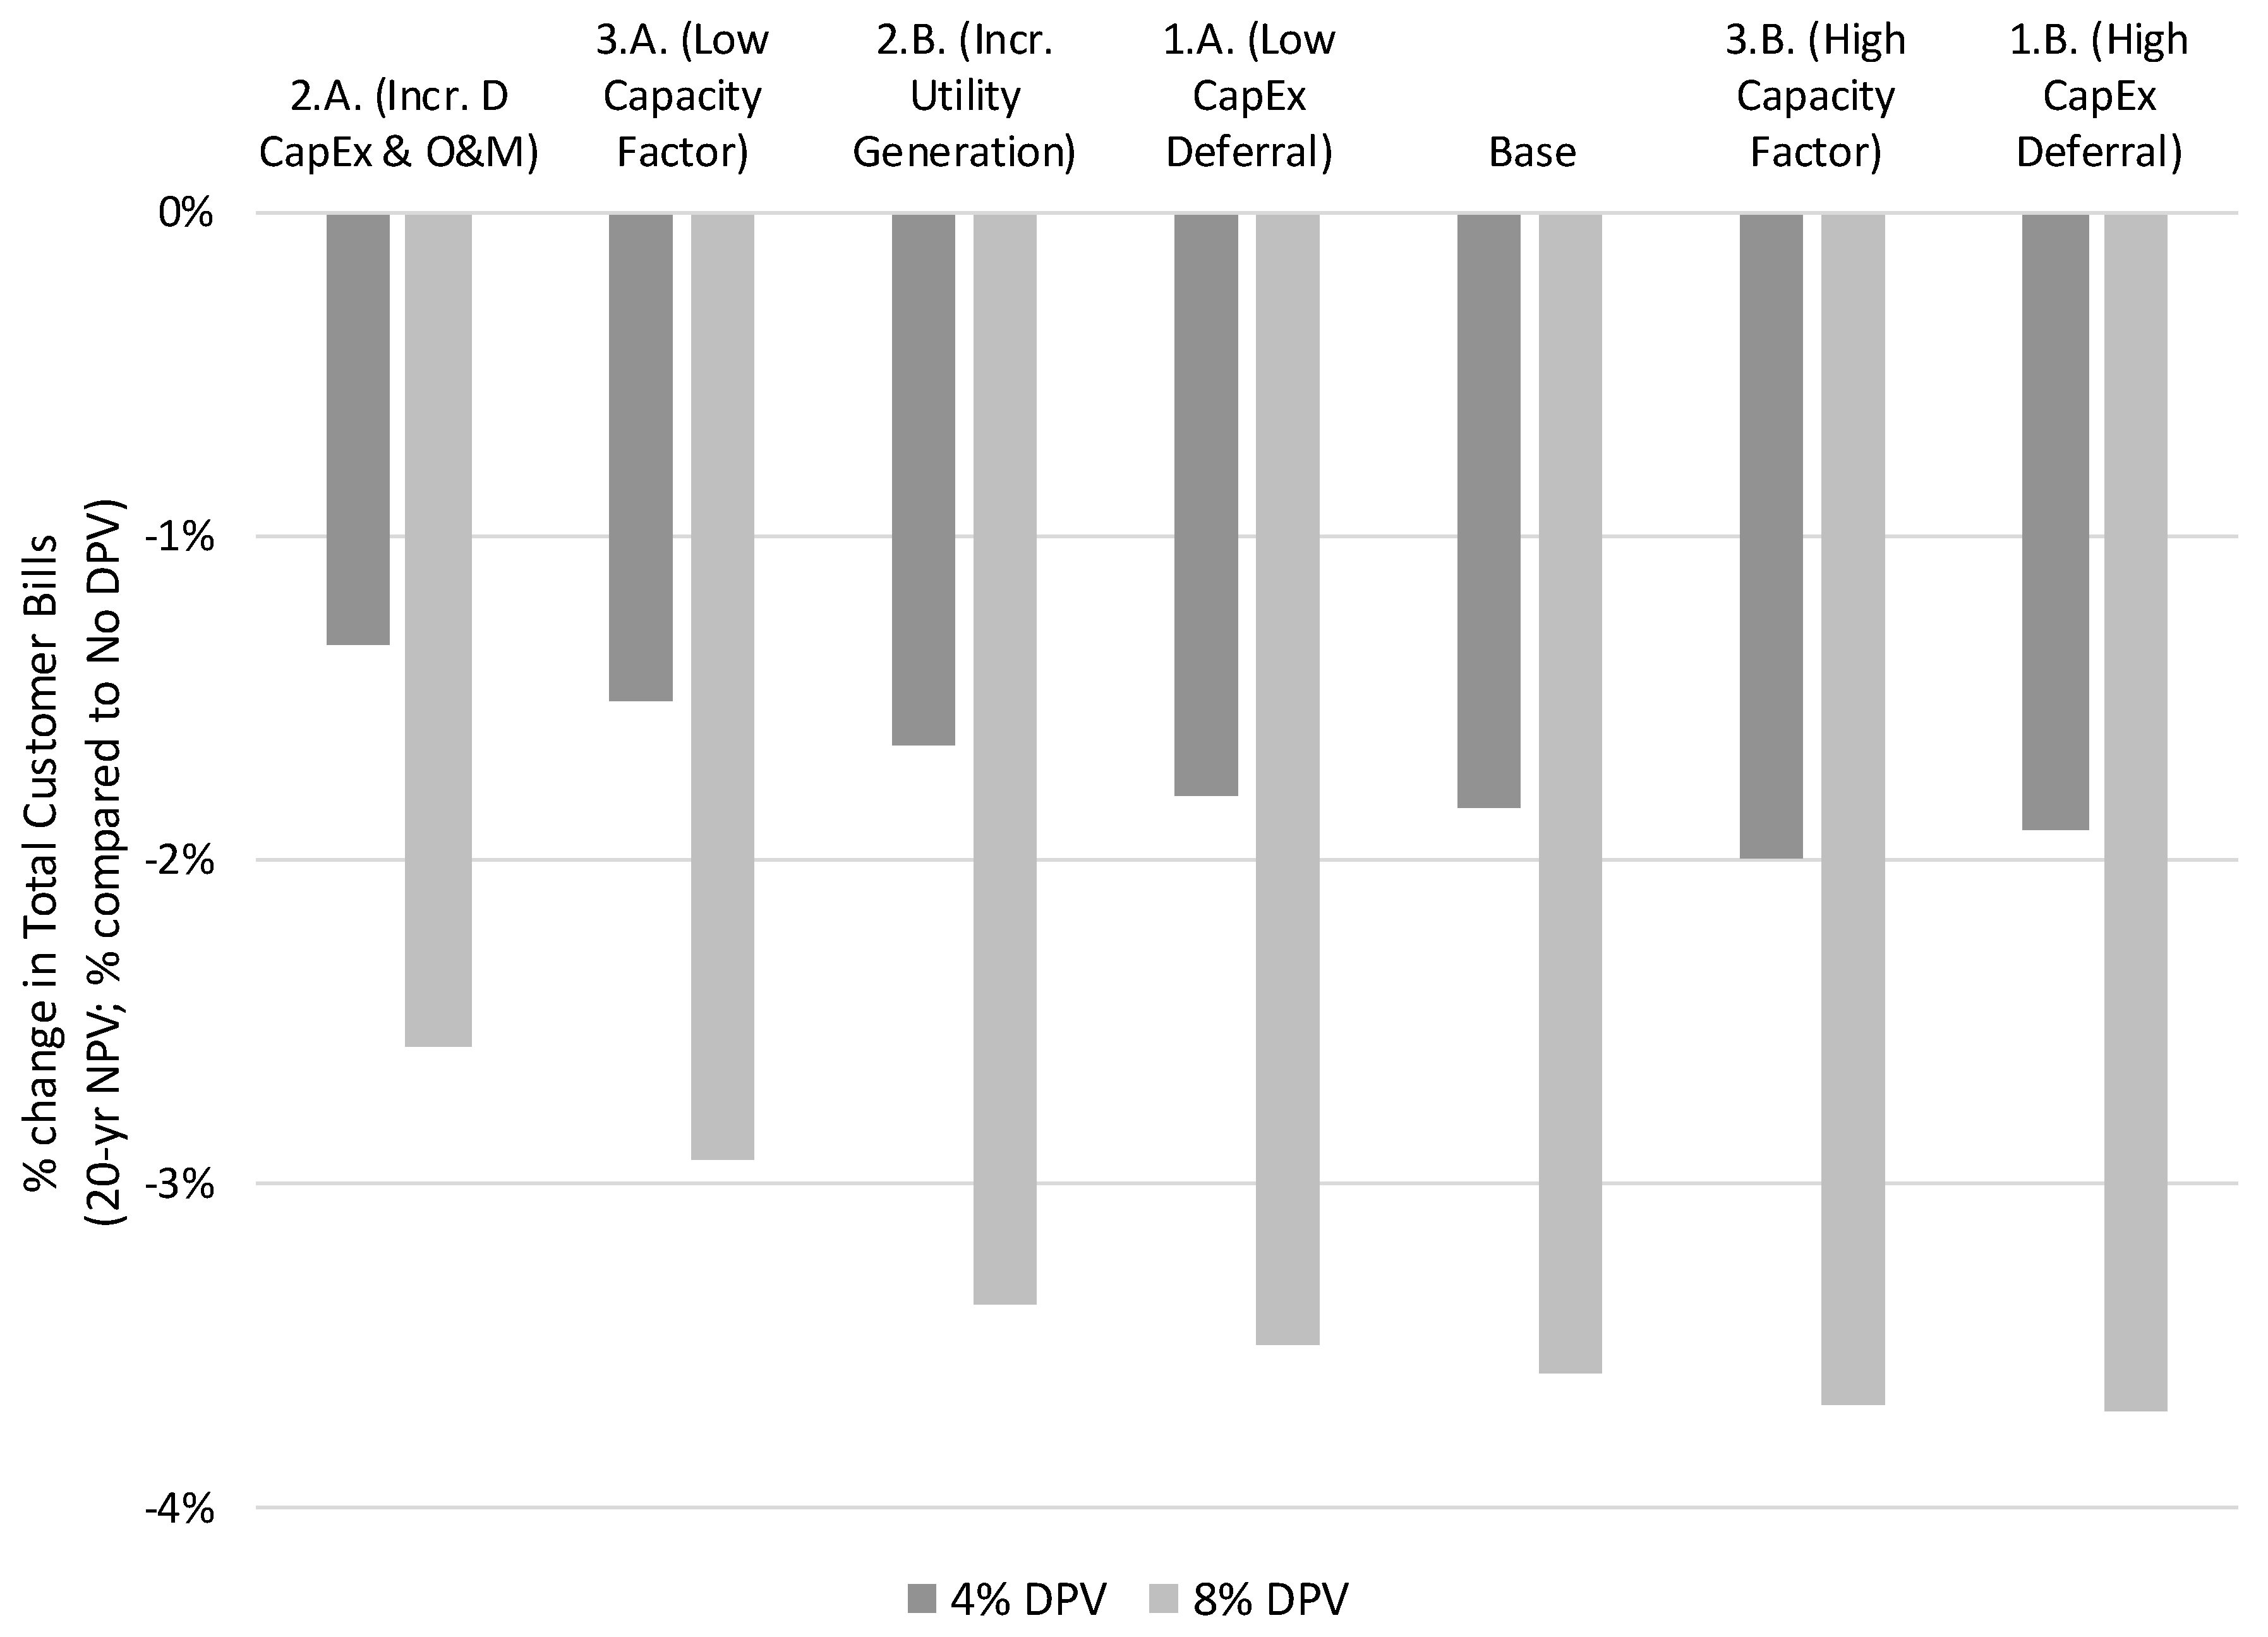
We developed a set of cases to better understand the sensitivity of shareholder and ratepayer impacts from DPV to assumptions related to its capacity value and avoided generation, transmission, and distribution costs. These sensitivity cases involved modifying a number of parameters from the Base case (see
Figure 2), based on ranges that exist in either the literature or Western utility historical data.
In our first sensitivity case, we change the assumed percent of transmission and distribution (T & D) CapEx that are growth-related. As previously discussed, we model two categories of T & D CapEx: load growth-related and non-load growth-related. The Base Case assumes a portion (33%) of investments are growth-related CapEx and the addition of DPV reduces this growth-related CapEx proportional to reductions in annual peak demand. The 33% assumption is consistent with assumptions in prior studies [
38,
39,
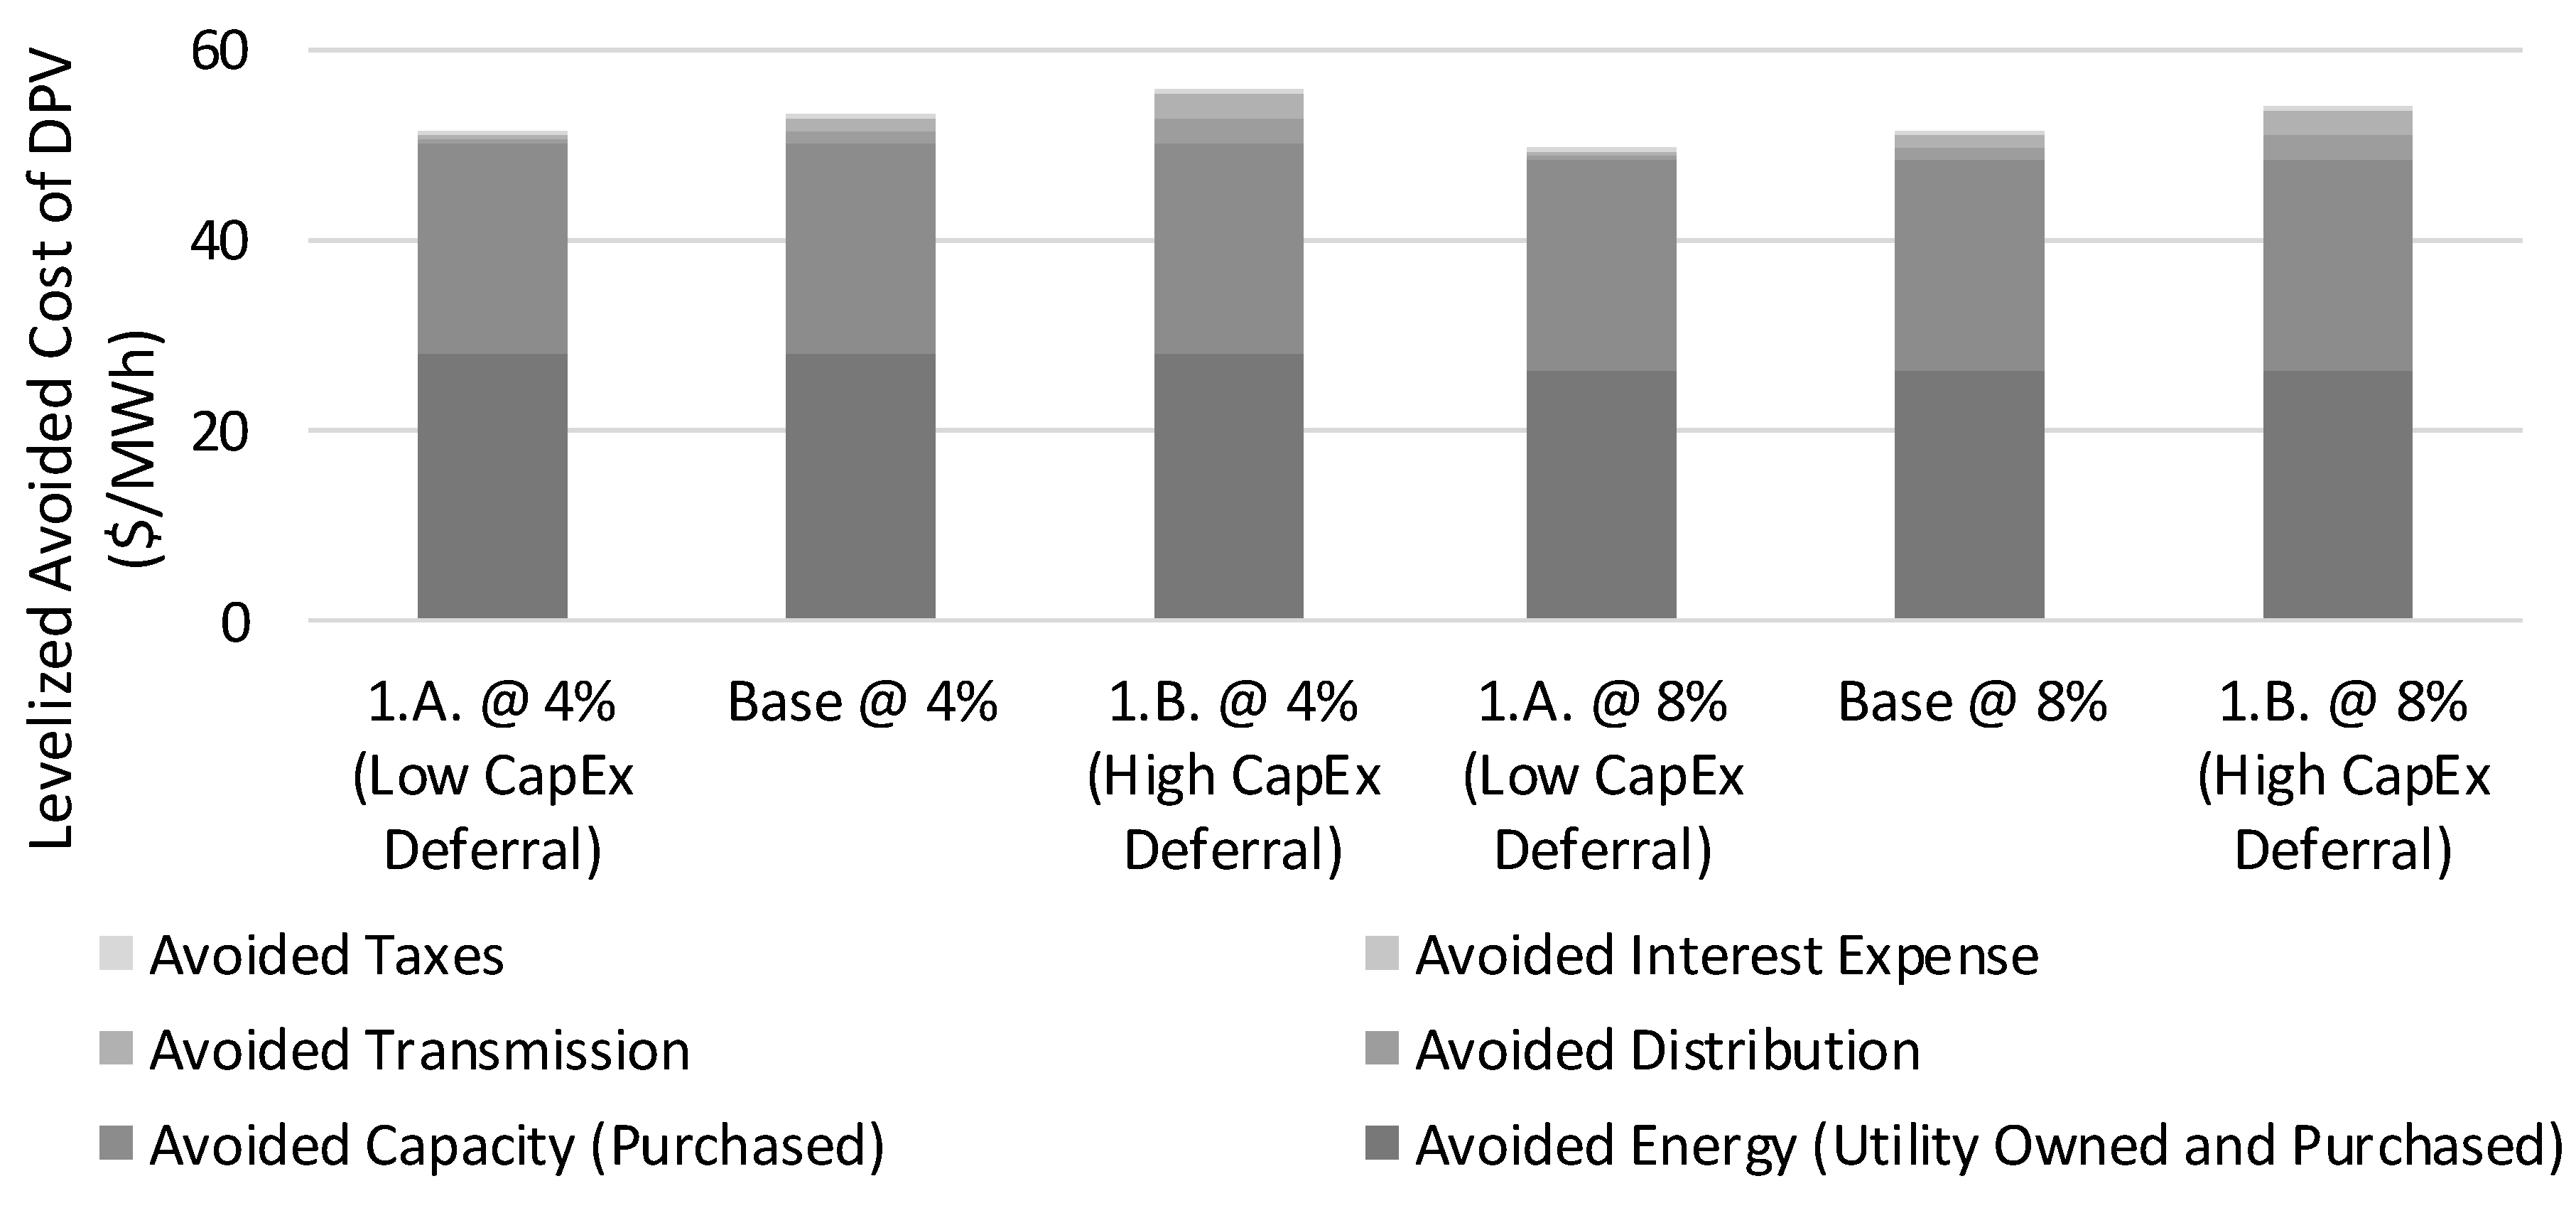
46]. This results in corresponding reductions in returns on ratebase, depreciation expenses, interest, and taxes For the sensitivity case, we bound the assumption with a low value of 10% growth-related T & D CapEx (i.e., Sensitivity Case 1.A.) and high value of 90% growth-related T & D CapEx (i.e., Sensitivity Case 1.B.).
Appendix B shows the sensitivity case analysis results as change in DPV value, change in achieved earnings, and change in average all-in retail rates.
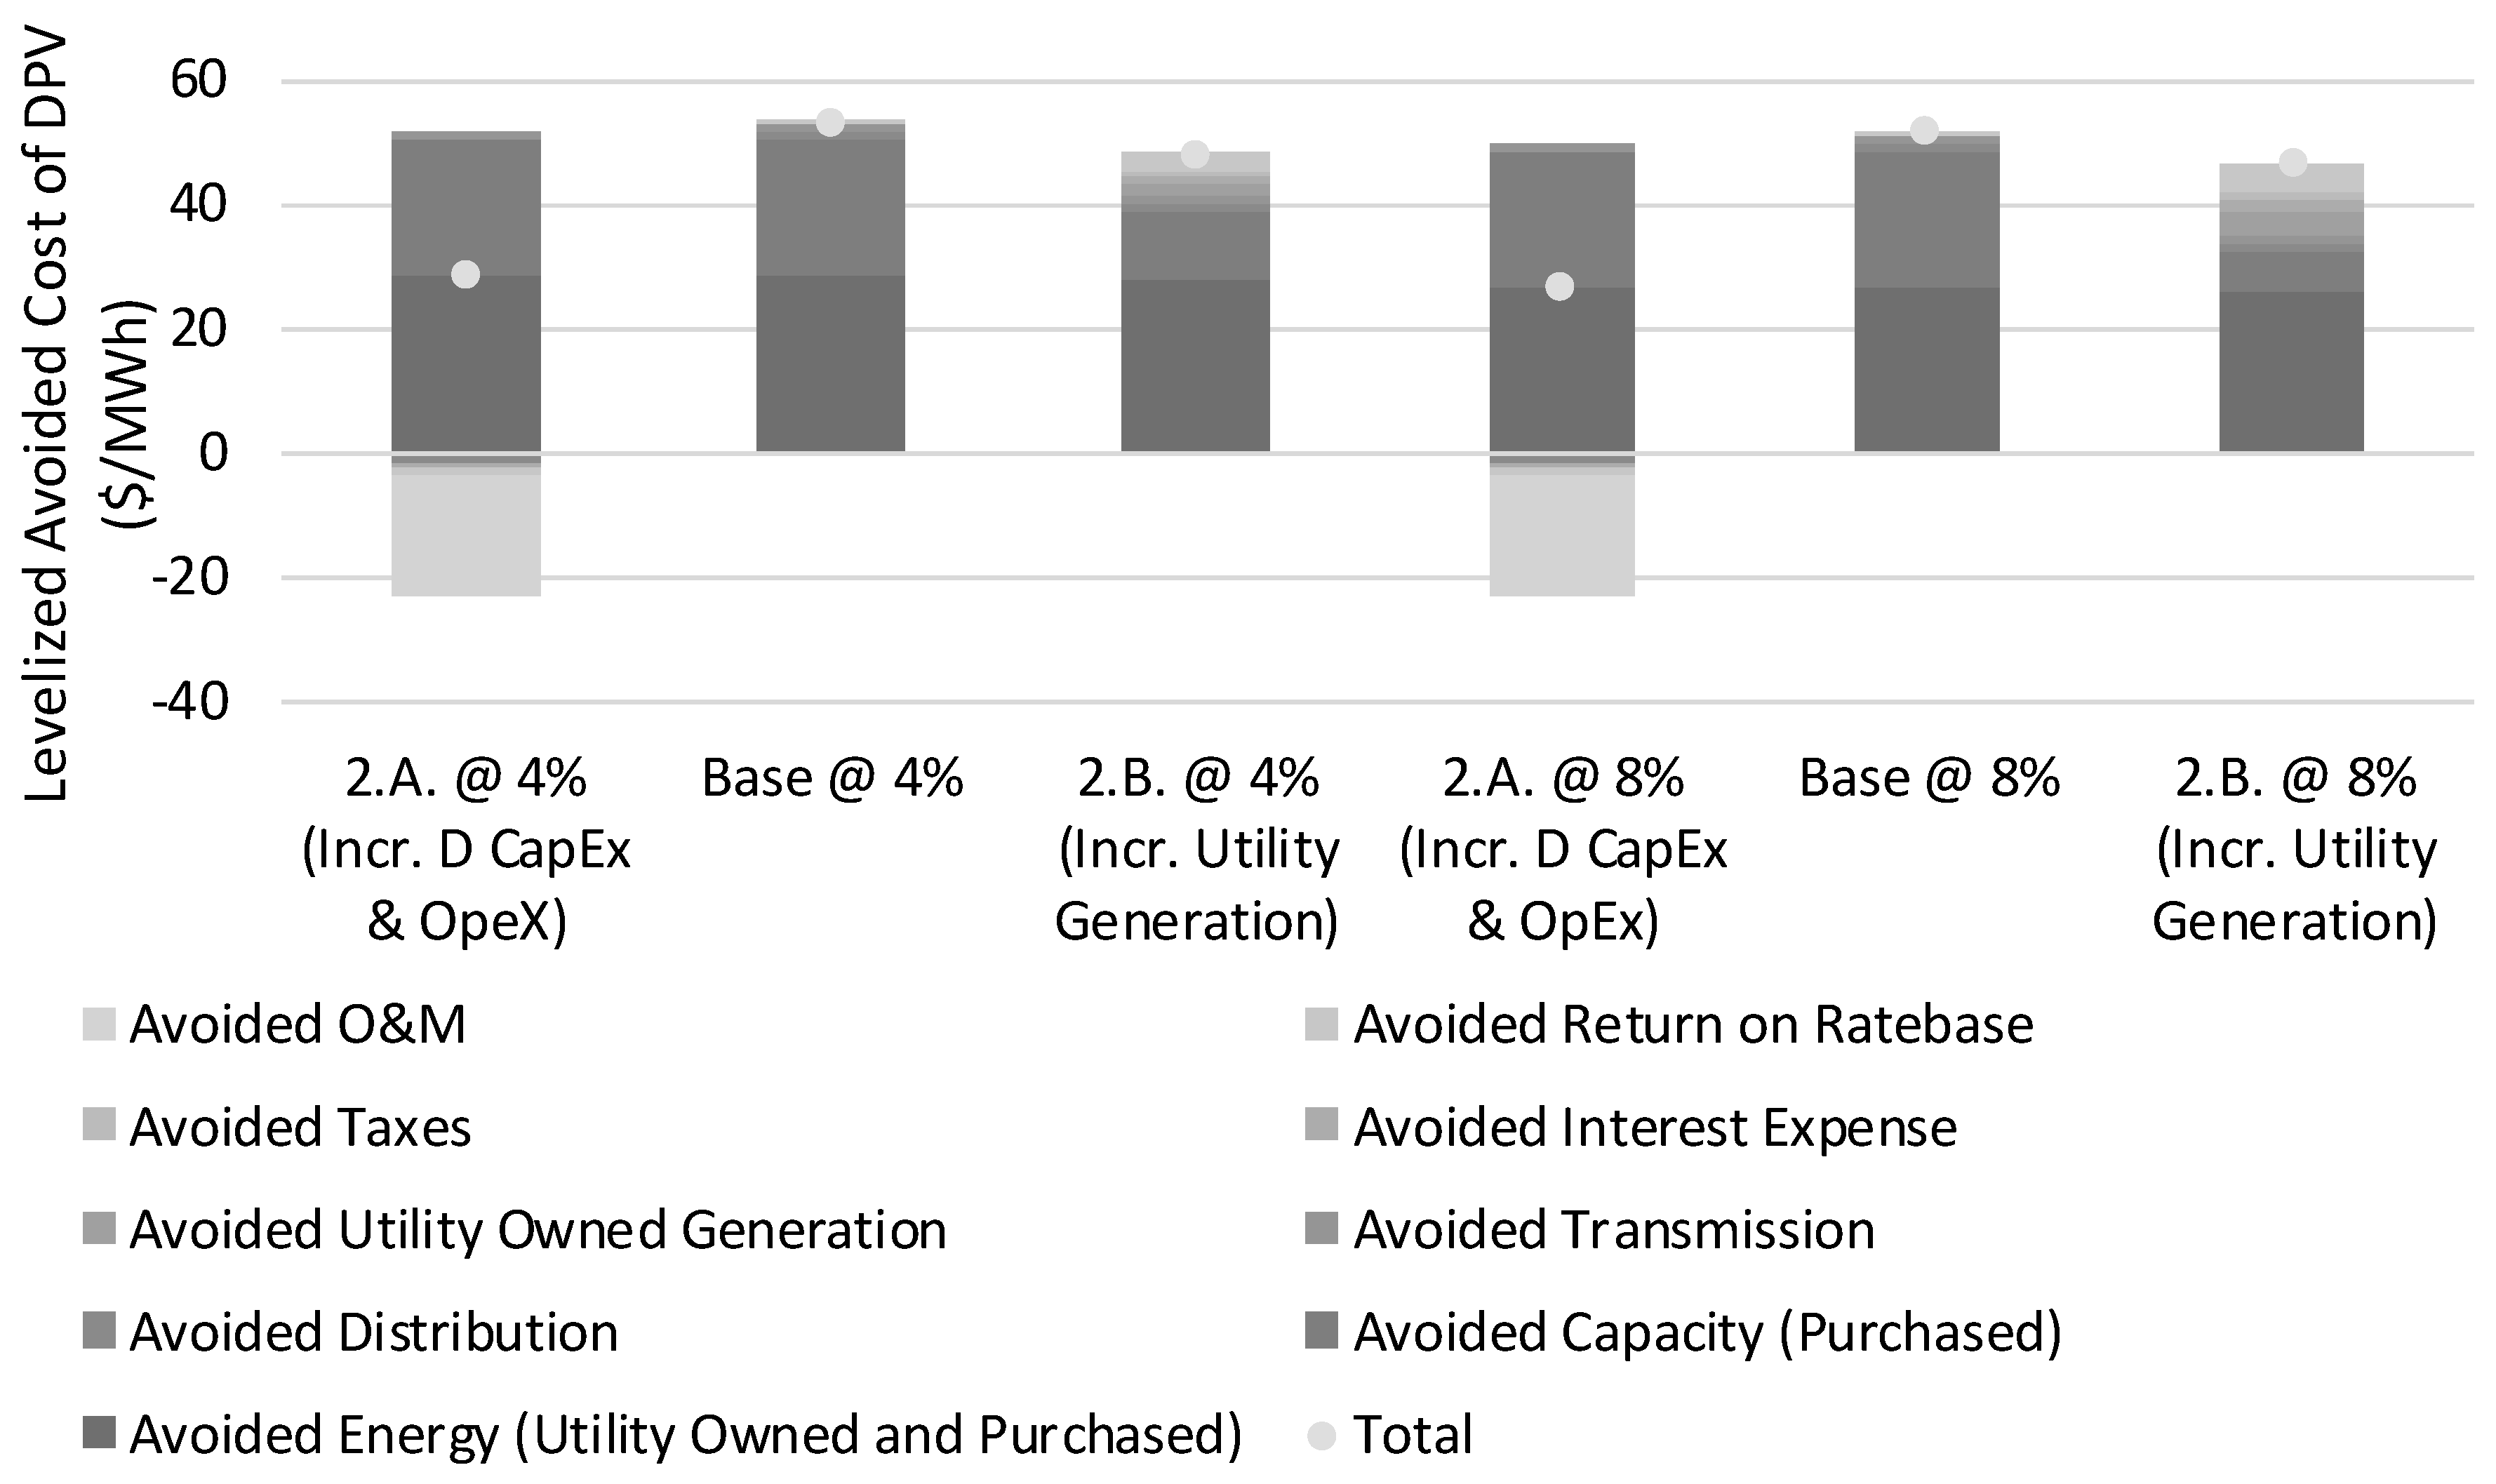
In our second sensitivity case, we change assumptions related to incremental CapEx. In one case, we increase distribution CapEx and O & M costs in conjunction with DPV to represent the possibility that integration costs for DPV could result in a net increase in distribution system expenditures (i.e., Sensitivity Case 2.A.). For the purposes of our study, system integration costs are borne by the utility (and all ratepayers via retail rates) and are different from interconnection costs that are paid by DPV owners. We assume incremental distribution O&M cost of
$15/kW-year installed DPV [
47] and incremental distribution CapEx of
$30/kW installed DPV [
48]. Alternatively, we add incremental utility generation to meet future capacity needs motivated by the fact that some Western utility DPV value studies assumed deferred generation (i.e., Sensitivity Case 2.B.). As discussed in
Section 2.1, the Base case utility characterization assumes the Western utility meets future capacity and energy through PPAs and short-term market purchases (as is consistent with the IRP data we used as the basis for our Western utility characterization). We base this sensitivity case on a simple loads and resources table and add mid-merit and natural gas generating plants in 100MW and 250MW increments to meet forecasted peak demand in the Base case without DPV. Capital and O & M costs of the incremental generation are based on EIA overnight capital cost estimates for generating plants and inflated at 2% per year.
In our third sensitivity case, we change the amount of DPV coincident with the Western utility’s annual peak demand (i.e., capacity contribution to peak). The Base case assumes a 22% DPV capacity contribution to peak (discussed in the next section). We bound this assumption with a lower value of 12% (i.e., Sensitivity Case 3.A.) and higher value of 32% (i.e., Sensitivity Case 3.B.). The DPV capacity contribution to peak drives the reduction in annual system peak demand upon which capacity and T & D CapEx costs are based. Thus, an increase in DPV capacity contribution to peak would result in greater avoided capacity-driven costs at the same DPV deployment level.
2.3. DPV Characterization
Our pro forma financial model derives the impacts of DPV through several key static and dynamic interrelationships. DPV impacts utility billing determinants; specifically retail sales and peak demand, which has an effect on utility costs and subsequently retail rates. DPV reduces volumetric sales based on a direct relationship between the assumed annual DPV penetration, expressed as a percentage of annual sales on a customer-class basis, and the utility’s class-level sales. The model derives reductions in the utility’s peak demand through dynamic relationships of several variables that take into account: (1) the specific timing of DPV relative to the utility’s hourly load, and (2) potential differences in alignment between when the DPV causes reductions in the utility’s load and the utility system annual peak demand.
The timing of DPV production (savings) and the utility annual peak demand is a key driver in the analysis. DPV reduces energy only in hours when the PV system operates (i.e., during the daylight hours) and may also reduce utility system demand depending on whether the reduction in energy is coincident with the utility’s system peak. Thus, the timing of DPV energy and demand savings in relation to customer class and utility peak demands (monthly and annual) drives projections of future costs, retail rates, and revenues collected on a volumetric basis through energy and demand charges.
To calculate the DPV shape, we relied on the National Renewable Energy Laboratory’s (NREL) System Advisor Model (SAM) [
49]. We simulated five solar profiles with typical meteorological year (TMY) weather data for different locations in Colorado’s main metropolitan areas (i.e., Boulder, Aurora, Denver, Colorado Springs, and Pueblo). These simulations relied on PV Watts default assumptions (i.e., azimuth of 180 degrees, DC to AC ratio of 1.2, and tilt of 40 degrees). To estimate a single input profile for our pro forma financial model, we applied a population-weighted average solar output of the five metro area’s solar shapes.
We further analyzed DPV’s capacity contribution to peak load reduction by simulating DPV profiles using 2017 weather data. While the TMY weather data described above provides an ideal average profile, it does not provide an understanding of DPV’s contribution to peak load reduction for our underlying load year of 2017. To determine this value, we simulated the additional solar profiles and sampled the capacity factor of our DPV simulation in the top-20 load hours of 2017 for Public Service of Colorado. The resulting capacity contribution to the top-20 load hours was 22%. DPV capacity factors are often calculated based on probabilistic simulation and modeling methods such as Effective Load Carrying Capability (ELCC), however, carrying out such a simulation is not the focus of this study; alternatively, we quantify DPV capacity contribution as the percentage of the nameplate capacity that is available during top-20 load hours; this factor provides a simple and intuitive measure of the value provided by DPV in terms of capacity and can be represented in our pro forma financial model. This value became our Base Case capacity contribution to peak load reduction for DPV. We performed this analysis for a number of other Western utilities and found that this capacity value in the top-20 load hours ranged from 7% to 26%, which we use to inform our sensitivity cases discussed above.
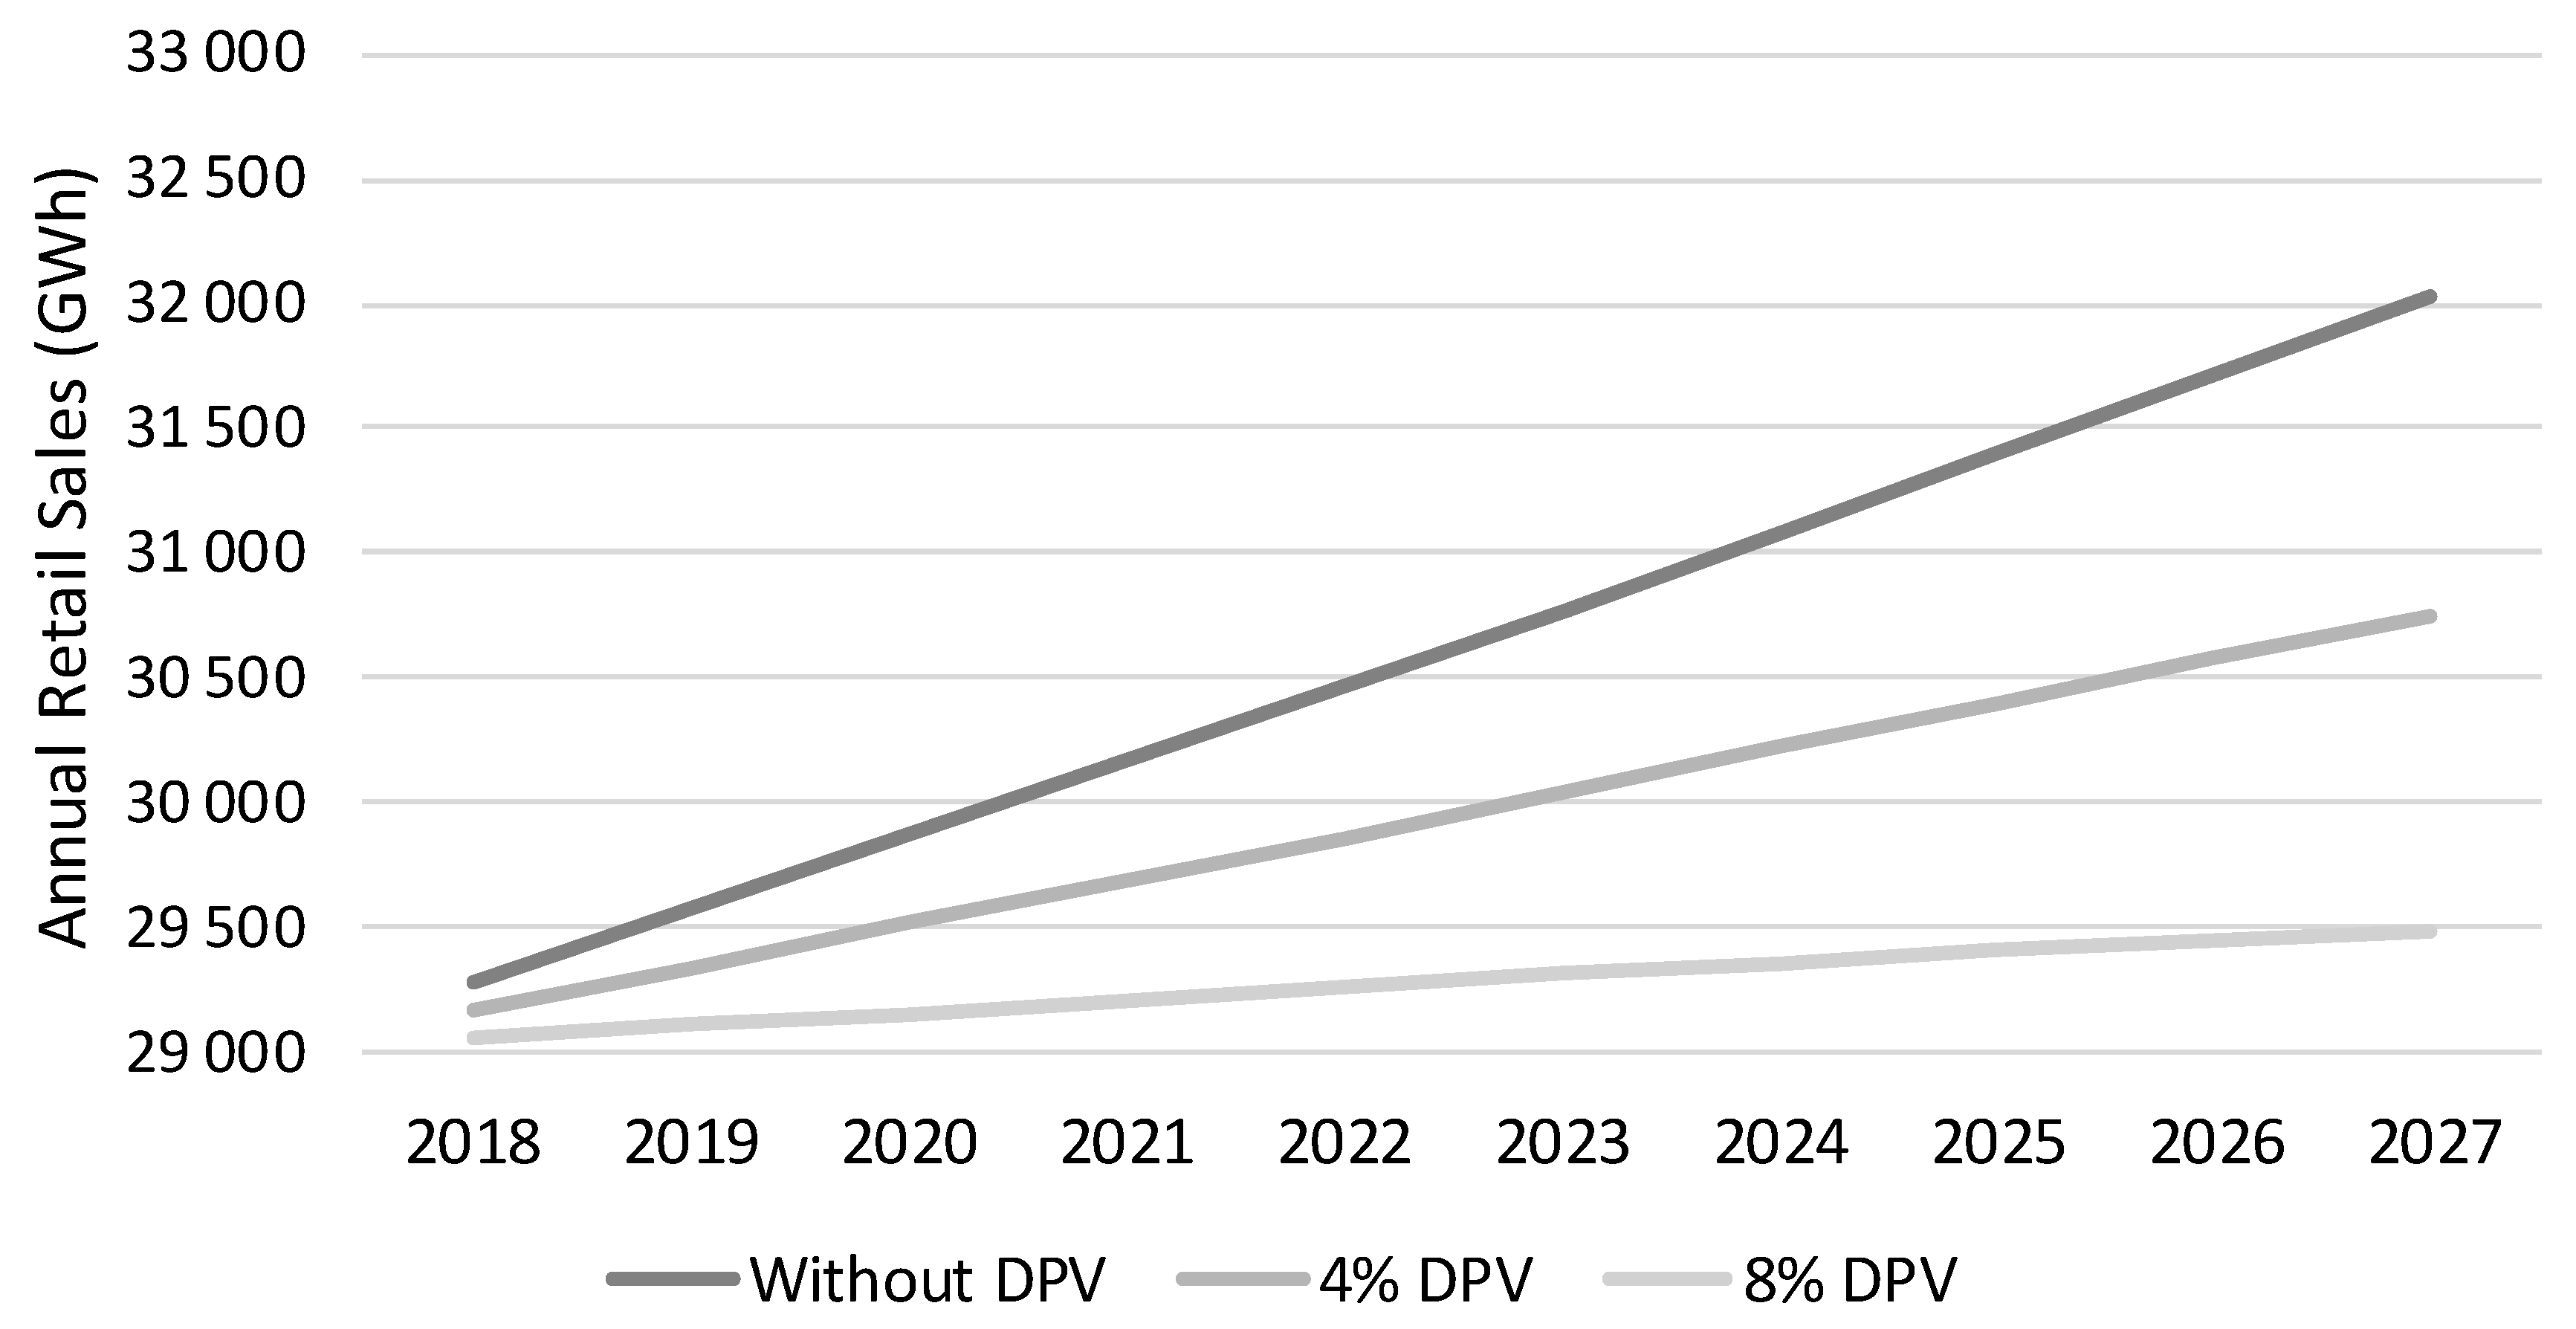
The DPV portfolios reduce the Western utility’s annual retail sales and peak demand. Retail sales grow by 1.0% per year in the case without PV, but the annual growth rate declines to 0.6%, and 0.2% in the 4% and 8% DPV deployment cases, respectively, from 2018 to 2027 as DPV systems are installed. Because the DPV penetration levels are specified in terms of a percent reduction of retail sales, they each reduce the Western utility’s sales on a one-for-one basis. As shown in
Figure 3, the reduction in retail sales increases as the DPV deployment level increases.
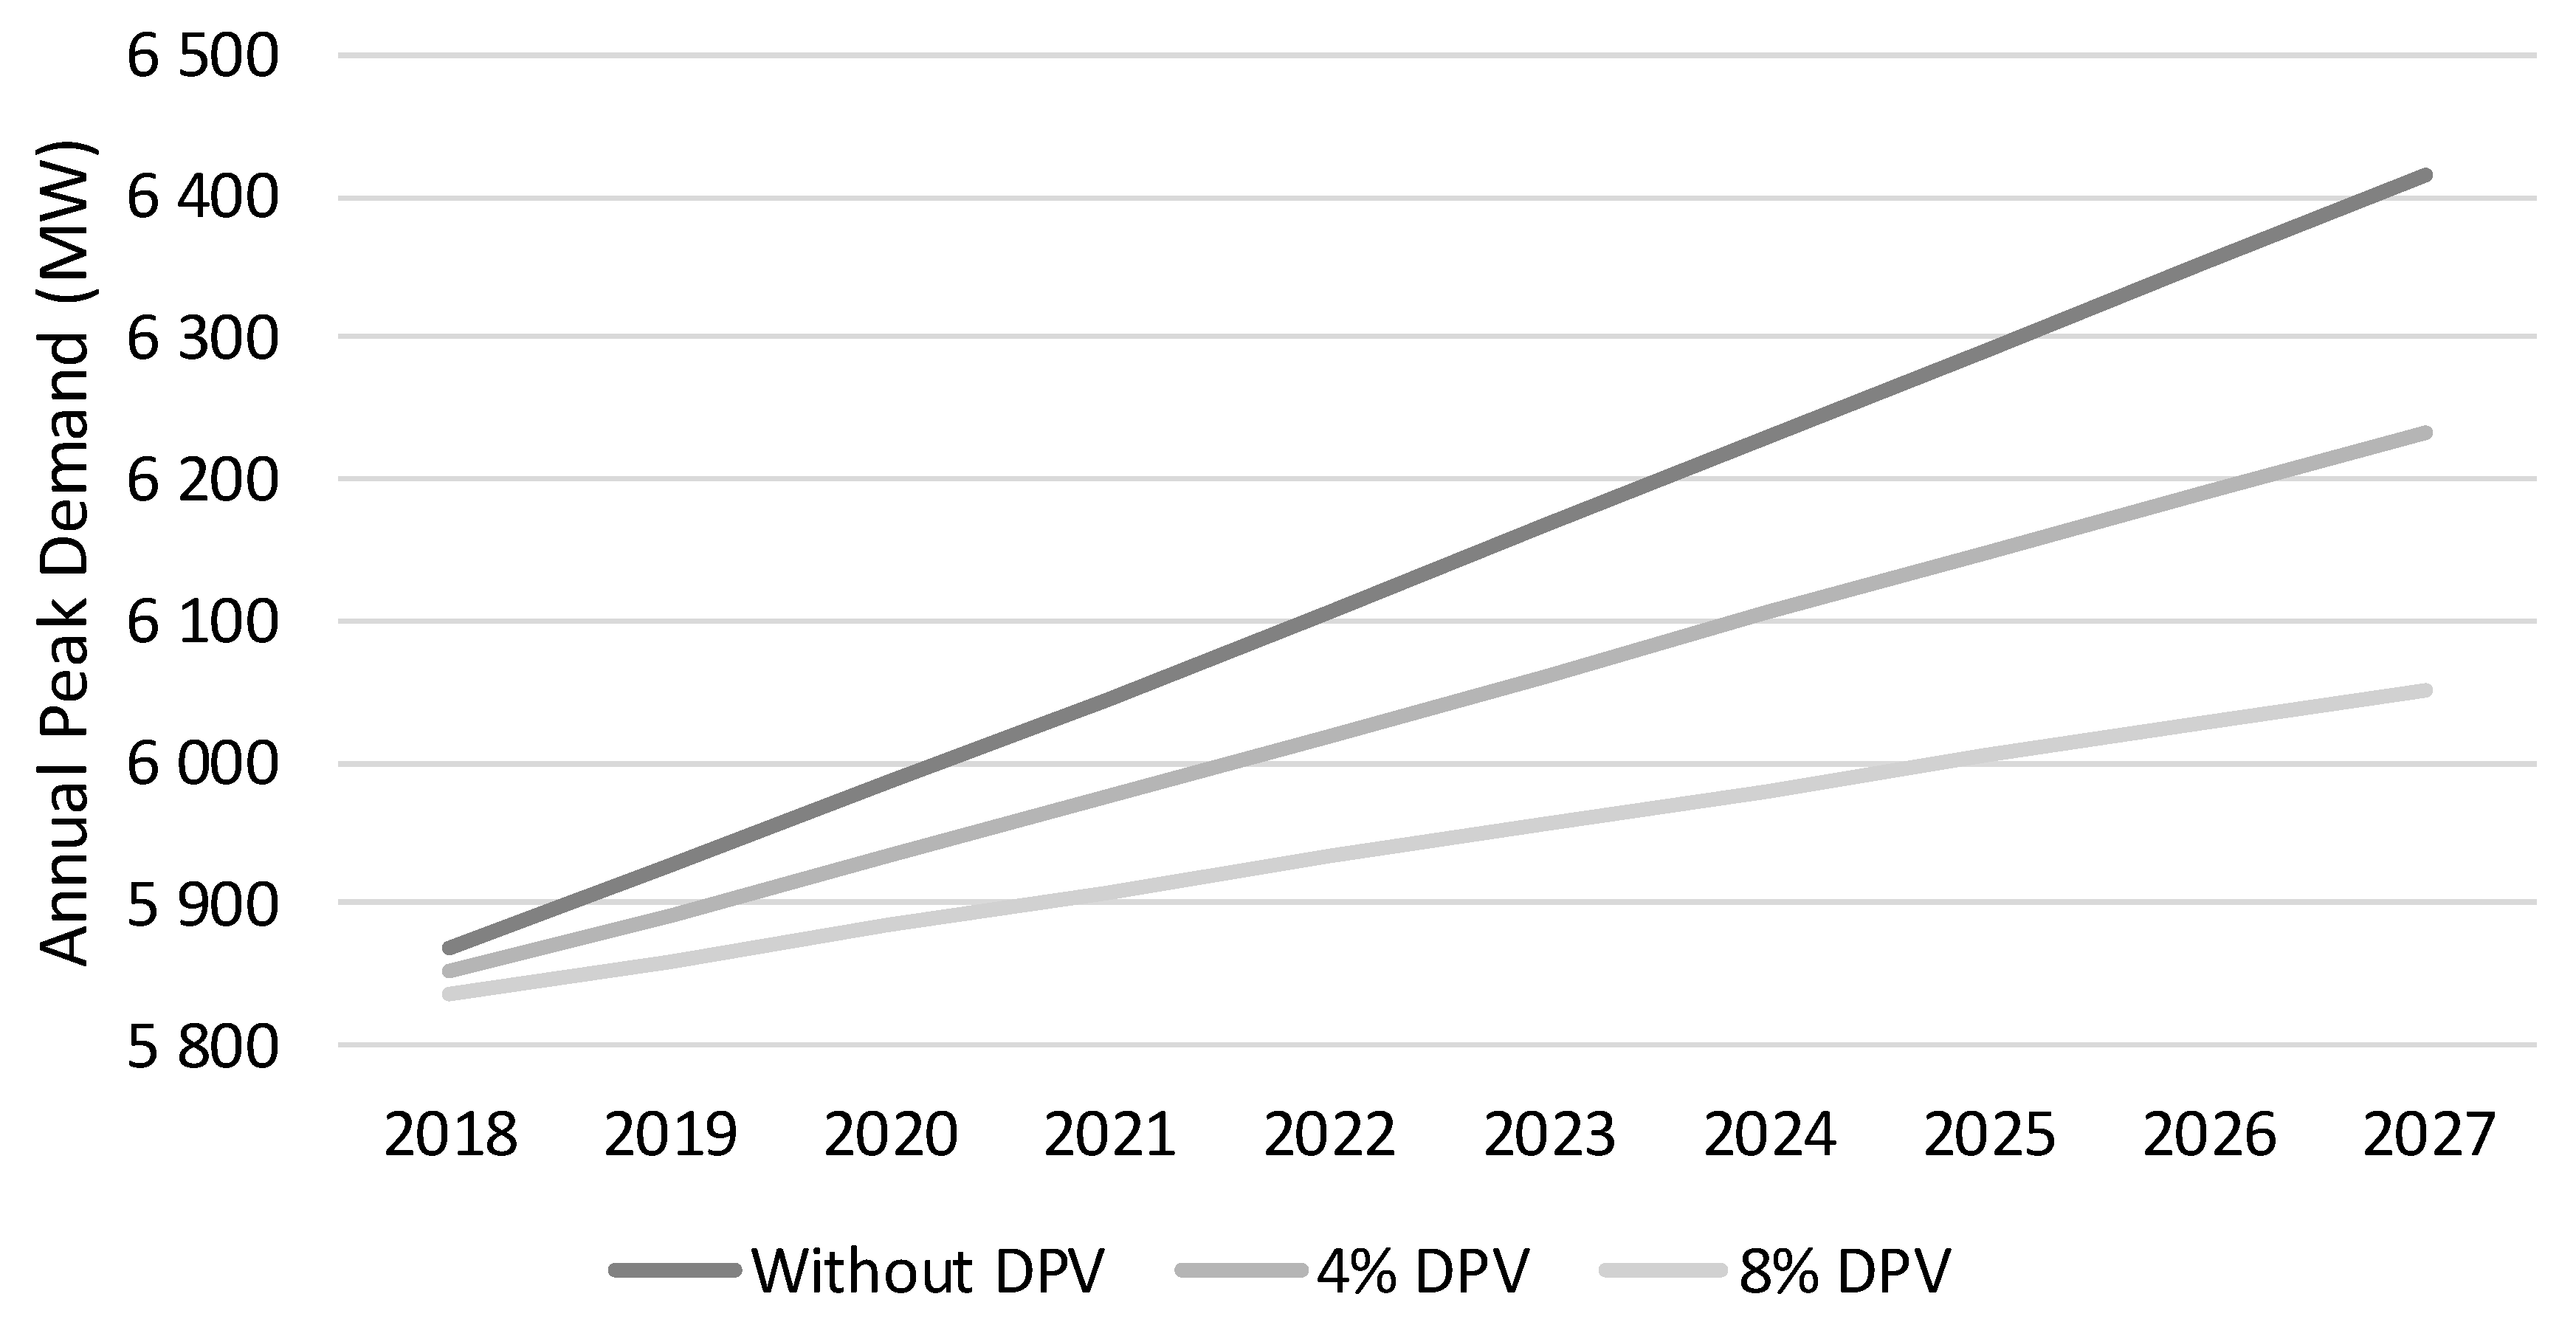
The impacts of DPV on the Western utility’s annual peak demand depends on the timing and coincidence of DPV relative to the utility’s annual peak demand.
Figure 4 shows the forecasted annual peak demand for the Western utility from 2018 to 2027 and the coincident peak demand savings attributable to the DPV deployment cases. The prototypical Western utility modeled in this study has peak loads that occur in July generally between 2 p.m. and 6 p.m. prior to the addition of DPV systems. The coincident peak demand impact of DPV in our study is less than the retail sales impacts on a percentage basis (e.g., 0.8% per year reduction in retail sales and 0.6% per year reduction in peak demand in the 8% DPV deployment case) because the timing of maximum PV output does not coincide perfectly with the utility’s annual peak demand. This is particularly the case for Public Service of Colorado that serves load near the Rocky Mountains, which results in lower DPV production in afternoon hours relative to other geographic locations due to the effect of mountain shadows [
50]. We consider lower and higher contribution of DPV savings to peak in the DPV value sensitivities.
4. Discussion and Conclusions
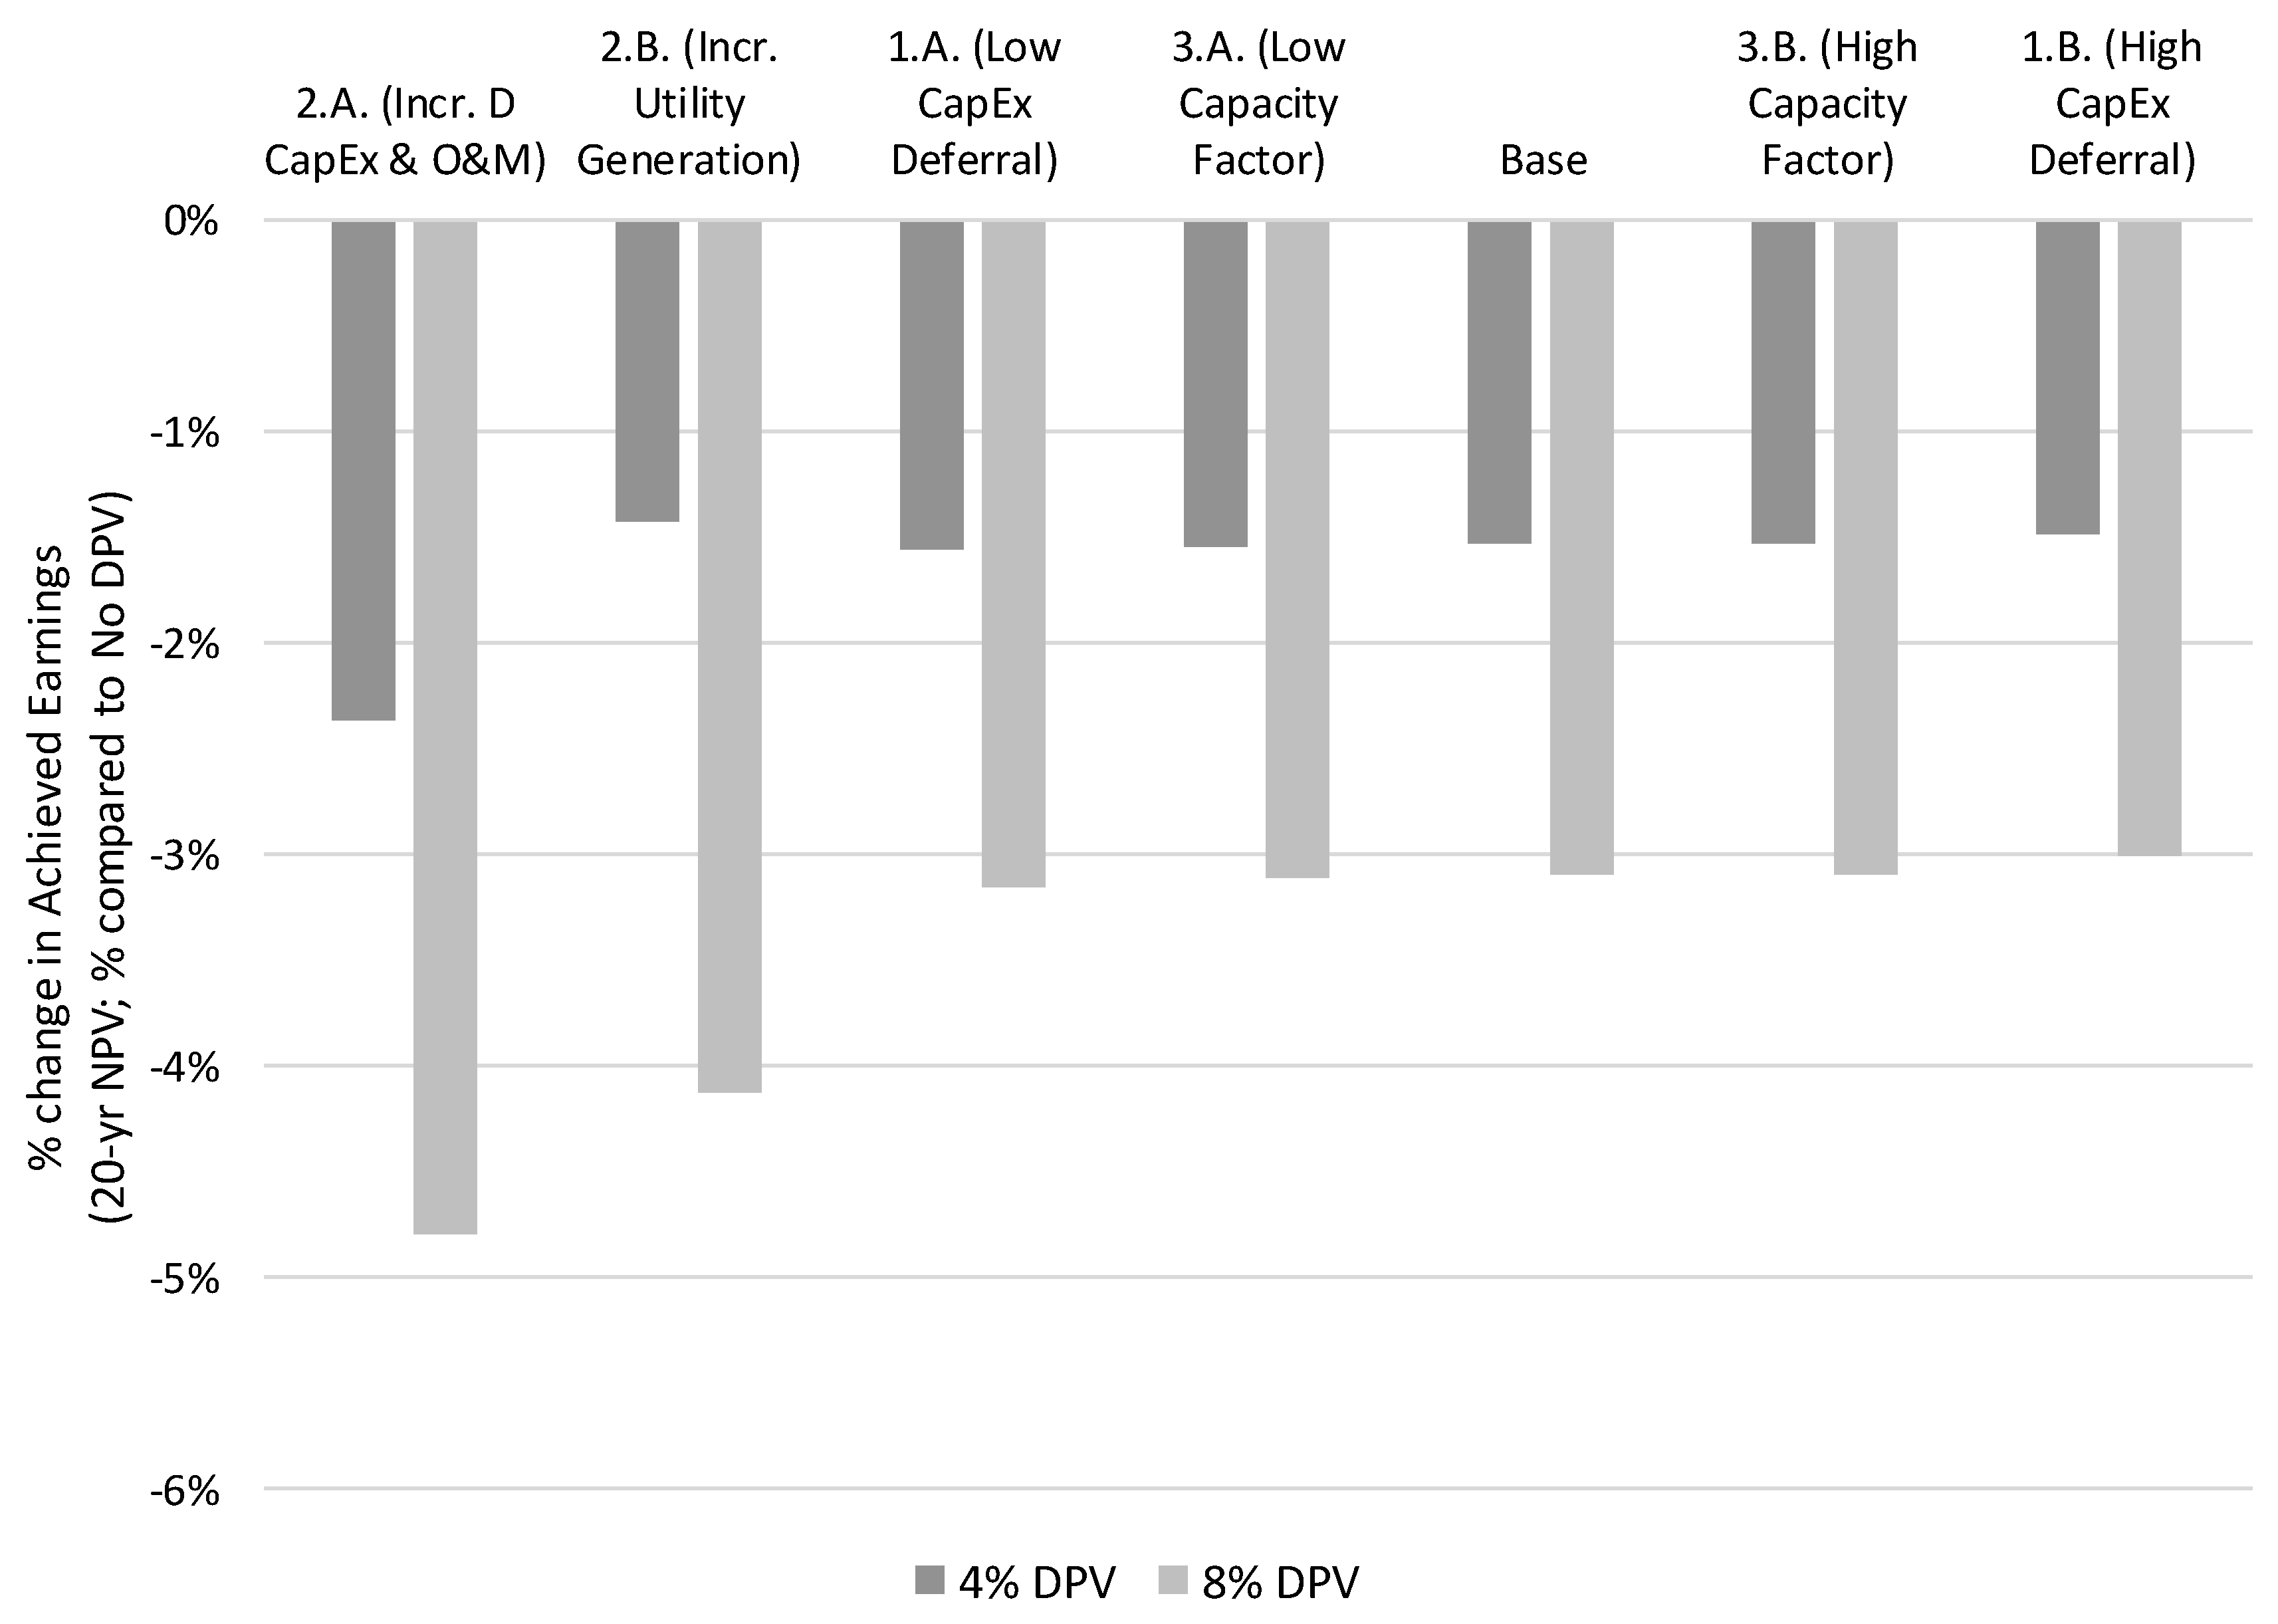
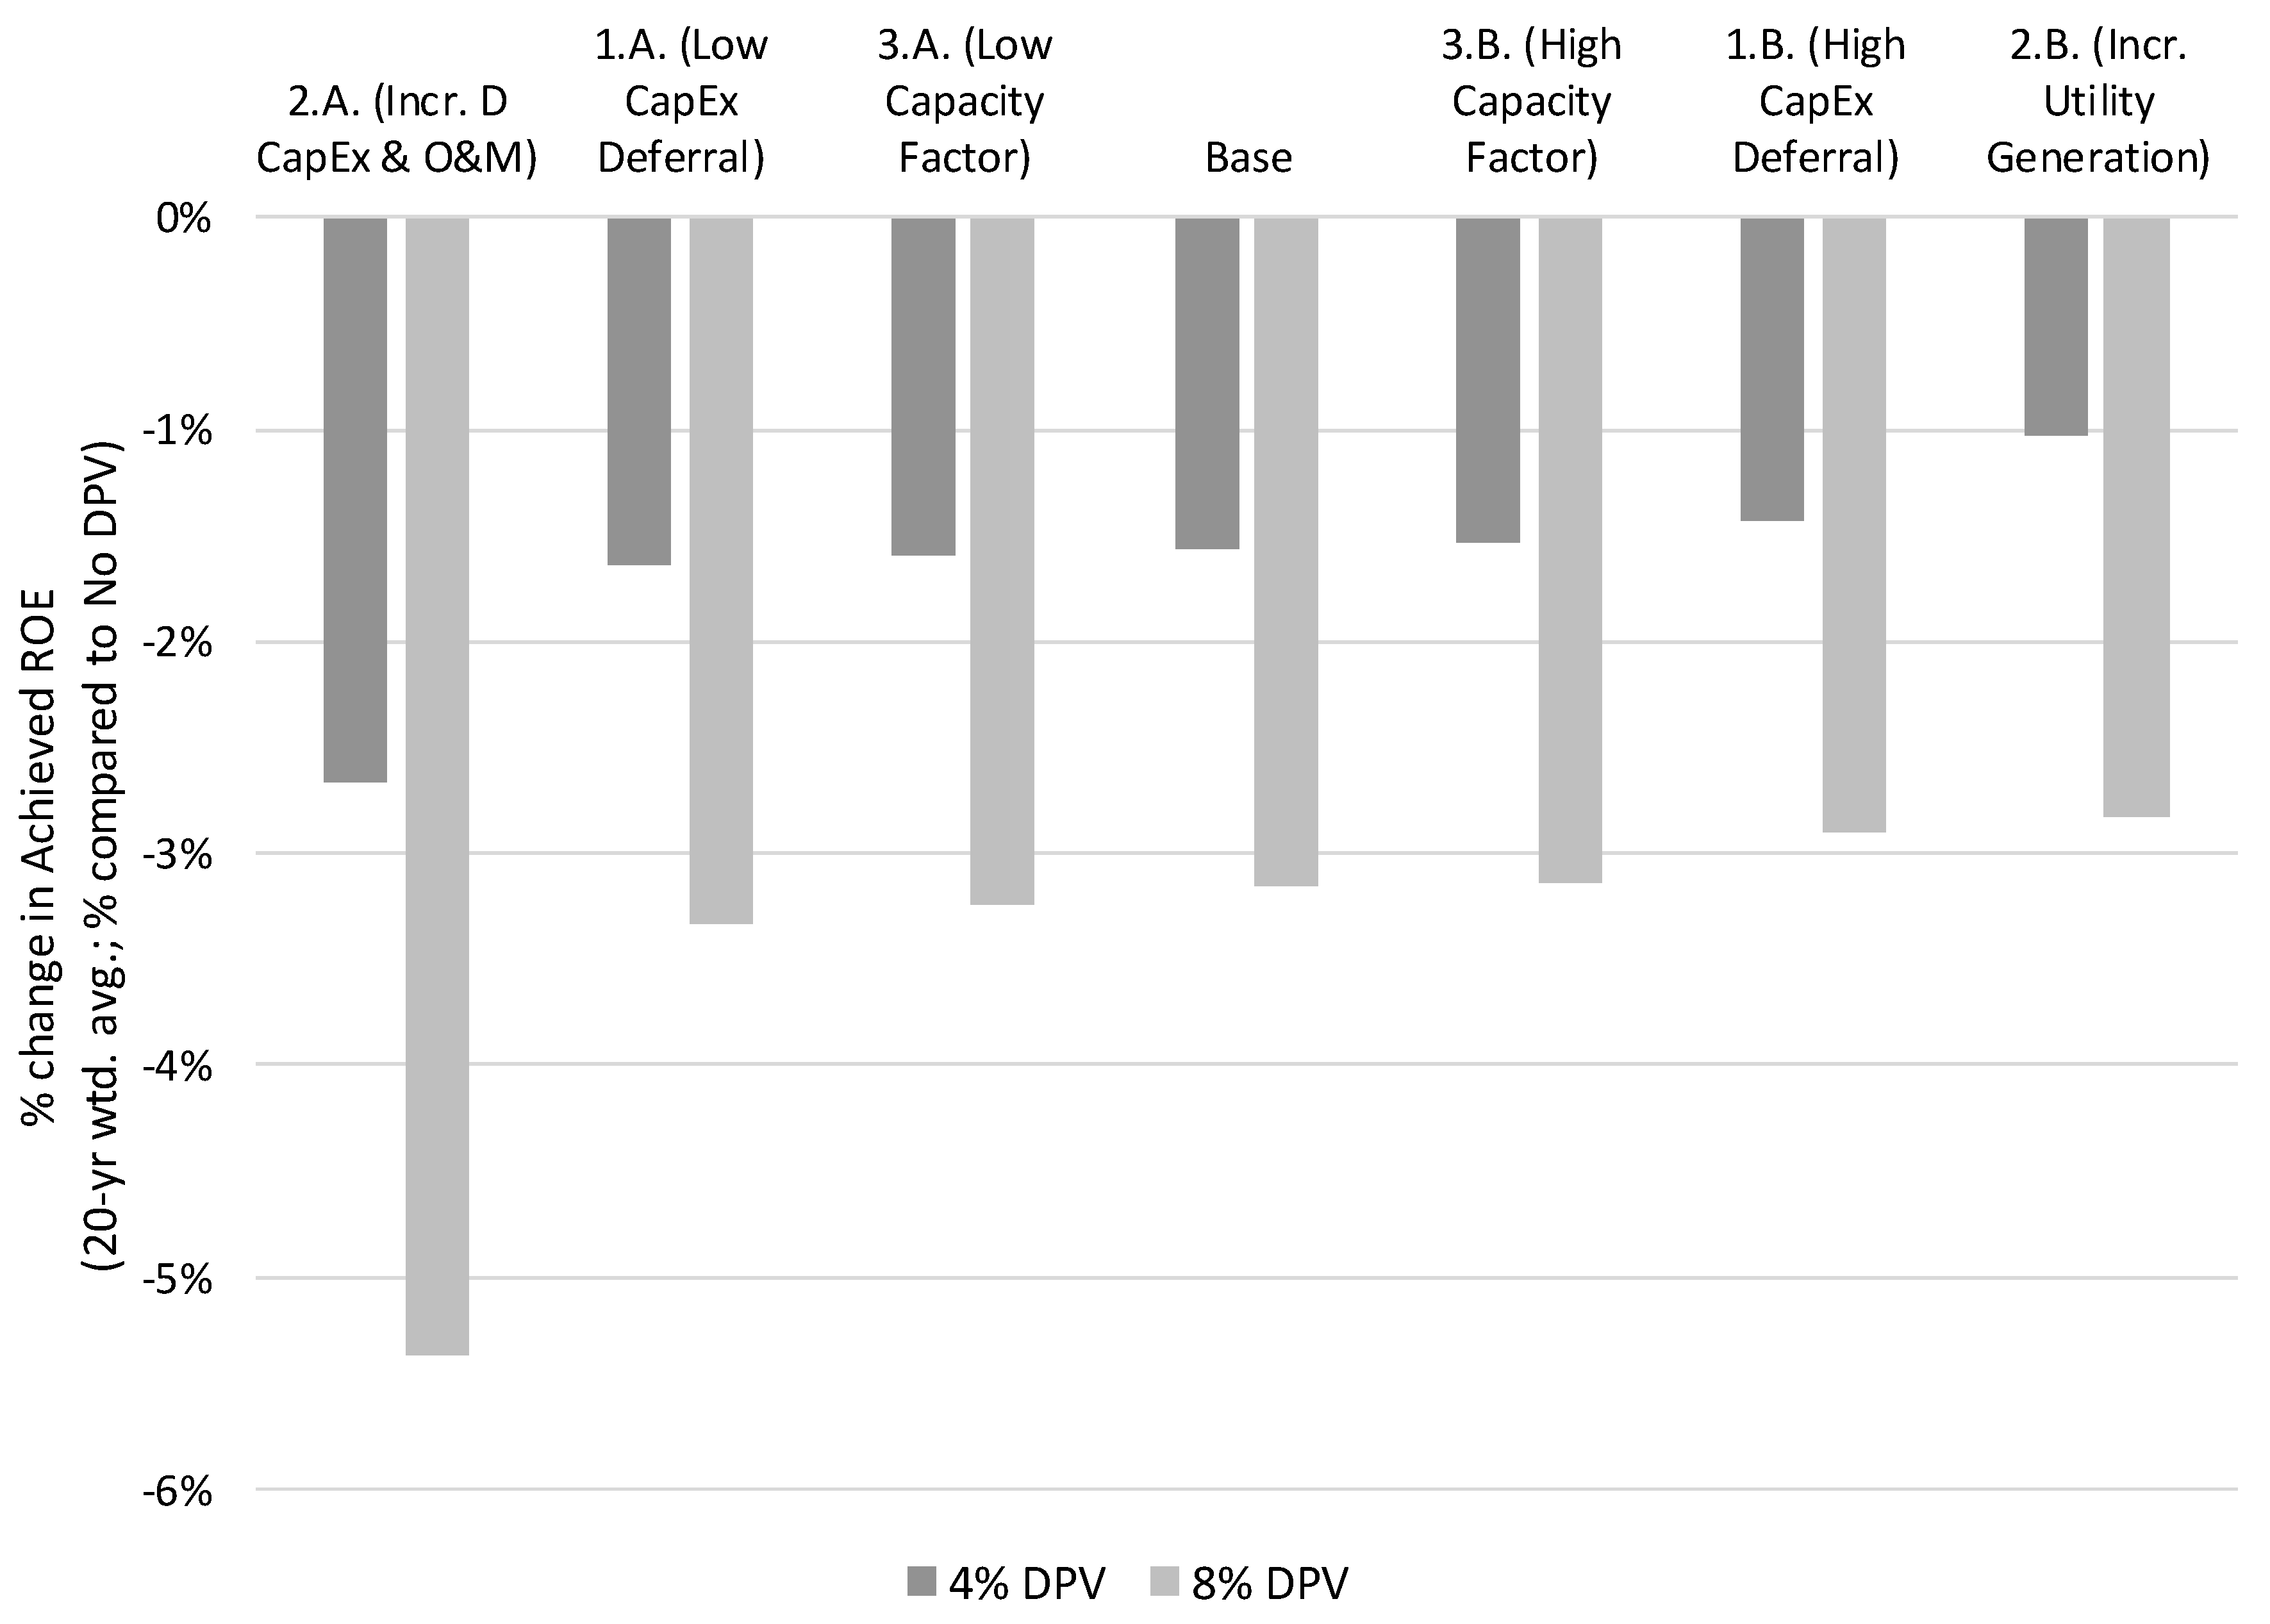
This analysis quantified the financial impacts of different levels of net-metered DPV deployment on a prototypical Western U.S. utility over 20 years and estimated changes in the utility’s costs, revenues, achieved shareholder earnings and ROE, average all-in retail rates, and customer bills. We also quantified the sensitivity of results to different assumptions about the ability of DPV to avoid, defer, or increase utility fixed and variable costs.
Our analysis shows that DPV does in fact reduce utility achieved earnings, which occurs through two separate means. First, if DPV reduces utility revenues more than utility costs (as is likely under rate structures that recover the majority of utility costs via volumetric energy charges), then net revenues or earnings are likewise reduced (i.e., the “revenue erosion effect”). Second, and separately, DPV savings may also diminish future earnings opportunities by reducing the rate of growth or deferring capital investments (T & D CapEx in our Base Case assumptions, specifically) that would otherwise contribute to the utility’s ratebase (i.e., the “lost earnings opportunity effect”). Although our analysis does illustrate that the financial impacts on shareholders increase as the level of DPV deployment increases, the magnitude is small even at high DPV penetration levels (e.g., 2 to 4% change in financial metrics at 8% DPV deployment).
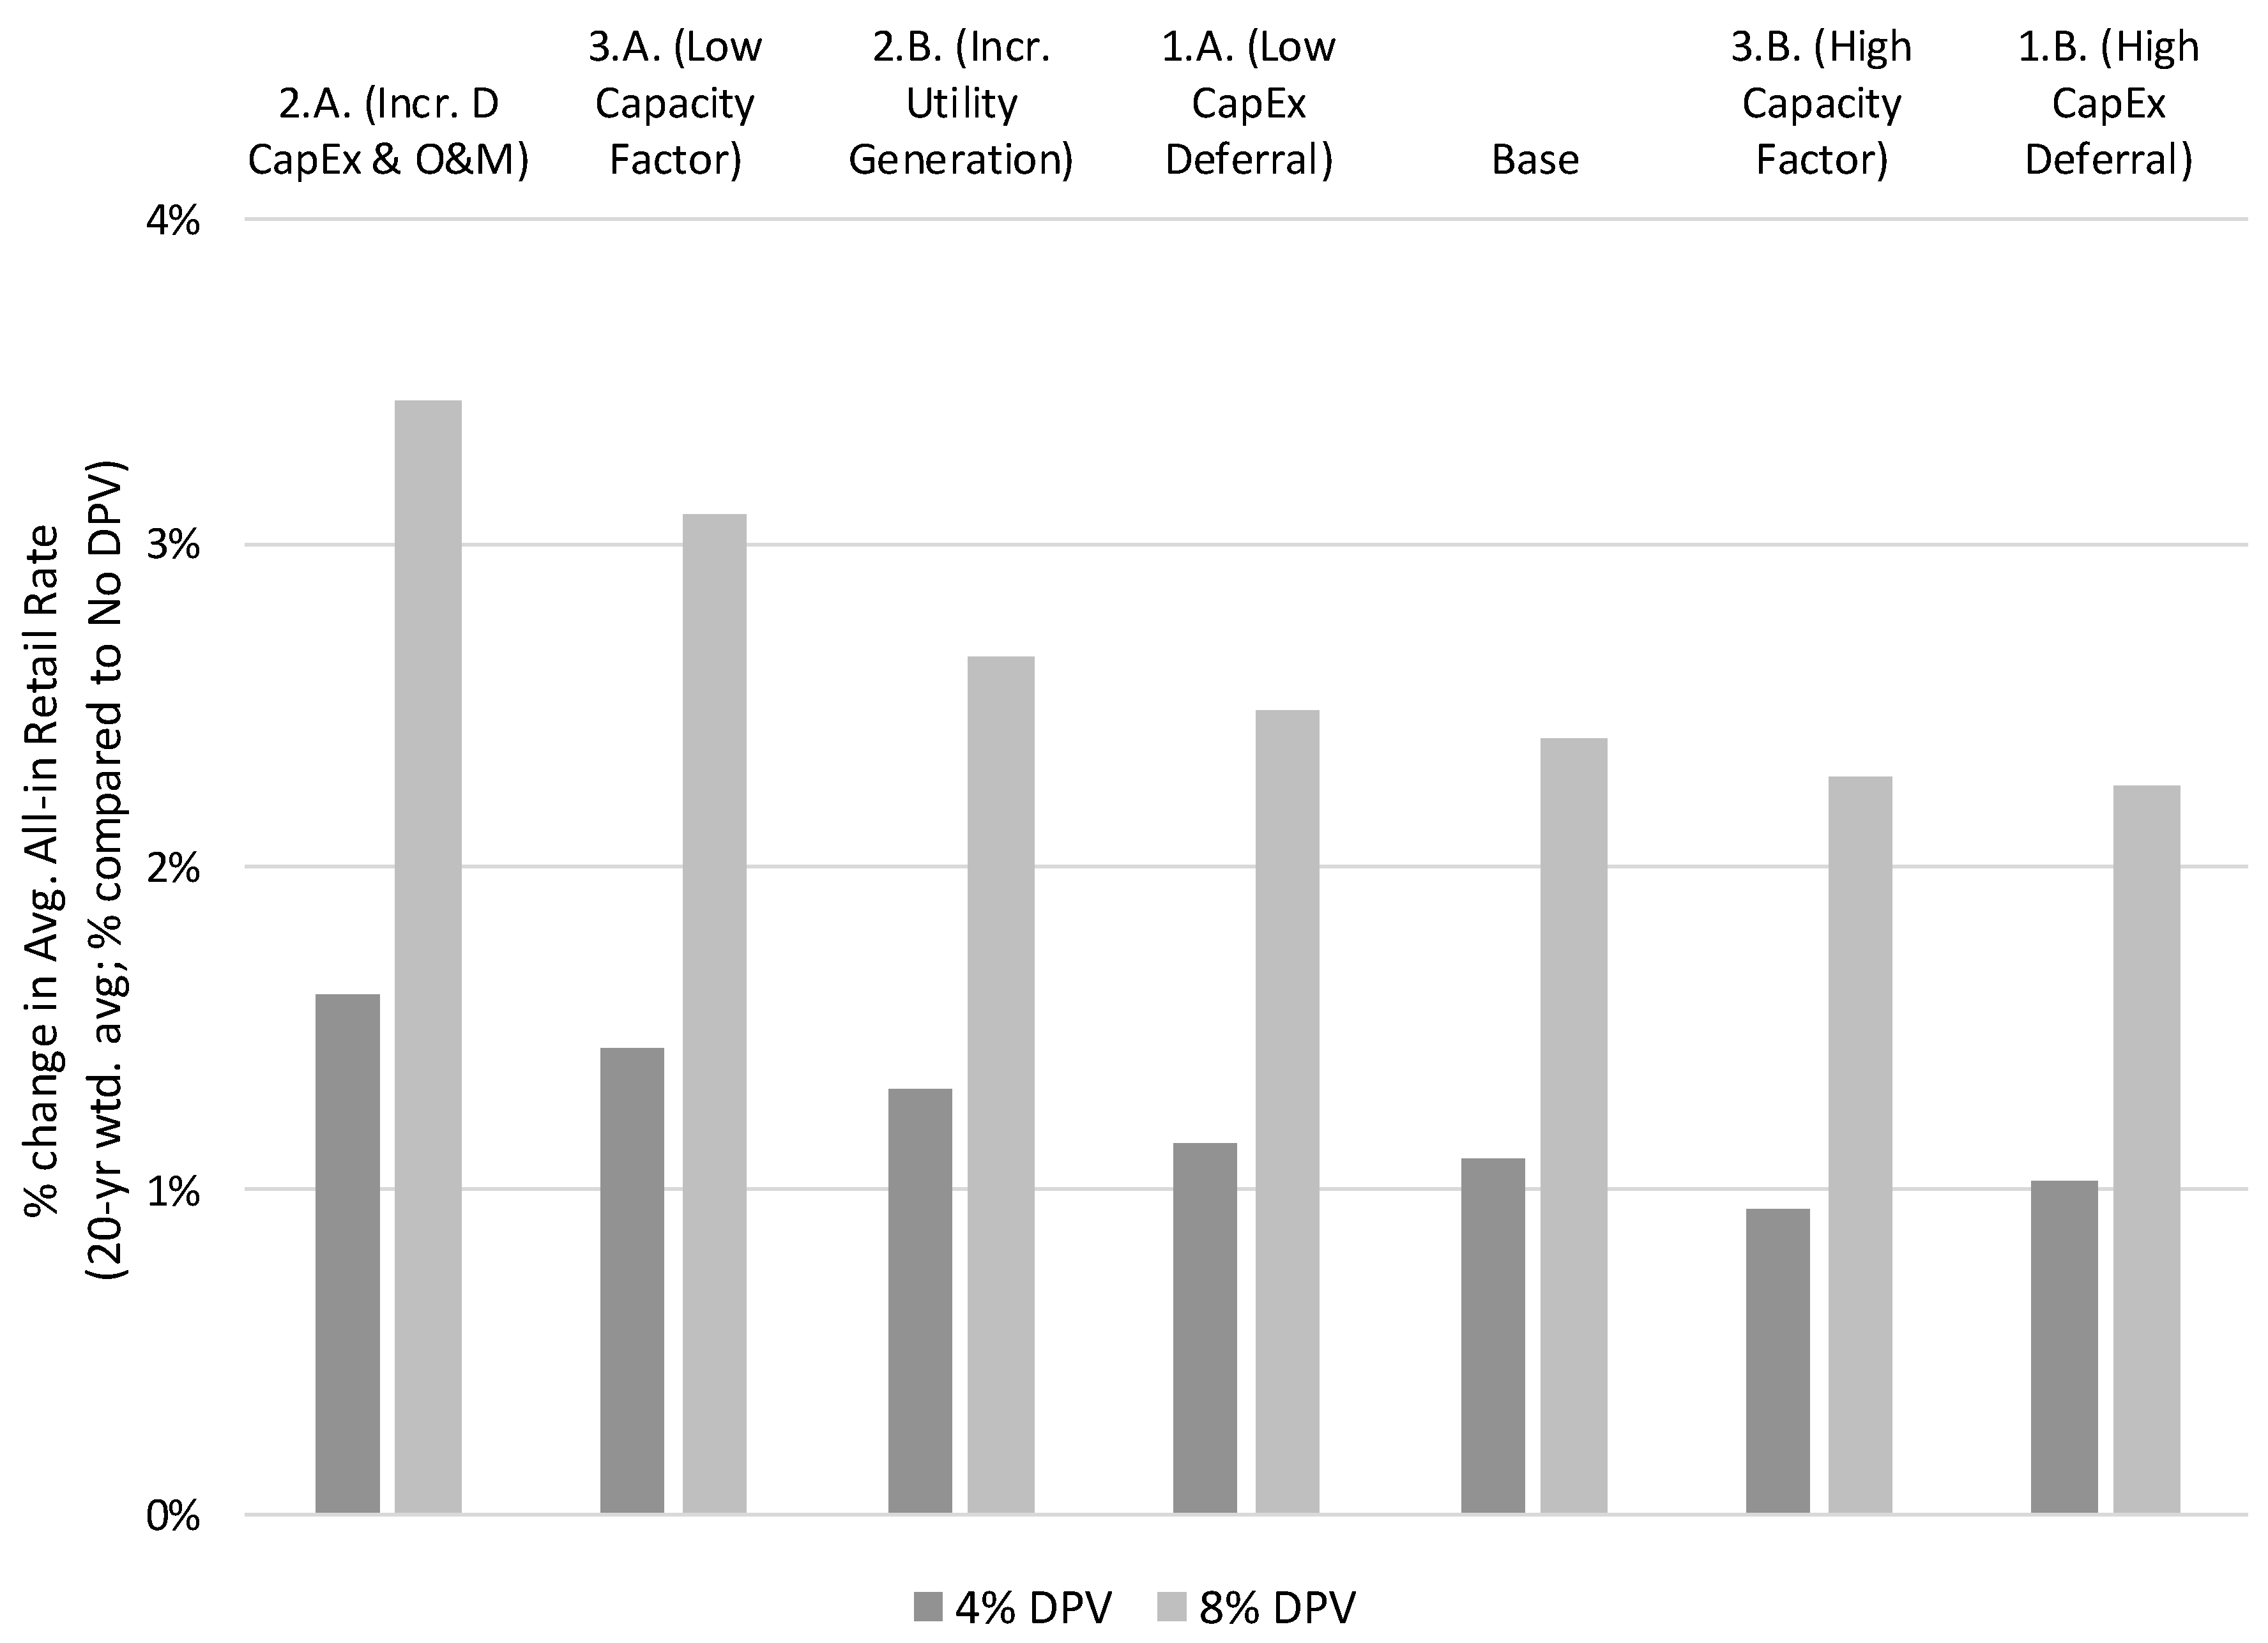
Our analysis also shows that net-metered DPV increases average all-in retail rates, which occurs in two, interrelated ways. First, DPV affects the retail rates set within each general rate case (GRC) through the net result of reductions in the test-year utility costs and billing determinants used to establish rates. DPV generally tends to reduce utility sales more than costs and, as a result, average retail rates established through each GRC increase with the addition of DPV in order to ensure the utility’s rates collect sufficient revenue to recover authorized costs. Second, DPV affects average all-in retail rates in the years between GRCs, though this effect is simply a mathematical artifact. Average all-in rates are, by definition, equal to total collected revenues divided by total retail sales in any given year. Retail sales (i.e., the denominator) are reduced due to the incremental DPV. Because of these lower volumetric energy billing determinants, the revenues (i.e., the numerator) collected on an annual basis will also be reduced. However, the reduction in revenues are necessarily smaller than the reduction in retail sales, given that some portion of revenues are derived from fixed customer charges (which are unaffected by DPV) and demand charges (which are only marginally affected by DPV). Thus, DPV tends to increase average all-in retail rates in between GRCs as well. As with shareholder metrics, our analysis illustrates that ratepayer financial impacts increase as the level of DPV deployment increases, but the magnitude is small even at 8% DPV penetration levels.
We know that utilities in the Western U.S. are varied, and exist within dramatically different operating environments, face substantially different cost structures, and provide service to vastly different customer bases. To better understand the likely impacts of DPV on utilities in the West, and potentially extend the application of the results more broadly to other utilities around the world, this study also explicitly links different estimates of DPV value to shareholder and ratepayer impacts. Our analysis finds that even rather dramatic changes in DPV value result in modest changes to shareholder and ratepayer impacts. Also, the range of financial impacts under alternative DPV value assumptions are greater for shareholders than ratepayers on a percentage basis and driven by differences in the amount of incremental CapEx that is deferred, as well as the amount of incremental distribution O&M that is incurred. The sensitivity cases reflect the key drivers of our results, but are not a complete list of all the sources of uncertainty and variation in modeled assumptions. There are other utility characteristics that might also change the magnitude and, in more extreme instances, the direction of impacts (e.g., higher or lower assumed load growth, higher or lower proportion of revenues from fixed charges, current or future test years). See [
46] for the results of a number of sensitivity cases beyond the value of DPV. To be sure, the shareholder and ratepayer impacts presume no change in the underlying regulatory model or ratemaking approaches. More fundamental changes in the way electric utilities price energy services and recover fixed and variable costs may suggest different impacts than reported herein (e.g., see [
51]). As such, our purpose here is not to bound the full range of impacts, but rather to illustrate some key themes and considerations related specifically to DPV value.
It is worth noting two particular feedback effects that our pro forma financial model does not account for in the present study and that would have potential implications for our results. First, we do not represent the feedback effects between retail rate impacts and DPV adoption rates. An increase in retail rates will improve the economics of DPV investment to customers (i.e., lower payback time for PV system) which, all else being equal, would be expected to drive greater PV adoption and thus lead to increased reductions in the utility’s future load. Though these effects have been found to be small [
52]. Darghouth et al. [
52] also addressed a separate feedback mechanism between increasing PV penetration and the timing of time-of-use (TOU) periods; their analysis found that greater PV penetration causes TOU peak periods to shift into the evening hours, which in turn dampens further adoption. Second, we do not represent the feedback effects of changes in retail rate designs or NEM alternatives on overall customer energy consumption (e.g., fixed customer charge may reduce financial incentive to invest in energy efficiency or net billing may encourage DPV system design to maximize exports), all else being equal. Instead, we construct an annual load and PV penetration forecast which is adhered to regardless of these factors. Incorporating such changes into the model will be pursued as a future research effort.
Most Western U.S. utilities, with the exception of some of those in California, currently have distributed generation deployments equivalent to less than 1% of annual retail sales. It will take them several years to see the kinds of impacts depicted in this analysis, at even the 4% penetration level, let alone the 8% level. Accordingly, policymakers and regulators likely have time to study and deliberate changes to NEM, as well as other policy and regulatory actions, before observing material financial impacts. While many of the impacts appear relatively small (on a percentage basis), they demonstrate how underlying ratemaking and regulatory mechanisms can change utility support for or customer interest in DERs, and the magnitude of impacts depends critically on utility physical, financial, and operating characteristics.


