Article

Reliability Evaluation of Micro-grids Containing PV System and Hydropower Plant

Department of Electrical Engineering, Hanyang University, Seoul 04763, Korea
*
Author to whom correspondence should be addressed.
Energies 2019, 12(3), 343; https://doi.org/10.3390/en12030343
Submission received: 24 December 2018 / Revised: 17 January 2019 / Accepted: 18 January 2019 / Published: 22 January 2019
(This article belongs to the Section F: Electrical Engineering)

Abstract

:
This paper presents the reliability evaluation for a microgrid composed of conventional generators (CGs), a photovoltaic (PV) system, and a small hydropower plant (HPP). The PV system has an intermittent output and the HPP output is limited depending on several constraints. Therefore, their reliability evaluation should be performed according to the CGs. This paper proposes a methodology to evaluate the reliability of the microgrid based on Monte Carlo simulations. To this end, a simple operational strategy for the HPP and reliability models for each component of the grid are introduced. By the operational strategy consisting of two stages, the HPP would be operated to generate power whenever water stored in the reservoir exceeds a certain threshold (called volume reference) or to discharge extra water when it is beyond the maximum volume of the reservoir. To demonstrate the proposed methodology, a case study is performed according to various volume references, and the results are obtained in terms of several reliability indices. Further, the appropriate volume reference is determined considering a trade-off relationship between the reliability and economics aspects.

1. Introduction

Policies such as the renewable portfolio standard (RPS), fixed-in tariffs (FITs), and renewable power source use obligations have been globally promoting the penetration of renewable energy sources (RES), such as wind power, photovoltaic (PV), solar power, and small hydro, into the power grid. In particular, wind power and PV have become increasingly popular. However, the increasing utilization of RES has also resulted in a new challenge for conventional power systems. For a large-scale PV system, a wide installation site should be ensured, however, this is difficult to achieve. Hence, the floating PV system, which is installed on the surface of water [1], is being tested in Korea. It can be a good alternative to solve the problem of securing the site by installing a PV system on a reservoir, for example [2,3]. Furthermore, the floating PV system can produce more power by decreasing the PV temperature and can improve the quality of water by algae reduction [4].
Such a floating PV system would be able to configure a microgrid together with nearby conventional generators (CGs) and a small hydropower plant (HPP) [5]. Therefore, this paper deals with a microgrid that consists of CGs, a (floating) PV system and a HPP. Because the PV system has an intermittent output depending on the weather condition and the HPP output is limited depending on the size of its reservoir, the amount of water entering into the reservoir, and the operational strategy [6] are critical; therefore, the grid containing such type of generation should be operated more reliably. Because of their output characteristic, their reliability evaluation would be performed differently than with the CGs [7,8]. This paper proposes a methodology for the reliability evaluation based on the Monte Carlo simulation (MCS) method [9]. Hence, a simple operational strategy for the HPP and reliability models for each component of the grid, are introduced. By the operational strategy that consists of two stages, the HPP would be operated to generate power whenever water stored in the reservoir exceeds a certain threshold (called volume reference, Vref) or to discharge extra water when it is beyond the maximum volume of the reservoir. At the first stage, the HPP is primarily operated to produce power, while at the second stage it acts as a reserve for contingency situations. That is, when faults at any CGs or PV system occur, the HPP produces the available additional power depending on the remaining water in the reservoir as well as the power output pre-determined at the first stage.
To demonstrate the proposed methodology, a case study is performed according to various values of Vref, and the results of the evaluation are obtained in terms of reliability indices such as loss of load probability (LOLP), loss of energy expectation (LOEE) [10], and effective load carrying capability (ELCC) [10]. Further, the appropriate Vref is determined considering a trade-off relationship between the reliability and economics aspects.

2. Reliability Models for Each Generation Type

To evaluate the reliability of a microgrid, the models for each generation type, i.e., the CGs, PV system, and HPP, are defined as follows:

2.1. Conventional Generator Model

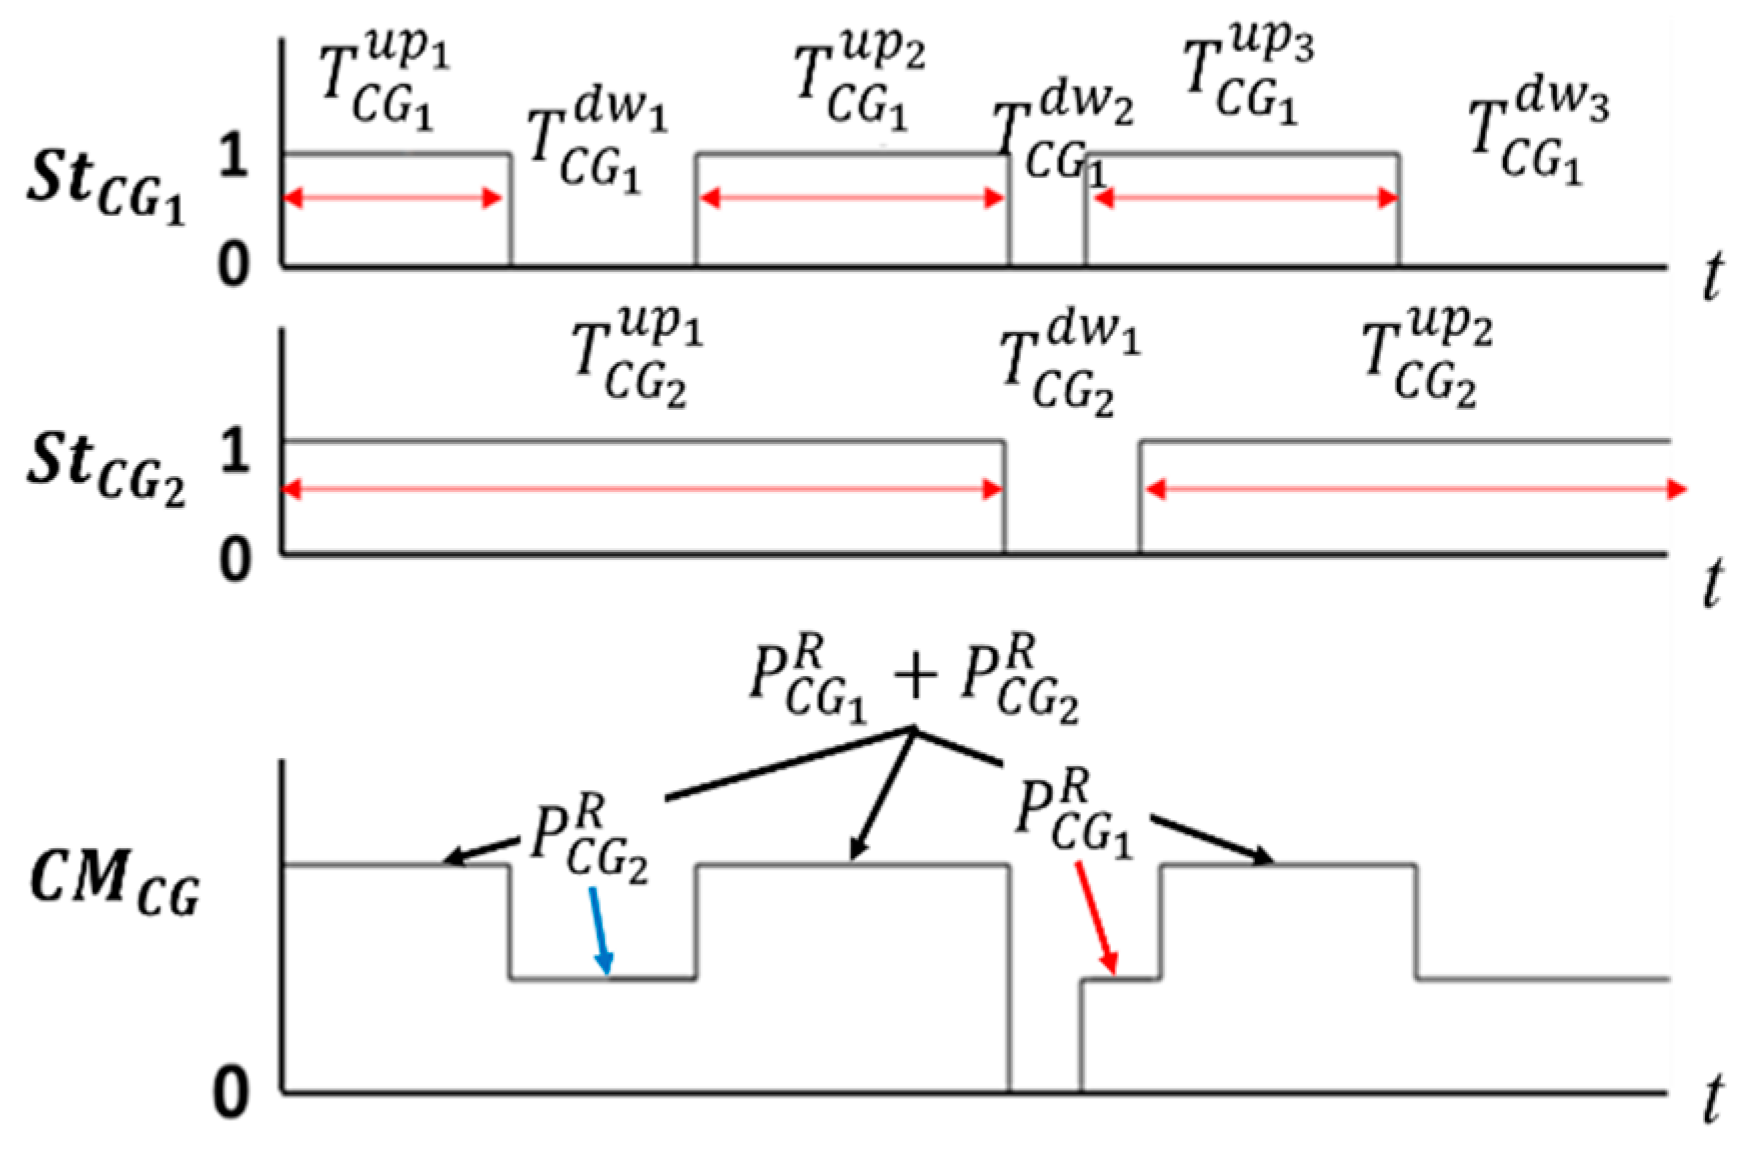
The reliability model for CGs is defined based on the two-state model shown in Figure 1. Each period during which a CG remains in the up or down state (normal or fault condition) can be expressed by Equations (1) and (2), respectively. By sequentially repeating the application of the two equations, a scenario of the chronological operational state for the entire period can be obtained, as shown in Figure 2a [9].
T C G i u p j = 1 λ C G i ln U i j
T C G i d w j = 1 μ C G i ln U i j
where T C G i u p j and T C G i d w j are respectively the periods of the up and down states of the i-th CG generated at the j-th iteration. λ C G i and μ C G i are the failure and repair rates, respectively. U i j and U j j are the uniformly distributed random number over the interval (0, 1).
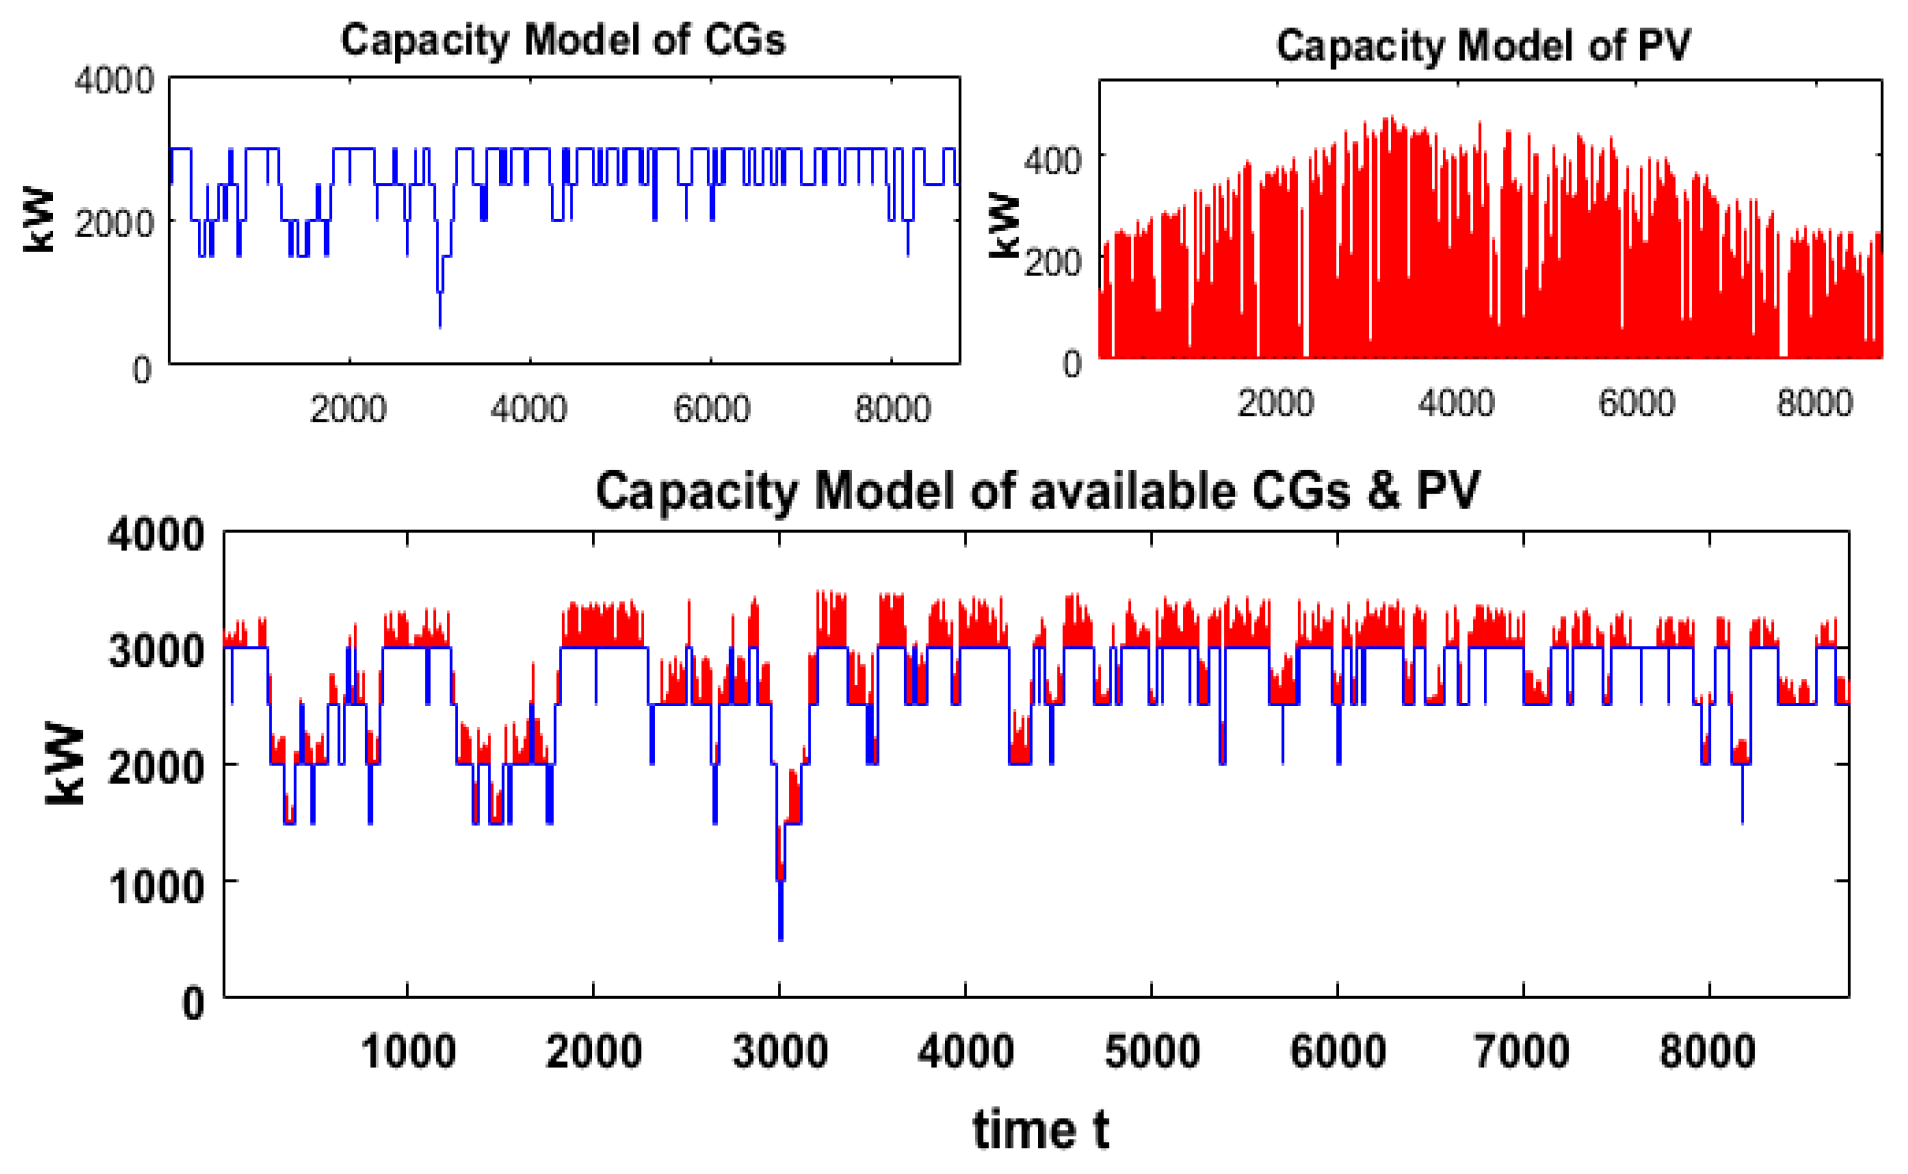
After obtaining the scenarios of the chronological operational state for all CGs, its capacity model can be obtained as shown in Figure 2. Because its rated power becomes unavailable when any CG is faulted, the whole capacity model of all CGs according to the chronological state scenario can be expressed in terms of the rated power, as Equation (3):
C M C G ( t ) = i = 1 N C G S t C G i ( t ) P C G i R
where S t C G and C M C G are the operational state and capacity model of the CG, respectively. P C G R and N C G are the rated power and the number of CGs, respectively.

2.2. PV Generation Model

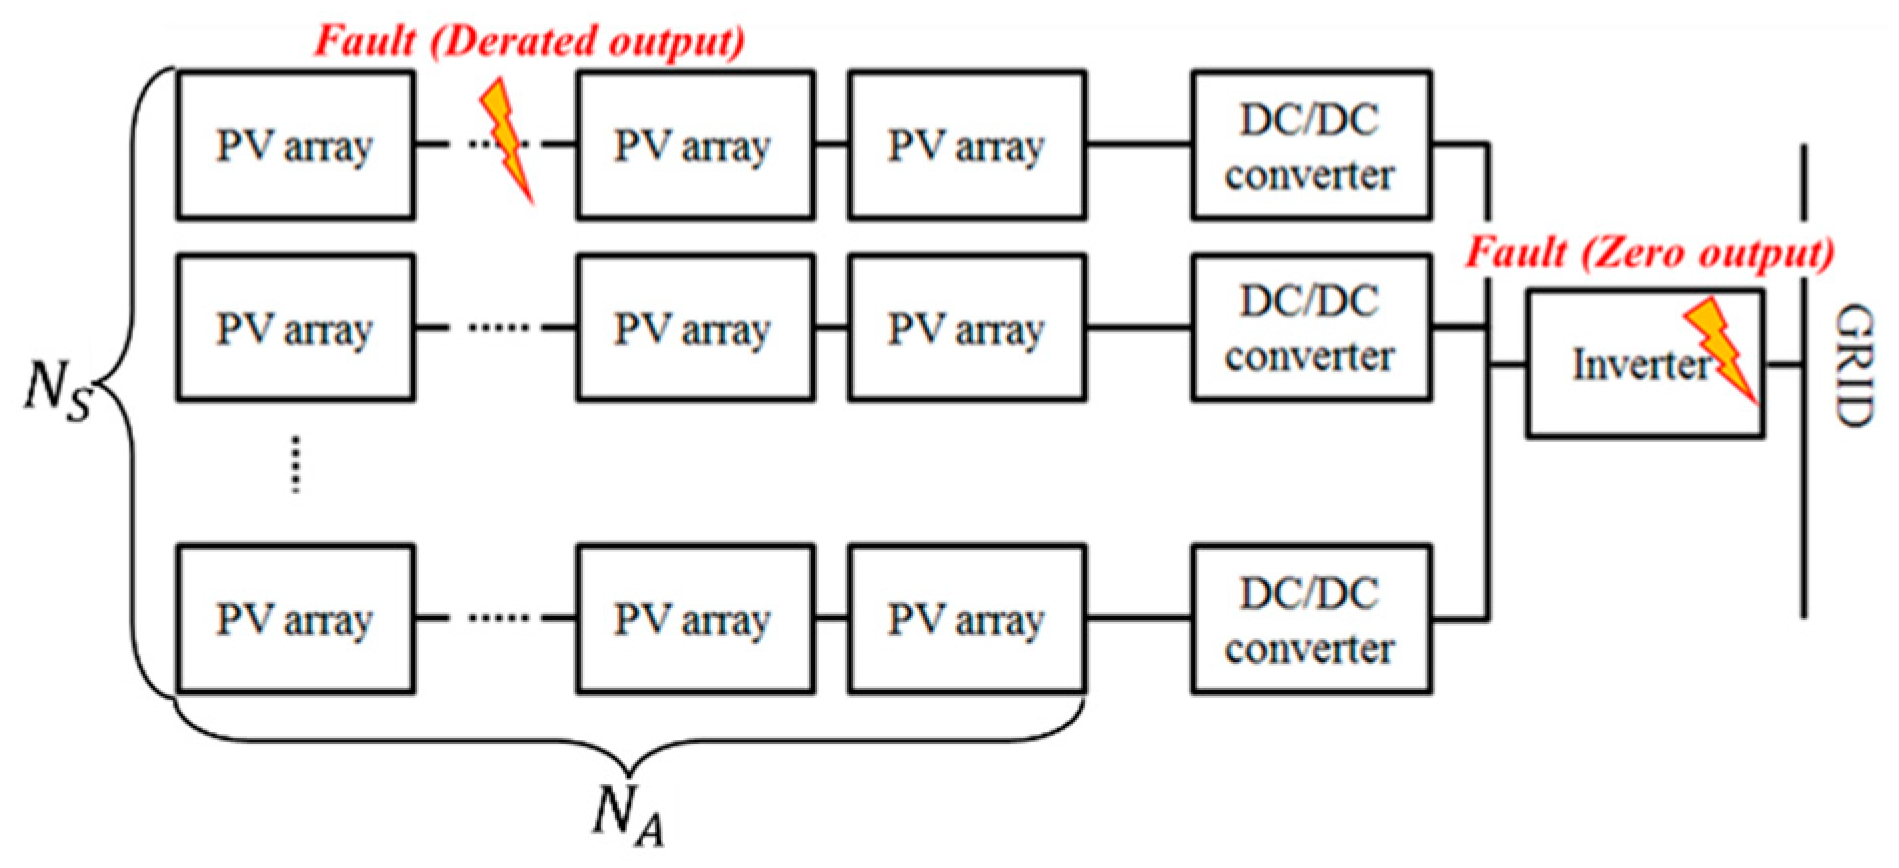
In our study, the PV system consists of numerous PV arrays that are connected to each other in series and parallel. In Figure 3, each series consists of NA PV arrays and a DC/DC converter, and NS of such series occurs. The outputs of all the PV arrays are collected and connected through an inverter to the grid [11].
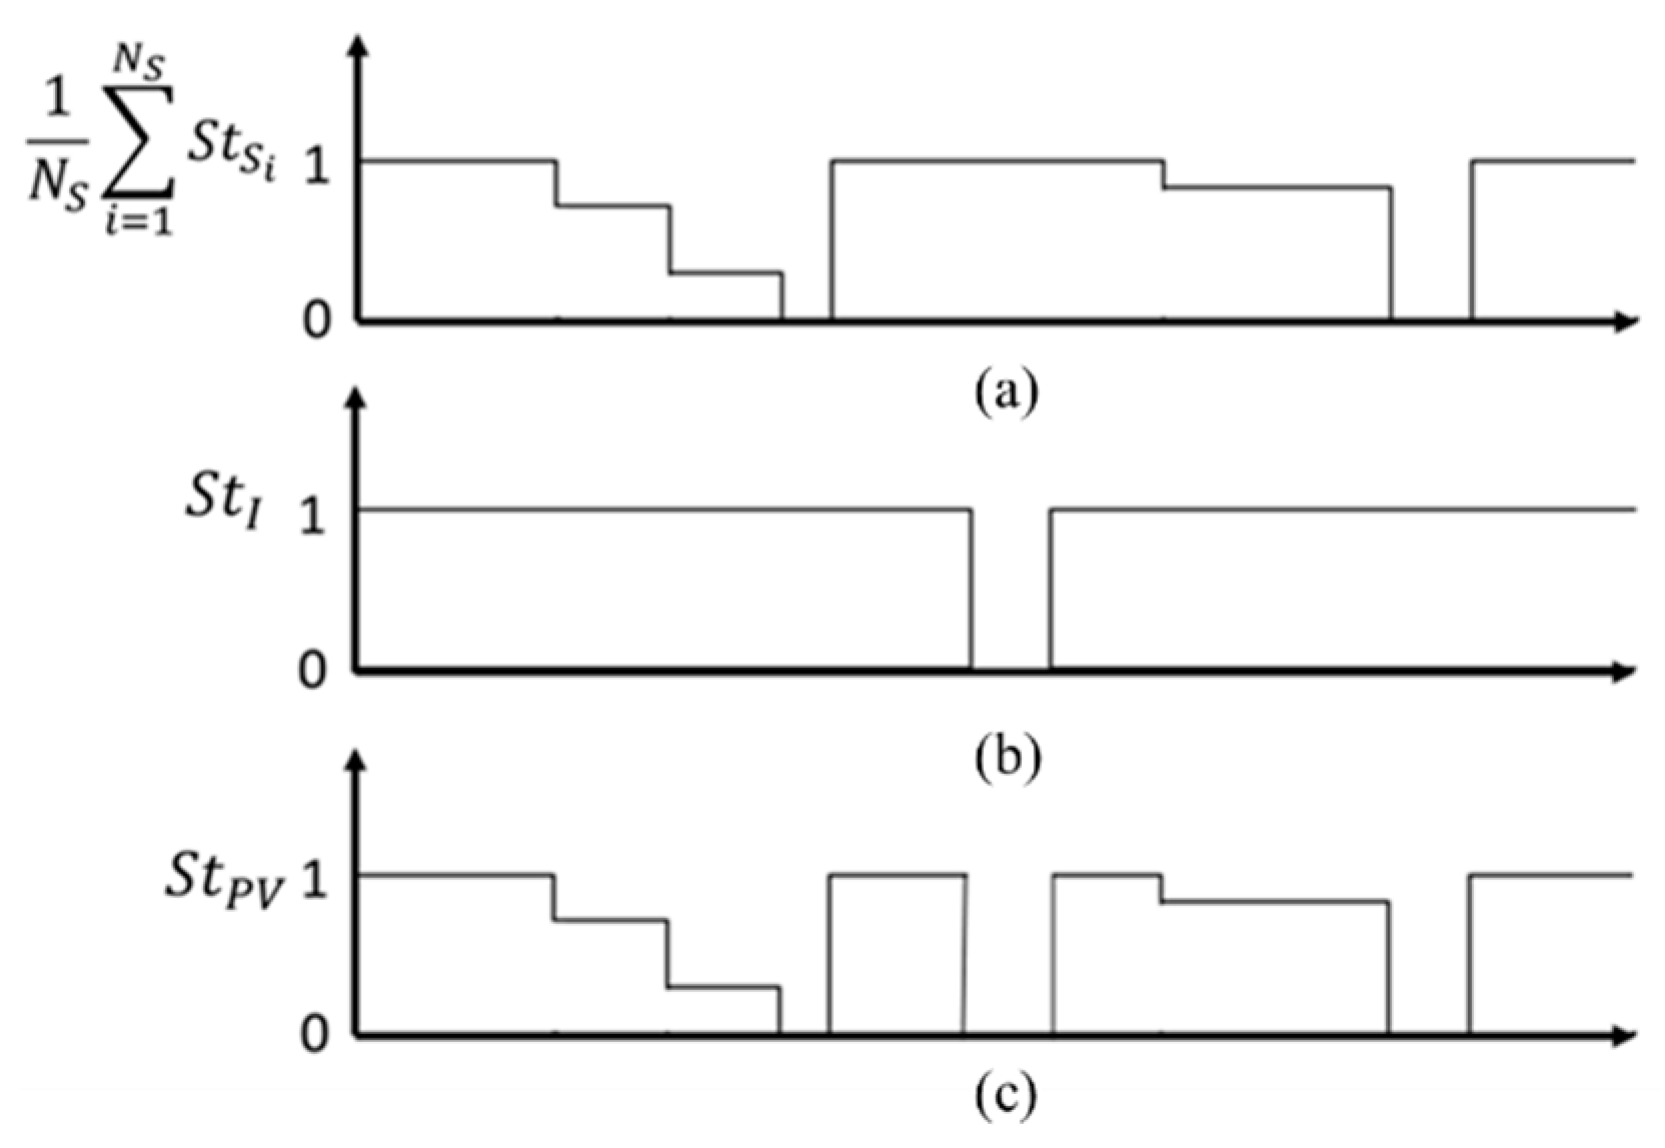
If a fault occurs at any component in a series line, the output of the series is not available; subsequently, the total output of the PV system is reduced as (NS–1)/NS. Meanwhile, if the inverter breaks down, the PV system has zero output power. Considering such characteristics, the state model of the PV system can be obtained as shown in Figure 4. The chronological operational state of each series, S t S i can be generated by the similar method to the CGs. At this time, the equivalent failure and repair rates of a series can be calculated using Equations (4) and (5) [10]:
λ S = i λ i = N A λ A + λ C
μ S = i λ i i λ i μ i = N A λ A + λ C N A λ A μ A + λ C μ C
where λi and μi are respectively the failure and repair rate of the component according to the subscripts; A, C, I, S represent the PV array, converter, inverter, and series, respectively. Because all the series are parallel to each other, their equivalent state model is obtained as the average of all S t S i (Figure 4a). Subsequently, the entire state model of the PV system is obtained by the multiplication of the equivalent model and the state model of an inverter (Figure 4b), as shown in (Figure 4c).
Because the available output of the PV system is different depending on the fault situations, the capacity model of the PV system can be expressed by the actual (predicted) output, instead of the rated power:
C M P V ( t ) = { 1 N S ( i = 1 N S t S i ( t ) ) S t I ( t ) } P P V ( t ) = S t P V ( t ) P P V ( t )

2.3. Hydropower Plant Model

Similar to the CGs, the state model of the HPP can be obtained by equations similar to Equations (1) and (2) by applying its failure and repair rates.
However, the available power output of the HPP is not constant and is different depending on its state model as well as its operational strategy and the amount of water remaining in the reservoir as shown in Figure 5. The operational strategy of the HPP is addressed in the next section. If the HPP is in the down state, it is assumed to not generate any power; instead, it spills the extra water only when the water stored in the reservoir exceeds its maximum volume.

3. Methodology of Reliability Evaluation for the Microgrid Containing HPP

A simple operational strategy of the HPP is first introduced; subsequently, the methodology for the reliability evaluation is described. The HPP output can be basically expressed by Equation (7):
P H ( t ) = P H R × W U s e ( t ) W U s e R
where P H R is the rated power of the HPP, W U s e R is the amount of water used to produce the rated power, and WUse(t) is the amount of the actual used water at time t that is affected by the amount of remaining water in the reservoir at time t.
The remaining water in the reservoir after generating power or spilling extra water can be expressed as Equation (8) [12].
V ( t ) = V ( t 1 ) W U s e ( t ) + W I n ( t ) W S p ( t ) w h e r e , V m i n V r e f V ( t ) V M a x
where Vmin, VMax are the minimum and maximum water volumes that can be accommodated by the reservoir, Vref is a volume reference, and it is assumed that the HPP can produce power only when the remaining water in the reservoir exceeds Vref.
The spillage of extra water occurs only when the stored water in the reservoir exceeds VMax [12].
W S p ( t ) = { 0 : V ( t ) V M a x V ( t ) V M a x : V ( t ) > V M a x
The operating strategy of the HPP consists of two stages. At the first stage, the HPP output, P H 1 s t ( t ) means that a power output is to be generated for benefits, and can be expressed as Equation (10):
P H ( t ) = P H R × W U s e 1 s t ( t ) W U s e R × S t H ( t )
Whenever water in the reservoir exceeds any Vref, the HPP produces power by consuming the available water, which is represented by Equation (11):
W U s e 1 s t ( t ) = min { V ( t ) V r e f ,   W U s e R }
According to Equation (11), the remaining water in the reservoir is always maintained over Vref.
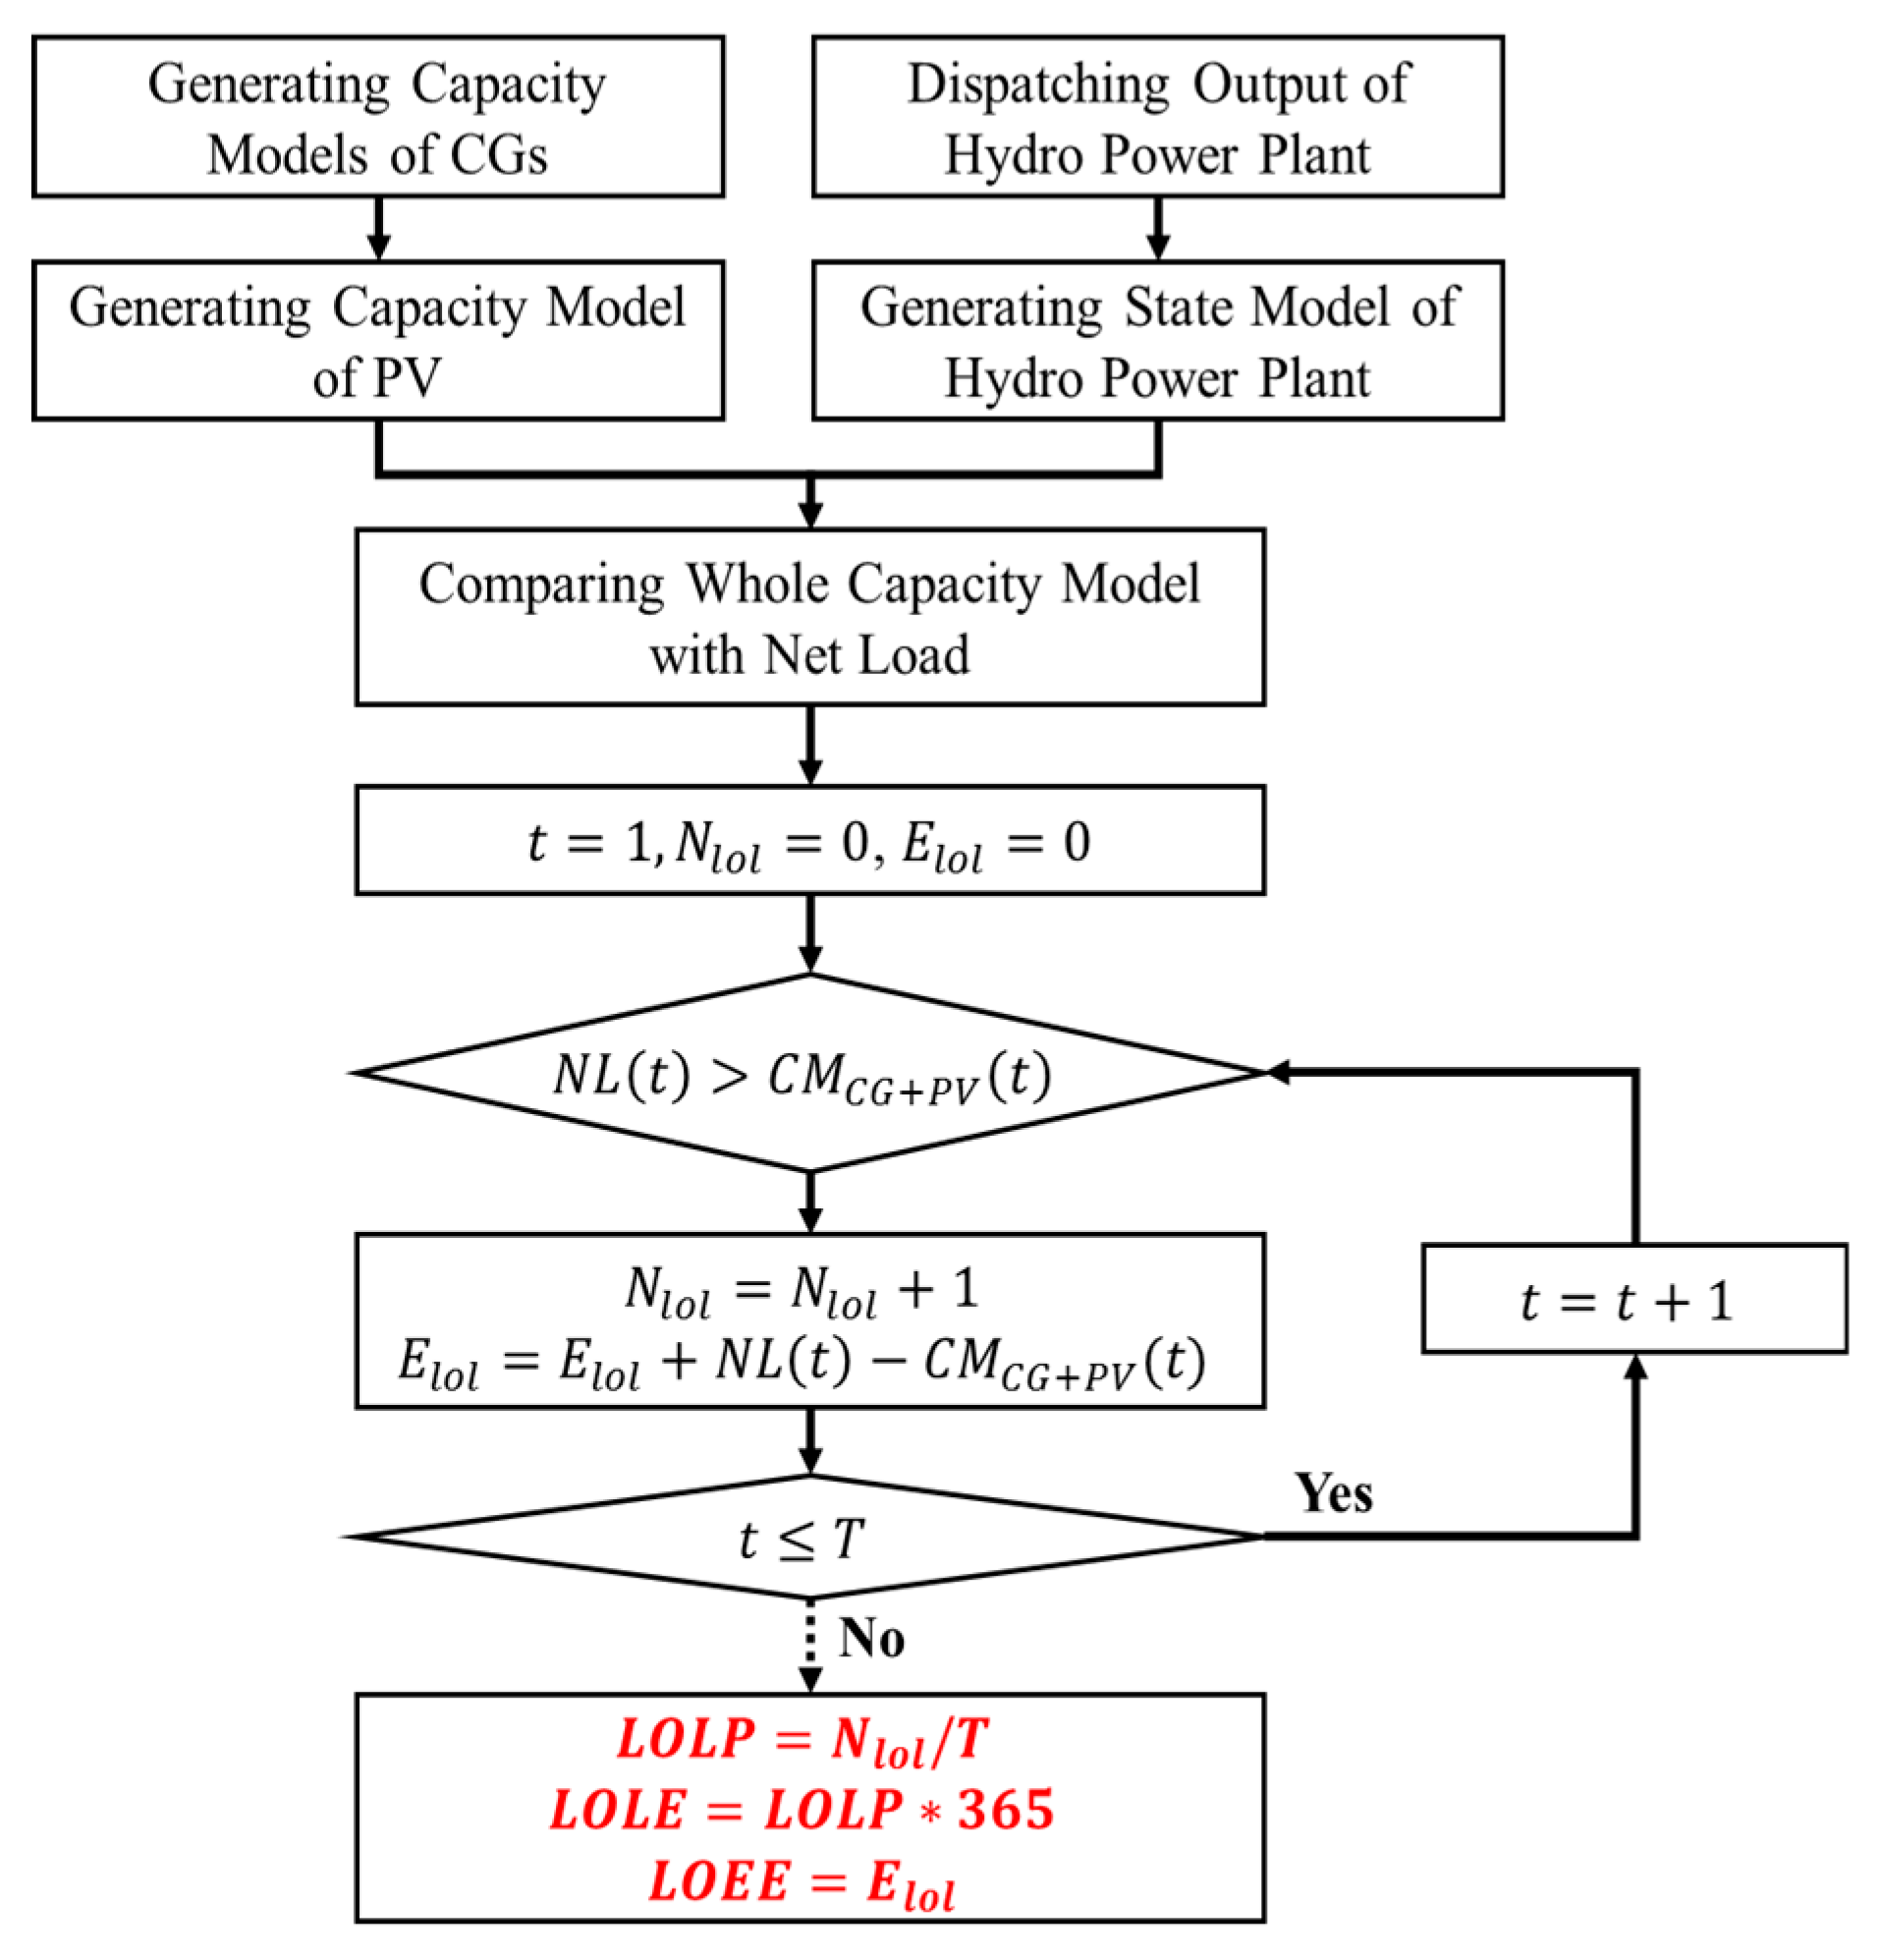
Figure 6 shows a flow chart for the reliability evaluation at the first stage, which is repeated for the appropriate number of times [13].
The reliability indices: LOLP, LOLE, and LOEE, are calculated by comparing the sum of the capacity models of the CGs and the PV system, with the chronological net load, NL(t) obtained by subtracting the power output of the HPP determined from the first stage of the chronological system load
N L ( t ) = L ( t ) P H 1 s t ( t )
C M C G + P V ( t ) = C M C G ( t ) + C M P V ( t )
As a result of the reliability evaluation at the first stage, the information for loss of load (lol) events is obtained; it pertains to the time the lol events occurred and the power not served (PNS) at that time.
Meanwhile, the second output of the HPP to be determined at the second stage, P H 2 n d ( t ) is the reserve generation to alleviate the lol events. Because of P H R , P H 2 n d ( t ) may be limited depending on the P H 1 s t ( t ) pre-determined at the first stage. If P H 1 s t ( t ) is the rated power, subsequently the HPP can no longer produce a power output at the second stage. According to such an operating condition, P H 2 n d ( t ) can be represented by Equation (14):
P H 2 n d ( t ) = 0 ( i f ,   V ( t ) = V r e f   or   P H 1 s t ( t ) = P H R ) P H 2 n d ( t ) = P H R ( i f ,   min ( V ( t : T ) ) W U s e R V r e f P H 1 s t ( t ) = 0 ) P H 2 n d ( t ) = P H R × W U s e 2 n d ( t ) W U s e R ( o t h e r w i s e )
where the amount of water to be used at the second stage, W U s e 2 n d ( t ) can be determined as the minimum value among four terms, which are represented in Equation (15)
W U s e 2 n d ( t ) = min { V ( t ) V r e f ,   W U s e R ,   E l o l ( t ) × W U s e R P H R ,   min ( V ( t : T ) ) V r e f }
where the meaning of each term is as follows:
  • 1st term: the amount of water in the reservoir that exceeds Vref at time t.
  • 2nd term: the amount of water required to generate the rated power.
  • 3rd term: the amount of water required to generate the power as much as the PNS.
  • 4th term: the amount of water available when considering the remaining water after the present.
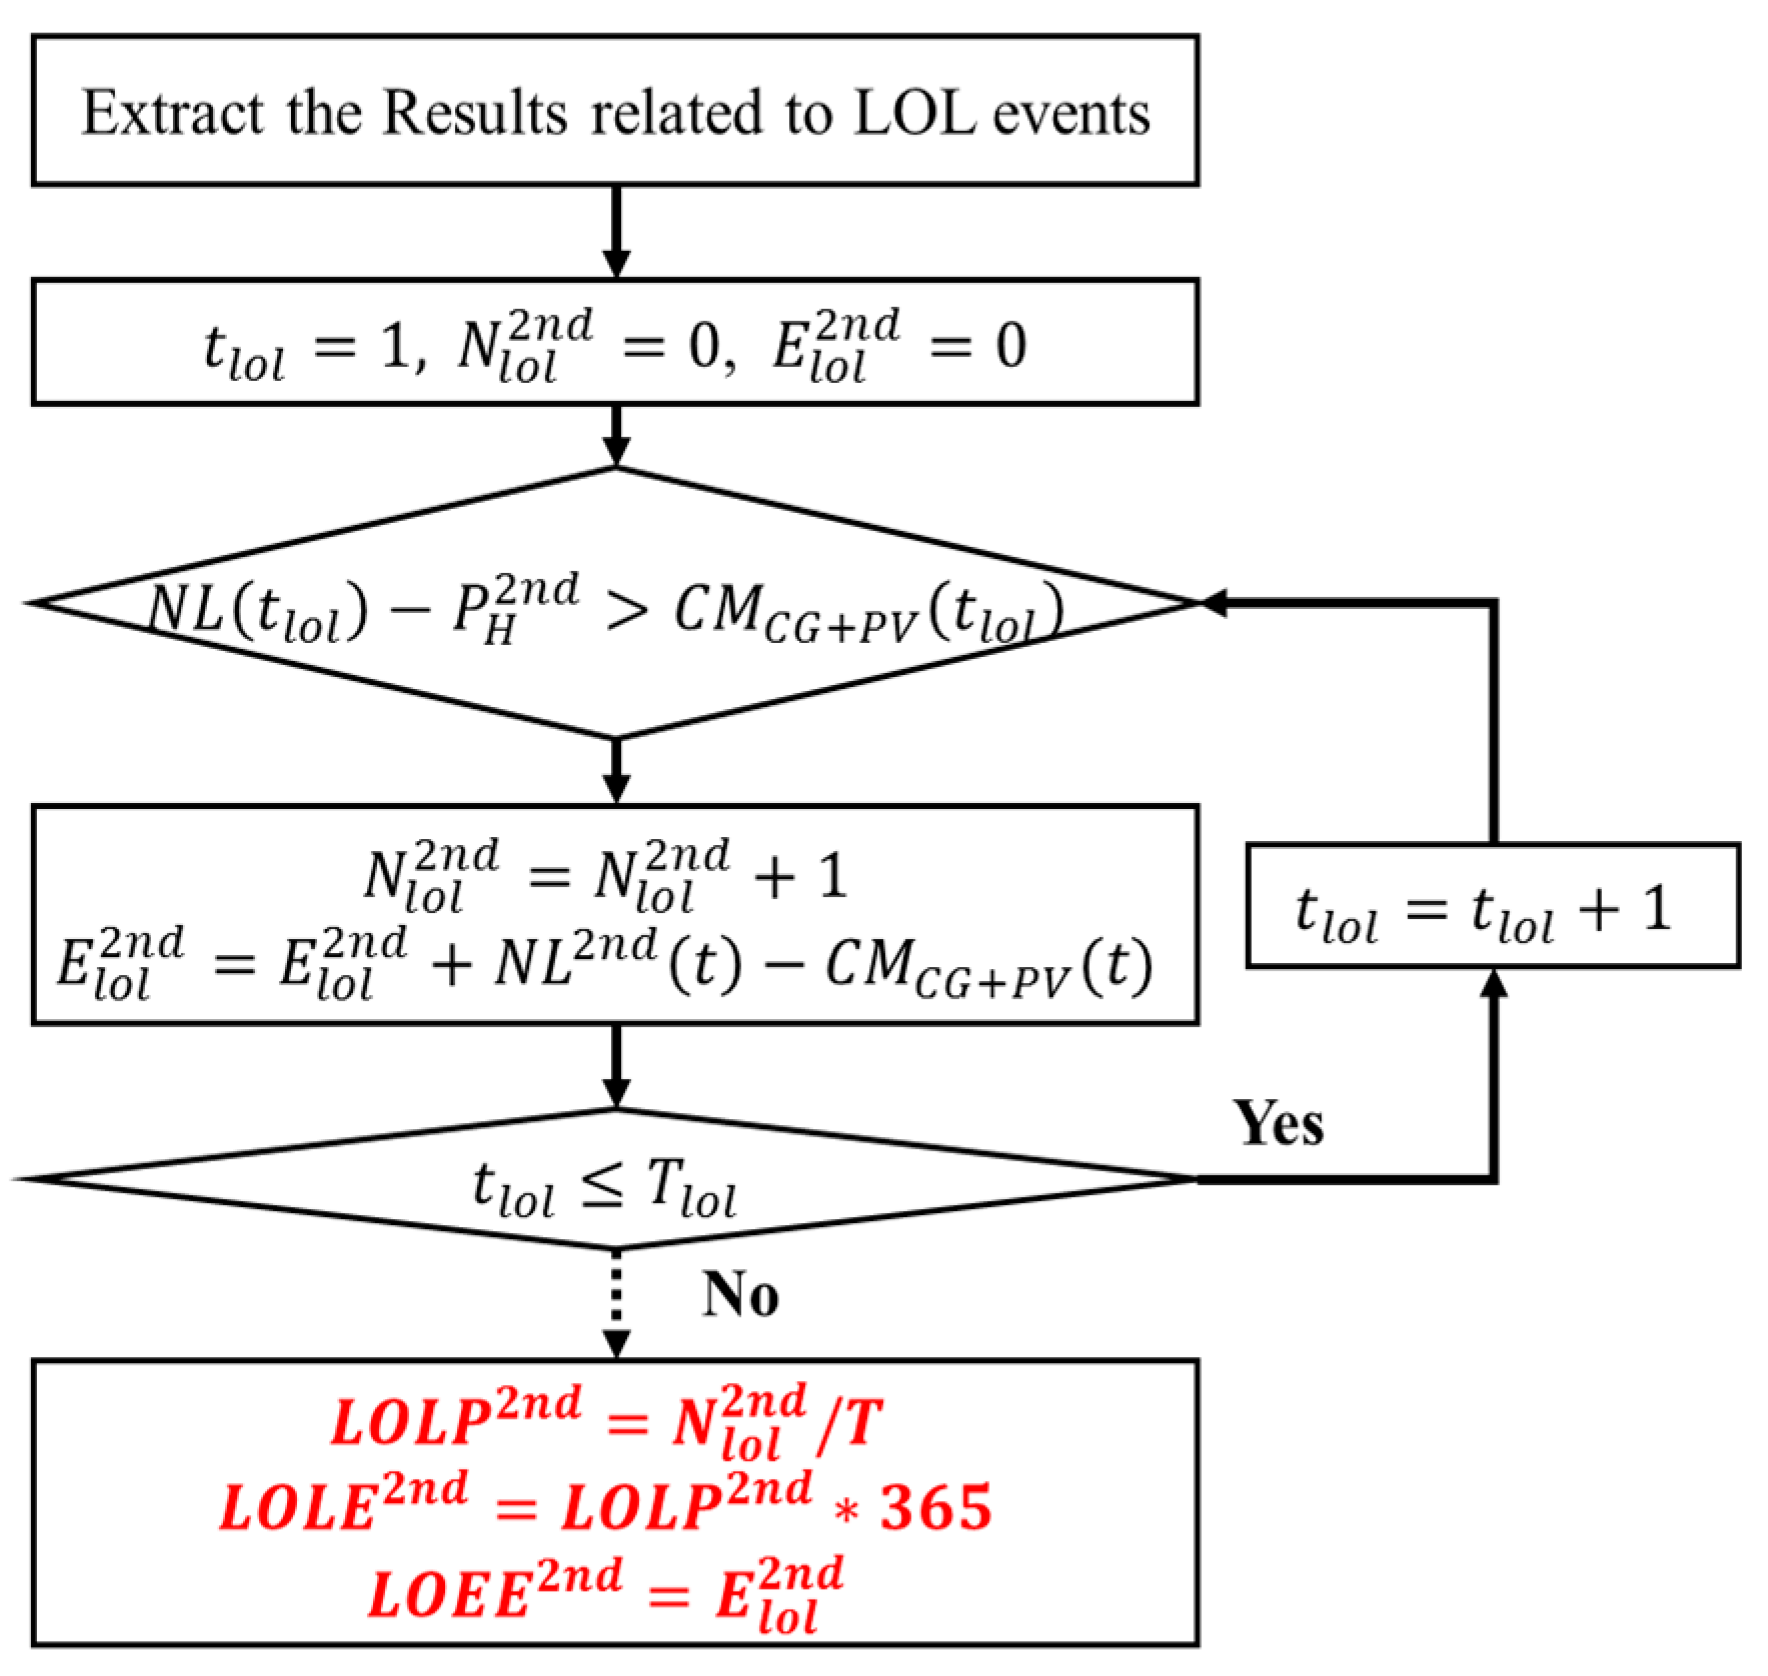
The flow chart of the reliability evaluation at the second stage is shown in Figure 7, where the goal of the second stage is to minimize the LOLP. From the results of the first reliability evaluation, only the results related the lol event is extracted, i.e., the time the lol event occurred and the PNS at that time. Subsequently, the extracted results are re-sorted in an ascending order for the PNS and the time order, and tlol is renewed. P H 2 n d ( t ) is determined according to the renewed time order. It is to preferentially solve the events having relatively low PNS to reduce the occurrence number of lol events (i.e., to reduce LOLP).
In this figure, tlol is an index representing the times at which the lol events occurred, in an ascending order; Tlol is the number of times that lol events occurred.
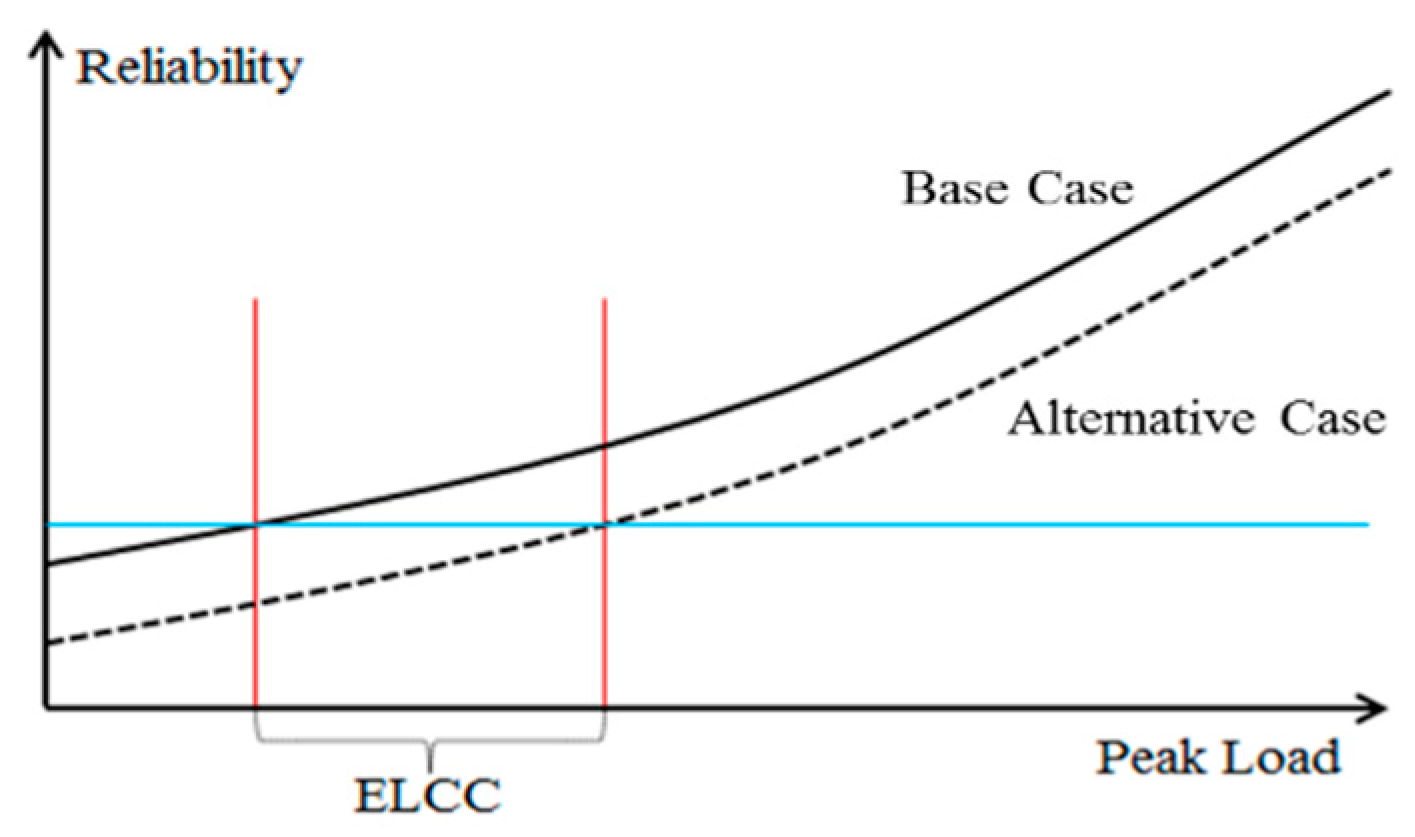
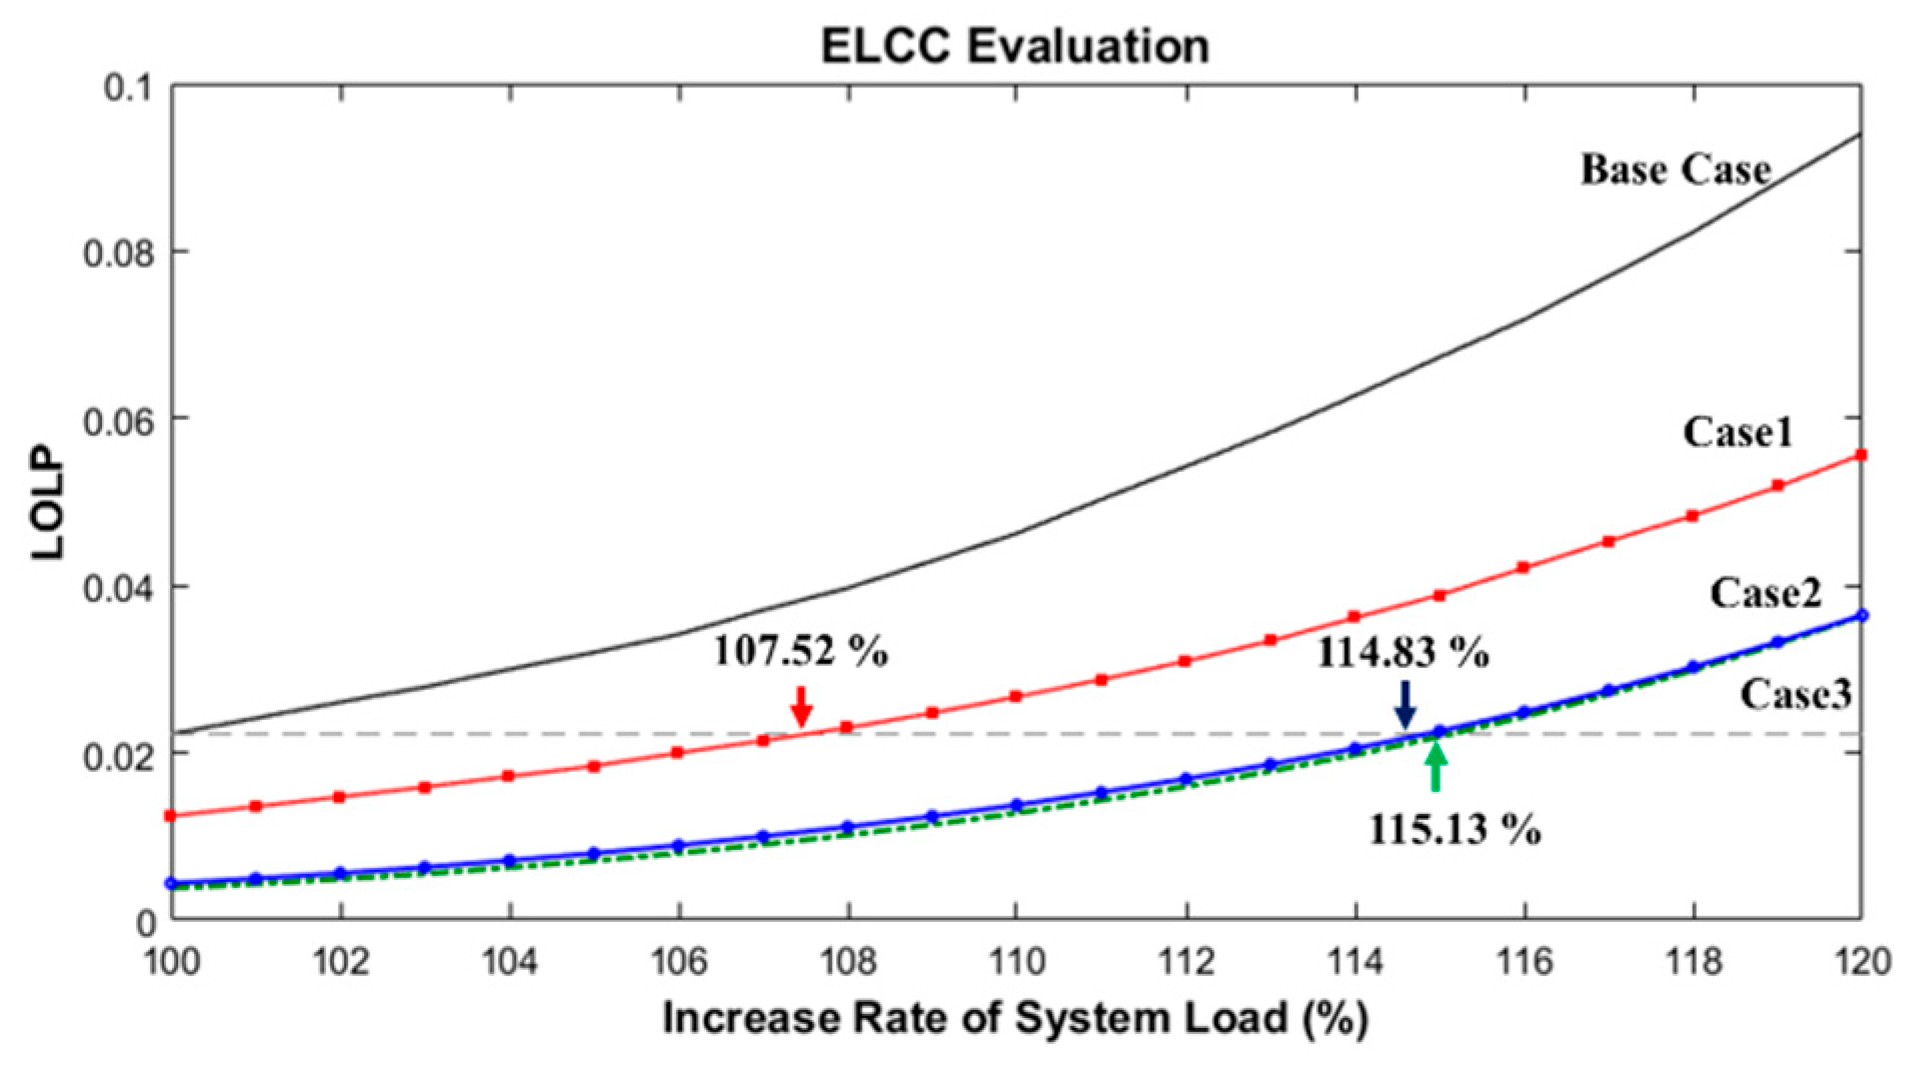
The capacity credit is an index of how much electricity any new plant can be depended upon to deliver. For evaluating the capacity credit, the calculation of the effective load carrying capability (ELCC) is necessary. The ELCC is widely used to assess the capacity value of RES. The basic concept of the ELCC is represented in Figure 8, and it represents how much additional load can be served while satisfying the specified reliability level after a new generation resource is added to the existing system [10]. Equation
Herein, the ELCC is applied to assess the contribution of the HPP to reliability of the grid, depending on the volume reference under the condition that the installed capacity of the HPP is fixed. In Equation (16), a percentage of the installed capacity (i.e., rated power) of the HPP and the ELCC is calculated as the capacity credit [14]:
C C = E L C C ( V r e f ) P H R × 100 ( % )

4. Case Study

4.1. Test System Data

Case studies were performed to demonstrate the proposed reliability evaluation methodology under the simple operational strategy for the HPP. As the test system, the microgrid was configured with the data shown in Table 1. The grid consists of six CGs with the total capacity of 3000 kW, a PV system of 500 kW, and an HPP of 1000 kW. The reliability data of each component is represented in Table 2. Figure 9 shows the hourly water inflow, chronological load, and PV output, respectively.

4.2. Simulation Result

Figure 10 shows an example of the individual and whole capacity models of the CGs and PV during the process of repeating the proposed methodology 1000 times.
Figure 11 shows the results for two cases, i.e., the total power output generated from the HPP, and the water spilled from the reservoir; One is a case that applies Vref = 0%, i.e., the HPP generates power whenever the water stored in the reservoir exceeds the minimum volume, Vmin. Another is a case that applies Vref = 100%, i.e., the maximum volume.
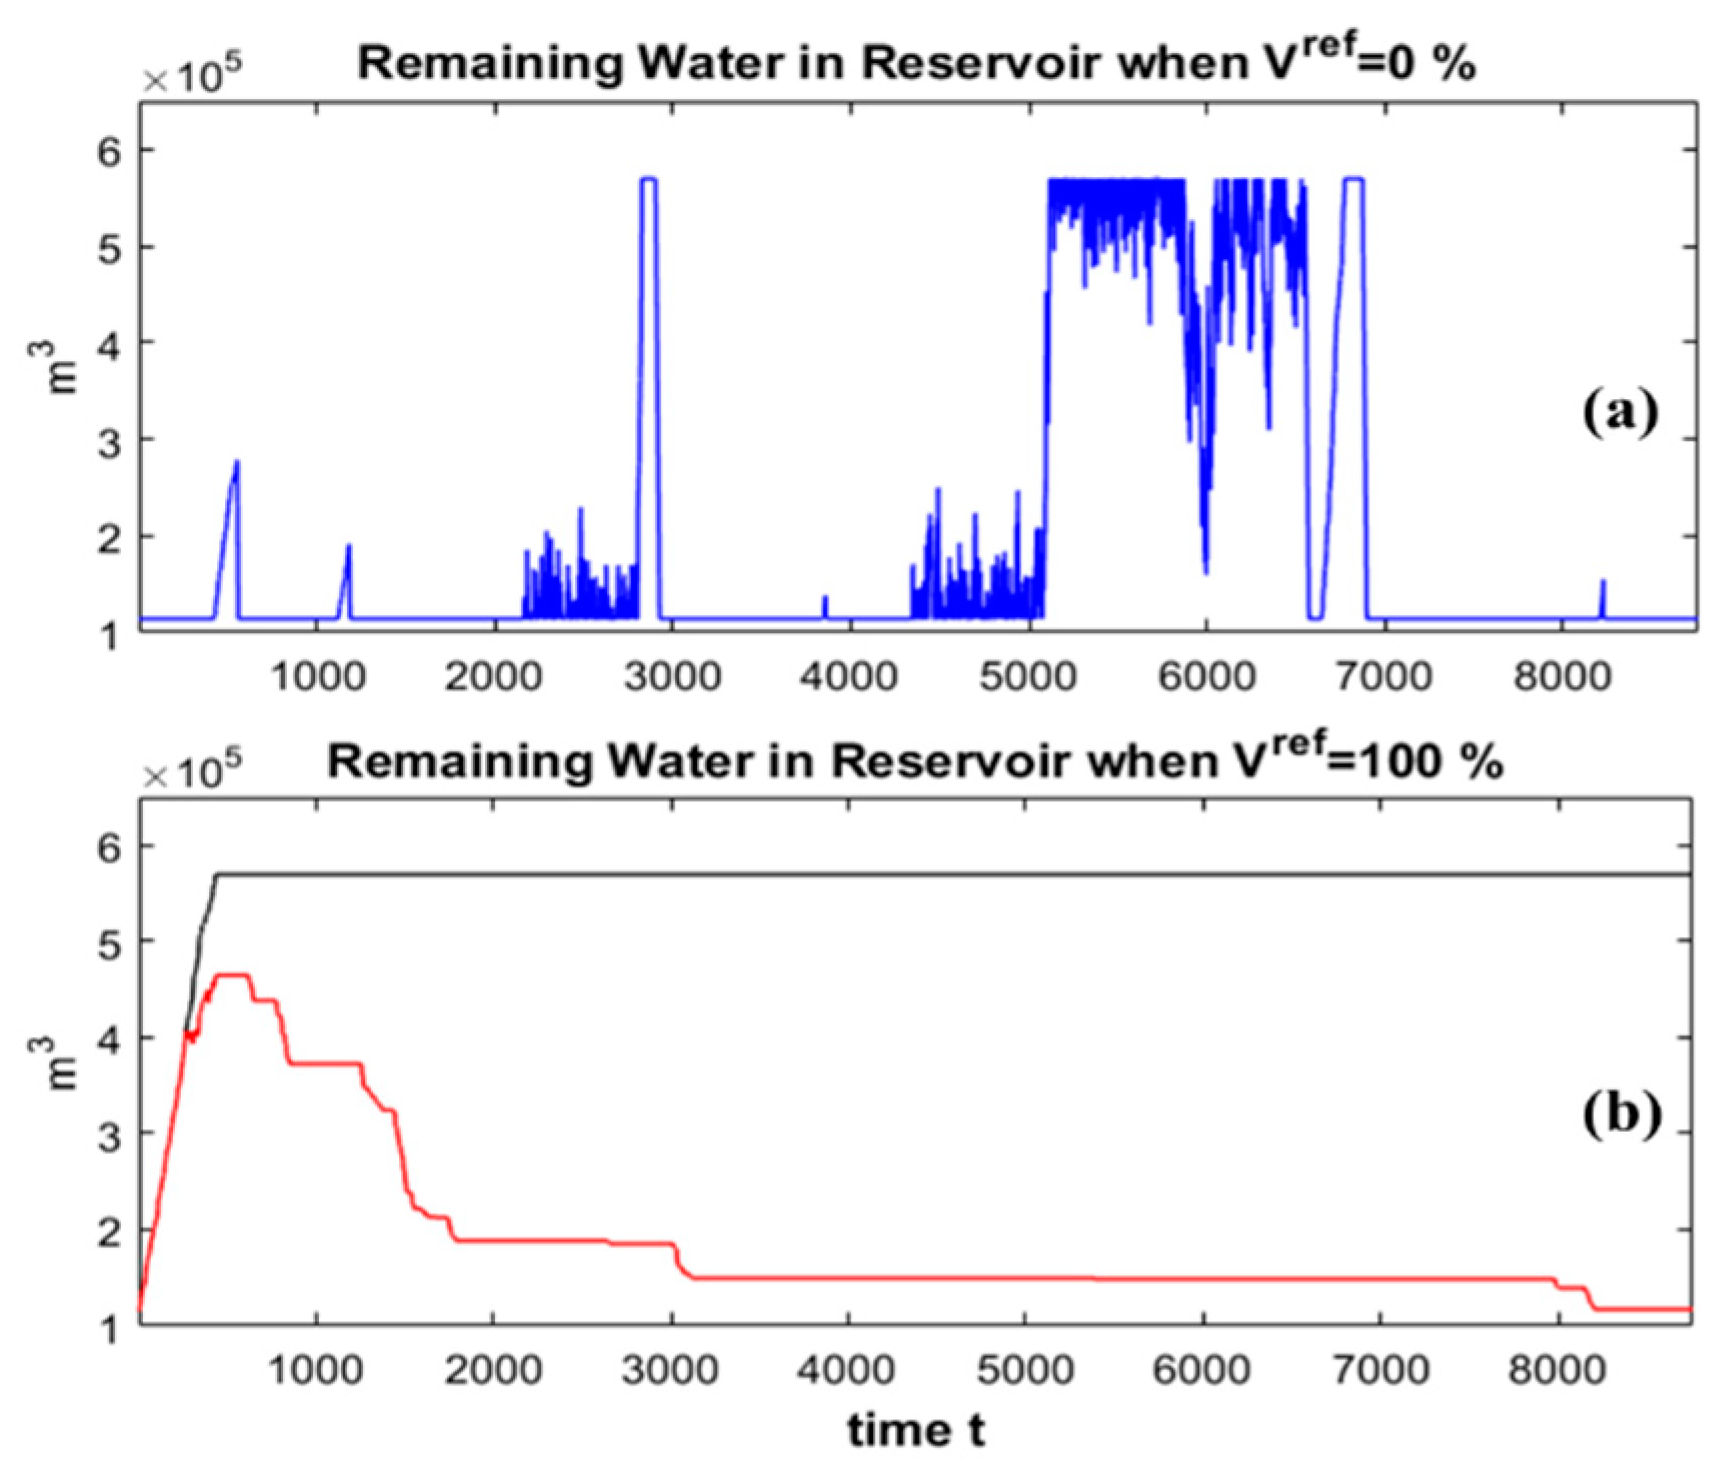
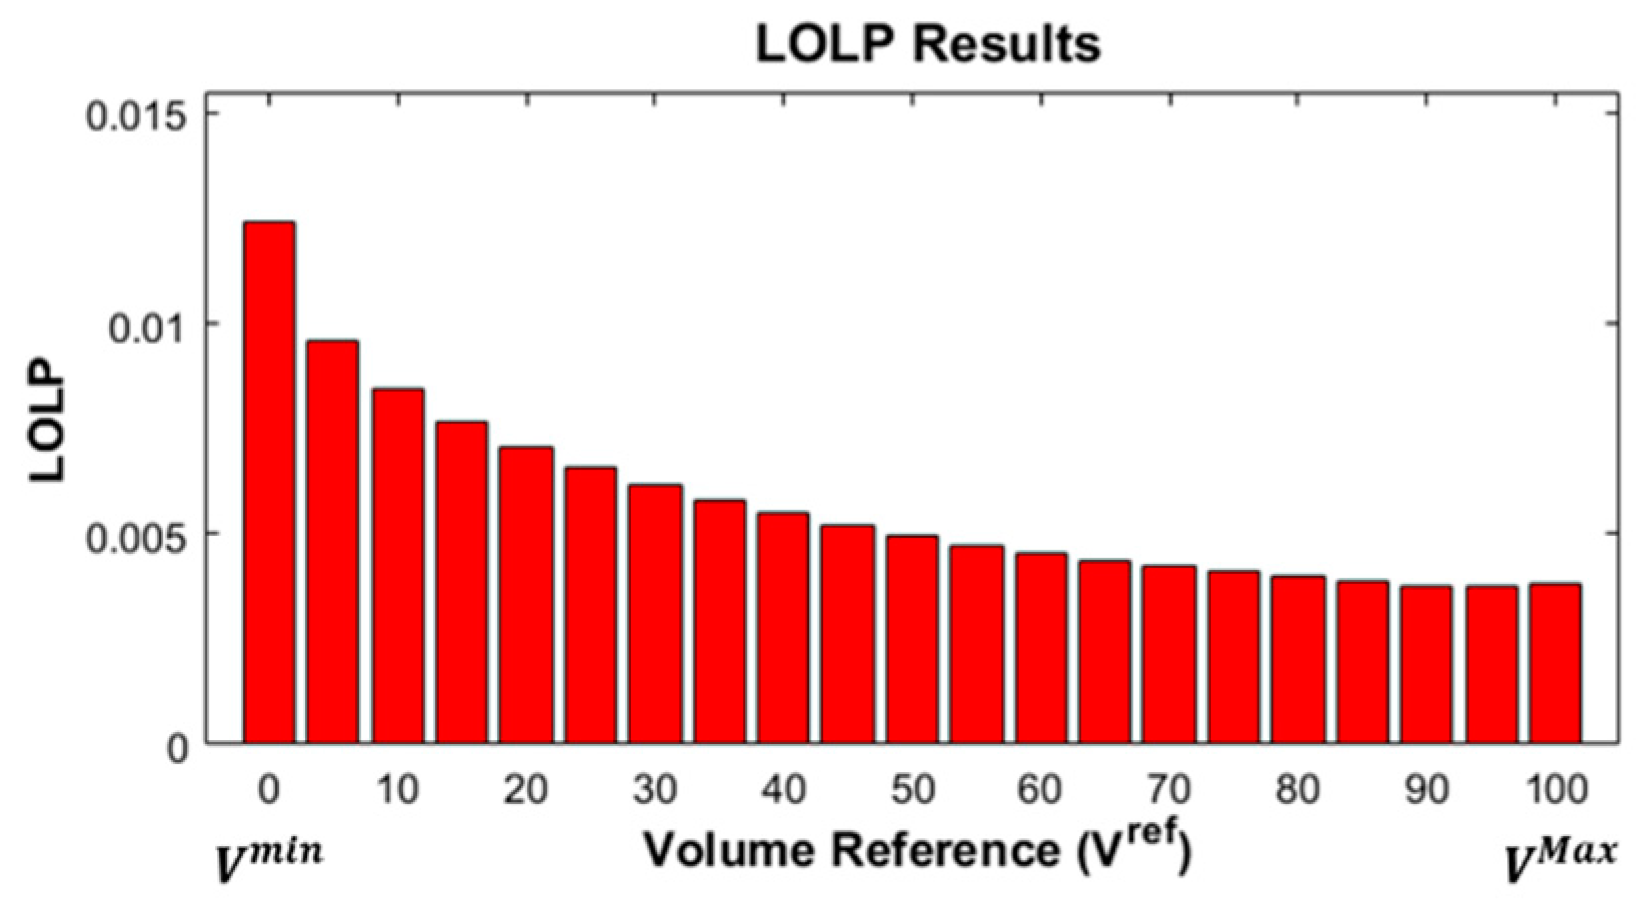
The result comparison between the two cases show that less power can be generated and more water is discharged as the volume reference is higher. Further, the result for the remaining water in the reservoir is shown in Figure 12. As shown in Figure 12a, the HPP can no longer contribute to the improvement in the system reliability at the second stage because it has exhausted the available extra water, which exceeded the minimum volume at the first stage. However, in Figure 12b, the HPP still has sufficient water in the reservoir after the first stage; as such, it was able to produce more power for mitigating the impacts of faulted components at the second stage. The results show that, for the case of Vref = 0%, an LOLP of 0.0124, and an LOEE of 23.13 MWh is obtained. Meanwhile, another case obtained 0.0038 and 12.18 MWh, respectively. From the cases applying two extreme values of Vref, we confirmed that Vref affects the HPP operation as well as the system reliability.
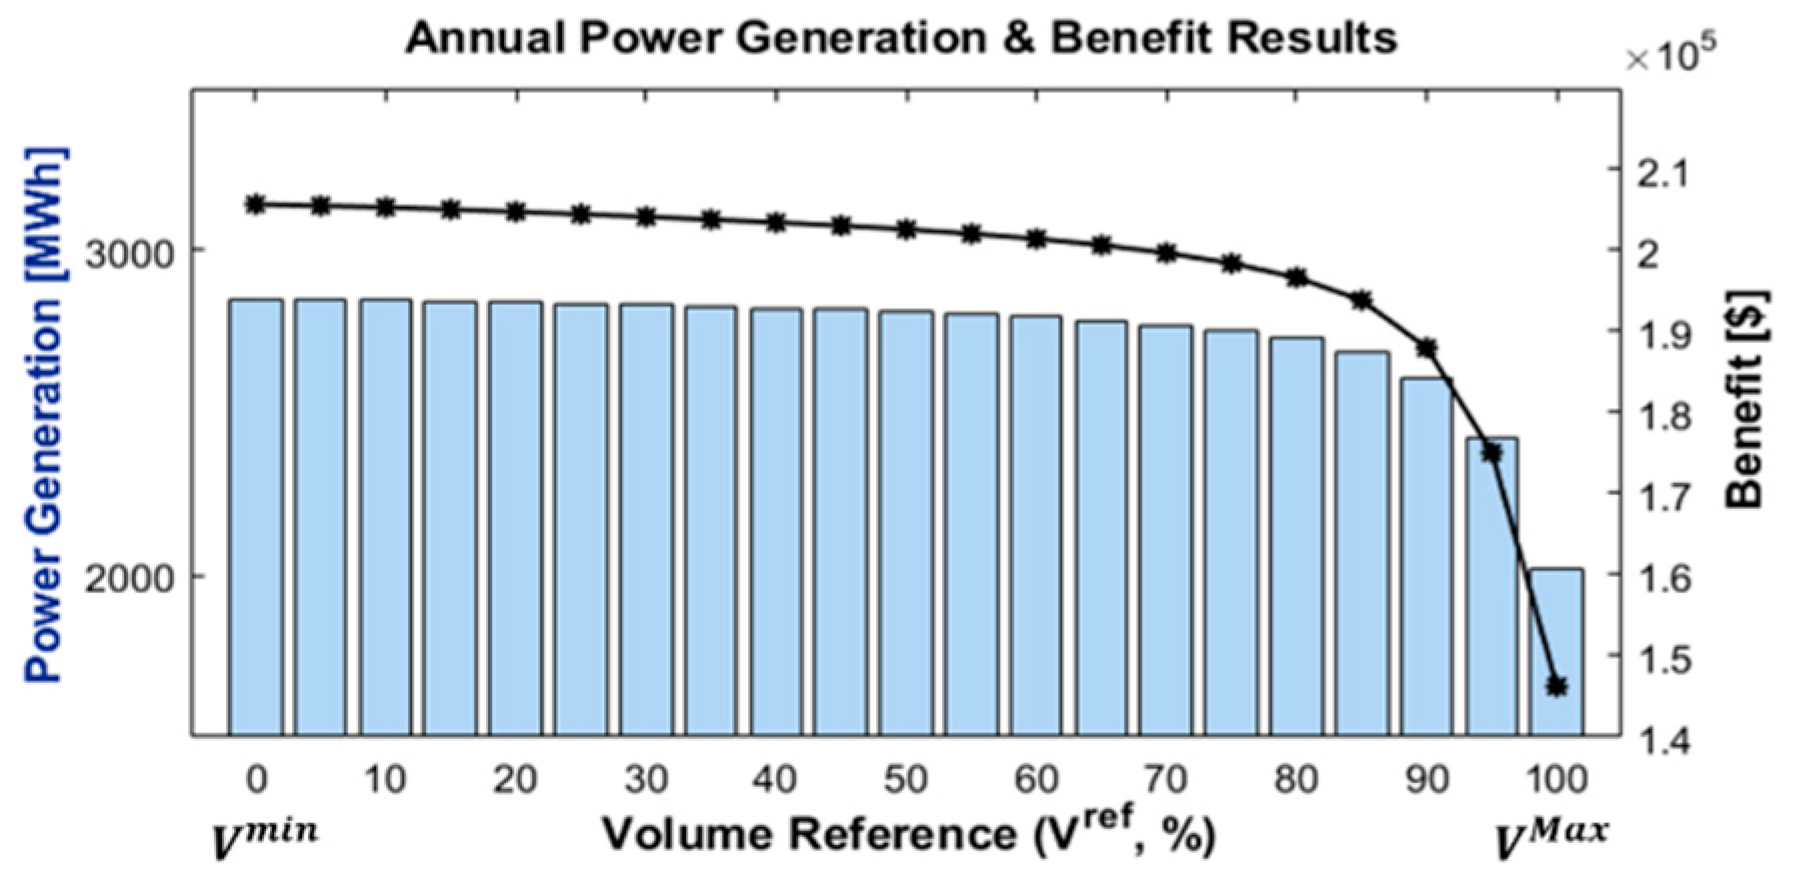
Figure 13 shows the LOLP result according to various values of Vref, which decreases as the value of Vref increases. However, from Figure 14, the improvement in reliability causes the decrease in the total generated power as well as the HPP benefit. Herein, the HPP benefit is calculated by Equationuation (17).
B e n e f i t H = t = 1 8760 π ( t ) × ( P H 1 s t ( t ) + P H 2 n d ( t ) )
where π is the hourly electricity price.
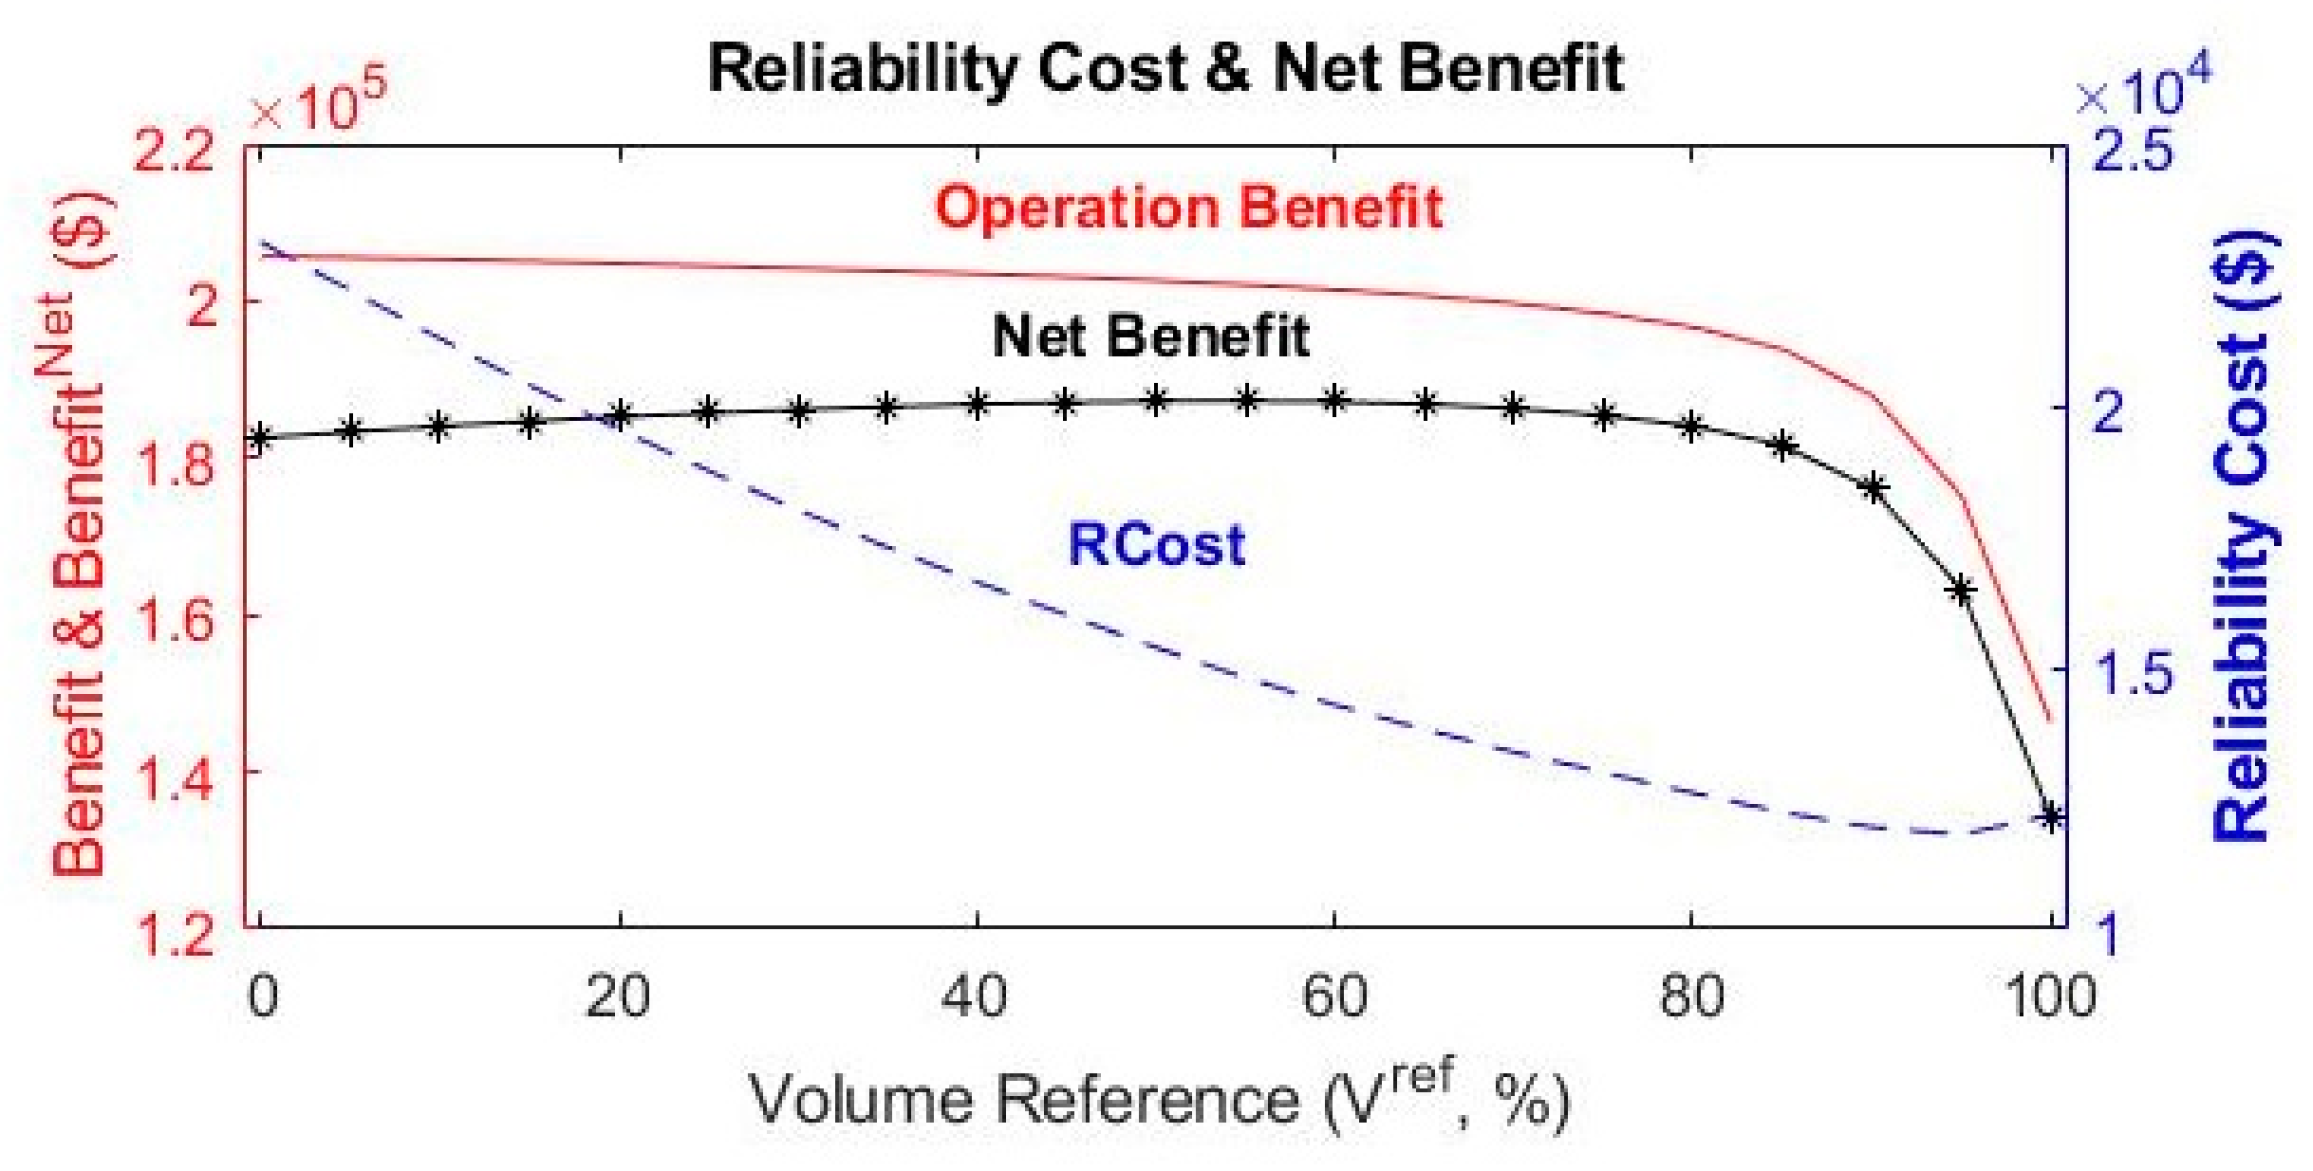
We confirmed that a trade-off relationship existed between the system reliability and the HPP benefit. Therefore, it is necessary to determine an appropriate Vref considering both reliability and economics aspects. The reliability cost can be defined as worth for lol, which is the amount of demand not served, and is expressed as Equation (18):
RCost = t = 1 8760 E l o l 2 n d ( t ) × V O L L
where VOLL is the value of load loss and is applied using $1.5/kWh herein.
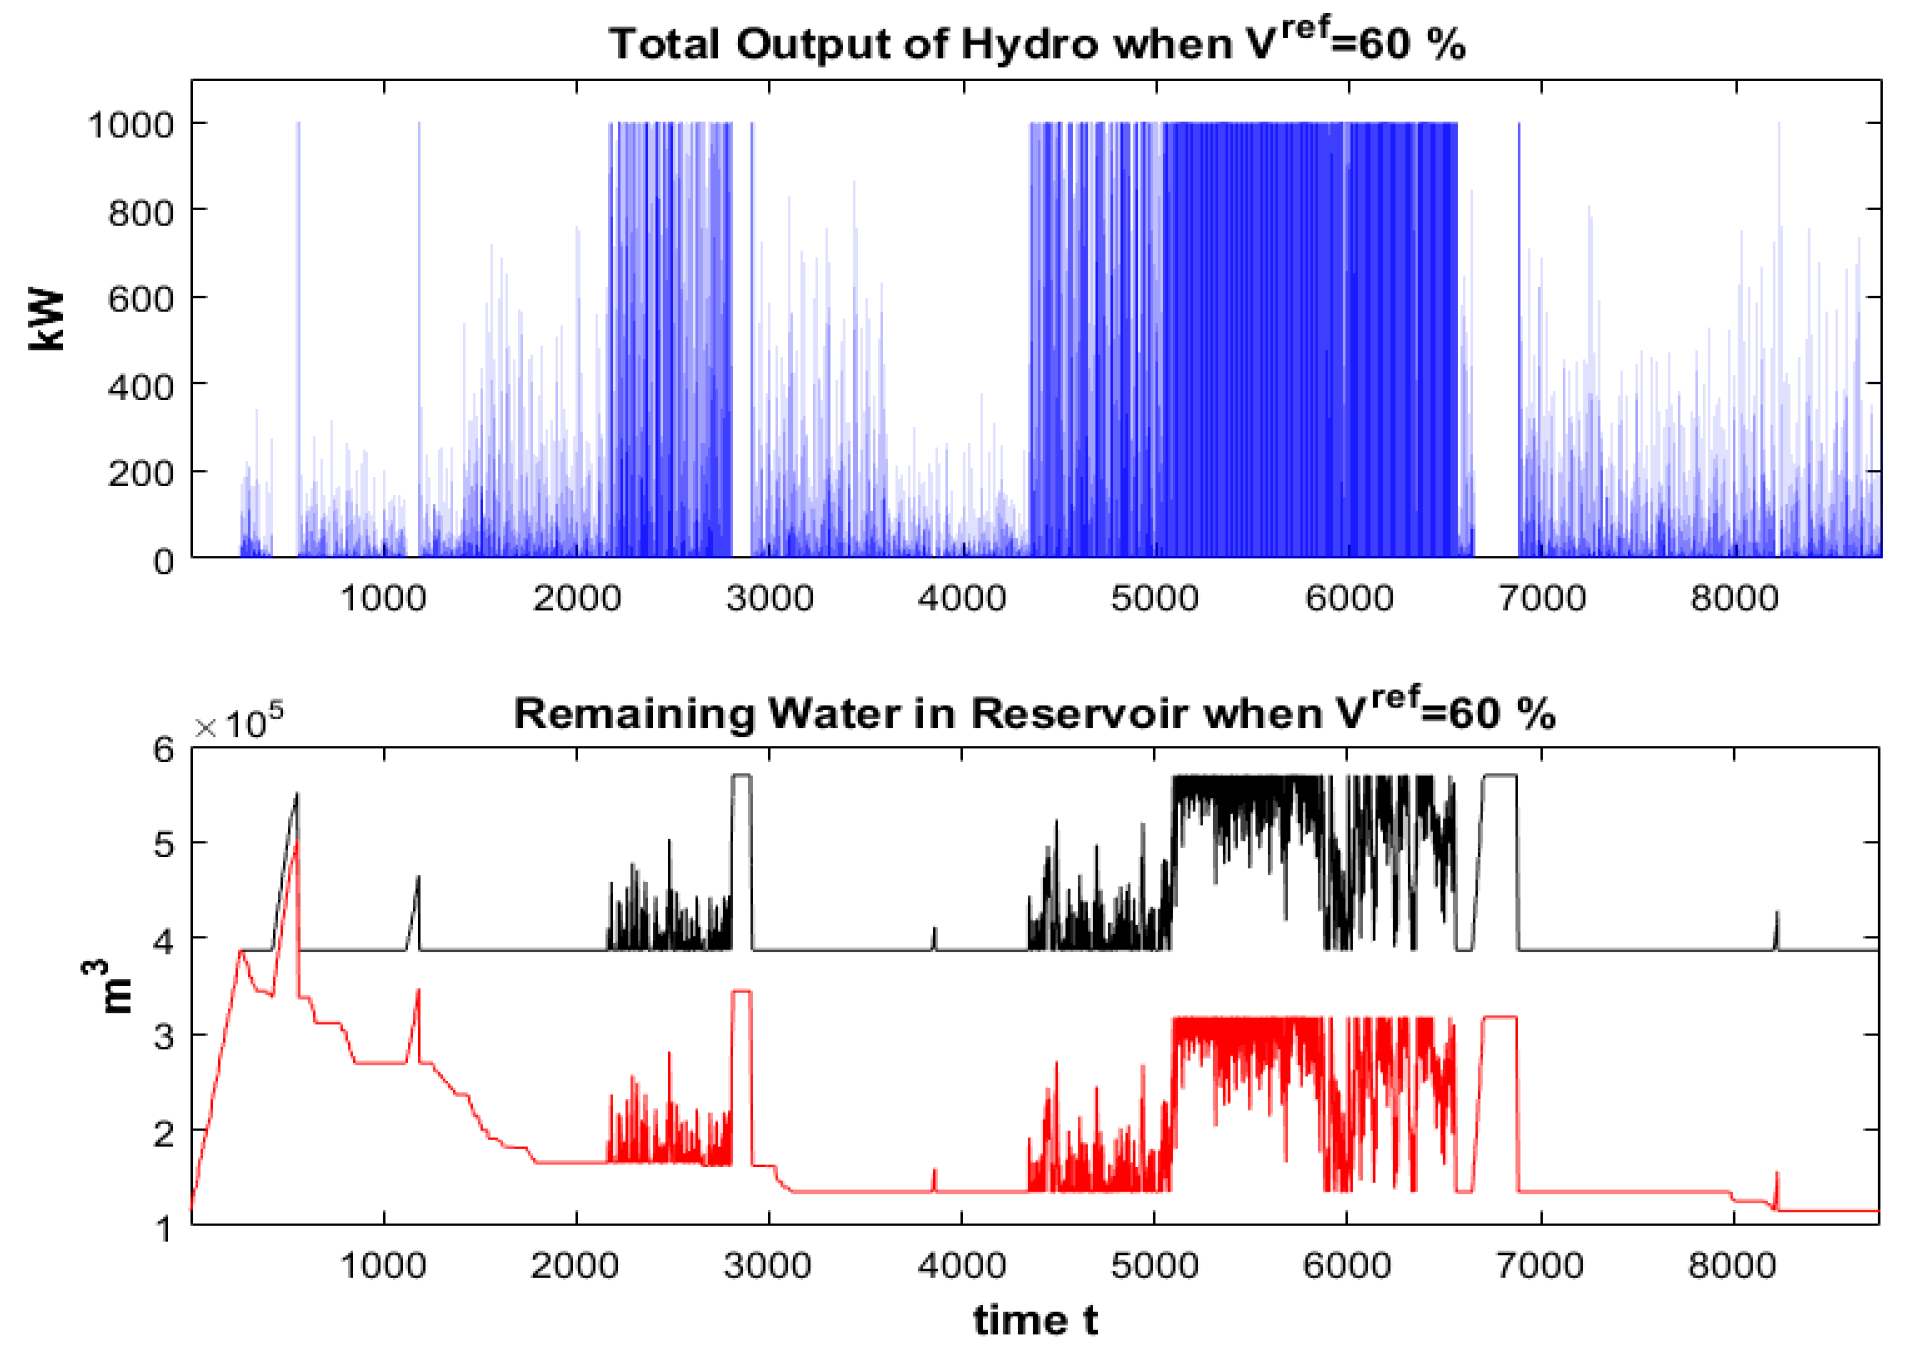
The net benefit of the HPP, B e n e f i t H N e t can be calculated by subtracting RCost from BenefitH, and the graphical and detailed results are represented in Figure 15 and Table 2, respectively. The case of Vref = 0% has the most benefit and the case of Vref = 100% has the lowest value of LOEE (LOLP, as well). However, the case having the most net benefit appeared as the case of Vref = 60%, and its HPP operation results are represented in Figure 16. In conclusion, under the simple operational strategy for the HPP, Vref = 60% is the most appropriate in that the HPP generates power when water in the reservoir exceeds a level of 60% between Vmin and VMax.
Figure 17 and represents the result of the ELCC evaluation that assesses the amount of additional load able to be served by the test system while satisfying the LOLP of the existing level of reliability. Compared with the base case which doesn’t involve the HPP, the test system can serve more demand as Vref increases. However, it is also obvious that such an efficiency is rapidly decreased as Vref increases. The capacity credit was calculated as 18.8 %, 37.1%, and 37.8% for case 1, 2, and 3, respectively. In Table 3, LOEE refers to the amount of power that the power plant failed to load, associated with the cost of reliability loss, and the profit is the operating profit of the plant. The net profit is the limited amount of cost of reliability loss in the operation profit of the power plant, and the profit is the biggest when the low water level is 60%. The results in Table 4 show that the power supply for renewable energy systems is slightly larger than that at 60%.As a result, it can be seen that the power supply due to the renewable energy is slightly higher at 100%, but it is best at the low level of 60% considering the operational profit considering the reliability. In the simulation, the HPP is used to produce power as frequently as possible depending on the water inflow, and not only to secure the reserve capacity for the peak load.

5. Conclusions

In this paper, a reliability evaluation method for a microgrid that contains a PV system and a HPP is suggested. However, to assess that the HPP can satisfy a certain reliability of the system, the reliability evaluation is performed in terms of the LOLP and LOEE. In the case study, we confirmed that there a trade-off relationship exists between the reliability indices and the economic benefits; subsequently, an adequate amount of the remaining water in the reservoir was determined for the reliability. According to the amount of the remaining water, we also confirmed that the capacity credit can be efficiently improved by an adequate amount of the remaining water in the reservoir through the ELCC evaluation.

Author Contributions

M.-S.N.—Concept, Case study simulations, Generation and output data acquisition, Calculations, Edit paper; J.-O.K.—Reliability evaluation strategy, Monte Carlo simulation concept, Case study analysis, Conclusions.

Funding

This research was supported by the Basic Science Research Program through the National Research Foundation of Korea (NRF) funded by the Ministry of Education (No. NRF-2017R1A2B1007520).

Conflicts of Interest

The authors declare no conflict of interest.

References

  1. Sacramento, E.M.; Carvalho, P.C.M.; de Araújo, J.C.; Riffel, D.B.; Corrêa, R.M.d.; Neto, J.S.P. Scenarios for use of floating photovoltaic plants in Brazilian reservoirs. IET Renew. Power Gen. 2015, 9, 1019–1024. [Google Scholar] [CrossRef]
  2. Teixeira, L.E.; Caux, J.; Beluco, A.; Bertoldo, I.; Louzada, J.A.S.; Eifler, R.C. Feasibility Study of a Hydro PV Hybrid System Operating at a Dam for Water Supply in Southern Brazil. J. Power Energy Eng. 2015, 3, 70–83. [Google Scholar] [CrossRef]
  3. Kougias, I.; Szabo, S.; Monforti-Ferrario, F.; Huld, T.; Bodis, K. A methodology for optimization of the complementarity between small-hydropower plants and solar PV systems. Renew. Energy 2016, 87, 1023–1030. [Google Scholar] [CrossRef] [Green Version]
  4. Lee, S.; Lee, N.; Choi, H.; Kim, J. Study on Analysis of Suitable Site for Development of Floating Photovoltaic System. J. Korean Inst. Illum. Electr. Instal. Eng. 2012, 26, 30–38. [Google Scholar]
  5. Bansal, A.K.; Kumar, R.; Gupta, R.A. Economic Analysis and Power Management of a Small Autonomous Hybrid Power System (SAHPS) Using Biogeography Based Optimization (BBO) Algorithm. IEEE Trans. Smart Grid 2013, 4, 638–648. [Google Scholar] [CrossRef]
  6. Jadoun, V.K.; Gupta, N.; Niazi, K.R.; Swarnkar, A. Enhanced Particle Swarm Optimization for Short-Term Non-Convex Economic Scheduling of Hydrothermal Energy Systems. J. Electr. Eng. Technol. 2015, 10, 1940–1949. [Google Scholar] [CrossRef] [Green Version]
  7. Bagena, B.; Huang, D.; Singh, C. A new analytical technique for incorporating base loaded energy limited hydro units in reliability evaluation. Electr. Power Syst. Res. 2016, 131, 218–223. [Google Scholar] [CrossRef]
  8. Billinton, R.; Li, W. Reliability Assessment of Electric Power Systems Using Monte Carlo Methods; Plenum Press: New York, NY, USA, 1994. [Google Scholar]
  9. Billinton, R.; Allan, R.N. Reliability Evaluation of Power Systems; Plenum Press: New York, NY, USA, 1996. [Google Scholar]
  10. D’Annunzio, C.; Santoso, S. Noniterative Method to Approximate the Effective Load Carrying Capability of a Wind Plant. IEEE Trans. Energy Convers. 2008, 23, 544–550. [Google Scholar] [CrossRef]
  11. Zhang, P.; Wang, Y.; Xiao, W.; Li, W. Reliability Evaluation of Grid-Connected Photovoltaic Power Systems. IEEE Trans. Sustain. Energy 2012, 3, 379–389. [Google Scholar] [CrossRef]
  12. Karki, R.; Hu, P.; Billinton, R. Reliability Evaluation Considering Wind and Hydro Power Coordination. IEEE Trans. Power Syst. 2010, 25, 685–693. [Google Scholar] [CrossRef]
  13. Andalib-Bin-Karim, C.; Liang, X.; Chowdhury, H.A. Generation Reliability Assessment of Stand-alone Hybrid Power System—A Case Study. In Proceedings of the IEEE International Conference on Industrial Technology (ICIT), Toronto, ON, Canada, 22–25 March 2017. [Google Scholar]
  14. Park, J.; Choi, J. Development of Methodology of New Effective Installed Reserve Rate considering Renewable Energy Generators. Trans. Korean Inst. Electr. Eng. 2010, 59, 26–32. [Google Scholar]
Figure 1. Two-state Model.
Energies 12 00343 g001
Figure 2. Individual and Whole Capacity Model of conventional generators (CGs).
Energies 12 00343 g002
Figure 3. Configuration of photovoltaic (PV) system.
Energies 12 00343 g003
Figure 4. Chronological State Model of PV system.
Energies 12 00343 g004
Figure 5. Chronological State Model of Hydropower Plant.
Energies 12 00343 g005
Figure 6. Flowchart of Reliability Evaluation at the First Stage.
Energies 12 00343 g006
Figure 7. Flow Chart of Reliability Evaluation at the Second Stage.
Energies 12 00343 g007
Figure 8. Concept of effective load carrying capability (ELCC).
Energies 12 00343 g008
Figure 9. Data of Water Inflow, PV Output, and System Demand.
Energies 12 00343 g009
Figure 10. Capacity Models of CGs and PV.
Energies 12 00343 g010
Figure 11. HPP Operation Results Under Vref = 0% and 100%.
Energies 12 00343 g011
Figure 12. Remaining Water Results for Two Cases.
Energies 12 00343 g012
Figure 13. Loss of load probability (LOLP) Results According to Values of Vref.
Energies 12 00343 g013
Figure 14. Results of Total Power Output and Benefit of HPP.
Energies 12 00343 g014
Figure 15. Net Benefit result of HPP.
Energies 12 00343 g015
Figure 16. HPP Results under V r e f = 60%.
Energies 12 00343 g016
Figure 17. ELCC Evaluation Result.
Energies 12 00343 g017
Table 1. Configuration Data of the Test system.
ComponentConfiguration Data and Constraints
CGs N C G = 6 ,   P C G R = 500   kW ,   T C C G = 3000   kW
PV N A = 10 ,   N S = 10 ,   T C P V = 500   kW
Hydro V M a x = 569,500   m 3 ,   V min = 113,900   m 3 , W U s e R = 23,040   m 3 ,   P H R = 1000   kW
Table 2. Reliability Data for Each Component.
ComponentReliability Data
CGs λ C G 0.0016 μ C G 0.0167
PV λ A 0.0033 μ A 0.0417
λ C ,   λ I 0.0024 μ C ,   μ I 0.0278
Hydro λ H 0.0013 μ H 0.0139
Table 3. Detailed Result of Figure 15.
V ref (%)LOEE
(MWh)
RCost
($)
BenefitH
($)
Benefit H Net
($)
0 (=Vmin)23.1334,691.8205,700.3171,008.5
5015.3823,073.1202,617.0179,543.8
6014.2821,423.1201,445.1180,022.1
100 (=VMax)12.1818,275.7146,258.2127,982.5
Table 4. Load carrying capability (ELCC) Evaluation Results.
Test CasesVref (%)System Load (%, kW)ELCC (kW)
Base-1002500-
Case10107.522687.90187.90
Case260114.832870.77370.77
Case3100115.132878.34378.34