Multi-Dimensional Indexes for the Sustainability Evaluation of an Active Distribution Network
Abstract
:1. Introduction
2. Review
2.1. Sustainability Evaluation in Power System Applications
2.2. Multi-Dimension Index System
3. The Index System for the Sustainability Evaluation of an ADN
3.1. The Index System
3.1.1. Economic Indicators (Eco)
3.1.2. Environment Indicators (En)
3.1.3. Society Indicators (Soc)
3.1.4. Operation Indicators (Ope)
3.2. Weighting Method and Aggregated Sustainability Index (SDI)
- Calculate ; ;
- The entropy measure of the jth criterion contrast intensity is ;
- Calculate the normalized weight of each criterion: ; .
4. Simulated Method
4.1. Modeling the Interactions among Multi-Parties and Dynamics under a Long-Term Frame
- The first class is dynamics that can be modeled by a monotonically increasing or decreasing trend, as given in Table 8. As given by the references, population, load demand, O&M costs, and population familiar with new technologies increased over time. The annually averaged electricity price increase was indicated to be slow. The investment of DGPV panels, price of EV batteries, and population familiar with new technologies decreased over time.
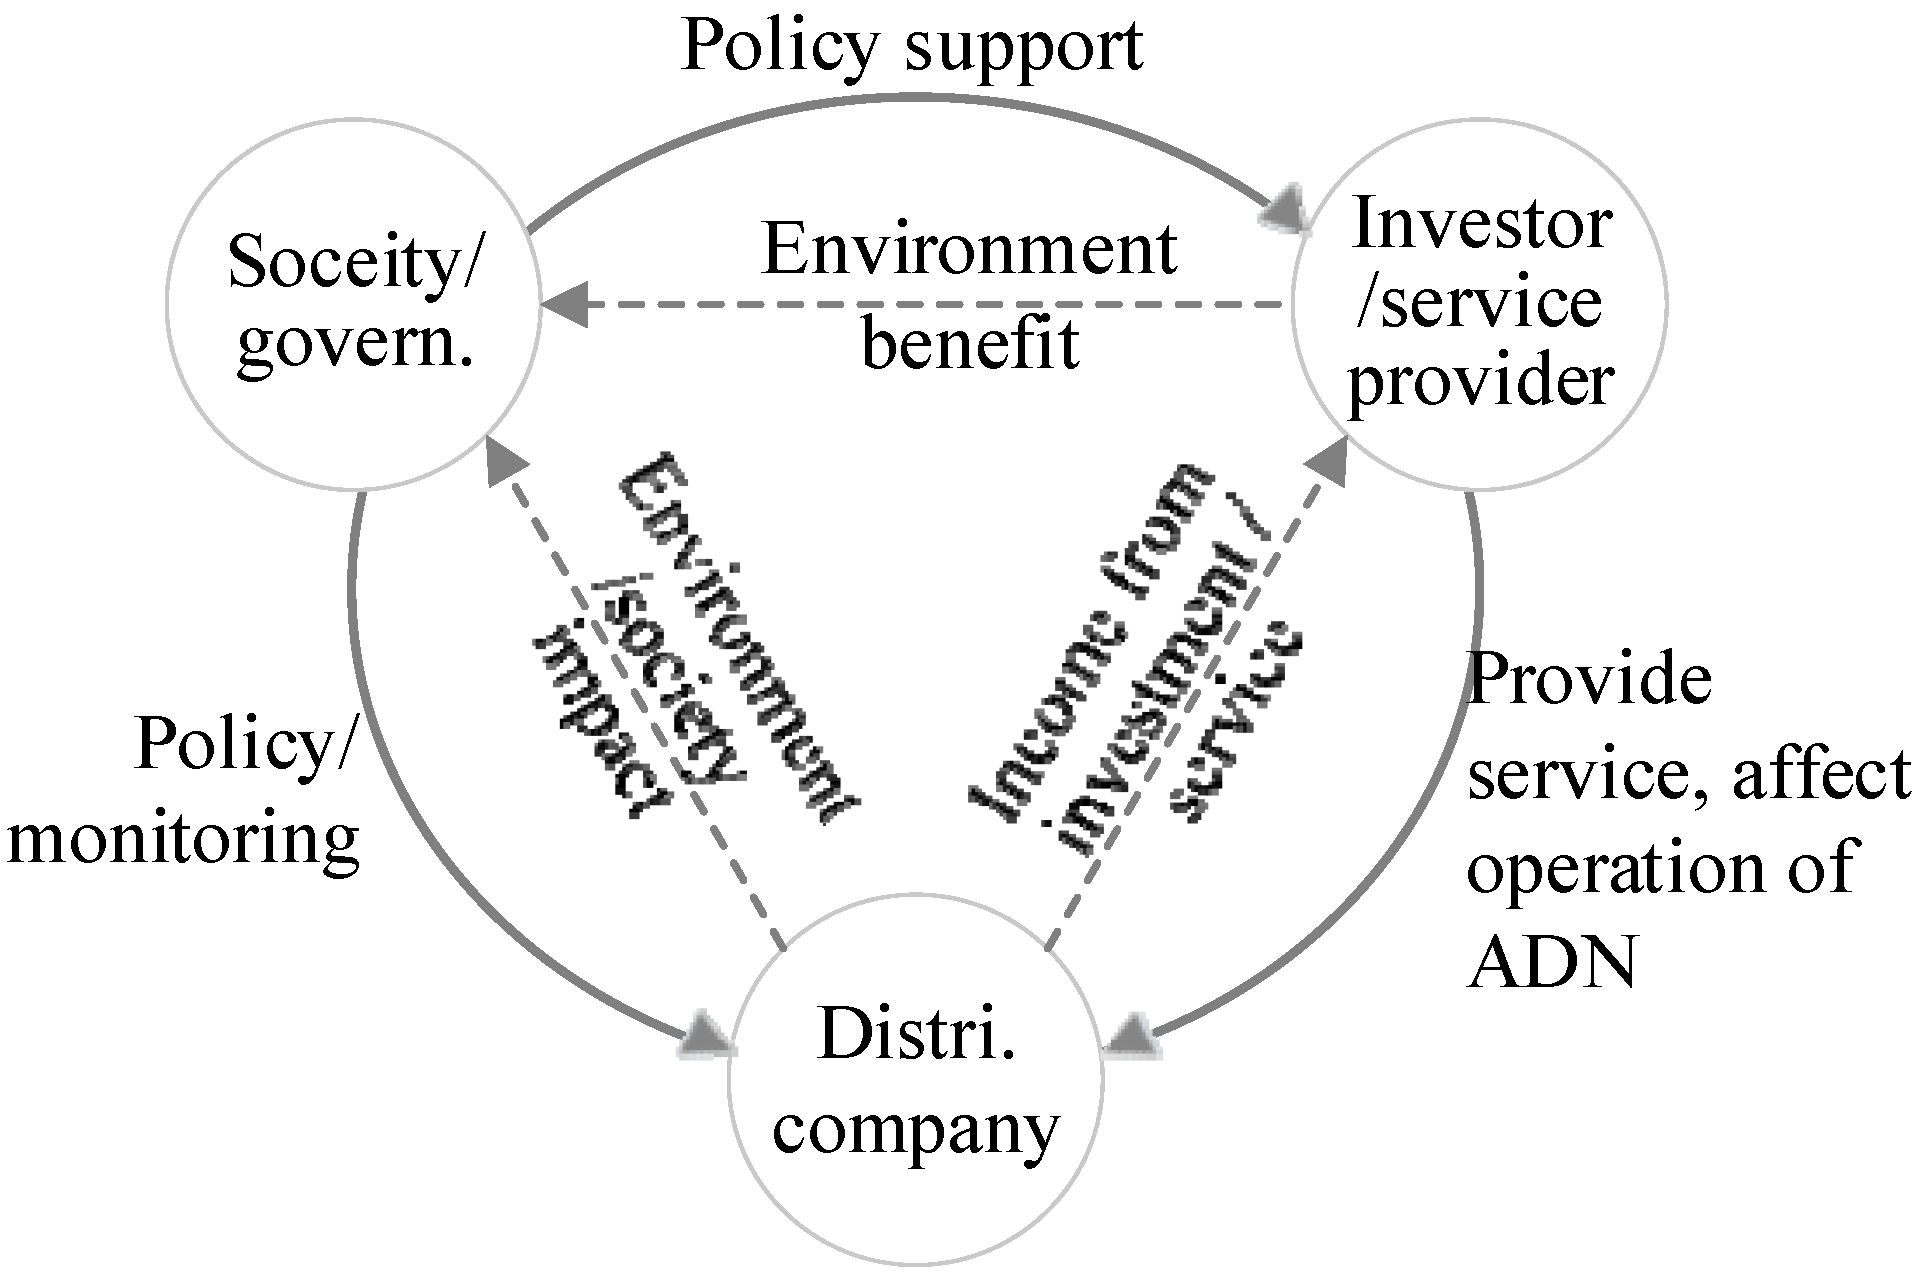
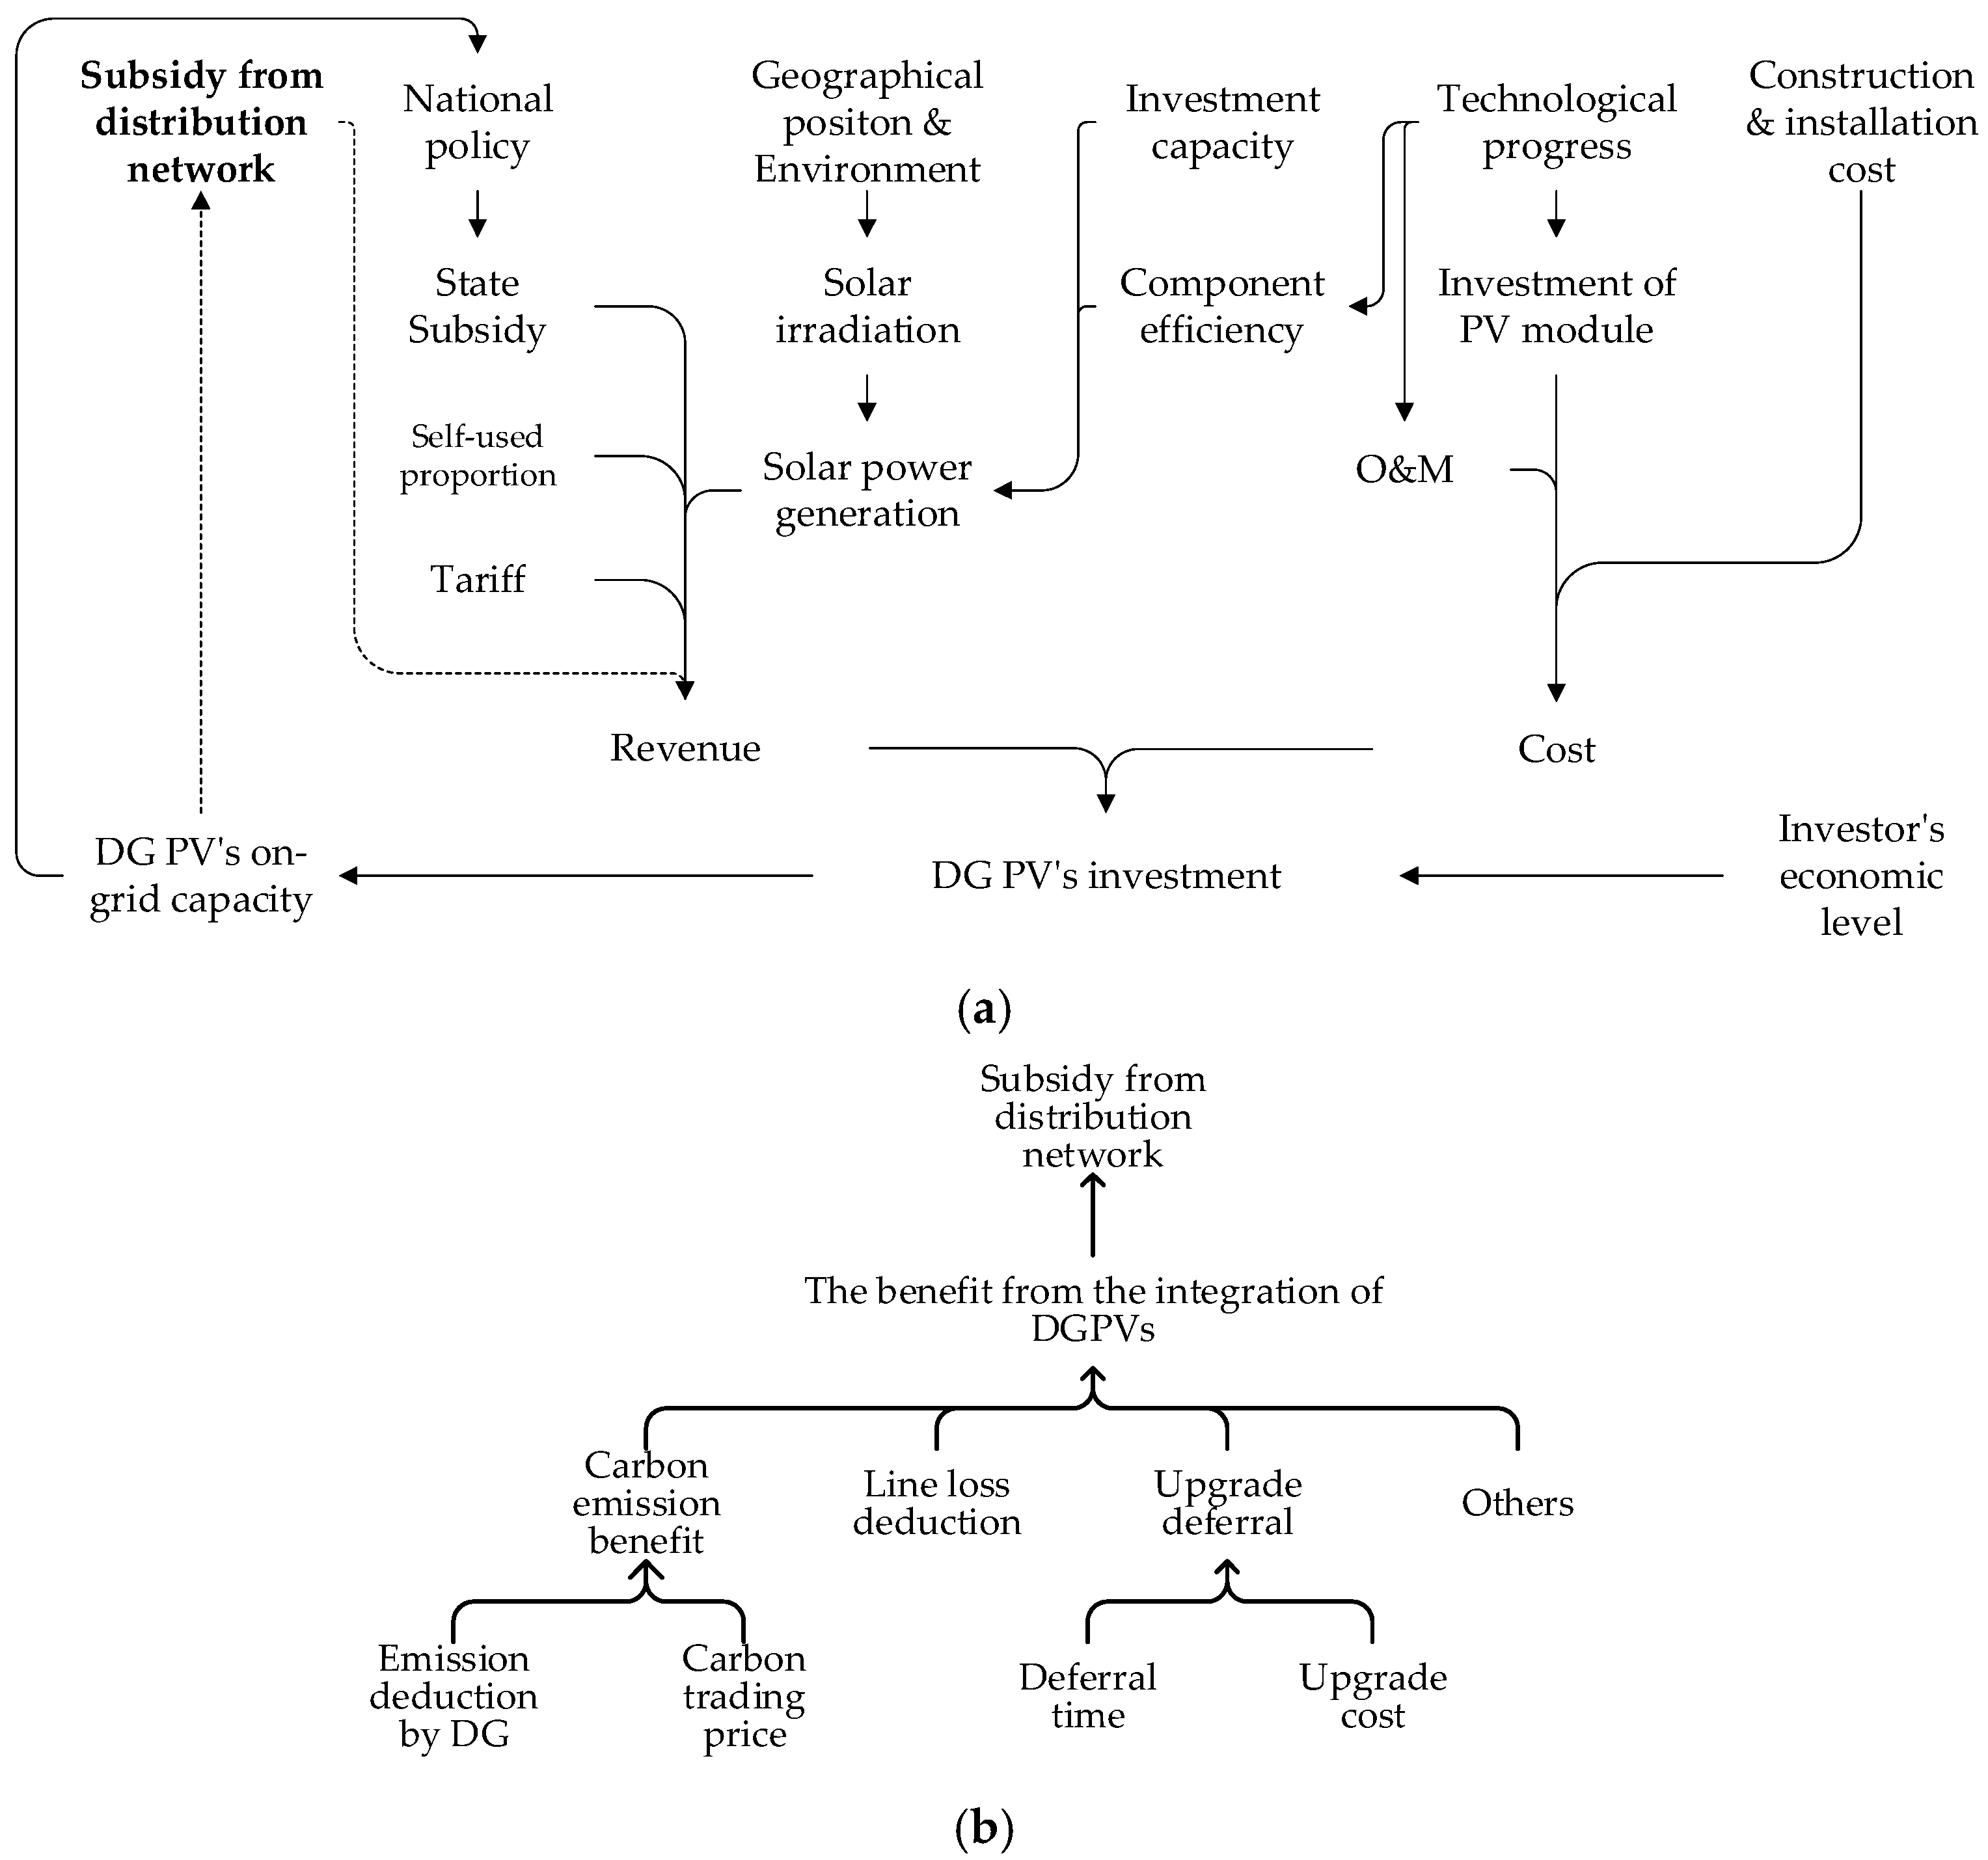
- The second class of dynamics is the interactions among the benefits of the distribution network, DGs, and other investors or service providers, and society and policies, as given in Figure 4. The usage of electricity generated by the DGPV reduces the usage of electricity from conventional generation and defers the upgrade of distribution facilities, which delivers environmental benefits to the society. Incentives from the government are necessary conditions for the development of DGPVs. The integration of large-scale DGPVs brings extra opportunities to the investors and service providers to gain benefits, increases the uncertainty in the operation of the distribution system, but also provides more control flexibility and increases prior investment [5]. The effect of the integration of DGPV into the operation and planning of distribution systems varies with the increase in the integration capacity. Therefore, the benefit obtained from the integration of a DGPV also varies [39], which, in return, affects the investment into DGPVs.
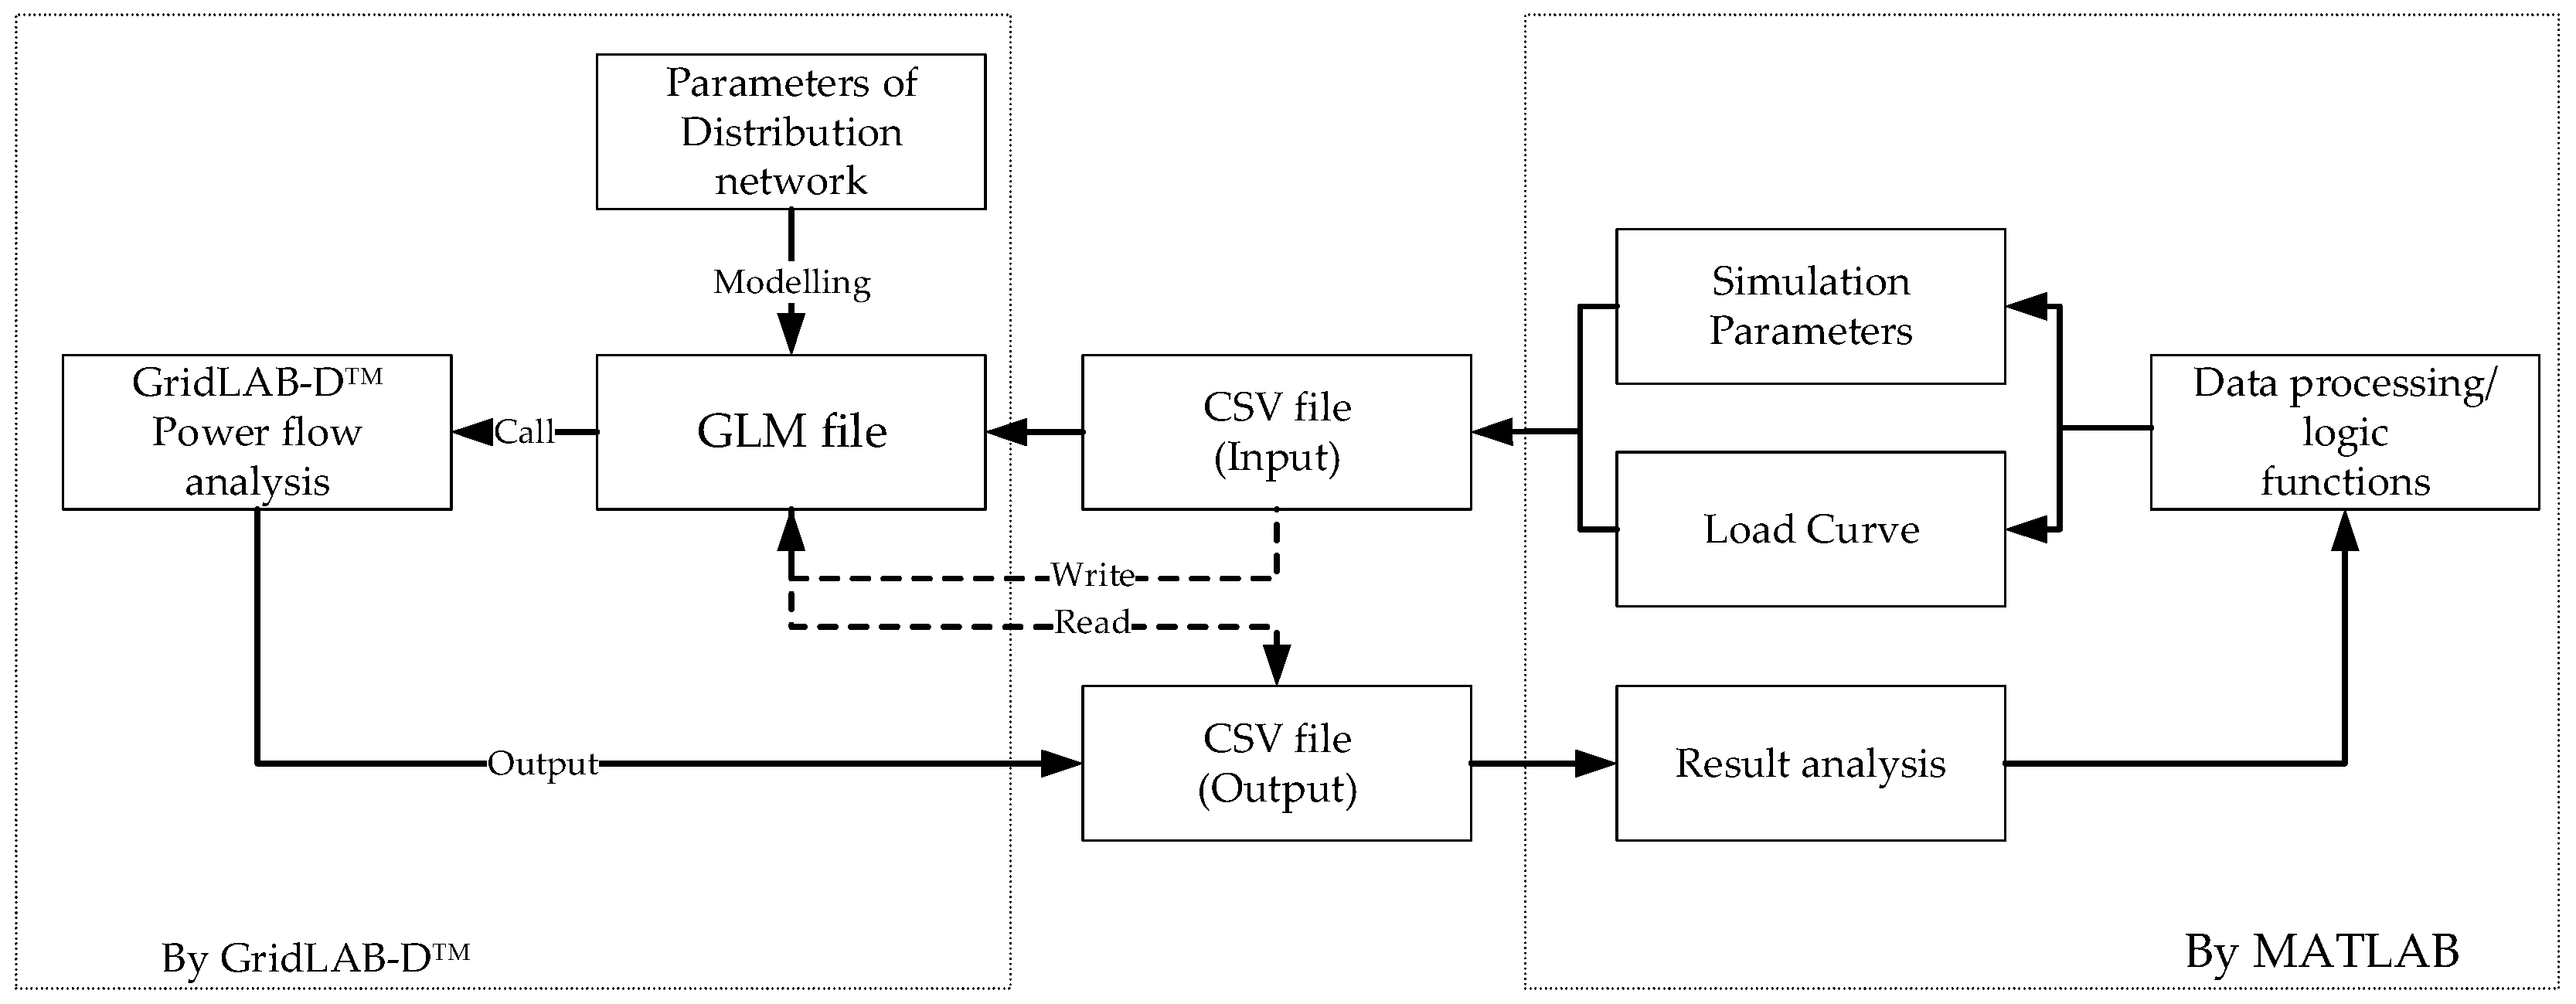
4.2. Simulation Tool
- The distribution lines were upgraded by the methodology given in [39] to meet the reliability requirements of the system;
- The upgrade deferral benefit, the monthly line loss deduction benefit, and the carbon emission benefit were calculated. Please go to [39] for a detailed explanation.
- The distribution benefit and subsidy from distribution network were calculated according to Figure 5b.
- The IRR of the year was calculated, and the 5-year averaged IRR was upgraded.
- The parameters given in Table 8 were upgraded.
4.3. The Estimation of Sub-Indicators
5. Analysis Results and Discussion
5.1. The SDI of the ADN in Group 1 under Different State/Industrial Policies
5.2. SDI Comparison of Different City ADNs
6. Conclusions
Author Contributions
Funding
Conflicts of Interest
Abbreviations
| ADN, ADNs | Active distribution network, active distribution networks |
| PV, PVs | Photo Voltaic, Photo Voltaics |
| DG, DGs | Distribution generation, distribution generations |
| SDI | Sustainable development level |
| EV | Electric vehicle |
| DR | Demand response |
| DGPV | Distributed PV |
| SD | System dynamic |
| R&D | Research & Development |
| LOLP | Loss of load probability |
| ELOE | Expected loss of energy |
| GDP | Gross domestic product |
| DSO | Distribution system operator |
| TSO | Transmission system operator |
| O&M | Operation & Maintenance |
| IRR | Internal return rate |
| SAIDI | The system average interruption duration index |
| SAIFI | The system average interruption frequency index |
| FIT | Feed-in tariff |
| GHI | Global horizontal irradiance |
| MW | 106 Watts |
References
- Picciariello, A.; Reneses, J.; Frias, P.; Soder, L. Distributed generation and distribution pricing: Why do we need new tariff design methodologies? Electr. Power Syst. Res. 2015, 119, 370–376. [Google Scholar] [CrossRef]
- Mirsaeidi, S.; Said, D.M.; Mustafa, M.W.; Habibuddin, M.H.; Ghaffari, K. An analytical literature review of the available techniques for the protection of micro-grids. Int. J. Electr. Power Energy Syst. 2014, 58, 300–306. [Google Scholar] [CrossRef]
- Balamurugan, K.; Srinivasan, D.; Reindl, T. Impact of Distributed Generation on Power Distribution Systems. Energy Procedia 2012, 25, 93–100. [Google Scholar] [CrossRef] [Green Version]
- Medina, R.D.; Romero, A.A.; Mombello, E.E.; Rattá, G. Assessing degradation of power transformer solid insulation considering thermal stress and moisture variation. Electr. Power Syst. Res. 2017, 151, 1–11. [Google Scholar] [CrossRef]
- Horowitz, K.A.; Palmintier, B.; Mather, B.; Denholm, P. Distribution system costs associated with the deployment of photovoltaic systems. Renew. Sustain. Energy Rev. 2018, 90, 420–433. [Google Scholar] [CrossRef]
- Sun, C.; Mi, Z.; Ren, H.; Lu, J.; Chen, Q.; Watts, D.; Zhang, L. Sustainability Evaluation in Power System Related Applications—A Review. In Proceedings of the PowerCon 2016, Wollongong, NSW, Australia, 28 September–1 October 2016. [Google Scholar]
- Musango, J.K.; Brent, A.C. A conceptual framework for energy technology sustainability assessment. Energy Sustain. Dev. 2011, 15, 84–91. [Google Scholar] [CrossRef] [Green Version]
- Santoyo-Castelazo, E.; Azapagic, A. Sustainability assessment of energy systems: Integrating environmental, economic and social aspects. J. Clean. Prod. 2014, 80, 119–138. [Google Scholar] [CrossRef]
- Helms, T.; Loock, M.; Bohnsack, R. Timing-based business models for flexibility creation in the electric power sector. Energy Policy 2016, 92, 348–358. [Google Scholar] [CrossRef]
- Luthra, S.; Mangla, S.K.; Kharb, R.K. Sustainable assessment in energy planning and management in India perspective. Renew. Sustain. Energy Rev. 2015, 47, 58–73. [Google Scholar] [CrossRef]
- Guo, X.; Guo, X. China’s photovoltaic power development under policy incentives: A system dynamics analysis. Energy 2015, 93, 589–598. [Google Scholar] [CrossRef]
- Han, J.; Tan, Z. Models for evolution of China electricity system in long run. Syst. Eng. Theory Pract. 2010, 30, 1521–1529. [Google Scholar]
- Iddrisu, I.; Bhattacharyya, S.C. Sustainable Energy Development Index: A multi-dimensional indicator for measuring sustainable energy development. Renew. Sustain. Energy Rev. 2015, 50, 513–530. [Google Scholar] [CrossRef] [Green Version]
- Golušin, M.O.; Ivanović, M.; Redžepagić, S. Transition from traditional to sustainable energy development in the region of Western Balkans–Current level and requirements. Appl. Energy 2013, 101, 182–191. [Google Scholar] [CrossRef]
- Schlor, H.; Fischer, W.; Hake, J.-F. Methods of measuring sustainable development of the German energy sector. Appl. Energy 2013, 101, 172–181. [Google Scholar] [CrossRef]
- Angelis-Dimakis, A.; Arampatzis, G.; Assimacopoulos, D. Monitoring the sustainability of the Greek energy system. Energy Sustain. Dev. 2012, 16, 51–56. [Google Scholar] [CrossRef] [Green Version]
- Sharma, T.; Balachandra, P. Benchmarking sustainability of Indian electricity system: An indicator approach. Appl. Energy. 2015, 142, 206–220. [Google Scholar] [CrossRef] [Green Version]
- Doukas, H.; Papadopoulou, A.; Savvakis, N.; Tsoutsos, T.; Psarras, J. Assessing energy sustainability of rural communities using Principal Component Analysis. Renew. Sustain. Energy Rev. 2012, 16, 1949–1957. [Google Scholar] [CrossRef]
- Prete, C.L.; Hobbs, B.F.; Norman, C.S.; Cano-Andrade, S.; Fuentes, A.; Von Spakovsky, M.R.; Mili, L. Sustainability and reliability assessment of microgrids in a regional electricity market. Energy 2012, 41, 192–202. [Google Scholar] [CrossRef]
- Mainali, B.; Silveira, S. Using a sustainability index to assess energy technologies for rural electrification. Renew. Sustain. Energy Rev. 2015, 41, 1351–1365. [Google Scholar] [CrossRef]
- Dombi, M.; Kuti, I.; Balogh, P. Sustainability assessment of renewable power and heat generation technologies. Energy Policy 2014, 67, 264–271. [Google Scholar] [CrossRef]
- Maxim, A. Sustainability assessment of electricity generation technologies using weighted multi-criteria decision analysis. Energy Policy 2014, 65, 284–297. [Google Scholar] [CrossRef]
- Liu, J.; Zuo, J.; Sun, Z.; Zillante, G.; Chen, X. Sustainability in hydropower development—A case study. Renew. Sustain. Energy Rev. 2013, 19, 230–237. [Google Scholar] [CrossRef]
- Karger, C.R.; Hennings, W. Sustainability evaluation of decentralized electricity generation. Renew. Sustain. Energy Rev. 2009, 13, 583–593. [Google Scholar] [CrossRef]
- Afgan, N.H.; Carvalho, M.G.; Carvalho, M.D.G. Sustainability assessment of a hybrid energy system. Energy Policy 2008, 36, 2903–2910. [Google Scholar] [CrossRef]
- Stamford, L.; Azapagic, A. Sustainability indicators for the assessment of nuclear power. Energy 2011, 36, 6037–6057. [Google Scholar] [CrossRef]
- Stamford, L.; Azapagic, A. Life cycle sustainability assessment of electricity options for the UK. Int. J. Energy Res. 2012, 36, 1263–1290. [Google Scholar] [CrossRef]
- Simsek, Y.; Watts, D.; Escobar, R. Sustainability evaluation of Concentrated Solar Power (CSP) projects under Clean Development Mechanism (CDM) by using Multi Criteria Decision Method (MCDM). Renew. Sustain. Energy Rev. 2018, 93, 421–438. [Google Scholar] [CrossRef]
- Poudineh, R.; Jamasb, T. Distributed generation, storage, demand response and energy efficiency as alternatives to grid capacity enhancement. Energy Policy 2014, 67, 222–231. [Google Scholar] [CrossRef] [Green Version]
- Heydarian-Forushani, E.; Golshan, M.E.H.; Siano, P.; Golshan, M.E.H. Evaluating the Operational Flexibility of Generation Mixture with an Innovative Techno-Economic Measure. IEEE Trans. Power Syst. 2018, 33, 2205–2218. [Google Scholar] [CrossRef]
- Bri-Mathias Hodge. Renewable Energy Integration from Resource Assessment to Power System Impacts. Available online: http://inside.mines.edu/UserFiles/File/Nuclear/Bri-Mathius%20seminar.pdf (accessed on 22 January 2019).
- Lund, P.D.; Lindgren, J.; Mikkola, J.; Salpakari, J. Review of energy system flexibility measures to enable high levels of variable renewable electricity. Renew. Sustain. Energy Rev. 2015, 45, 785–807. [Google Scholar] [CrossRef] [Green Version]
- D’Hulst, R.; Labeeuw, W.; Beusen, B.; Claessens, S.; Deconinck, G.; Vanthournout, K. Demand response flexibility and flexibility potential of residential smart appliances: Experiences from large pilot test in Belgium. Appl. Energy 2015, 155, 79–90. [Google Scholar] [CrossRef]
- Munshi, A.A.; Mohamed, Y.A.-R.I. Extracting and Defining Flexibility of Residential Electrical Vehicle Charging Loads. IEEE Trans. Ind. Inform. 2018, 14, 448–461. [Google Scholar] [CrossRef]
- Statistics of Population Growth Rate in China in 2014. Available online: http://data.stats.gov.cn/easyquery.htm?cn=C01&zb=A0302&sj=2014 (accessed on 26 March 2016).
- Li, W. Risk Analysis of Power Systems—Models, Methods, and Applications; John Wiley & Sons: Hoboken, NJ, USA, 2005. [Google Scholar]
- Zhang, F.; Deng, H.; Margolis, R.; Su, J. Analysis of distributed-generation photovoltaic deployment, installation time and cost, market barriers, and policies in China. Energy Policy 2015, 81, 43–55. [Google Scholar] [CrossRef] [Green Version]
- Jeon, C.; Shin, J. Long-term renewable energy technology valuation using system dynamics and Monte Carlo simulation: Photovoltaic technology case. Energy 2014, 66, 447–457. [Google Scholar] [CrossRef]
- Sun, C.; Mi, Z.; Ren, H.; Wang, F.; Chen, J.; Watts, D.; Lu, J. Study on the Incentives Mechanism for the Development of Distributed Photovoltaic Systems from a Long-Term Perspective. Energies 2018, 11, 1291. [Google Scholar] [CrossRef]
- Zhang, Y.; Peng, X.; Du, M.; Zhou, B.; Li, Z. Research on comprehensive compensation mechanism of distributed generation. Power Demand Side Manag. 2015, 17, 13–20. [Google Scholar]

| Ref. | Pub. Time | Reg. | Time Frame | Scope | Dimension/Indicators | Methods | Main Contributions |
|---|---|---|---|---|---|---|---|
| [10] | 2015 | India | - | National level, power system | 5/26 | Sensitivity analysis Fuzzy AHP method | Proposes a decision framework for policy makers to assess the sustainability in energy systems. Sensitivity analysis is provided. |
| [13] | 2015 | Multiple countries | - | Energy system | 5/11 | - | Provides a review of the indicator sustainable energy development index (SEDI). Provides a correlation analysis of SEDI and other well-accepted indexes. Twenty countries are ranked by SEDI. |
| [14] | 2013 | Balkans | - | Regional level | 3/10 | - | National energy development in six countries in the Balkan area. A composite index by weighted summation of indicators is provided. |
| [15] | 2013 | German | 1997–2050 | National energy system | 3/7 | - | SE of the German power sector. Provides two aggregated indexes, and considers the over-fulfillment issue. Compares the equal pillar method and the equal indicator method. |
| [16] | 2012 | Greece | Recent 50 years | National energy system | 3/9 | - | Provides the evolution of sustainability indexes of Greek energy systems. |
| [17] | 2015 | India | - | National energy system | 4/85 | - | Provides threshold values, and accounts for attributes in various dimensions to give better understanding of the position of India. Provides a method to construct the baseline for electricity sustainability indicators. Proposes the National Electricity System Sustainability Index (NESSI) |
| [18] | 2012 | European community | - | Rural electrification | -/9 | Principle component analysis (PCA) | Proposes the Energy Sustainability Index (ESI). Compares eight rural (mountainous, agricultural, and island) communities in different countries. |
| [19] | 2012 | Northwest Europe | - | Micro-grid | 4/11 | Sensitivity analysis, scenario analysis | A power market model (COMPETES models are applied to 12 power producers in four countries) and reliability evaluation model are imbedded. |
| [20] | 2015 | Sweden | 2005, 2010, 2015 | Generation technology for rural electrification | 5/11 | PCA | Proposes the ETSI (Energy Technology Sustainability Index). |
| [21] | 2014 | Hungary | - | Generation & heat technologies | -/7 | - | Sustainability assessment of 10 generation technologies and seven technologies of heat supply. Weights of indicators are decided by a survey. |
| [22] | 2014 | Romania | - | Generation technologies | 4/10 | Weighted sum Multi-attribute utility method | Proposes a sustainability assessment framework and ranks 13 generation technologies. Uses numerical valuation approaches for missing data. |
| [8] | 2014 | Mexico | - | Generation technologies | -/17 | Scenario analysis, life-cycle analysis, SMART | Eleven scenarios. The results suggested that trade-offs are obligatory to identify the ‘most sustainable’ option. |
| [23] | 2013 | China | - | Hydro power development | 3/- | -- | Three Gorges Project evaluation. |
| [24] | 2009 | German | - | Distributed generation technologies | 5/19 | Scenario analysis, value tree analysis | -- |
| [25] | 2008 | Belgium | - | Multi-generation technologies | -/5 | Sensitivity analysis of weight coefficients | SE of power system with hybrid generation technologies (four generation technologies) |
| [26,27] | 2011/2012 | UK | - | Nuclear generation technologies | 3/43 | Life-cycle analysis | Proposes a decision framework for policy makers to assess the sustainability of energy systems. A sensitivity analysis is provided |
| [28] | 2018 | Multiple countries | - | Concentrated solar power projects | 4/10 | Multiple weighting comparison | Proposes a framework and provides a method of understanding for decision makers to evaluate the sustainability of CDM energy projects. Provides perceptions to future installations and further insights for the development of sustainable CDM energy projects around the world. |
| Economic Indicators | Classification |
|---|---|
| Investment opportunities | Class 1 indicators: investment opportunities |
| GDP | |
| Availability of funds | |
| Cross-subsidization | |
| Energy productivity | Class 2 indicators: related to techniques |
| Economic effectiveness | |
| Energy raw material productivity | |
| Fuel cost | |
| Capital and energy levelized cost | |
| Payback period | |
| Net profit on capita | |
| Competitiveness of economy | |
| Affordability | |
| Operational life | |
| Offsetting infrastructure cost | Class 3 indicators: others |
| R&D expenditure | |
| Economic sustainability | |
| Savings on greenhouse gas emissions |
| Environment Indicators | Classification |
|---|---|
| Emissions, pollutants | Class 1 indicators: direct effect on environment |
| Carbon emission | |
| Land use | |
| Water use | |
| Air quality in the region | |
| Fossil fuel depletion | |
| Noise and light pollution | |
| Soil quality degradation | |
| Land transformation | |
| Use of chemicals | |
| Freshwater eutrophication | |
| Interference in the landscape | |
| Need for waste disposal | |
| Climate-related problems and issues | |
| Acidification potential | |
| Resource efficiency | |
| Biodiversity and ecological impact | Class 2 indicators: indirect effect |
| The impact of local residential life | |
| Adoption of independently audited environmental management system | Class 3 indicators: administrative measures |
| Environmental management |
| Social Indicators | Classification |
|---|---|
| Job creation and employment | Class 1 indicators: direct |
| Salary | |
| Improved service availability | |
| Social benefits | |
| Cultural heritage protection | |
| Impact on the local economy | Class 2 indicators: indirect |
| Impact on human health | |
| Impact on life quality | |
| Effect on surrounding region | |
| Energy security of households | |
| Eliminating social inequality | |
| Social acceptance | Class 3 indicators: |
| Local government support | |
| Public support | |
| Feasibility | |
| Shaping new energy culture | Class 4 indicators: administrative or comprehensive indicators |
| Risk analysis and management | |
| Compatibility with political, legislative framework | |
| Fatalities |
| Technical Indicators | Classification |
|---|---|
| Efficiency | Class 1 indicator: related to efficiency and its calculation |
| Exergy efficiency | |
| Transmission loss | |
| Distribution loss | |
| Capacity factor | |
| Reserve/production ratio | |
| Storage hours | |
| Demand | |
| Potential power generation | |
| Direct energy consumption | |
| Operation temperature | |
| Reliability | |
| Duration of plant power outage | Class 2 indicator: performance |
| Network availability | |
| Continuity and predictability of performance | |
| Safety of energy system | |
| Hybridization | |
| Micro grid suitability | Class 3 indicator: integrated ones |
| Technology maturity | |
| Augmentation capability |
| Dimension | National Energy System | Power System | Micro-Grid |
|---|---|---|---|
| Economic | Energy productivity | Payback period, economic efficiency, investment opportunity | Annualized capital costs |
| Environmental | Emissions, land use, | Emissions and management, land use and management | Emissions |
| Social | Employment | Societal equity, human health, social acceptance, cultural, living standard | - |
| Technical, operational, reliability | Reliability, flexibility | Reliability, flexibility, resource allocation and usage, diversification in source. | Electric efficiency, Loss of load probability (LOLP), Expected loss of energy (ELOE) |
| Economic Dimension | Environment Dimension | Social Dimension | Operation Dimension |
|---|---|---|---|
| 1. Investment opportunity | 1. Pollutant | 1. Employment | 1. Energy efficiency |
| 2. Economic efficiency | 2. Land use | 2. Acceptance of new technology | 2. Variability |
| 3. Climate | 3. Renewable energy consumption per capita | 3. Reliability | |
| 4. Air quality | 4. Income level | 4. Flexibility | |
| 5. Impact on life quality |
| Annually Changed Factors | Trend | Percentage and Explanation |
|---|---|---|
| Population | Up | +0.5%/year [35] |
| Load demand | Up | +2%/year [36] |
| O&M costs | Up | +2.5%/year [37] |
| Electricity price | Up | +1%/year, based on historical data [37] |
| Investment of distributed PV panels | Down | Predicted based on the two-factor learning curve [38] |
| Population interested in new technology | Up | +5% to reflect the increase of awareness of new technology |
| Data by GridLAB-DTM/MATLAB | Data by Estimation | Description |
|---|---|---|
| System Demand | - | - |
| Losses | ||
| Voltage | ||
| Power flow | ||
| SAIDI/SAIFI | ||
| Distribution line margin | ||
| - | Reliability | Estimated by SAIDI (The system average interruption duration index) and SAIFI (The system average interruption frequency index), voltage quality, and power flow margin |
| O&M cost | Estimated by the size of the distribution system and the integration capacity of renewable generations | |
| Auxiliary service secured | Estimated by the capacity of the DGPV with voltage control capability | |
| Income from data service | Omitted in the simulation | |
| Income from balancing service | Omitted in the simulation | |
| Electricity purchasing cost | Cost of purchasing electricity from the transmission network and DGPV/energy storage/EV | |
| Income of electricity selling | Estimated by the load mix of each city and the tariff for the residential load, commercial load, and industrial load | |
| Integration cost | No integration fee is charged right now in China | |
| Upgrade cost | Calculated by the method given in the Appendix of [39] | |
| Capacity of integrated DG | Estimated by the model given in [39] | |
| Energy efficiency | Estimated by the capacities of the distribution devices and load demand |
| Cases | FIT |
|---|---|
| Case 1 | state FIT = 0.42 CNY/kWh |
| Case 2 | 0.9 × state FIT + Distribution benefit |
| Case 3 | 0.8 × state FIT + Distribution benefit |
| Case 4 | 0.7 × state FIT + Distribution benefit |
| Case 5 | 0.6 × state FIT + Distribution benefit |
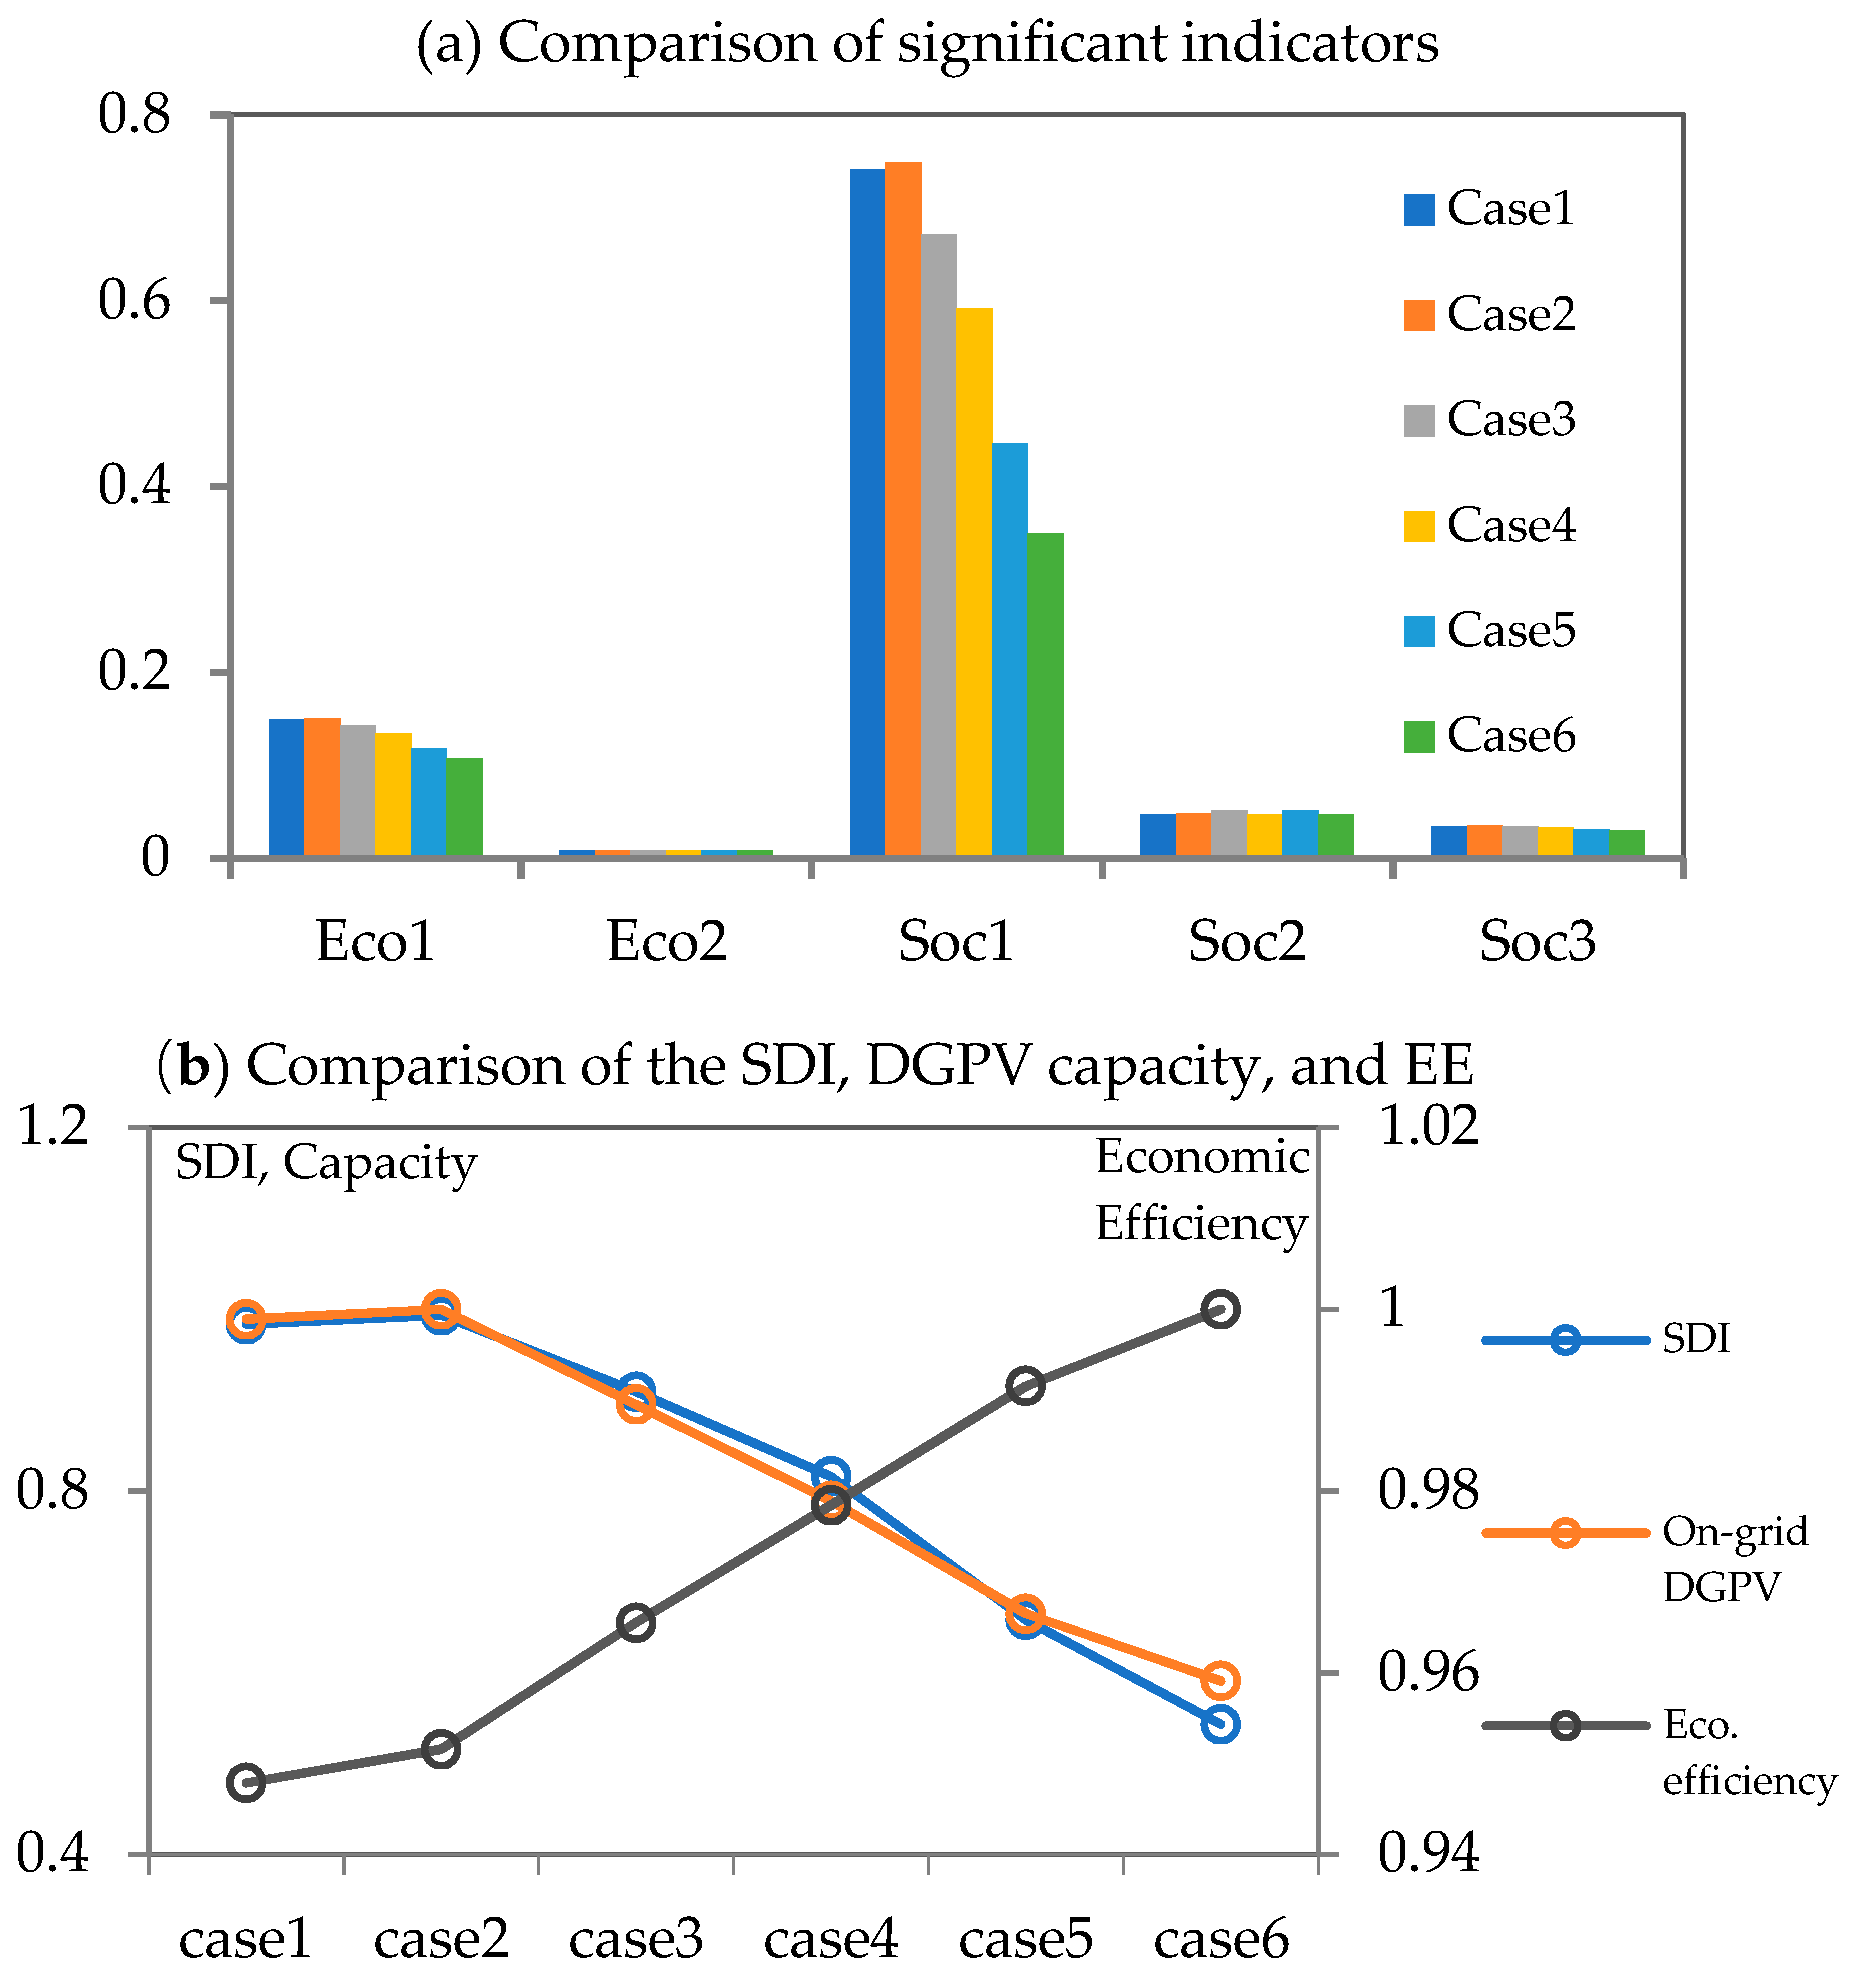
| Case 6 | 0.5 × state FIT + Distribution benefit |
| Case 1 | Case 2 | Case 3 | Case 4 | Case 5 | Case 6 |
|---|---|---|---|---|---|
| 17.4% | 17.6% | 15.7% | 13.9% | 11.7% | 10.4% |
| Items | Beijing | Ningbo | Chengdu |
|---|---|---|---|
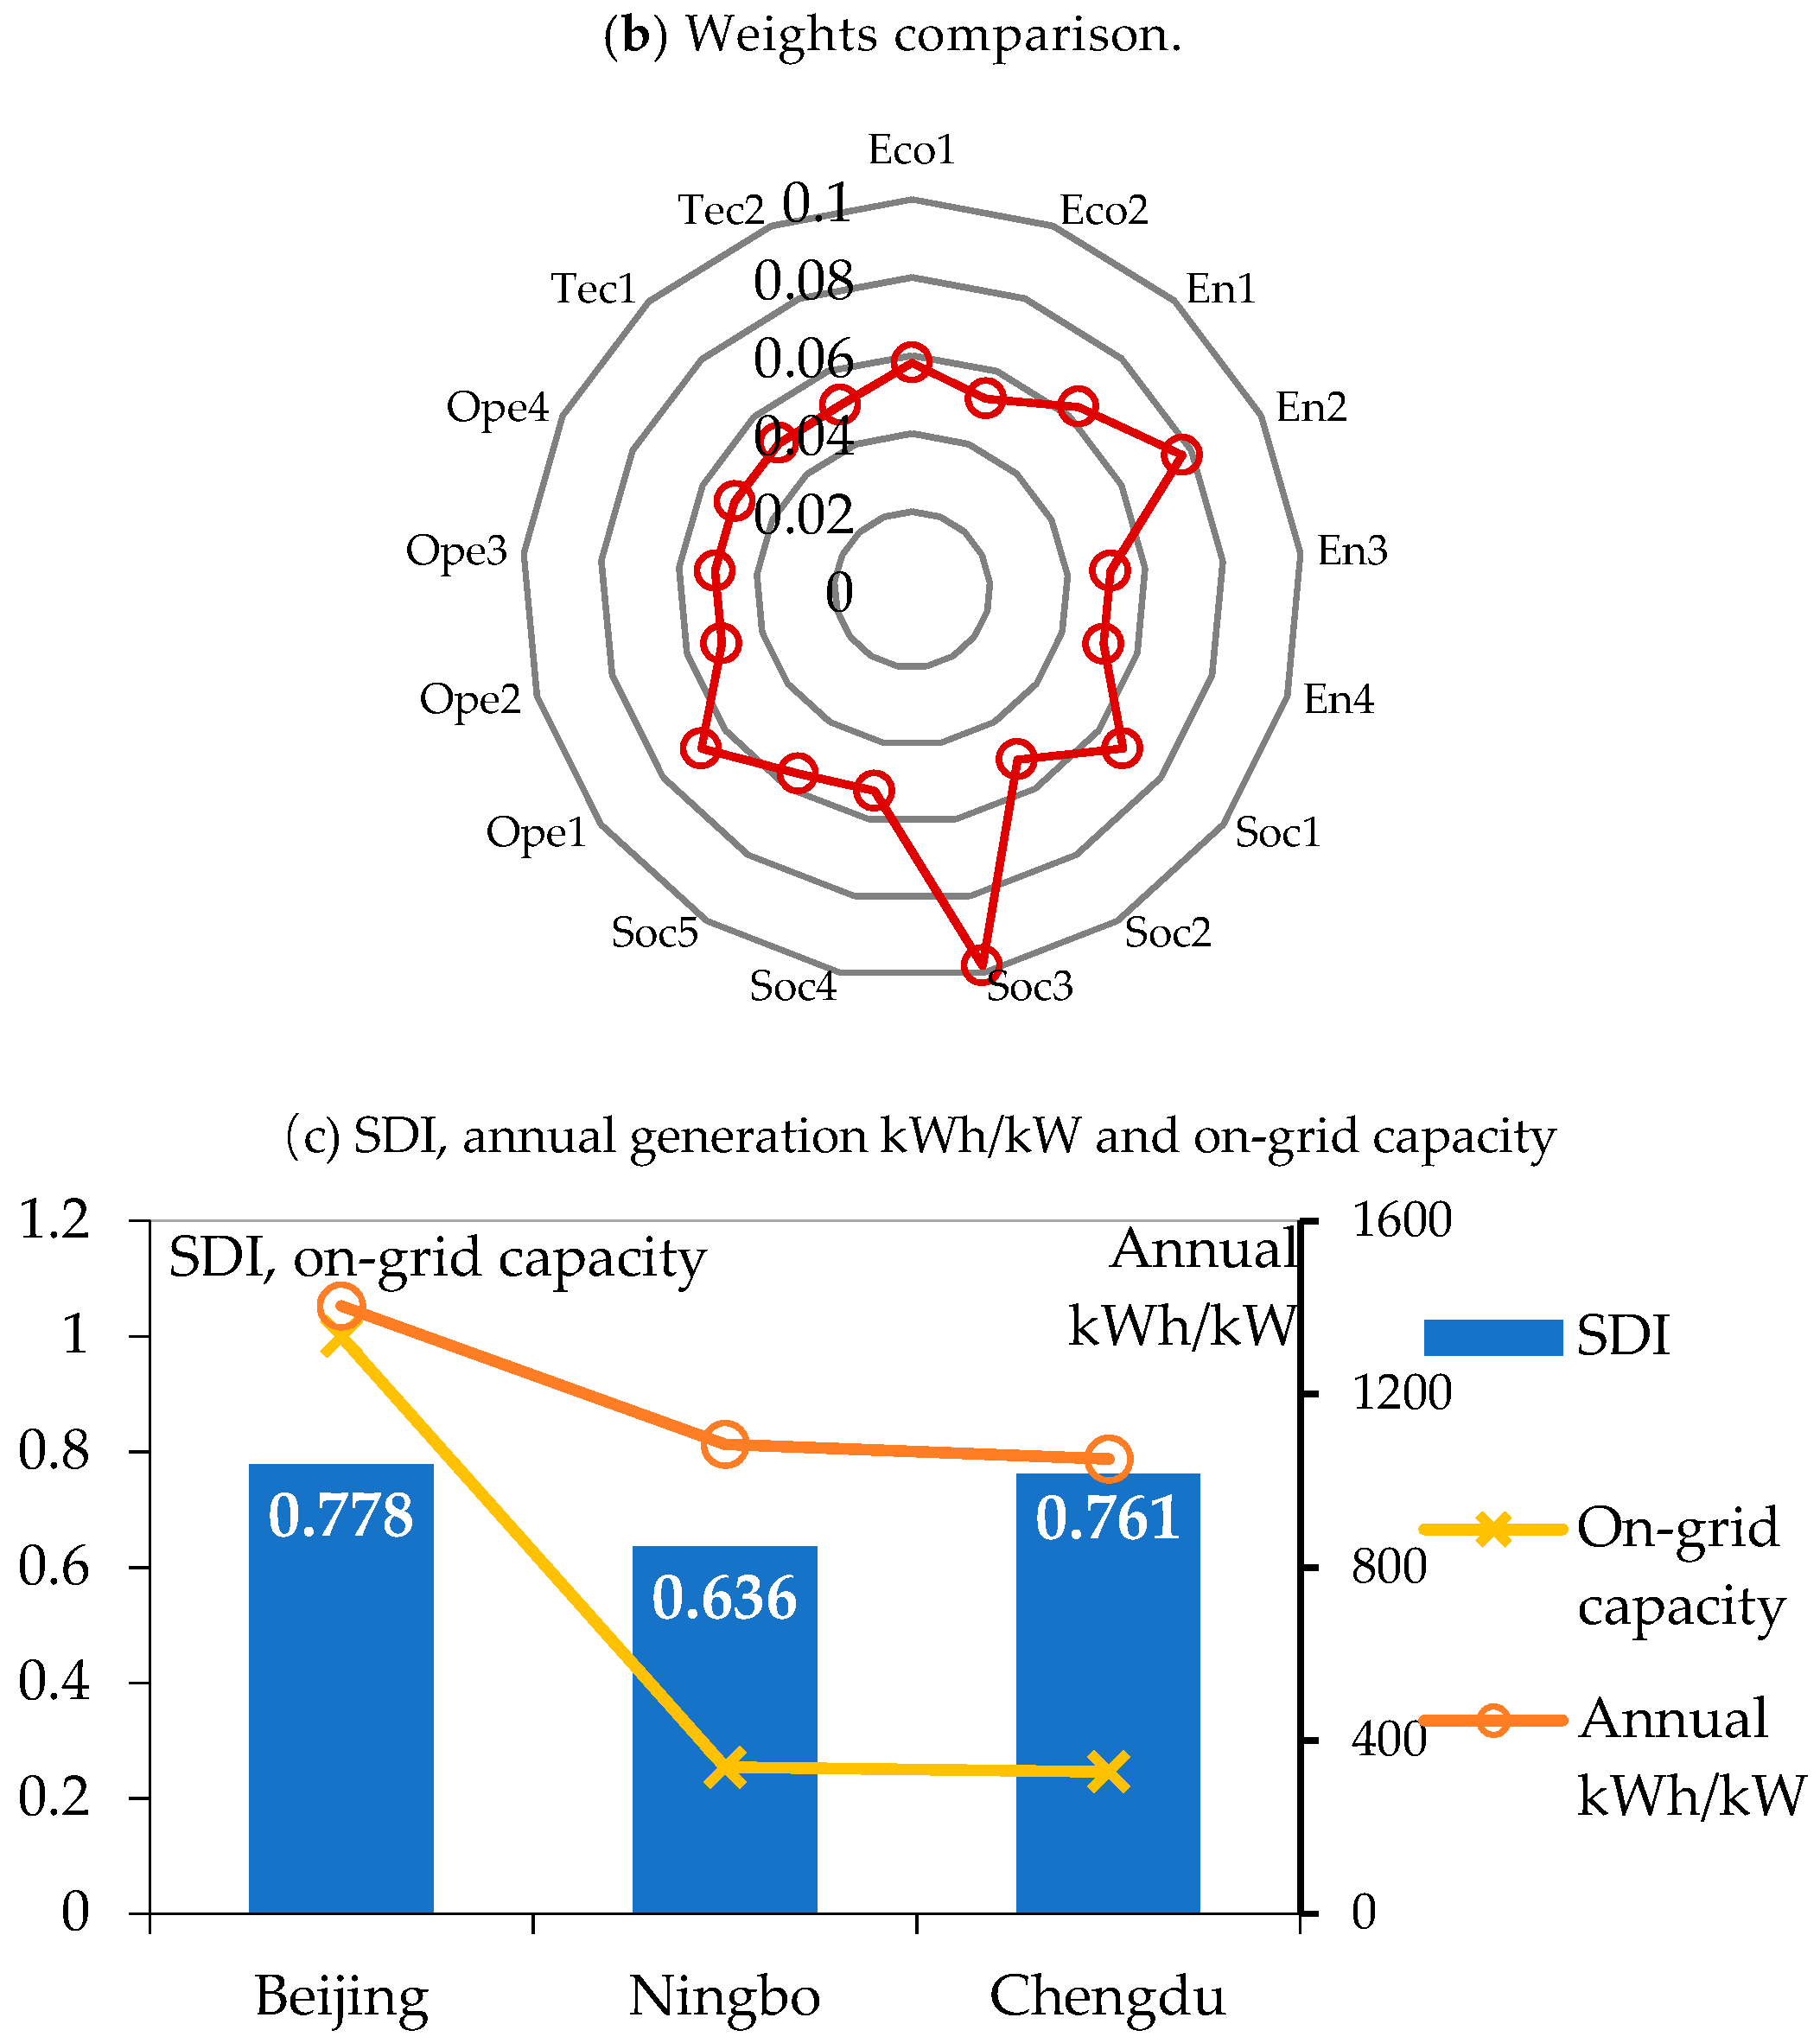
| DGPV’s annual generation (kWh/kW) * | 1404 | 1084 | 1050 |
| Population (104) | 2172.9 | 787 | 2030 |
| State subsidy + city subsidy (Yuan/kWh) | 0.37 + 0.3 | 0.37 + 0.15 | 0.37 + 0 |
| Standardized income level by average salary | 1 | 0.609 | 0.675 |
| Percentage of renewable generation at the transmission level | 0.08 | 0.193 | 0.835 |
| Item | Beijing | Ningbo | Chengdu |
|---|---|---|---|
| Economic Efficiency | 1 | 0.591 | 0.743 |
© 2019 by the authors. Licensee MDPI, Basel, Switzerland. This article is an open access article distributed under the terms and conditions of the Creative Commons Attribution (CC BY) license (http://creativecommons.org/licenses/by/4.0/).
Share and Cite
Sun, C.; Mi, Z.; Ren, H.; Jing, Z.; Lu, J.; Watts, D. Multi-Dimensional Indexes for the Sustainability Evaluation of an Active Distribution Network. Energies 2019, 12, 369. https://doi.org/10.3390/en12030369
Sun C, Mi Z, Ren H, Jing Z, Lu J, Watts D. Multi-Dimensional Indexes for the Sustainability Evaluation of an Active Distribution Network. Energies. 2019; 12(3):369. https://doi.org/10.3390/en12030369
Chicago/Turabian StyleSun, Chenjun, Zengqiang Mi, Hui Ren, Zhipeng Jing, Jinling Lu, and David Watts. 2019. "Multi-Dimensional Indexes for the Sustainability Evaluation of an Active Distribution Network" Energies 12, no. 3: 369. https://doi.org/10.3390/en12030369
APA StyleSun, C., Mi, Z., Ren, H., Jing, Z., Lu, J., & Watts, D. (2019). Multi-Dimensional Indexes for the Sustainability Evaluation of an Active Distribution Network. Energies, 12(3), 369. https://doi.org/10.3390/en12030369


