1. Introduction
Although CO
as refrigerant is well known for having the lowest global warming potential (GWP) [
1], and fully commercial domestic heat pump water heater systems (HPWH) exist, its long expected widespread use has not fully unfolded [
2].
Indeed, CO
poses some technological difficulties with respect to conventional refrigerants. The high pressure ratio between the evaporator and the cooler necessarily requires double stage compression for reasonable performance, for instance. However, proven technology exists for all devices [
3], and other solutions could be studied, for example using CO
blends, as is being done for power cycles [
4].
Moreover, numerous studies show that the coefficient of performance (COP) of CO
HPWHs can compare favourably to conventional ones [
5]. This, however, requires taking into consideration a number of issues in the design and operating conditions of the system.
Control of the electronic expansion valve EEV as a function fo the refrigerant charge affects COP significantly [
6]. Real time control of the discharge pressure as a function of the compressor power consumption, discharge pressure and water outlet temperature can optimise COP [
7].
The most sensitive factor for performance and at the same time the greatest potential of CO
HPWH lies in the heat exchange with the water [
1]. This must take place in the 9–10 MPa range, because of the particular location of the critical point in the pressure-enthalpy diagram [
5], making the cycle transcritical, and to ensure good thermal conductivity in the CO
side [
3].
The temperature of CO
in the gas cooler will fall steeply as a consequence, and the temperature profile on the water side will thus determine the efficiency of the heat exchange and of the heat pump. A matching rise of the water temperature will allow high COP, while low temperature rises will cause poor performance. In fact, forcing the heat pump to always heat the water side as much as possible, to cause the greatest stratification in the tank, and regulating the water supply temperature by mixing, can increase COP significantly [
8].
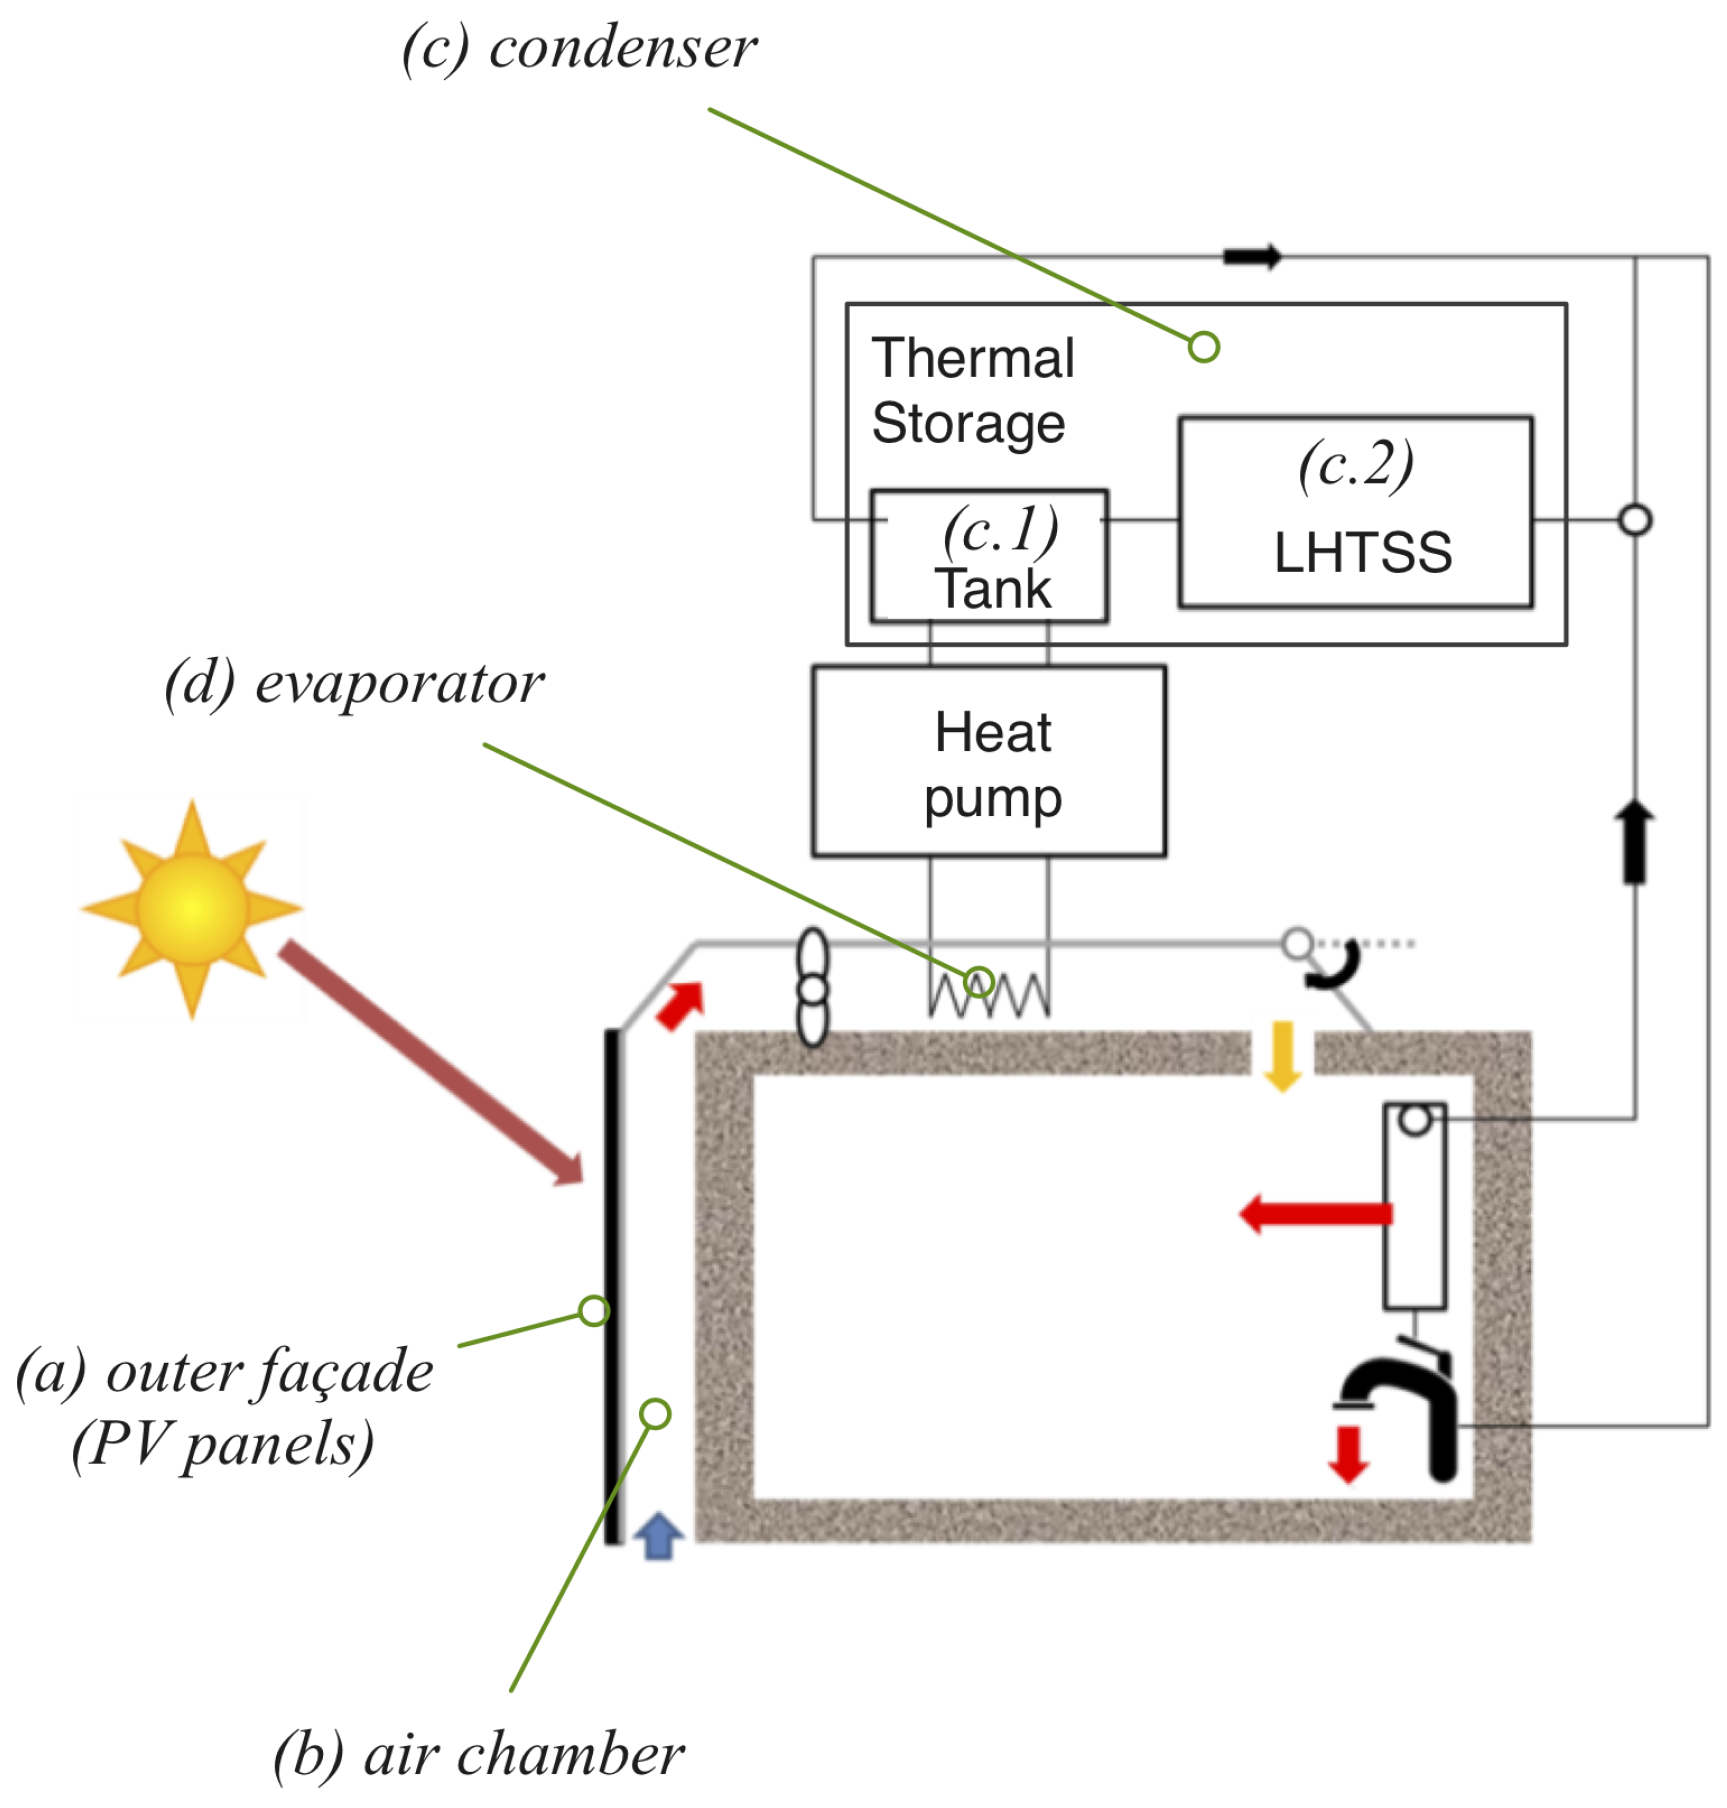
An integrated energy system (see
Figure 1) combining a heat pump, a ventilated façade and a water tank is being designed for a nearly zero-energy building (NZEB) [
9]. The exterior side of the ventilated façade is made of photovoltaic (PV) panels which will generate part of the total energy consumption. The panels will operate at a higher efficiency because they will be refrigerated by the ascending air between the façades. The warm air arriving at the top of the building, instead of being let to the ambient, will be collected and circulated through the evaporator of an air to water heat pump, which will produce hot air and water for the building. Due to the warm temperature at the evaporator, the efficiency of the heat pump will increase with respect to a conventional setting in which the evaporator operates with ambient air [
10]. In a first setting, the condenser will heat water stored in a tank, but a second alternative with a latent heat thermal storage system (LHTSS) is considered [
11]. The operating temperatures at this side will fall in the 55–60
C range [
12], usual for domestic HPWH [
10].
The system has been designed for a R410A-based HPWH, although it would be interesting to study a transcritical CO
-based HPWH (TC-HPWH) alternative. The performance of CO
heat pumps is very sensitive to operating conditions [
13], basically due to the temperature profile of the CO
at the gas cooler. It is presumed that, for the application considered here, where evaporator temperatures will be warm and water outlet temperatures moderate, the CO
heat pump could result advantageous over the conventional at some point [
14]. However, this is not straightforward to assume beforehand, as the water inlet temperature will also be moderately high, limiting the water temperature rise at the gas cooler, and thus the gas cooler performance. On the other hand, although this could favour the performance of the R401A over the CO
, the water outlet temperature will be on its upper limit, while well within the operating range of the CO
heat pump.
This work will compare the thermodynamic cycles of two commercial, domestic R410A and CO HPWH. A pattern of behaviour will be extracted, which is assumed to scale to larger systems. Parting from experimental studies, both cycles have been modelled independently. As their original topologies were different at the high-pressure end, a hypothetical common topology and a range of operating conditions have been defined for the study.
2. Methodology
The R410A-based HPWH was a Daikin EKHHP300AA2V3 (Osaka, Japan), and the TC-HPWH was the Sanyo EcoCute SHP-C45DEN (Osaka, Japan). While the conventional HPWH uses a conventional inverse Rankine cycle, the TC-HPWH cycle was modified. Both cycles were modelled with original code using Engineering Equation Solver (EES), assuming the following hypotheses:
Steady-state operation
Negligible pressure losses in piping and heat exchangers
Piping, compressors and expansion valves are adiabatic
Negligible heat losses to the environment in the gas cooler and water tank
Specific hypotheses and correlations were assumed for each HPWH, which are discussed in the following sections.
2.1. Conventional R410A Heat Pump Model
As mentioned above, the Daikin EKHHP300AA2V3 uses a conventional inverse Rankine cycle to heat a 300-L water tank (see
Figure 2). The manufacturer offers some performance data of interest for this study [
15,
16], some of them extracted in
Table 1.
Two aspects of the heat pump must be modelled: first, the cycle itself, which is described in
Section 2.1.2; and, second, the way in which the heat pump adapts to the cold source (environmental temperature) and to the hot source (water tank temperature).
The temperature gap between the saturation temperature at the evaporator
and the environmental temperature
is determined by the way in which the controller operates the cycle, and is therefore given by design. It can only be determined by experimental readings. This is developed in
Section 2.1.3.
Similarly, how the controller adapts the condensing temperature to the water tank temperature is also given by design, although this aspect was only of marginal importance for this study.
2.1.1. Experimental Setup
Several sensors were fixed to the Daikin EKHHP300AA2V3 to obtain the temperatures at all significant points of the cycle (
). The evaporator pressure
is the saturation pressure at
, because the compressor receives vapour from a two-phase separator. The global consumption of the heat pump
was measured. Air velocity, air in and out temperatures at the evaporator (
and
, respectively) were also registered. The temperature of the room (
) was controlled to force the heat pump to operate at the desired range in the evaporator. An example of the readings during a heating process is shown in
Figure 3, typical for R410A HPWH [
17].
2.1.2. EES Model
The heat pump implements a simple inverse Rankine cycle. The objective of the EES model is to predict the COP, including the energy consumption of cycle, electronics and fan (see
Figure 2), to make it comparable to the TC-HPWH COP.
This requires modelling the consumption of the cycle itself (compressor) and the other systems. An EES model of the cycle was built and adjusted to fit the experimental temperature readings, in particular and , which allows estimating the compressor power consumption.
To estimate the consumption of electronics and fan, three approaches were taken and combined. Informal indications of the manufacturer estimated it in approximately 15% of the total energy consumption, or rather, that the compressor work amounts to 85% of the total consumption.
As the total power consumption of the heat pump is measured, the difference with the compressor power must be the desired value for each case. Analysing the data could lead to finding a correlation.
Finally, it can be assumed that the energy consumption of the heat pump in standby mode is equal to the power consumption of the electronics, and so it can be estimated from the experimental measurements. The contribution of the fan can be obtained by simple fluid mechanics correlations, given that the air velocity through the evaporator is registered.
All three methods yielded similar results, the last being the least accurate, because the consumption of electronics will vary during operation with the frequency regulation of the electric motors of fan and compressor. For simplicity, the first was taken, assuming a constant ratio of 15%.
The final model produced reasonable results, logically more accurate in the prediction of the cycle than in COP. Two examples of its adjustments are shown in
Table 2.
2.1.3. Evaporator Pressure
Two aspects about the relation between
and
require mentioning. It was observed that only at the start of the heat pump occurred
(see
Figure 3).
was measured by a sensor attached to the air inlet of the evaporator, while
was measured at a distance. Once the heat pump operation had stabilised, always
, with a difference of approximately 2
C. This was verified under different conditions leading to the conclusion that
was affected by precooling of the air in the region immediately before the evaporator due to the low temperature of the tubes.
To exchange heat,
must be even lower than
. This gap is controlled by the heat pump. It can be observed in
Figure 3 that the heat pump shows two modes of operation, which we call Op 1 and Op 2: the first for elevating
to approximately 50
C and the second to complete the heating to 55
C. The temperature gap
changes from 3.5
C in Op 1 to 4.4
C in Op 2. Thus, the temperature gap between
and
is approximately 6
C counting both effects.
2.2. Transcritical CO Heat Pump Model
For the analysis of the TC-HPWH cycle, a thermodynamic model to reproduce the behaviour of the Sanyo EcoCute SHP-C45DEN heat pump was developed. This heat pump device has a heating capacity of 4.5 kW. The governing thermodynamic parameters and main assumptions were tuned to fit the experimental data provided by prior studies. After validation of the model, the performance of the device was extrapolated for the working conditions of the particular application under study.
The Sanyo SHP-C45DEN [
18] heat pump uses a modified Rankine cycle to attain an enhanced performance. The device uses a DC Rotary two stage compressor and splits the cycle for intermediate refrigeration between both stages. In this way, the compression stage can reach overall isentropic efficiencies of around 0.7 instead of 0.5–0.55 values more common for compressors of the same kind with only one stage of compression (see [
19,
20,
21]).
The split of the cycle occurs after the CO
cooler. One part is expanded to an intermediate pressure causing a decrease in temperature, used to precool the main flow of CO
before it is expanded in a second valve to the evaporator pressure. In this way, the liquid fraction of CO
increases after expansion. A diagram of the different components of the split cycle is shown in
Figure 4.
2.2.1. Model description
The CO
cycle was modelled with the commercial software Engineering Equation Solver (EES), using the Span and Wagner equation of state, widely accepted as the most suitable for s-CO
simulations [
22].
Modelling the isentropic efficiency of CO
compressors is not straightforward. There exist differences between the performance predicted by theoretical models and the actual behaviour contrasted experimentally [
23]. Usually, generic adjustments of experimental data are used [
14], in which isentropic efficiency is expressed as function of suction and discharge pressures [
13,
24].
Global isentropic efficiency (including mechanical and electrical) can be defined as:
where
is the specific enthalpy of the refrigerant at point state 1 (see
Figure 4),
is the specific enthalpy of the refrigerant at the discharge pressure assuming an isentropic compression process, and
is the refrigerant mass flow rate at the compressor outlet and is the measured power consumption of the compressor.
Most conveniently for this study, Hubacher, B. and Groll, E. A. [
23] provided a correlation for the Sanyo C-CV113H0W compressor, the hermetic, two-stage, rolling piston compressor used by the heat pump considered here:
with
,
in MPa in the range 1.76 MPa
4.81 MPa and 6.90 MPa
12.41 MPa.
The correlation in Equation (
2) allows determining the specific work demanded by the compressor for a given suction pressure
and temperature
and a given discharge pressure
. From that, two additional assumptions must be made to obtain the thermodynamic conditions of the state point 4: the compression ratio of both stages is the same (according to the report, this is approximately satisfied for the
ratios obtained) and the individual isentropic efficiency of each stage is the same, related with the previous assumption. Finally, the condition:
is imposed to define the position of the state point 4.
There are some other parameters of the cycle to be adjusted to provide good estimations of the heat pump COP. The main of them are the discharge pressure of the compressor
, the superheat at the compressor suction
(the difference between temperature
and the evaporation temperature), the efficiency of the heat transfer in the internal heat exchanger
and the temperature approximation or pinch point
in both the evaporator (difference between the ambient temperature
and the temperature at the evaporator’s outlet
) and the gas cooler (difference between the temperature at the gas cooler’s outlet
and the water inlet temperature
). In addition, some assumption on the mass flow fraction in both branches of the split must be made. To maintain simplicity, the model considers that the position of the state point 3 is in the same isentropic curve as the state point 1 (
), keeping a certain consistency with the overall isentropic efficiency approximation. Mass flows are then calculated by the energy balance between state points 2 and 9. The performance of the heat pump is then evaluated by calculating the COP for a given
by:
2.2.2. Model Validation
Experimental data and measurements for a range of operation conditions provided by another interesting report [
25] (project EFFSYS2), were considered as benchmark for validation of the previously described thermodynamic model and final tuning of all the mentioned cycle parameters. Among the set of data in the report, the most useful for our needs are the curves of the measured heat pump’s COP as a function of the water temperature at the gas cooler inlet for different ambient temperatures of −10, −5, 0 and 7
C (they are quite cold temperatures since the heat pump was operated in Sweden for that project). All of the measurements were taken adjusting at any time the water mass flow through the gas cooler so that the water outlet temperature was maintained approximately constant at
60
C. All these data are shown in
Figure 5.
After a number of simulations based on the method of trial and error, the analysis of the results allowed determining the two following main conclusions:
There are several possible strategies to control the heat transfer from the heat pump to the water cooling stream. The device has two degrees of freedom to adapt to the water mass flow and inlet temperature delivered to the gas cooler. It may rearrange the compressor discharge pressure and the refrigerant mass flow. The control strategy may be based on the regulation of the approximation temperature , the heat power really transferred , or the discharge pressure . The heat transfer is also restricted by the physical construction of the heat exchanger with a concrete heat exchange surface and a particular heat transfer coefficient, which may also be influenced by the mass flow rate on both the water and refrigerant sides. It is possible to fix two of these three variables (, and ) but the third one would then need to be determined.
The best fit between the model and the measurements was obtained for the set of cycle parameters in
Table 3.
Figure 5 shows the predictions of the model tuned with the previous values of parameters in comparison with the available experimental data. The comparison is in very good agreement for the lowest water inlet temperatures and for the highest ambient temperature curves. However, for water inlet temperature of 35–41
C and ambient temperature of −5
C and −10
C, the COP given by the model is somewhat overestimated. These are the cases for which the compressor is more difficult to refrigerate, since both
(high water inlet temperature) and
(high pressure ratios) are higher. Thus, it is possible that some of the assumptions of the model are not completely fair for these conditions, or perhaps the compressor is only operating with a low overall isentropic compared with the one provided by the correlation in Equation (
2) due to a lack of refrigeration. However, for the purpose of the present study, which was focused in the estimation of the COP for the case of a heat pump operating with preheated air from PV panels on a building façade (
Figure 1), it is clear that the working ambient temperature will be considerably higher in our particular application than for these particular few odd cases.
Once the parameterisation of the model was conducted in the way described above, a further validation of the model was carried out by comparison of the COP estimations with the information provided by the heat pump manufacturer. Grassi [
26] indicated the COP of the heat pump considering a water inlet temperature of 30
C and a water outlet temperature of 50
C for three different ambient temperatures (−15, −7 and 20
C). The COP value given for the case of
7
C is 7.3 higher than the available measured value for
30, which can be found in the series for the same ambient temperature shown in
Figure 5 (3.10 vs. 2.89). The difference must be related to the water outlet temperature, which is not the same (50
C vs. 60
C). The value of the compressor discharge pressure of
108.5 bar was found to be the best fit for data with the water outlet temperature
50
C. A comparison of the COP model predictions and the data given by the manufacturer is given in
Table 4.
The model predictions for the lowest temperature is poor; it must be disregarded because the suction pressure for that low temperature is reduced to
16.8 bar, which is not in the range of applicability of the correlation in Equation (
2). For the other two outdoor temperatures, the agreement is good.
According to the previous results, we can consider the model validated. For different water outlet temperatures in the range 45–65
C, a simple lineal interpolation/extrapolation is proposed as an estimation of the discharge pressure:
2.3. Common Topology for Comparison
The main variable for comparing both heat pumps is the coefficient of performance, COP. However, the original design of the condenser of the Daikin and the heat exchanger of the Sanyo makes a direct comparison impossible: the Daikin uses a tube coil immerse in a water tank and the Sanyo uses a heat exchanger. Logically, both control systems are adapted to these topologies. It was therefore necessary to design a common set of criteria for comparison.
The study consisted of simulating the COP throughout a series of operating cases, in which both HPWH were configured according to the topology in
Figure 6. It could be observed that the condenser is a counterflow heat exchanger in the original configuration of the Sanyo model, but drastically different to the original Daikin.
The heat losses to the surroundings were assumed negligible. The water outlet temperature was
55
C in all cases (which is within the range of operation of both HPWH). Ranges of water inlet
and environmental temperatures
were considered (see
Table 5). The COP was defined by:
To compare the two technologies meaningfully, it was decided that the pinch point at the condenser should be 5 C for both. This was achieved with an iterative EES code that calculated the appropriate heat exchanger for each case.
It is worth observing
Figure 7. For the R410A HPWH the pinch point, together with the water inlet and outlet temperatures, defines the saturation pressure at the condenser: the pinch point in the condenser always occurs when the R410A reaches saturated vapour. However, for the transcritical HPWH, the pinch point occurs at the water inlet of the gas cooler.
A final remark regarding maximum pressures must be made, given that it is one of the aspects traditionally considered critical for the CO
technology. As expected, maximum pressures for the conventional and the transcritical technologies differ greatly. While the maximum operating pressure for the conventional is in the range of 35 bar, the CO
heat pump reaches more than 110 bar, as can be noticed from Equation (
5).
3. Results
A first comparison of both HPWHs’ performance is given in
Table 5. Two different values of
and another two
in the range of the temperatures provided by a ventilated PV-panel façade were analysed. Together with the COP, the specific electric energy consumption per kilogram of water supplied at nominal temperature
, calculated as:
is shown in the table. This specific electric consumption depends on the temperature gap provided by the heat pump and also on the efficiency of the heating system, i.e. the HPWH’s COP.
As expected [
14], the transcritical system was found to be much more sensitive to the water inlet temperature that the R410A-based system. For the lower water inlet temperature in
Table 5, the COP of the transcritical HPWH improved the COP of the R410A-based HPWH. However, as pointed out, it rapidly decreased as the water inlet temperature increased [
27], thus the situation reversed above a certain point. This led to the conclusion that there exists an equal performance inlet temperature (EPIT), defining two areas of operation, at which the highest COP changes from one technology to the other.
The behaviour of both technologies was largely caused by the temperature profiles at the heat exchanger (see
Figure 7). While the heat exchange at the CO
gas cooler increased as the water inlet temperature decreased, just by a better match between the hot and cold flow temperature profiles, hence with negligible compressor power consumption increase, the transfer in the condenser of the R410A heat pump took place mostly at constant temperature. It reached minimum approach at saturated vapour, which allowed a small margin for adapting the condensation pressure, and thus a much lower increase of the COP for lower water inlet temperatures.
The equal performance inlet temperature (EPIT) mentioned earlier could be observed in the more detailed breakdown of the dependence of the COP and specific electric consumption with water inlet temperature, as shown in
Figure 8 and
Figure 9.
In
Figure 8, it can be noticed that the average slope of the decrease of the COP with the water inlet temperature was higher for the TC-HPWH than for the R410A-based HPWH. Consequently, there is a particular water inlet temperature for which the specific electric consumption is the same for both systems (EPIT). For water inlet temperatures above this point, the R410A-based HPWH has a better COP and a lower specific consumption, and, for lower water inlet temperatures, the TC-HPWH has the better performance.
The EPIT will depend on ambient temperature, because will determine the heat absorption pressure and, thus, the compression ratio. For the case of 24 C, the EPIT is 29 C, and, for the case of 27 C, it is 27 C.
A wider perspective can be observed in
Figure 10 and
Figure 11, in which the dependence of COP and specific work has been represented as a function of
and
. It can be seen that the range of operation is divided in two regions: one in which the CO
performance is better than the R410A and another in which the R410A improves the CO
. The line of intersection represents equal performance, and its projection on the horizontal plane (
,
) is the line of equal performance operating conditions (EPOC).
Although the position of the EPOC may vary if other heat pump models of similar technology are considered, the variation should be small, given that the EPOC is determined more by their behaviour against ambient and water inlet temperatures than by their actual performance, and the former derives directly from the cycle topologies and the refrigerants used. The EPOC for larger systems, however, with more complex topologies, such as the ones analysed in [
13], or for other applications [
28], should be recalculated, as the behaviour of the heat pumps can differ significantly to the ones considered here, affecting the slopes for the COP and
.
It is interesting to study the EPOC more carefully, as shown in
Figure 12. Below the line, the better performance is given by the CO
heat pump, while, over the line, the R410A. It can be observed that the coolest of the studied cases (
C,
C) falls in the lower region (CO
) and that the warmest (
C,
C) clearly in the upper (R410A).
4. Conclusions
The performance of transcritical CO heat pumps depends critically on their conditions of operation, while the performance of the R410A is more uniform across the range. CO heat pumps cannot be ruled out as a design alternative for the NZEB system considered here, in which evaporator temperatures are warmer than the ambient, and thus the compression ratio of the heat pumps is moderate.
Thus, to decide on the technology, it is necessary to consider the actual application. A valuable tool has been developed in this study, namely equal performance operating conditions (EPOC), which divides the range of operating conditions in two regions, depending on which technology is the better one. It is then straightforward to analyse the most suitable technology for a particular use, by observing in which region its and are located.
When considering buildings, for producing hot tap water (>45 C) from cold water from the mains, where the temperature gap between water inlet and outlet can easily exceed 30 C, a CO heat pump would actually be the better choice. On the other hand, closed circuit heating works with lower gaps, in the order of 12–20 C between supply and return, and the suitable technology would be R410A.
However, it must be remarked that water supply at 55 C has been considered in the study, which is the highest temperature allowed by the R410A model. Higher values can be achieved by an electric heater (booster). However, water in buildings and in particular in our NZEB system can easily be required to exceed 55 C, not only for heating, but also for the LHTSS, in which the phase change takes place in the 55–61 C interval. It is clear that using the booster would penalise the performance of the R410A significantly.
Thus, the temperatures at which the heat exchange takes place are critical for the performance of both technologies. A heat exchanger in parallel to the tank, with intake at the bottom (cool) and outlet at the top (warm), would maximise the temperature gap of the water current, by fully using the stratification of the tank, thus favouring the CO. This setting would be comparable to the one considered here. However, the original R410A heat pump that has been analysed uses a coil heat exchanger at the bottom of the tank, and in this configuration it is unclear how the performance of the CO heat pump would develop, although it would be poorer than predicted here.
The main conclusion for our study is that reasonable performance can be achieved with conventional R410A technology for a number of applications and topologies. However, the performance of CO technology depends so strongly on topology and operating conditions that these factors must be carefully considered in the design. As many applications fall close to EPOC, simply by adapting the topology of the system and its conditions of operation, CO can achieve better performance over R410A. It therefore has a greater flexibility, and its potential for integrated energy systems is significant.
Under this conclusion, the group has been studying the behaviour of alternative system configurations for over a year, including evolution of operating conditions and economic factors, to reach a definitive design criterion.
Author Contributions
Conceptualisation, C.G.F., J.R.M., Á.J.Á. and I.L.P.; Methodology, Á.J.Á. and I.L.P.; Software, Á.J.Á.; Validation, Á.J.Á. and J.R.M.; Formal analysis, Á.J.Á. and J.R.M.; Investigation, C.G.F., J.R.M., Á.J.Á. and I.L.P.; Resources, R.N.C.; Data curation, Á.J.Á. and J.R.M.; Writing—original draft preparation, I.L.P. and Á.J.Á.; Writing—review and editing, C.G.F. and J.R.M.; Visualization, J.R.M.; and Supervision, I.L.P.
Funding
This research was funded by Spanish Ministry of Economy (MINECO), project Ekimprove: Solar energy system for heating and domestic hot water supply by means of a photovoltaic ventilated façade with compact latent heat storage, grant number ENE2015-71083-R.
Conflicts of Interest
The authors declare no conflict of interest.
Abbreviations
| COP | coefficient of performance |
| DC | direct current |
| EPIT | equal performance inlet temperature |
| EPOC | equal performance operating conditions |
| GWP | global warming potential |
| HPWH | heat pump water heater |
| LHTSS | latent heat thermal storage system |
| NZEB | nearly zero-energy building |
| PH | photovoltaic |
| TC | transcritical |
Symbols
| h | specific enthalpy (kJ/kg) |
| p | pressure (bar) |
| heating power of the water heater kW |
| s | specific entropy (kJ/kg·K) |
| T | temperature (C) |
| electric power consumption (kW) |
| w | specific work (usually with “el” subscript) (kWh/kg) |
Greek Symbols
| compressor isentropic efficiency (-) |
| superheat at the compressor suction (C) |
| temperature approximation or pinch point (C) |
| heat exchanger efficiency (-) |
Subscripts and Superscripts
| 0 | ambient |
| electric |
| i | state point |
| water heater inlet |
| water heater outlet |
References
- Nawaz, K.; Shen, B.; Elatar, A.; Baxter, V.; Abdelaziz, O. Performance optimization of CO2 heat pump water heater. Int. J. Refrig. 2018, 85, 213–228. [Google Scholar] [CrossRef]
- Willem, H.; Lin, Y.; Lekov, A. Review of energy efficiency and system performance of residential heat pump water heaters. Energy Build. 2017, 143, 191–201. [Google Scholar] [CrossRef]
- Zhang, J.F.; Qin, Y.; Wang, C.C. Review on CO2 heat pump water heater for residential use in Japan. Renew. Sustain. Energy Rev. 2015, 50, 1383–1391. [Google Scholar] [CrossRef]
- Li, L.; Ge, Y.; Luo, X.; Tassou, S. Thermodynamic analysis and comparison between CO2 transcritical power cycles and R245fa organic Rankine cycles for low grade heat to power energy conversion. Appl. Therm. Eng. 2016, 106, 1290–1299. [Google Scholar] [CrossRef]
- Liu, X.; Liu, C.; Zhang, Z.; Chen, L.; Hou, Y. Experimental Study on the Performance of Water Source Trans-Critical CO2 Heat Pump Water Heater. Energies 2017, 10, 810. [Google Scholar] [CrossRef]
- Zhang, Z.; Dong, X.; Ren, Z.; Lai, T.; Hou, Y. Influence of Refrigerant Charge Amount and EEV Opening on the Performance of a Transcritical CO2 Heat Pump Water Heater. Energies 2017, 10, 1521. [Google Scholar] [CrossRef]
- Hu, B.; Li, Y.; Cao, F.; Xing, Z. Extremum seeking control of COP optimization for air-source transcritical CO2 heat pump water heater system. Appl. Energy 2015, 147, 361–372. [Google Scholar] [CrossRef]
- Ohkura, M.; Yokoyama, R.; Nakamata, T.; Wakui, T. Numerical analysis on performance enhancement of a CO2 heat pump water heating system by extracting tepid water. Energy 2015, 87, 435–447. [Google Scholar] [CrossRef]
- Elguezabal, P.; Garay, R.; Martin, K. Experimentation under real performing conditions of a highly integrable unglazed solar collector into a building façade. Energy Procedia 2017, 122, 775–780. [Google Scholar] [CrossRef]
- Torregrosa-Jaime, B.; González, B.; Martínez, P.J.; Payá-Ballester, G. Analysis of the Operation of an Aerothermal Heat Pump in a Residential Building Using Building Information Modelling. Energies 2018, 11, 1642. [Google Scholar] [CrossRef]
- Salazar-Herrán, E.; Martín-Escudero, K.; López-Paniagua, I.; Jiménez-Álvaro, A.; Romero-Antón, N. Caracterización experimental de una bomba de calor acoplada a una fachada ventilada para producción de agua caliente. In Proceedings of the Libro de Actas del I Congreso sobre Ingeniería Energética, iENER’18, Madrid, Spain, 27–28 June 2018; Fundación de la Energía de la Comunidad de Madrid: Madrid, Spain, 2018. ISBN 978-84-09-02707-1. [Google Scholar]
- Rubitherm. RT60 Datasheet; Datasheet 16.02.2015; Rubitherm Technologies GmbH: Berlin, Germany, 2015. [Google Scholar]
- Catalán-Gil, J.; Sánchez, D.; Llopis, R.; Nebot-Andrés, L.; Cabello, R. Energy Evaluation of Multiple Stage Commercial Refrigeration Architectures Adapted to F-Gas Regulation. Energies 2018, 11, 1915. [Google Scholar] [CrossRef]
- Zhang, B.; Chen, L.; Liu, L.; Zhang, X.; Wang, M.; Ji, C.; Song, K.I. Parameter Sensitivity Study for Typical Expander-Based Transcritical CO2 Refrigeration Cycles. Energies 2018, 11, 1279. [Google Scholar] [CrossRef]
- Daikin Europe, N.V. ECH2O: Domestic Hot Water Heat Pump; Publication No. ECPEN16-732; Daikin Europe N.V.: Oostende, Belgium, February 2016. [Google Scholar]
- Daikin Europe, N.V. Installation and Operating Instructions: Hot Water Heat Pump (Indoor Unit) EKHHP300AA2V3/EKHHP500AA2V3; Publication No. 008.1423444_05; Daikin Europe N.V.: Oostende, Belgium, August 2016. [Google Scholar]
- Zhao, Z.; Zhang, Y.; Mi, H.; Zhou, Y.; Zhang, Y. Experimental Research of a Water-Source Heat Pump Water Heater System. Energies 2018, 11, 1205. [Google Scholar] [CrossRef]
- SANYO. CO2 ECO Heating System—Energy Efficient Air To Water Heat Pump Technology; Catalogue 2009; SANYO: Osaka, Japan, 2009. [Google Scholar]
- Arpagaus, C.; Bless, F.; Schiffmann, J.; Bertsch, S.S. Multi-temperature heat pumps: A literature review. Int. J. Refrig. 2016, 69, 437–465. [Google Scholar] [CrossRef]
- Austin, B.T.; Sumathy, K. Transcritical carbon dioxide heat pump systems: A review. Renew. Sustain. Energy Rev. 2011, 15, 4013–4029. [Google Scholar] [CrossRef]
- Hu, H.; Eikevik, T.M.; Neksa, P.; Hafner, A.; Ding, G.; Huang, Q.; Ye, J. Performance analysis of an R744 ground source heat pump system with air-cooled and water-cooled gas coolers. Int. J. Refrig. 2016, 63, 72–86. [Google Scholar] [CrossRef]
- Raman, S.K.; Kim, H.D. Computational Analysis of the Performance Characteristics of a Supercritical CO2 Centrifugal Compressor. Computation 2018, 6, 54. [Google Scholar] [CrossRef]
- Hubacher, B.; Groll, E.A. Measurement of Performance of Carbon Dioxide Compressors; Technical Report, ARTI-21CR/611-10070-01 Project Final Report; Air Conditioning and Refrigeration Technology Institute: Arlington, VA, USA, 2002. [Google Scholar]
- Zhang, Z.; Tong, L.; Wang, X. Thermodynamic Analysis of Double-Stage Compression Transcritical CO2 Refrigeration Cycles with an Expander. Entropy 2015, 17, 2544–2555. [Google Scholar] [CrossRef]
- Chen, Y.; Lundqvist, P.; Alves, A.; Brachert, L. CO2 Heat Pumps for the Swedish Market-Test and Analysis of the SANYO ECO-CUTE Heat Pump Modified for Swedish Conditions; Project EFFSYS2 Report; KTH University, Lab of Division of Applied Thermodynamics and Refrigeration: Stockholm, Sweden, 2008. [Google Scholar]
- Grassi, W. Heat Pumps: Fundamentals and Applications, 1st ed.; Springer International Publishing: Cham, Switzerland, 2018; ISBN 978-3-319-62198-2. [Google Scholar]
- Eslami-Nejad, P.; Badache, M.; Bastani, A.; Aidoun, Z. Detailed Theoretical Characterization of a Transcritical CO2 Direct Expansion Ground Source Heat Pump Water Heater. Energies 2018, 11, 387. [Google Scholar] [CrossRef]
- Shi, L.; Shu, G.; Tian, H.; Huang, G.; Chang, L.; Chen, T.; Li, X. Ideal Point Design and Operation of CO2-Based Transcritical Rankine Cycle (CTRC) System Based on High Utilization of Engine’s Waste Heats. Energies 2017, 10, 1692. [Google Scholar] [CrossRef]
Figure 1.
Diagram of the integrated energy system for buildings. The evaporator (d) receives warm air from the air ascending through the air chamber (b) after refrigerating the panels of the outer façade (a). The hot side of the pump is either a water tank (c.1) or a latent heat thermal storage system (LHTSS) (c.2).
Figure 2.
Block diagram of the Daikin EKHHP300AA2V3, R410A-based heat pump water heater systems (HPWH). Measured variables and sources of energy consumption are indicated.
Figure 2.
Block diagram of the Daikin EKHHP300AA2V3, R410A-based heat pump water heater systems (HPWH). Measured variables and sources of energy consumption are indicated.
Figure 3.
Temperature evolution during a water tank heating from 45 C to 55 C. Two modes of operation, Op 1 and Op 2, can be distinguished. Transients are shaded in blue.
Figure 3.
Temperature evolution during a water tank heating from 45 C to 55 C. Two modes of operation, Op 1 and Op 2, can be distinguished. Transients are shaded in blue.
Figure 4.
Schematic diagram of the SANYO EcoCuteSHP-C45DEN split cycle.
Figure 4.
Schematic diagram of the SANYO EcoCuteSHP-C45DEN split cycle.
Figure 5.
Representation of heat pump coeeficient of performance (COP) as a function water inlet temperature for different outdoor temperatures. Water outlet temperature 60 C.
Figure 5.
Representation of heat pump coeeficient of performance (COP) as a function water inlet temperature for different outdoor temperatures. Water outlet temperature 60 C.
Figure 6.
Setup for comparing both heat pumps. They were required to heat a water stream from different values of to in a counterflow heat exchanger acting as condenser/gas cooler, while operating at different environmental temperatures .
Figure 6.
Setup for comparing both heat pumps. They were required to heat a water stream from different values of to in a counterflow heat exchanger acting as condenser/gas cooler, while operating at different environmental temperatures .
Figure 7.
Temperature profiles at the high pressure heat exchanger for 20 C, 55 C, 27 C and 5 C. The location of minimum approach for both technologies can be observed.
Figure 7.
Temperature profiles at the high pressure heat exchanger for 20 C, 55 C, 27 C and 5 C. The location of minimum approach for both technologies can be observed.
Figure 8.
HPWHs COP dependence on water inlet temperature . Series obtained for constant 55 C and 5 C.
Figure 8.
HPWHs COP dependence on water inlet temperature . Series obtained for constant 55 C and 5 C.
Figure 9.
HPWHs electric consumption dependence on water inlet temperature . Series obtained for constant 55 C and 5 C.
Figure 9.
HPWHs electric consumption dependence on water inlet temperature . Series obtained for constant 55 C and 5 C.
Figure 10.
HPWHs COP dependence on water inlet temperature and ambient temperature, . The intersection separating a region of better CO than R410A performance is highlighted.
Figure 10.
HPWHs COP dependence on water inlet temperature and ambient temperature, . The intersection separating a region of better CO than R410A performance is highlighted.
Figure 11.
HPWHs electric consumption dependence on water inlet temperature and ambient temperature, .
Figure 11.
HPWHs electric consumption dependence on water inlet temperature and ambient temperature, .
Figure 12.
Line of equal performance conditions (EPOC).
Figure 12.
Line of equal performance conditions (EPOC).
Table 1.
Manufacturer’s operation and performance data for the Daikin EKHHP300AA2V3.
Table 1.
Manufacturer’s operation and performance data for the Daikin EKHHP300AA2V3.
| Parameter | Value |
|---|
| COP | 4.3 |
| Maximal operation pressure | 41.7 bar |
| Ambient temperature op. range | 2–35 C |
Table 2.
Adjustment between experimental data and Engineering Equation Solver (EES) model for the R410A HPWH.
Table 2.
Adjustment between experimental data and Engineering Equation Solver (EES) model for the R410A HPWH.
| Case Definition | Variable | EES Model Outputs | Experimental Data | Error (%) |
|---|
| Case A: | (C) | 81.68 | 82 | 0.390 |
| = 20 C | Overall COP | 3.713 | 3.52 | 5.483 |
| = 57 C | (incl C+E) | | | |
| Case B: | (C) | 72.95 | 73 | 0.068 |
| = 23 C | Overall COP | 4.682 | 4.51 | 3.814 |
| = 53 C | (incl C+E) | | | |
Table 3.
Best fit between the model and the measurements.
Table 3.
Best fit between the model and the measurements.
| | | | for 60 C |
|---|
| 5 C | 92 % | 5 C | 5 C | 115 bar |
Table 4.
Comparison of COP values between the model and the heat pump’s catalogue data. 30 C, 50 C, 108.5 bar.
Table 4.
Comparison of COP values between the model and the heat pump’s catalogue data. 30 C, 50 C, 108.5 bar.
| (C) | SANYO Catalogue | Model | Error (%) |
|---|
| −15 | 1.81 | 2.05 | 13.6 |
| 7 | 3.10 | 3.03 | 2.25 |
| 20 | 3.75 | 3.82 | 1.87 |
Table 5.
Comparison of COP values between the R410A-based and the TC HPWHs. Simulations were carried out for a constant 5 C.
Table 5.
Comparison of COP values between the R410A-based and the TC HPWHs. Simulations were carried out for a constant 5 C.
| HPWH | (C) | (C) | (C) | COP | (kWh/kg) |
|---|
| Daikin (R410A) | 24 | 20 | 55 | 4.4168 | |
| Sanyo (CO) | 24 | 20 | 55 | 4.7445 | |
| Daikin (R410A) | 24 | 35 | 55 | 4.0106 | |
| Sanyo (CO) | 24 | 35 | 55 | 3.7502 | |
| Daikin (R410A) | 27 | 20 | 55 | 4.8006 | |
| Sanyo (CO) | 27 | 20 | 55 | 5.0607 | |
| Daikin (R410A) | 27 | 35 | 55 | 4.3485 | |
| Sanyo (CO) | 27 | 35 | 55 | 3.9593 | |
© 2019 by the authors. Licensee MDPI, Basel, Switzerland. This article is an open access article distributed under the terms and conditions of the Creative Commons Attribution (CC BY) license (http://creativecommons.org/licenses/by/4.0/).

 ,
, 


