1. Introduction
The “smart grid” concept generally denotes a flexible electricity network, capable of providing different services and functionalities, such as improved control and balancing of power flows, or enhanced fault protection. An important aspect of smart grid is the use of distributed generation (DG), which should be controlled to ensure higher energy efficiency and maximum asset utilisation [
1]. The paradigm shift to smart grids is driven by the fact that existing/legacy networks require high investments to meet various techno-economic requirements of the increasingly dynamic energy landscape. Within this context, smart grid technologies include demand side response (DSR), energy storage (ES) and microgeneration (MG), collectively termed as distributed energy resources (DERs), as well as enhancement of enabling infrastructures for monitoring, communication and control of network assets. Successful management of these smart grid technologies is expected to result in higher energy efficiency and supply security, thus allowing for deferral of investments in network reinforcement, upgrading and expansion [
2]. Due to requirements for supply sustainability, renewable energy resources (RERs) will be instrumental in realising changes to planning and operation of power systems, culminating in significant economic and environmental benefits. These benefits include provision of not only residential low-voltage (LV) customers, but also commercial and industrial medium-voltage (MV) customers, with the capacity to reduce their electricity consumption and energy bills, plus participate in ancillary service markets through the provision of frequency response services and short-term operating reserves [
3].
In realising the significant benefits of smart grid technologies, it is important to overcome the reliance on the intermittent outputs of RERs and resolve uncertainties in network operation introduced by their stochastic behaviour [
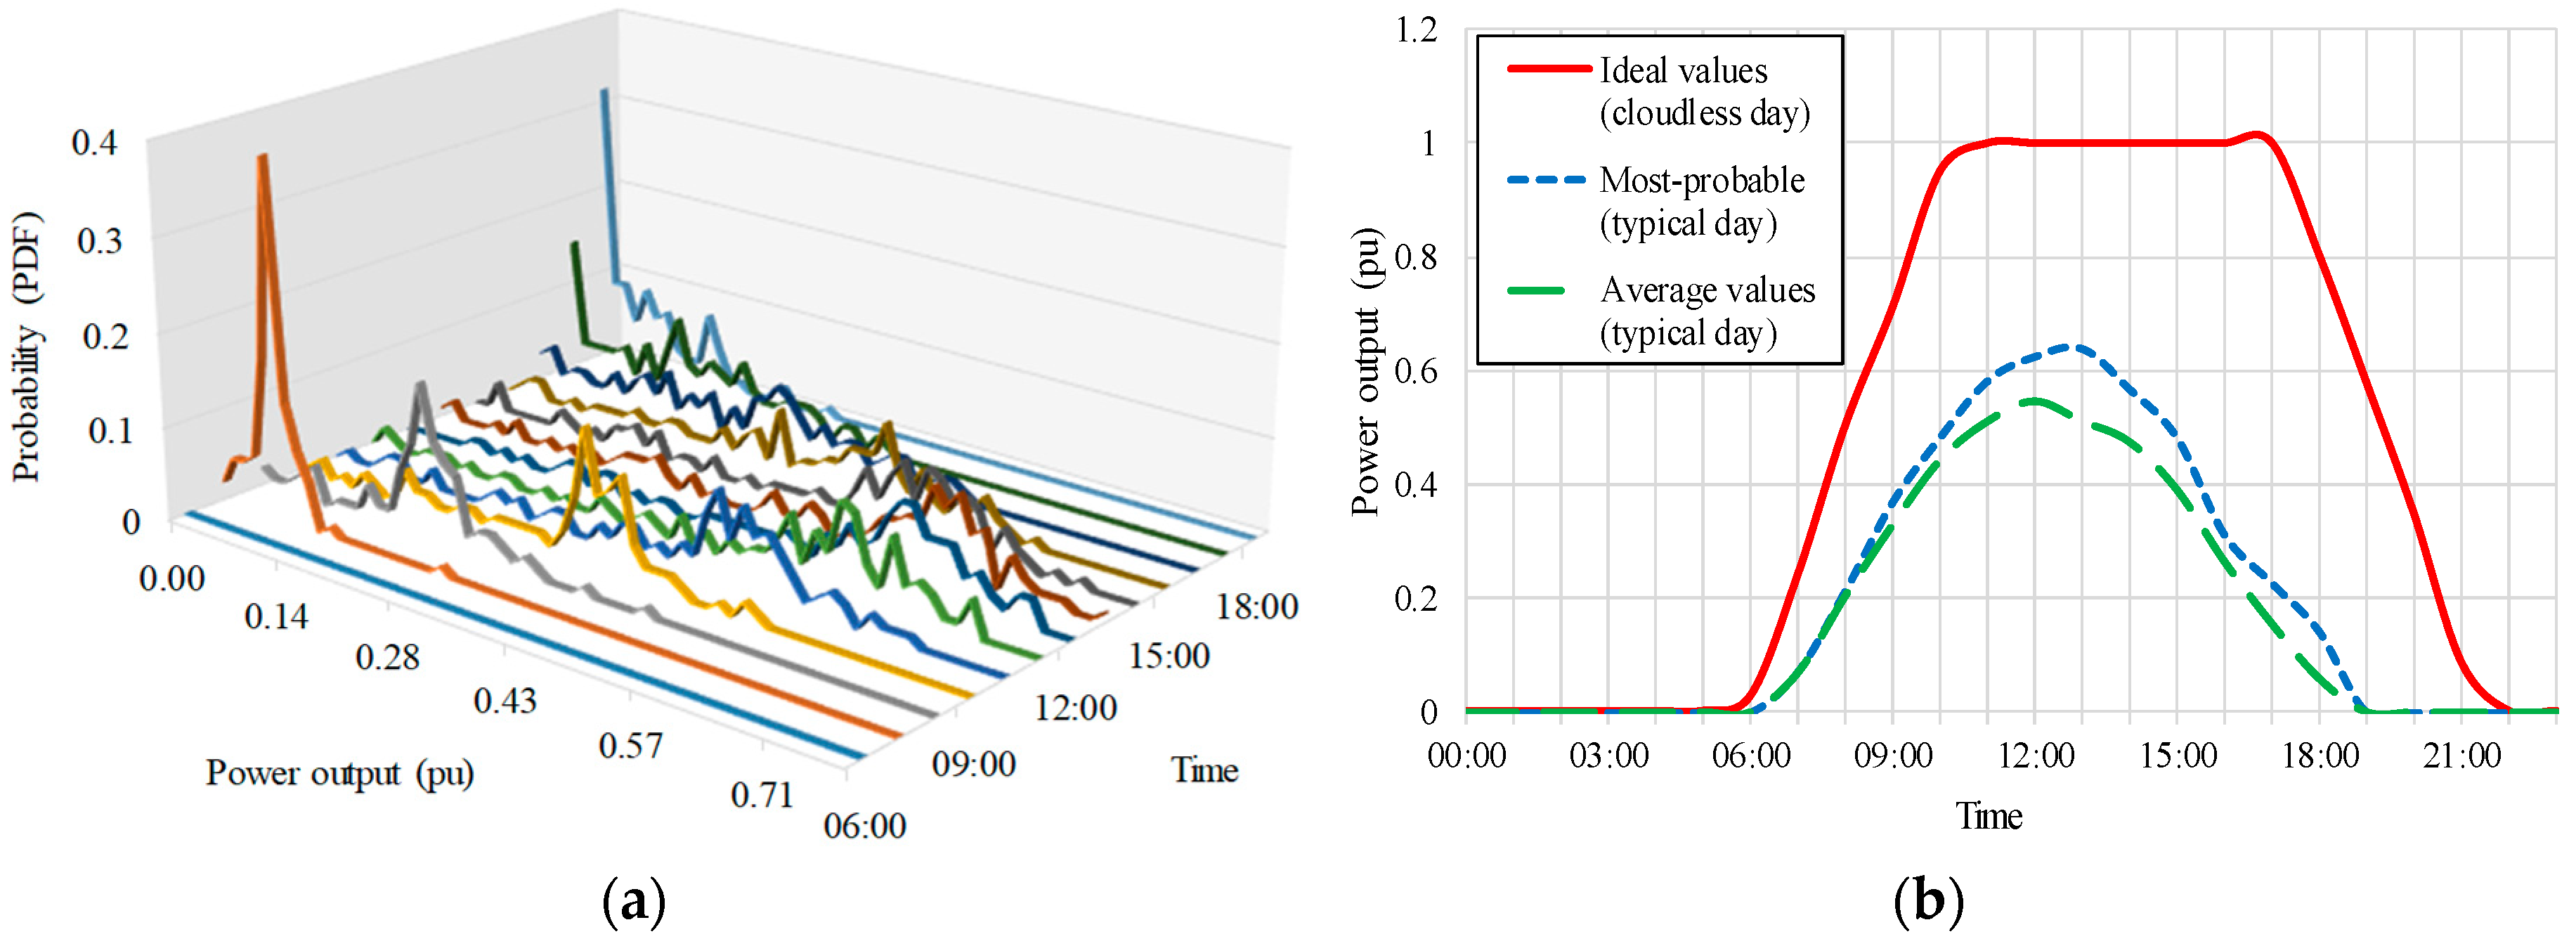
4]. For example, the times of the peak photovoltaic (PV) power generation might not, and typically do not coincide with the peak demands (depending on the category of end consumer), which results in a less than optimal utilisation of the generated PV power [
5]. The deployment of RER must therefore be carefully analysed in terms of their impacts on the network performance, quality of supply (QS) delivered to end customers, network reliability and resulting financial implications, e.g., potential for creation of peer-to-peer energy trading and ancillary service markets. In that context, the impact of DERs on supply interruptions is particularly important as these traditionally have the highest social and economic implications to all stakeholders in the electricity sector. Accordingly, regulators enforce legislation to make sure that the highest standards of network reliability performance and supply continuity are provided to the electricity customers, e.g., through the security and quality of supply (SQS) legislation in the UK [
6,
7]. To correctly quantify the impact of different DER technologies on network reliability performance, distribution network operators (DNOs) commonly use a set of standard indices [
8] to measure system reliability and must report these to regulatory bodies as a measure of their performance.
This paper builds on the previous work published in [
4] and [
9], where the impact from the implementation of ES, renewable-based MG systems and DSR on actively managed distribution networks was analysed. The analysis in this paper acknowledges that solar PV power production is strongly impacted by unpredictable cloud movements and thus presents PV models that can evaluate related temporal and spatial variations to correctly quantify potential benefits. In published literature, different methods have been proposed to mitigate the power output fluctuations due to this ‘clouding’ effect, such as ramp-rate control using ES [
10]. In the previous work, compensation of PV fluctuations using ES to achieve flat feeder voltage profiles, to reduce number of voltage-regulation operations and to lower system operational costs is discussed in [
11]. Similarly, [
12] discusses quantification of the effects of PV on power system reliability, but mainly focuses on finding the optimal placement of PV installations and employs a relatively low resolution time-step (1 day) for the presented probabilistic models. Finally, [
13] focuses on minimizing lifetime, energy and load-loss costs. Despite these developments, there is a need to more accurately quantify the impact of these stochastically-behaving local PV solutions on reliability performance and assess their direct implications on supply continuity and, importantly, customer “willingness-to-pay”.
In order to address some of the above challenges, part of the contribution of this paper is to present a more realistic PV modelling, in order to quantify clouding effects in reliability studies. Furthermore, the paper presents a general methodology for the optimal design of an energy management system (EMS), to control ES and realise an improved reliability performance. The importance of ES is highlighted in several studies assessing the benefits from ES for peak shaving, frequency regulation and operational optimisation, especially when the ES is installed in a centralised configuration, which is usually a preferred option by the DNOs [
14,
15,
16]. Although there are various studies that focus on ES sizing, economic operation and optimization [
17], less emphasis is put on the technical capabilities of ES for devising smart functionalities to improve overall network reliability performance. In this paper, ES systems are modelled in a highly distributed configuration, i.e. as the small-size ES operating together with the local PV-based MG units. This is assumed to be a typical smart grid configuration in e.g., residential applications, and this paper demonstrates that these applications can be designed and implemented to improve reliability performance and, in doing so, provide financial benefits to their owners and system operators. The results illustrate how all stakeholders might benefit from a smart grid deployment and control of ES, which can ensure higher reliability and continuity of supply.
This article is organised as follows:
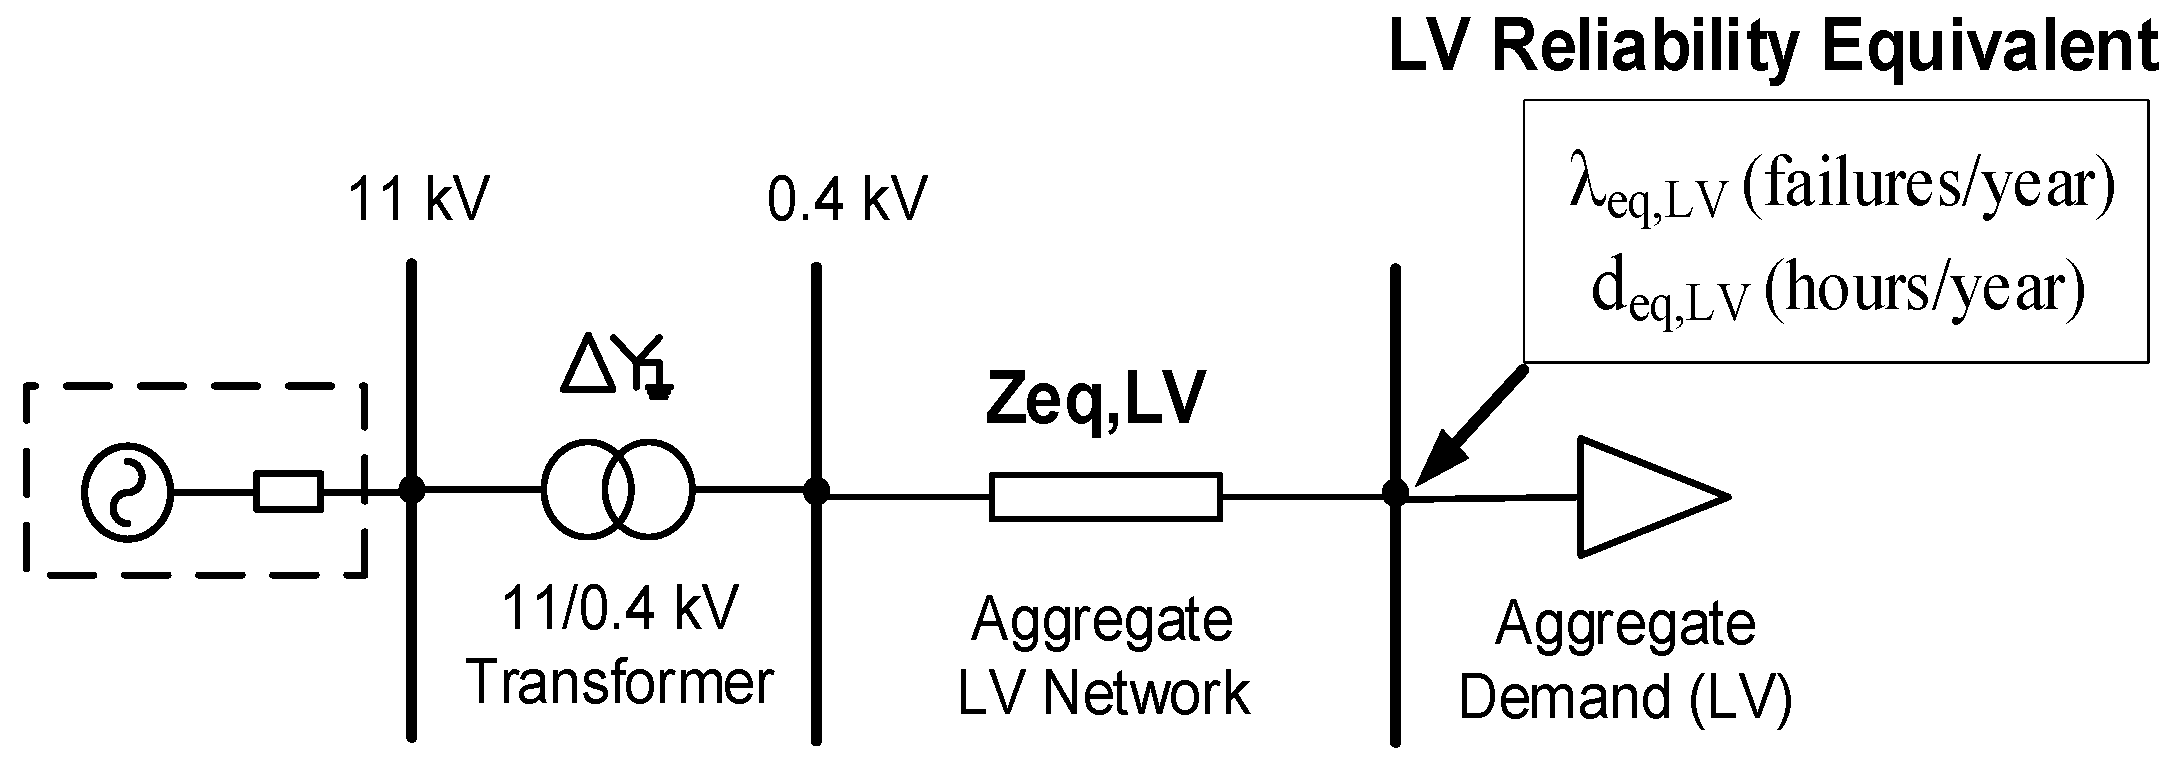
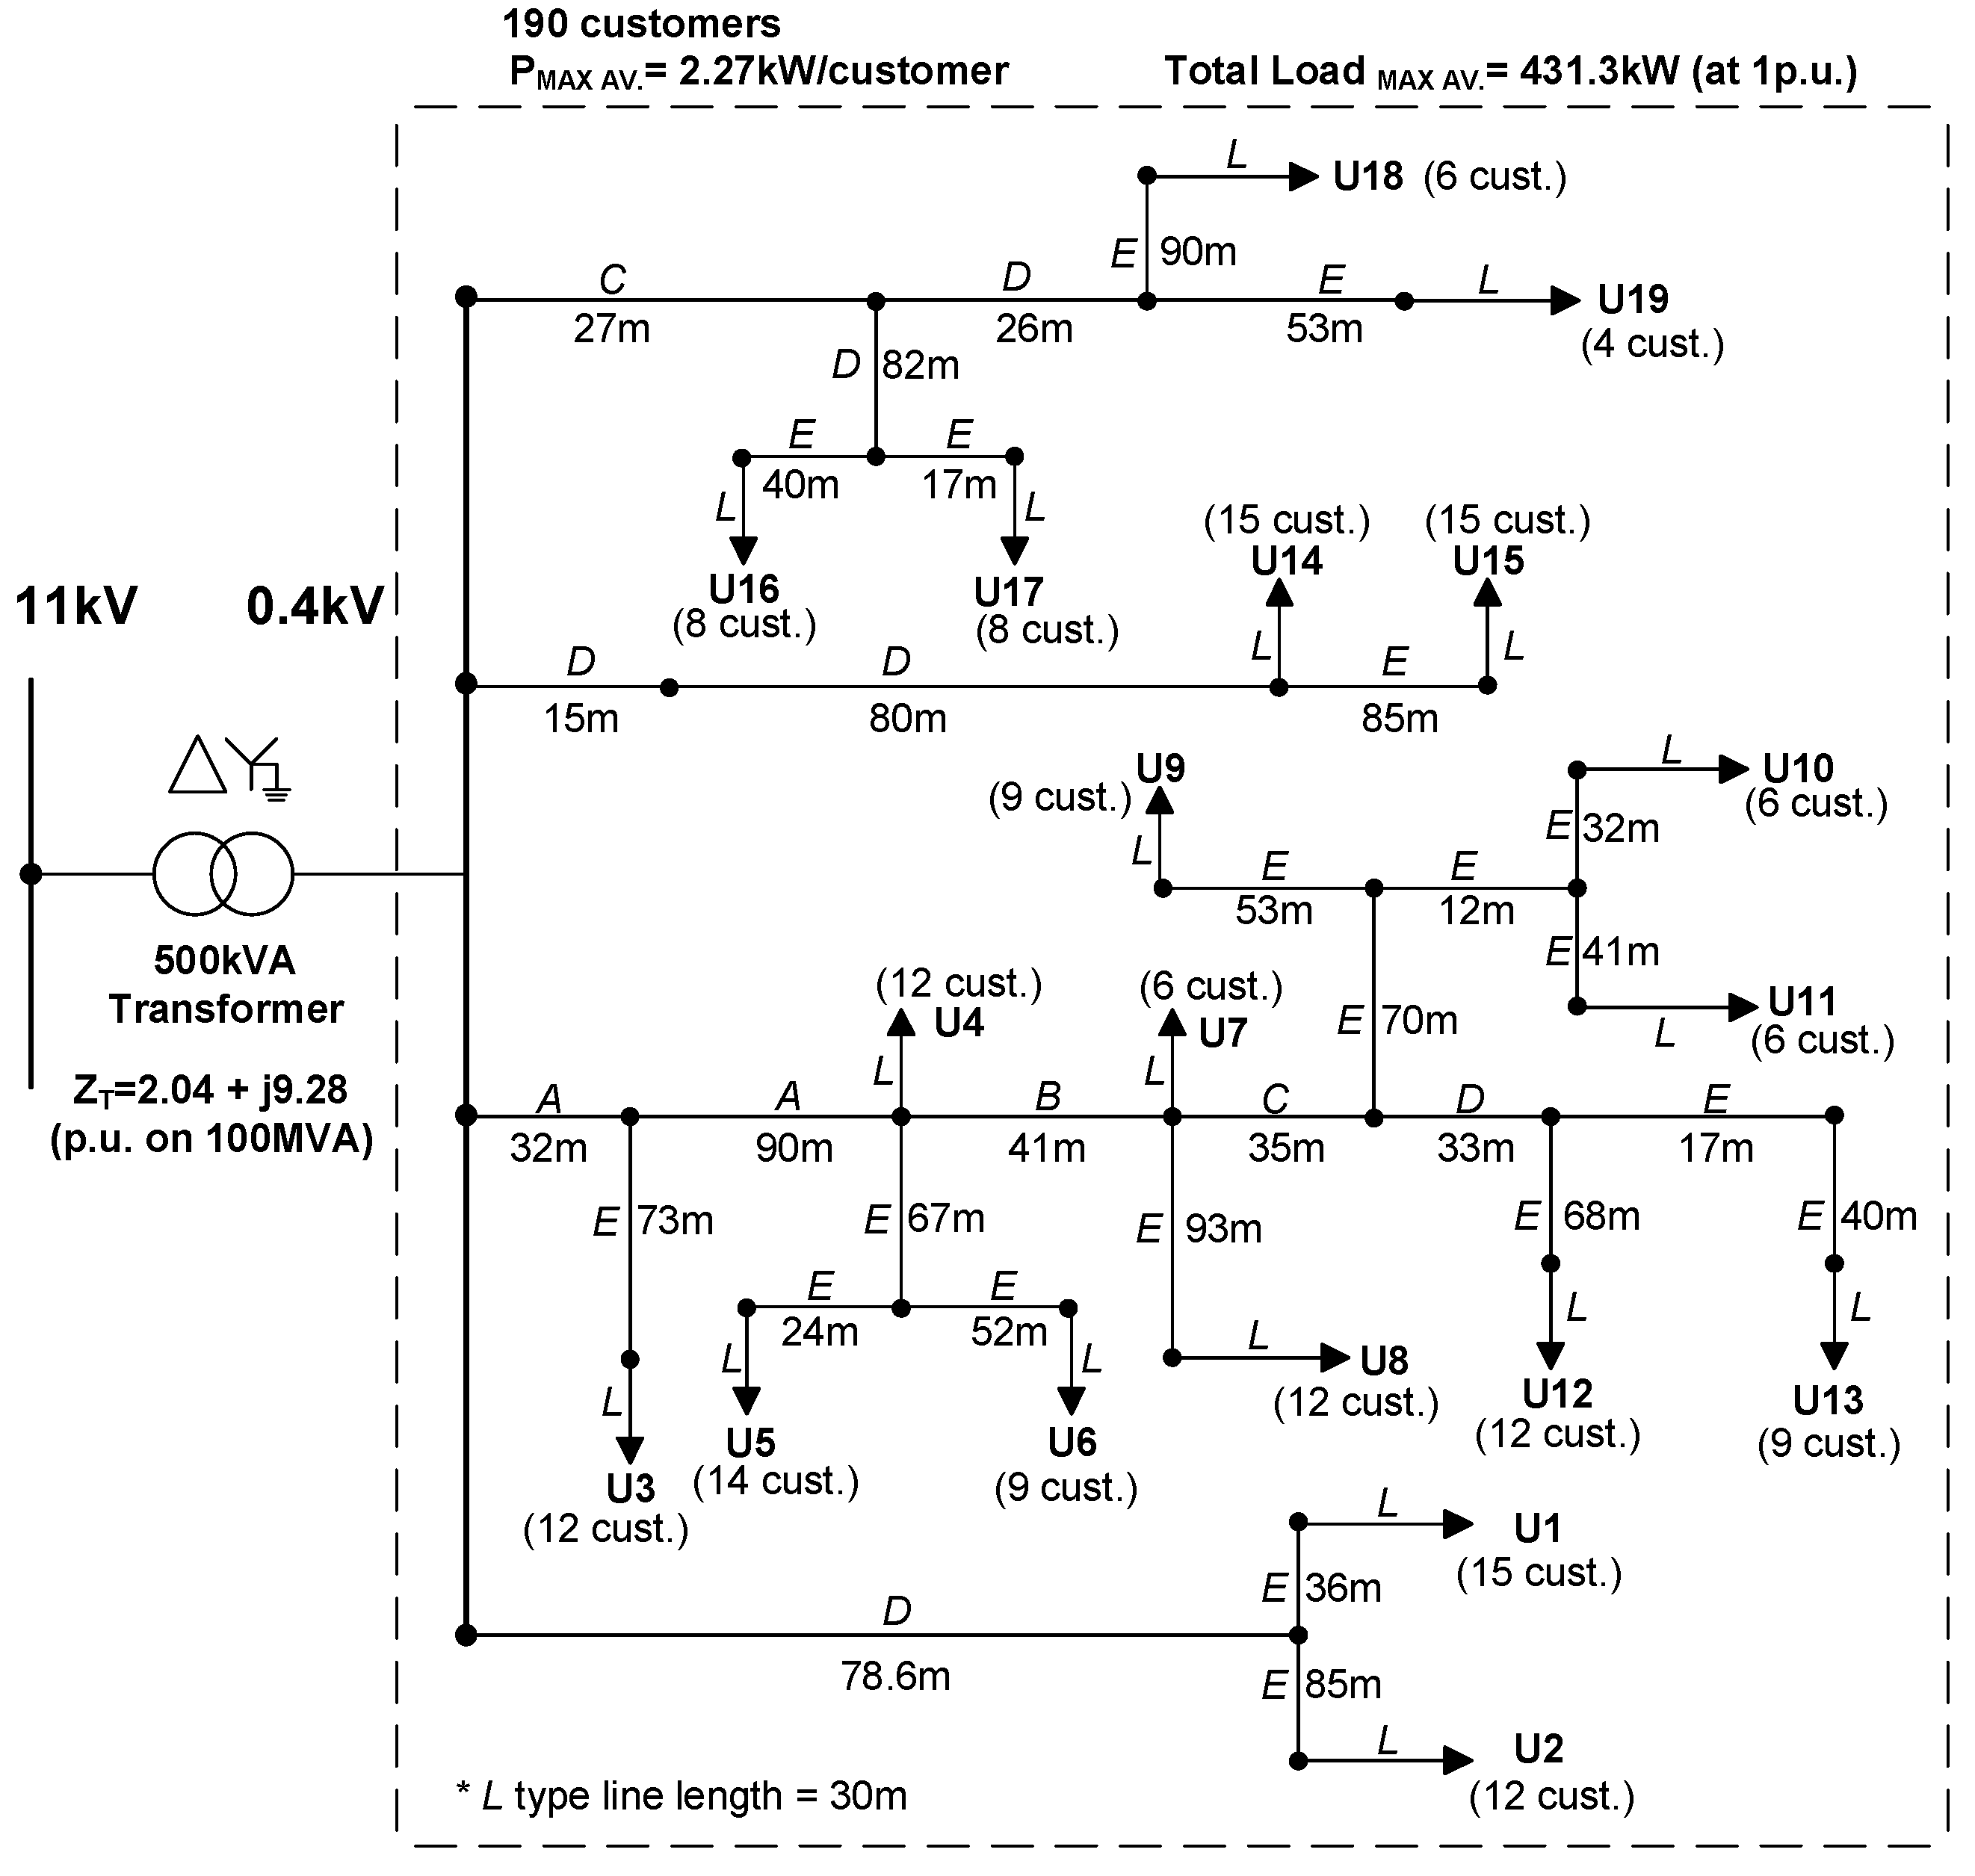
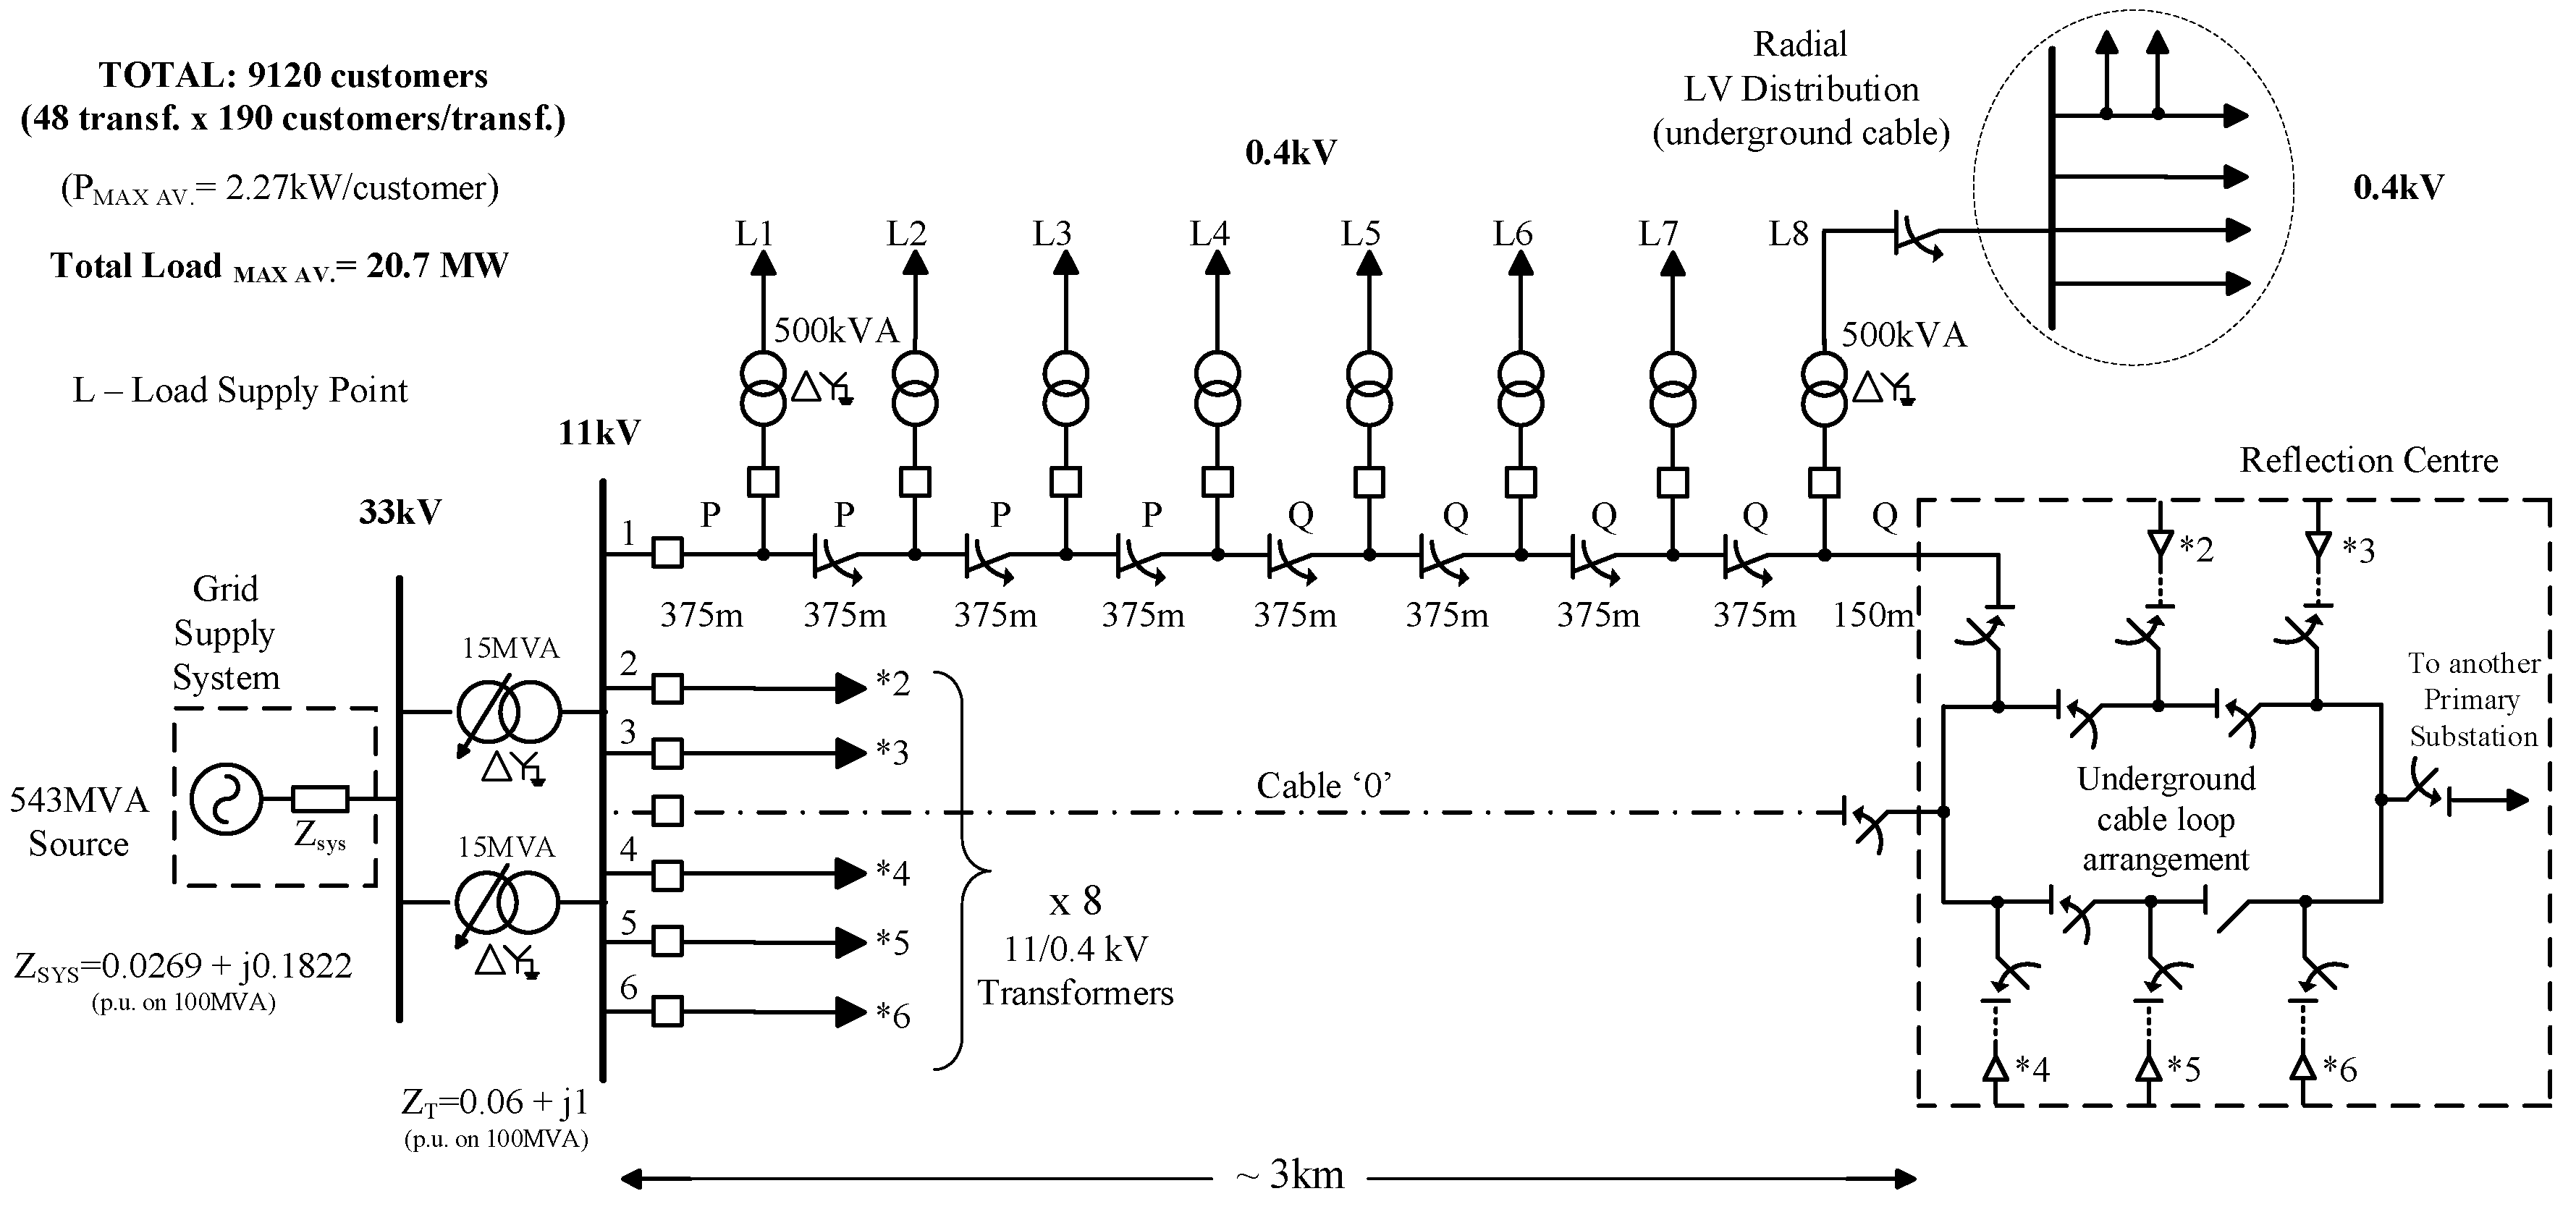
Section 2 presents the realistic large MV/LV urban distribution network used for the analysis, detailing the aggregation techniques for reducing the complexity of involved calculations. The reliability assessment methodology is presented in
Section 3, while a number of scenarios designed to demonstrate the comparative benefits in network reliability performance by the deployment of different DERs is detailed in
Section 4. The network reliability performance, quantified by the standard set of reliability indices, such as energy not supplied (ENS), frequency and duration of long (LI) and short (SI) interruptions, is presented and discussed in
Section 5. Finally,
Section 6 lists the main conclusions from the presented work.
3. Reliability Assessment Methodology
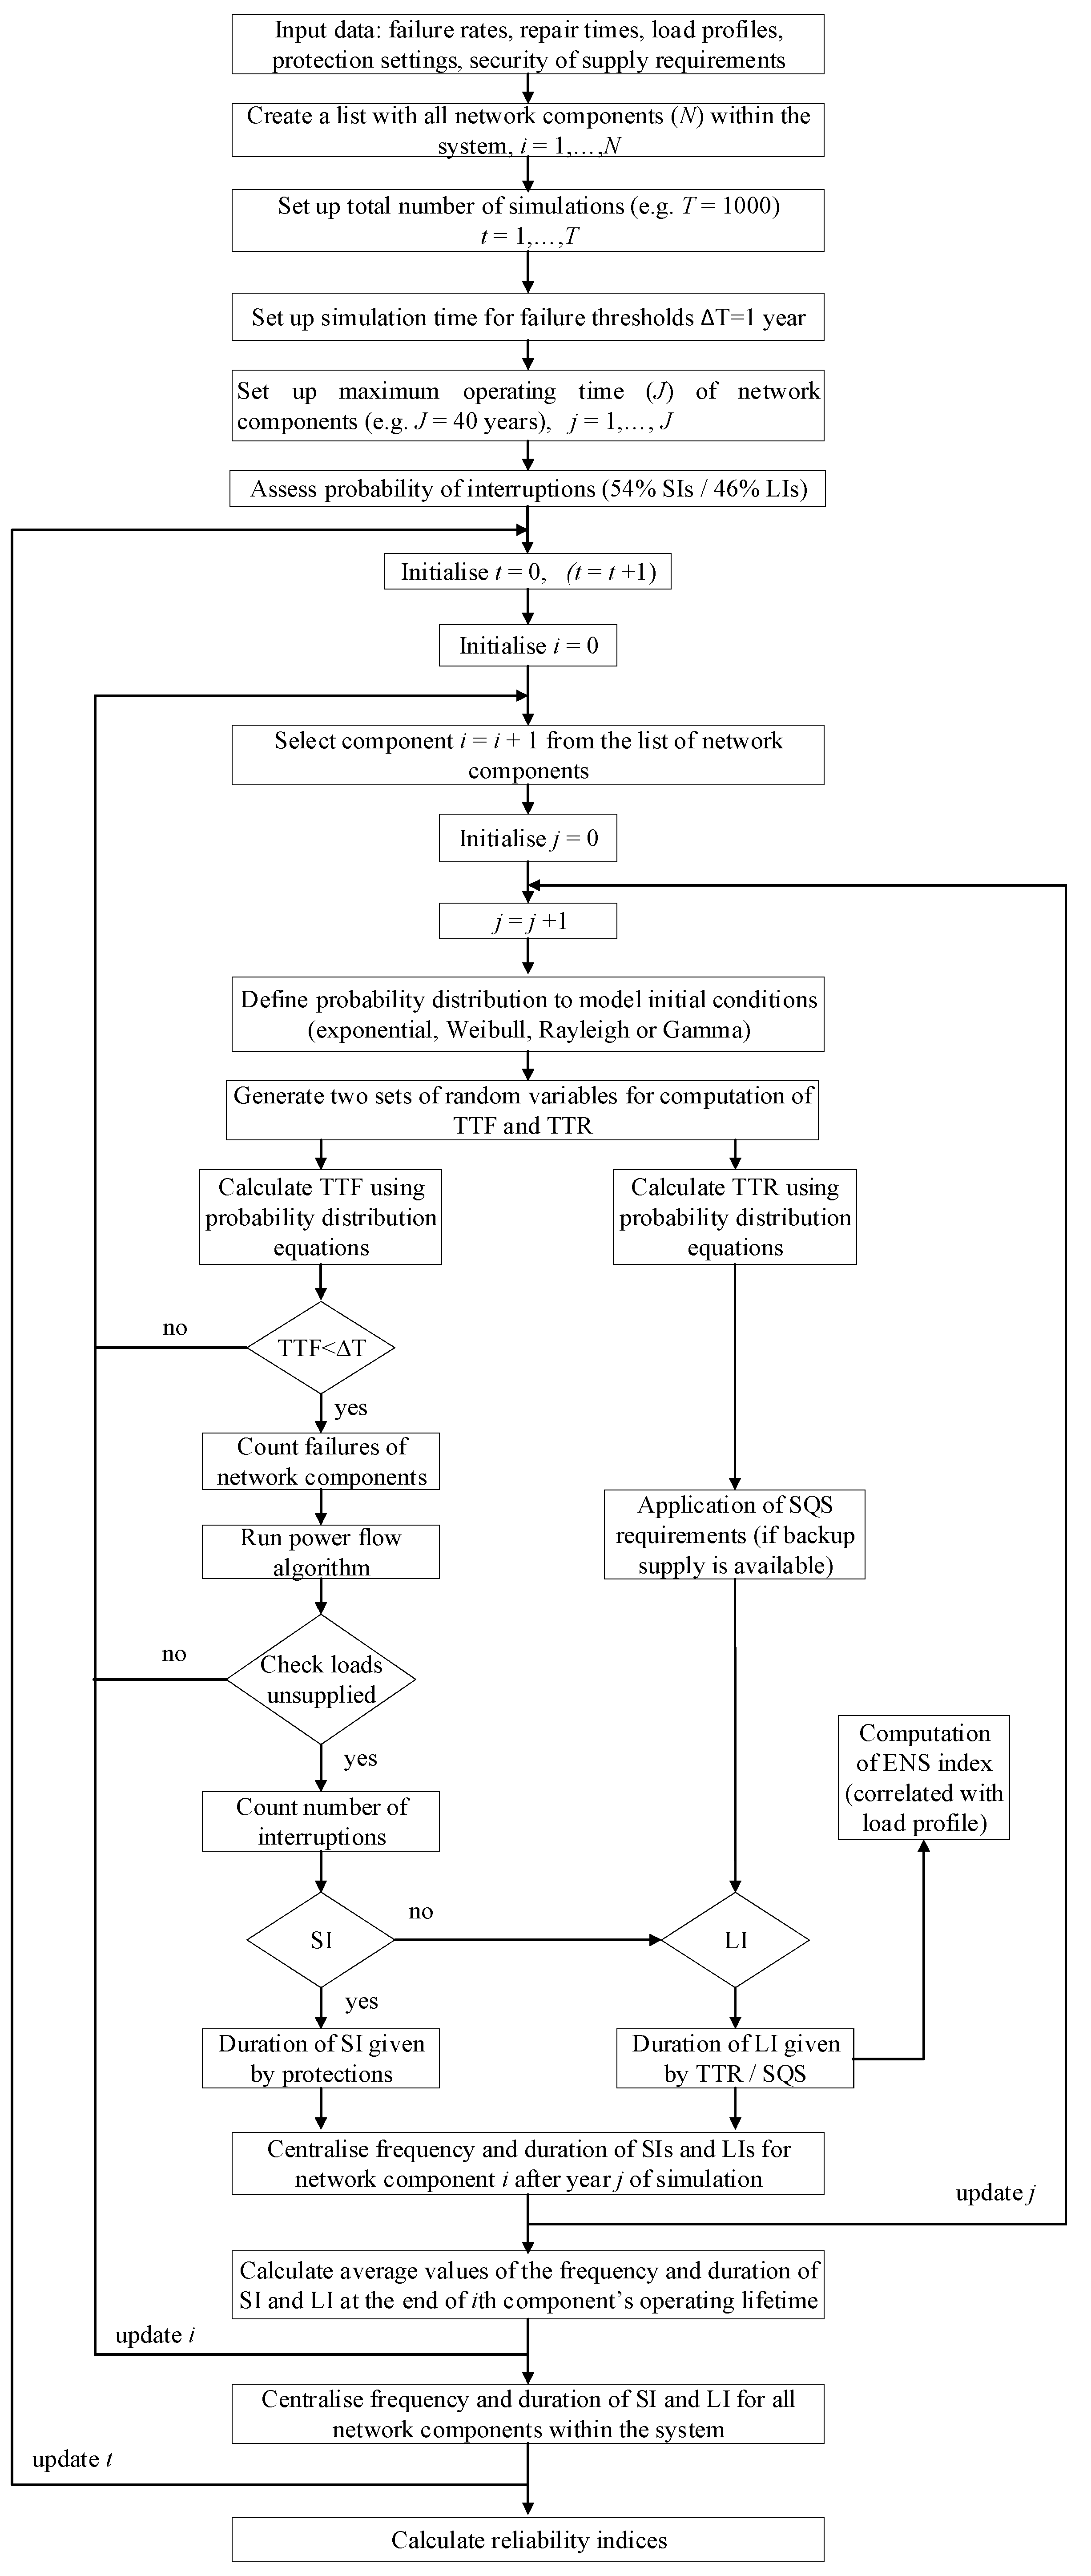
As mentioned, the main reliability parameters used as inputs to the MCS in this paper are failure rates and mean repair times. These are allocated to each PC before system reliability is assessed. It is previously shown that they are not static average values, but vary over time and are therefore more accurately represented using probability density functions (PDFs). Accordingly, the inverse transform method is used in this paper to generate random variates that follow exponential and Rayleigh distributions for failure rates and repair times respectively. This is necessary to convert failure rates and repair times into the two main system states, Time to Fail (TTF) and Time to Repair (TTR), based on various PC operating and failure stages. Equations (5) and (6) provide general formulae of the considered PDFs as input for MCS. Also, PC failure rates are modelled based on a ‘bathtub’ distribution curve (time-varying failure rate). This is a more realistic approach, because it captures the fact that there is a higher likelihood of failure when the PC has just been installed and when it is near to the end of its service [
27]:
Each simulation run is performed on a year-by-year time basis in 40-year cycles (assumed component’s lifetime) and halted when convergence is met, or when 1000 years elapse. Whenever a component fails, a power flow calculation is run to evaluate the number and demand of affected loads. The algorithm is implemented using a combination of MatLab code and PSS/E software, automated using Python. The main steps of the MCS approach used in this paper are encapsulated in Figure 5. Previous work has validated that 1000 years is a sufficient simulation time length to maintain the accuracy of the MCS tool employed for reliability assessment [
25]. Notably, MCS (using parallel computing for one-year simulation runs) is used to assess reliability of distribution systems in [
28]. However, PC failure rates are not varied over their expected lifecycle and the general simulation resolution is relatively lower (1 h) than that utilised in this study. Furthermore, this MCS method is enhanced by the use of time-varying electricity demand profiles, as opposed to the regularly used peak or maximum demand [
4]. These profiles represent residential load models containing demand decomposition into different load types over the 24 h of the day, and therefore more accurately representing actual values of both active and reactive power demands.
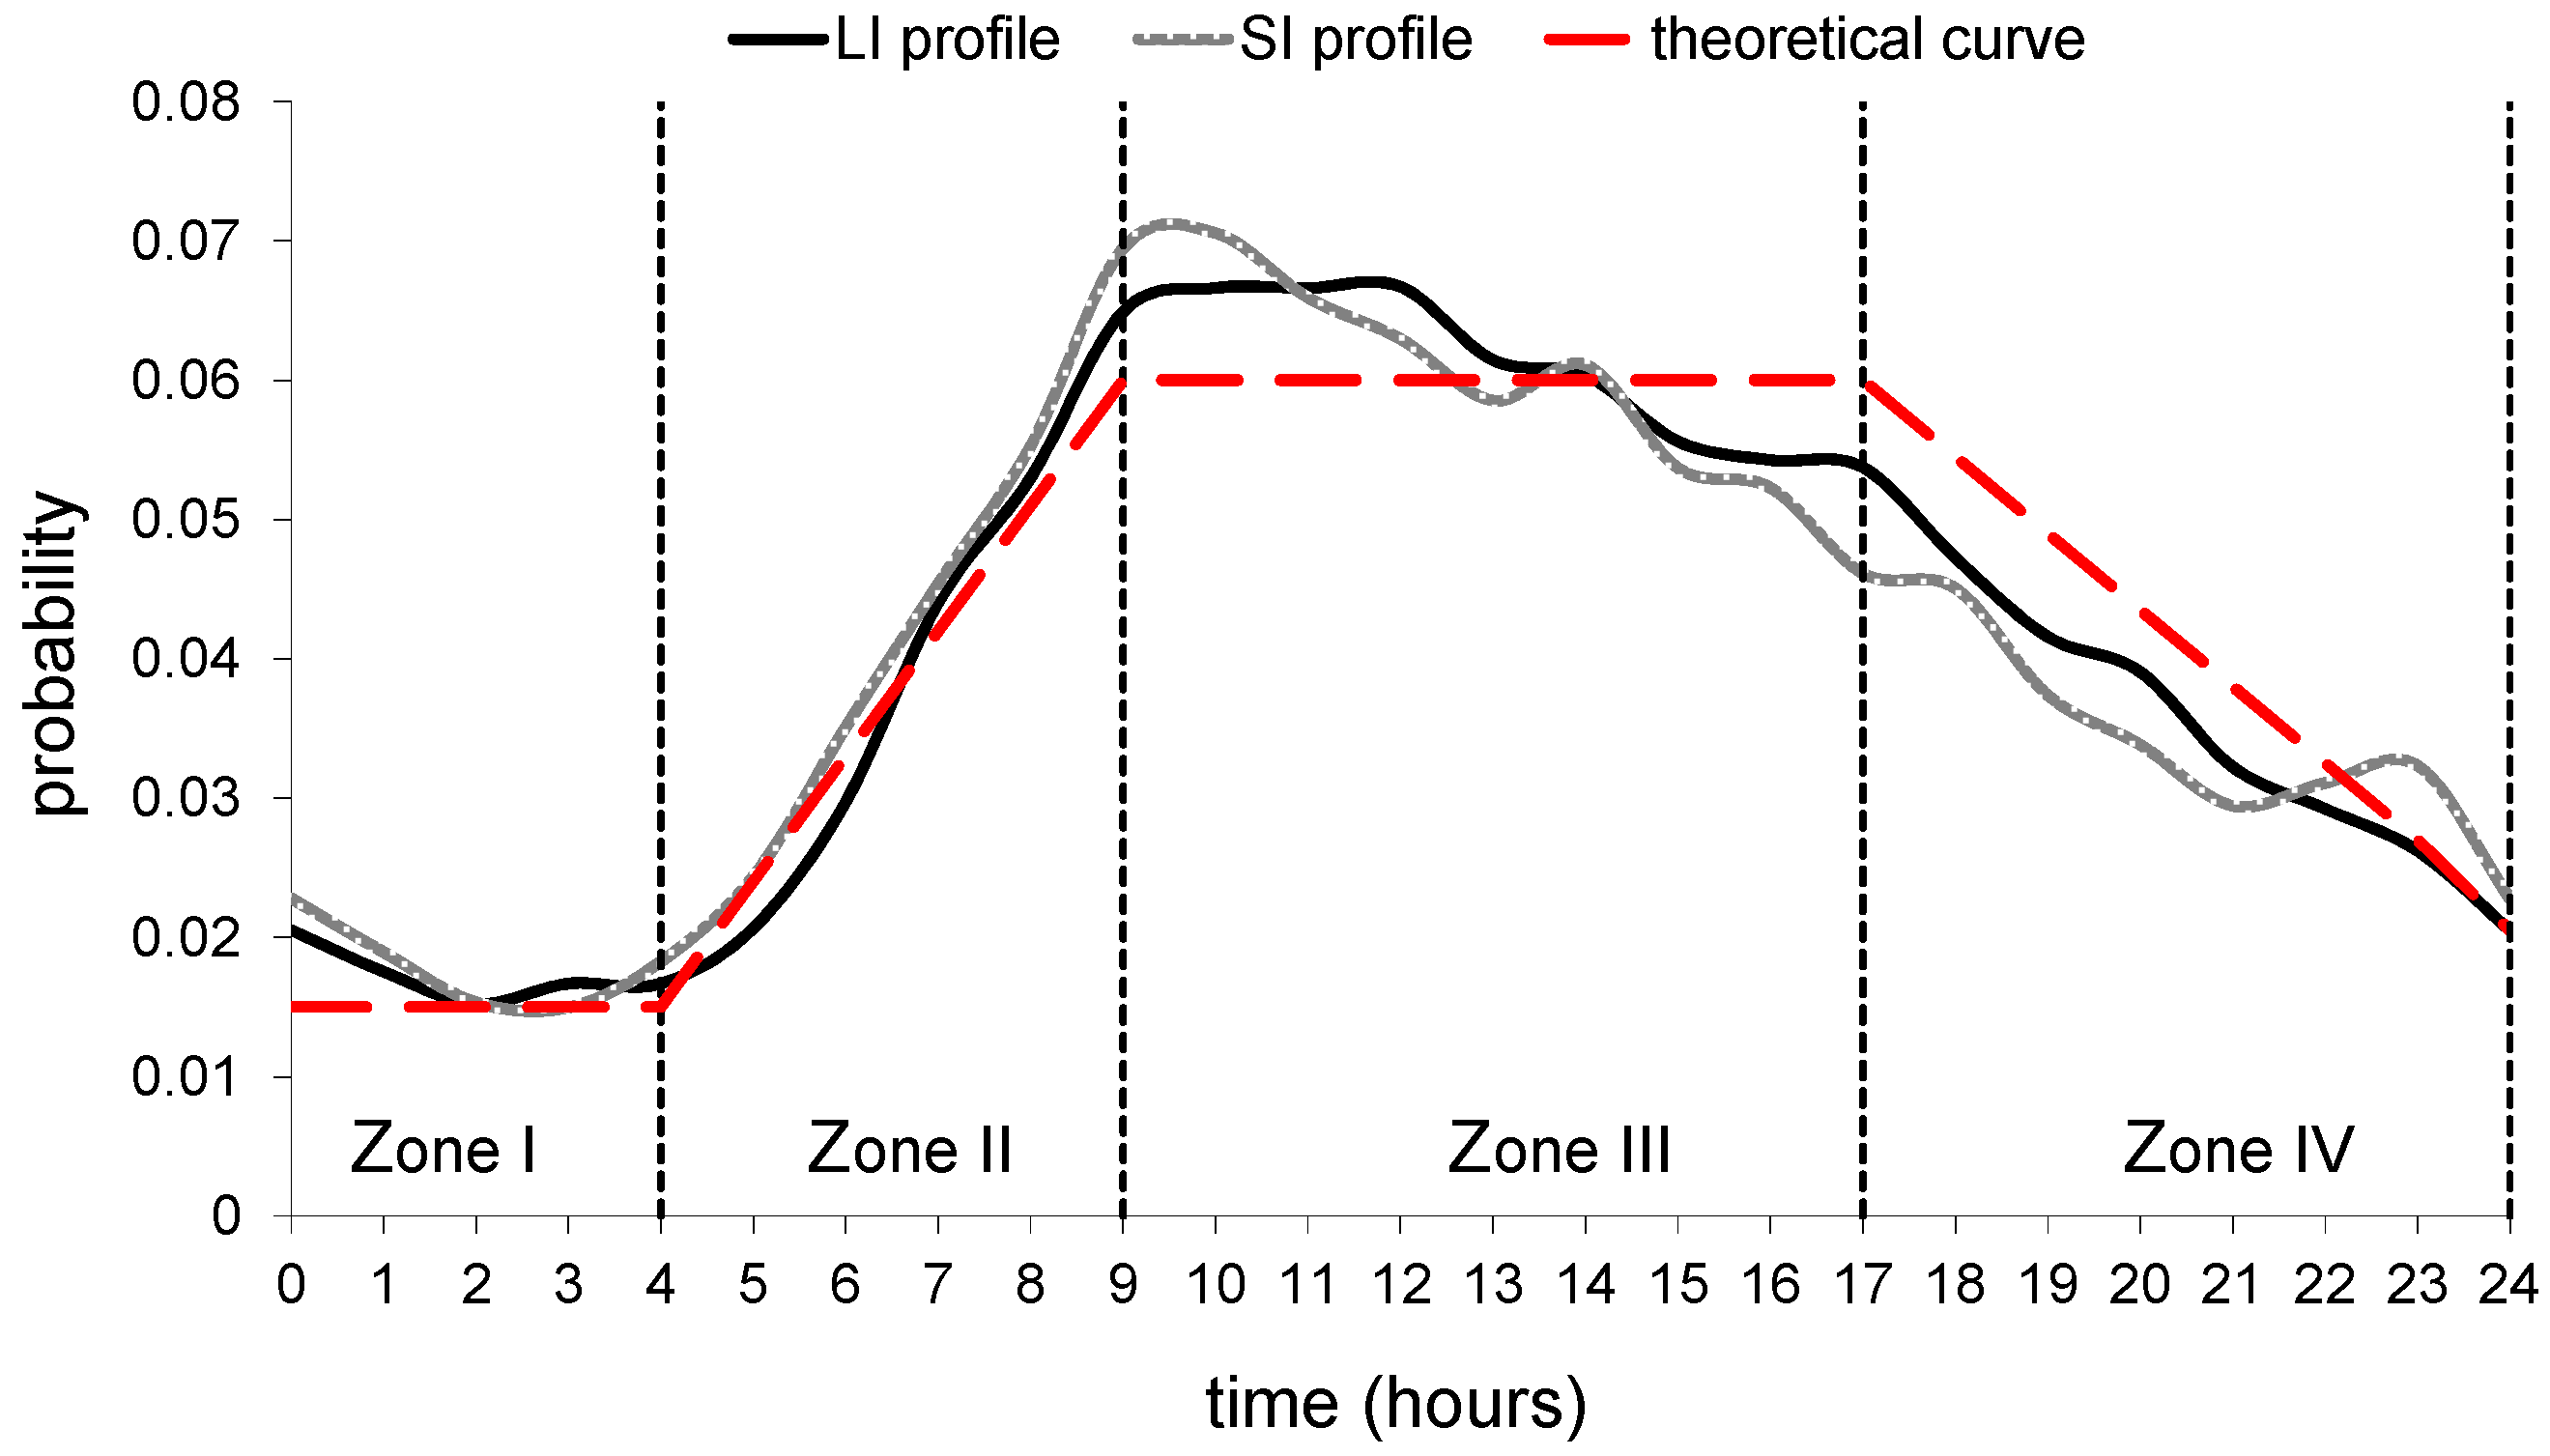
An important feature of the presented analysis is that there is more accurate correlation between the moments when faults occur and the actual load demand interrupted (i.e. not simply the rated power). This further improves the overall accuracy especially when calculating energy reliability indices (e.g., ENS index). This MCS procedure also examines the extents to which the probabilities of network outages are affected by the overall system loading and network conditions. A theoretical supply interruption model in
Figure 4 is integrated into the analysis for assessing more accurately the moment in time when interruptions to electricity customers are likely to occur. This is implemented by incorporating probability profiles of both SI and LI, giving “time of the day interruption probabilities” over the 24 h of the day into the MCS algorithm, as presented in
Figure 5. The theoretical model [
29] is constructed from previously recorded SI and LI statistics by two different European DNOs. These were particularly important for producing the empirical interruption probability models, which are applicable when specific SI/LI statistics are unavailable.
Together with a comprehensive database of PCs from the UK DNOs, this model allows to reproduce more accurately the stochastic characteristics of the network reliability performance. Different sets of DER schemes are then deployed on this base case network, e.g., using ES systems to compensate for the intermittency of PV DGs, as well as tailored DSR schemes, based on the theoretical interruption model. Design and implementation of these smart grid technologies and functionalities, denoted in the further text as “smart interventions”, are described in detail in the next section. The replicability and flexibility of this methodology is thoroughly justified in published work by the authors, e.g., in [
2,
4,
9,
24,
29,
30], where the same core technique is applied to different ranges of high-to-low voltage network configurations, load subsectors, and different type and penetration of DERs.
6. Conclusions
This paper provides an in-depth analysis of the potential reliability performance improvements from the implementation of three smart grid DER functionalities: PV-generation, energy storage (ES) and demand-side response (DSR). The potentials of these technologies are assessed by percentage improvements in the calculated standard reliability indices over the base case (no DERs). The presented methodology is illustrated for a typical meshed underground MV distribution system, in which supplied LV networks are modelled by equivalent aggregate representations. Details of the methodology, modelled urban MV and LV networks, power components data, DER characteristics and all modelling assumptions have been thoroughly described, including the corresponding deployment of the proposed DER scenarios (SC-2 to SC-6). The key benefits of the proposed methodology are in its wider applicability to varying system configurations and load mixes, as well as its capability to demonstrate the relative reliability-performance benefits of different DER technologies. However, it is important to note that when assessing very large systems, i.e. combining multiple MV/LV networks or even different energy vectors, this method is only limited in efficacy by the computational time and burden required, as well as the aggregation techniques to lower system complexity. For that purpose, specifically tailored aggregation techniques should be integrated within this methodology, which will form part of further work by the authors.
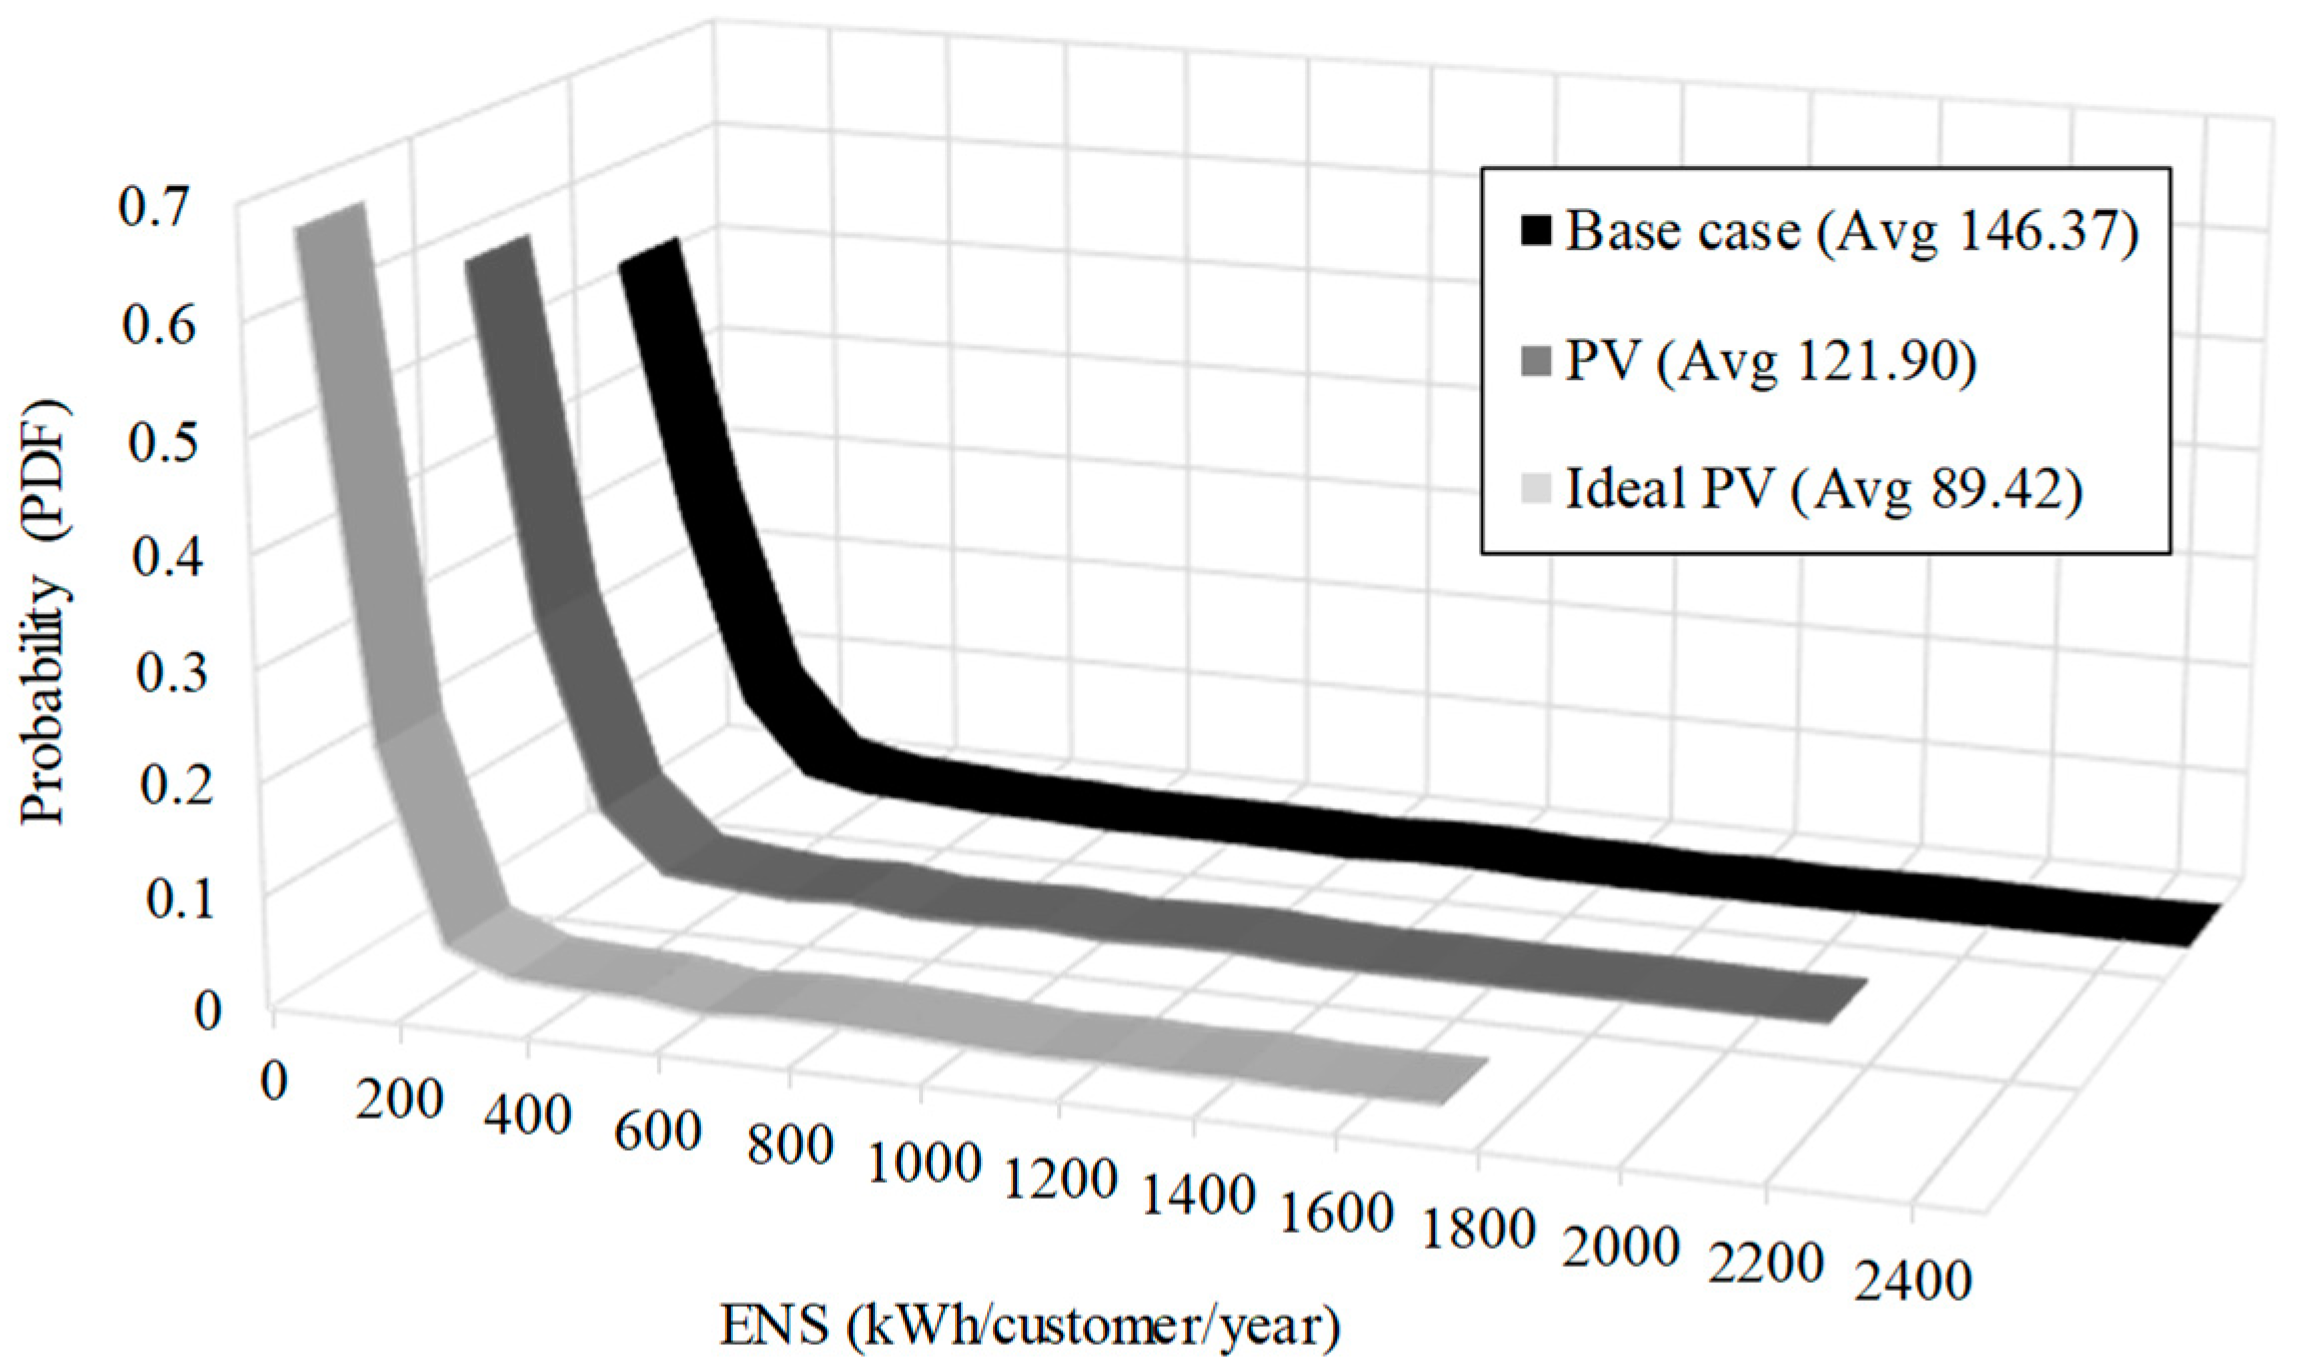
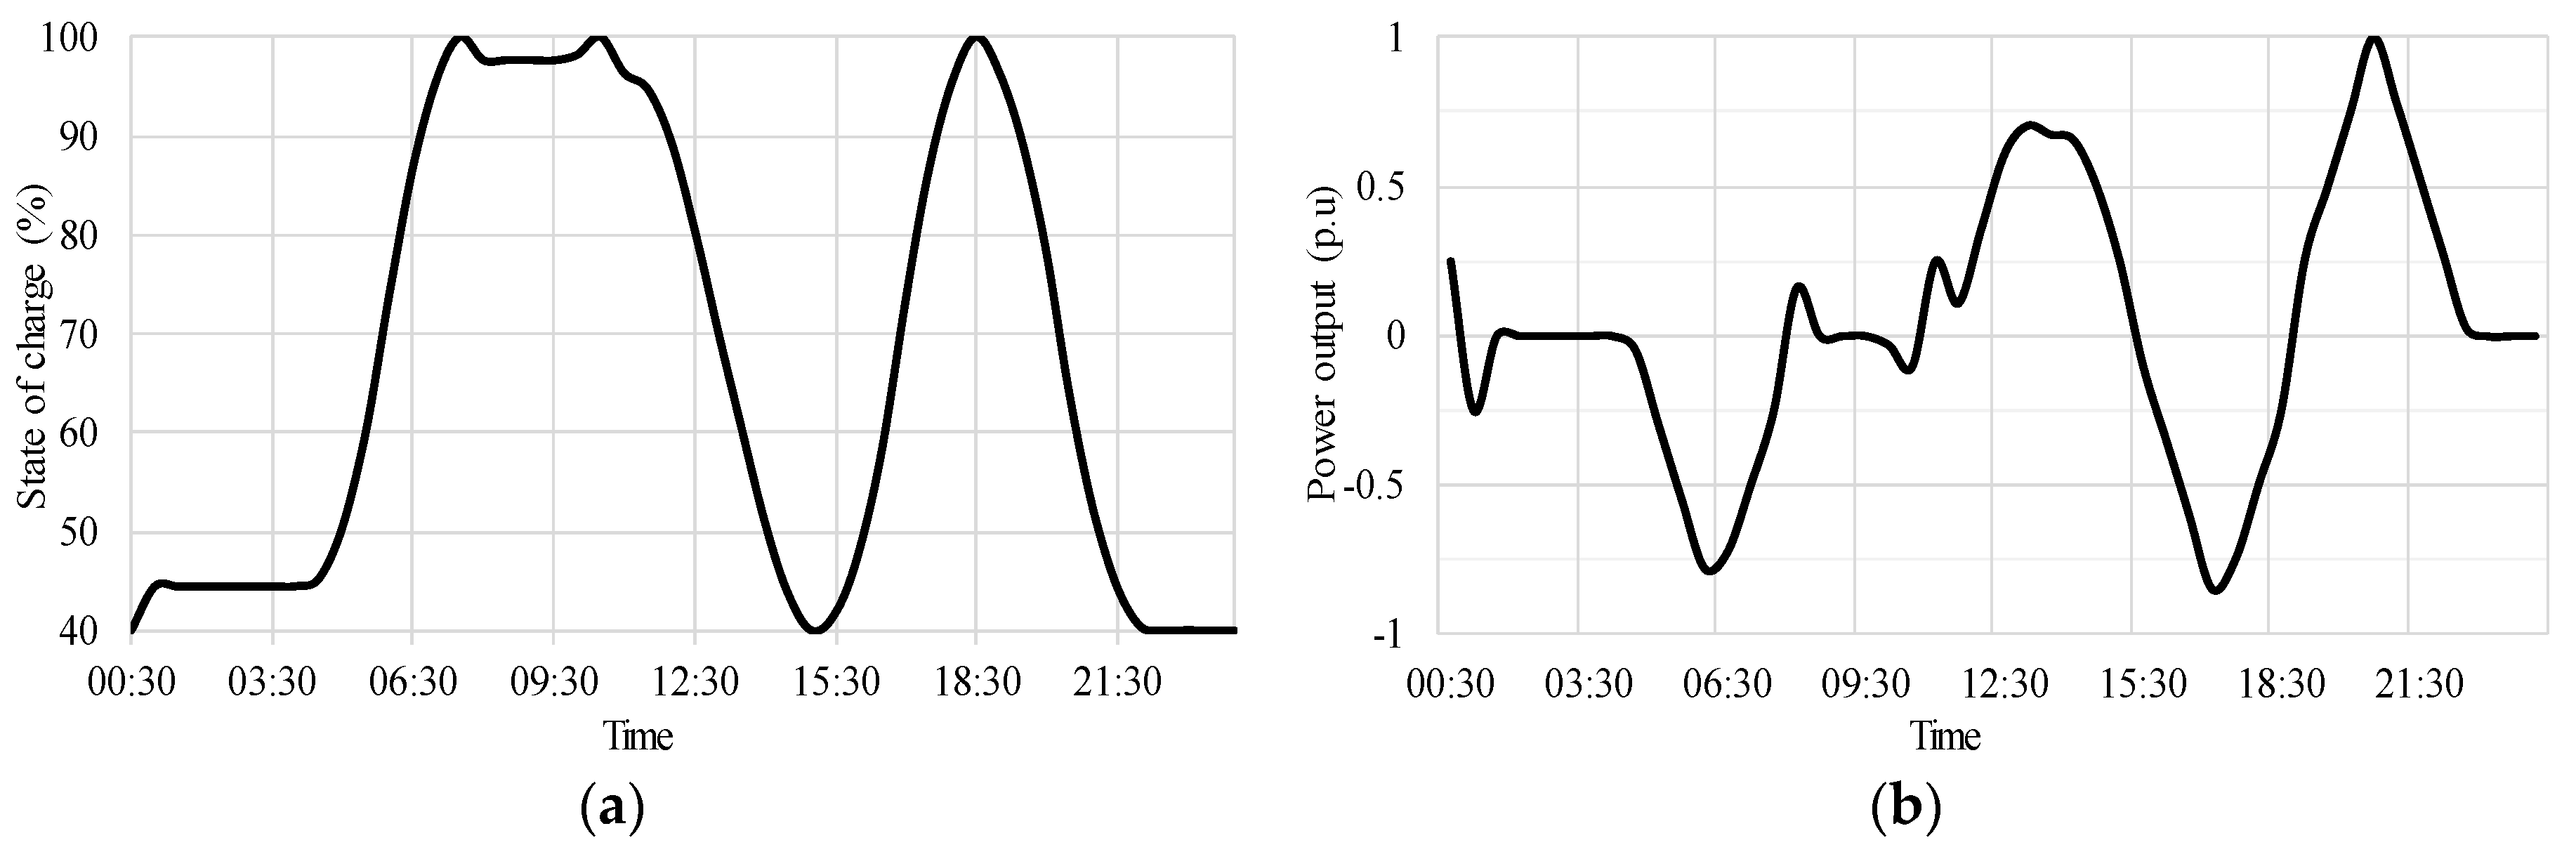
A detailed analysis of the presented results provides valuable information as to how to address the stochastic behaviour of PV generation, in order to optimise network reliability performance. It is shown that using an intelligent energy management system (EMS) that controls operation of an ES installation, while taking into account variations in state of charge levels of ES, significantly improves network reliability performance through the reductions of frequency and duration of interruptions, as well as energy not supplied to the customers (ENS). In analysing PV-based generation, the paper addresses the impact of cloud movements and transients on the solar PV power output, the associated energy loss and the effects of these on system reliability performance. It is generally found that overestimation of the benefits offered by PV (over 22%) is possible if the effects of clouding are not accurately accounted for in the PV models. Results demonstrate the capability of ES to be especially efficient in reducing the number of interrupted customers, and more importantly, the energy not supplied to affected customers. The presented work provides contributions in terms of developing more flexible and more accurate reliability assessment tools and improved techniques that can be easily deployable in real-life applications for the evaluation of most cost-effective DER solutions. DNOs can take advantage of such tools for use in system planning operations whereby relative reliability performance benefits, tied to the deployment of various DERs, can be justified both technically and financially.


