Numerical Study on Thermal Hydraulic Performance of Supercritical LNG in Zigzag-Type Channel PCHEs
Abstract
:1. Introduction
2. Numerical Approach
2.1. Physical Model and Boundary Conditions
2.2. Thermo-Physical Properties of Supercritical LNG
2.3. Numerical Method and Grid Independence
2.4. Model Validation
3. Results and Discussion
3.1. Effect of Bend Angles of the Zigzag Channel
3.2. Effect of Mass Flux
3.3. Effect of Inlet Pressure
4. Conclusions
- (1)
- The local convection heat transfer coefficient rises and then falls along the streamwise direction, with the peak value appearing at the pseudo-critical temperature. The pressure drop also increases along the streamwise direction.
- (2)
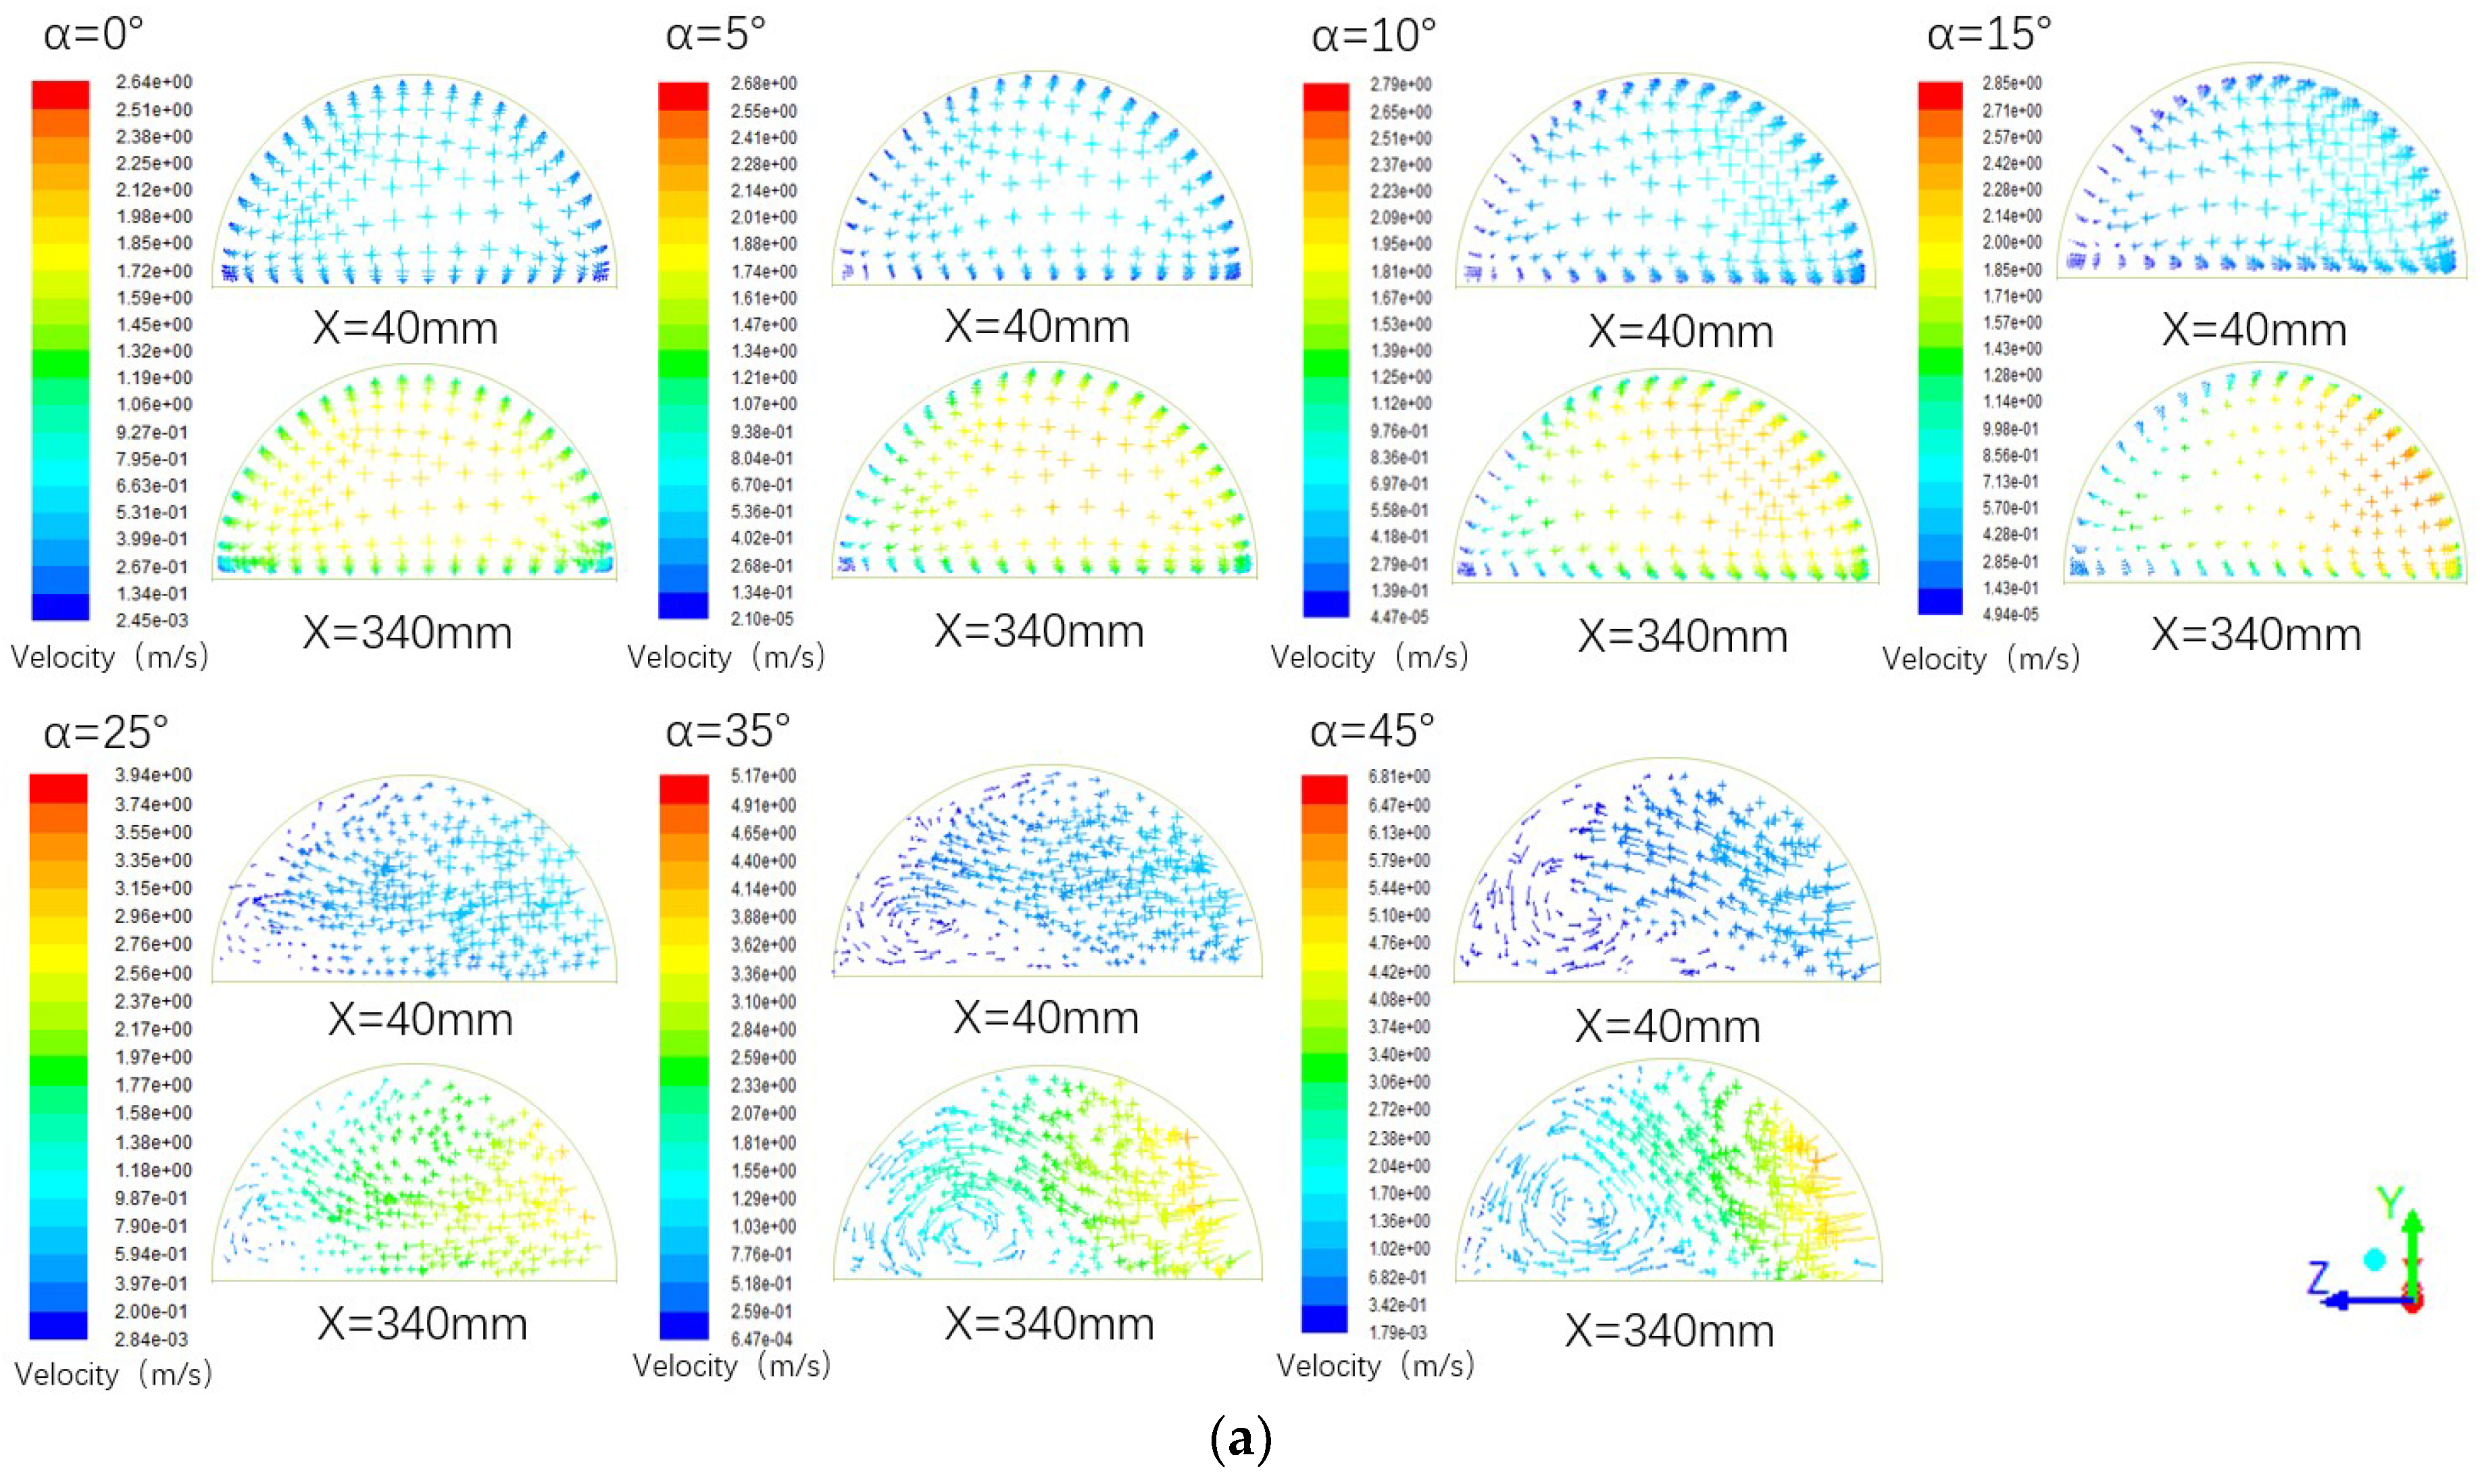
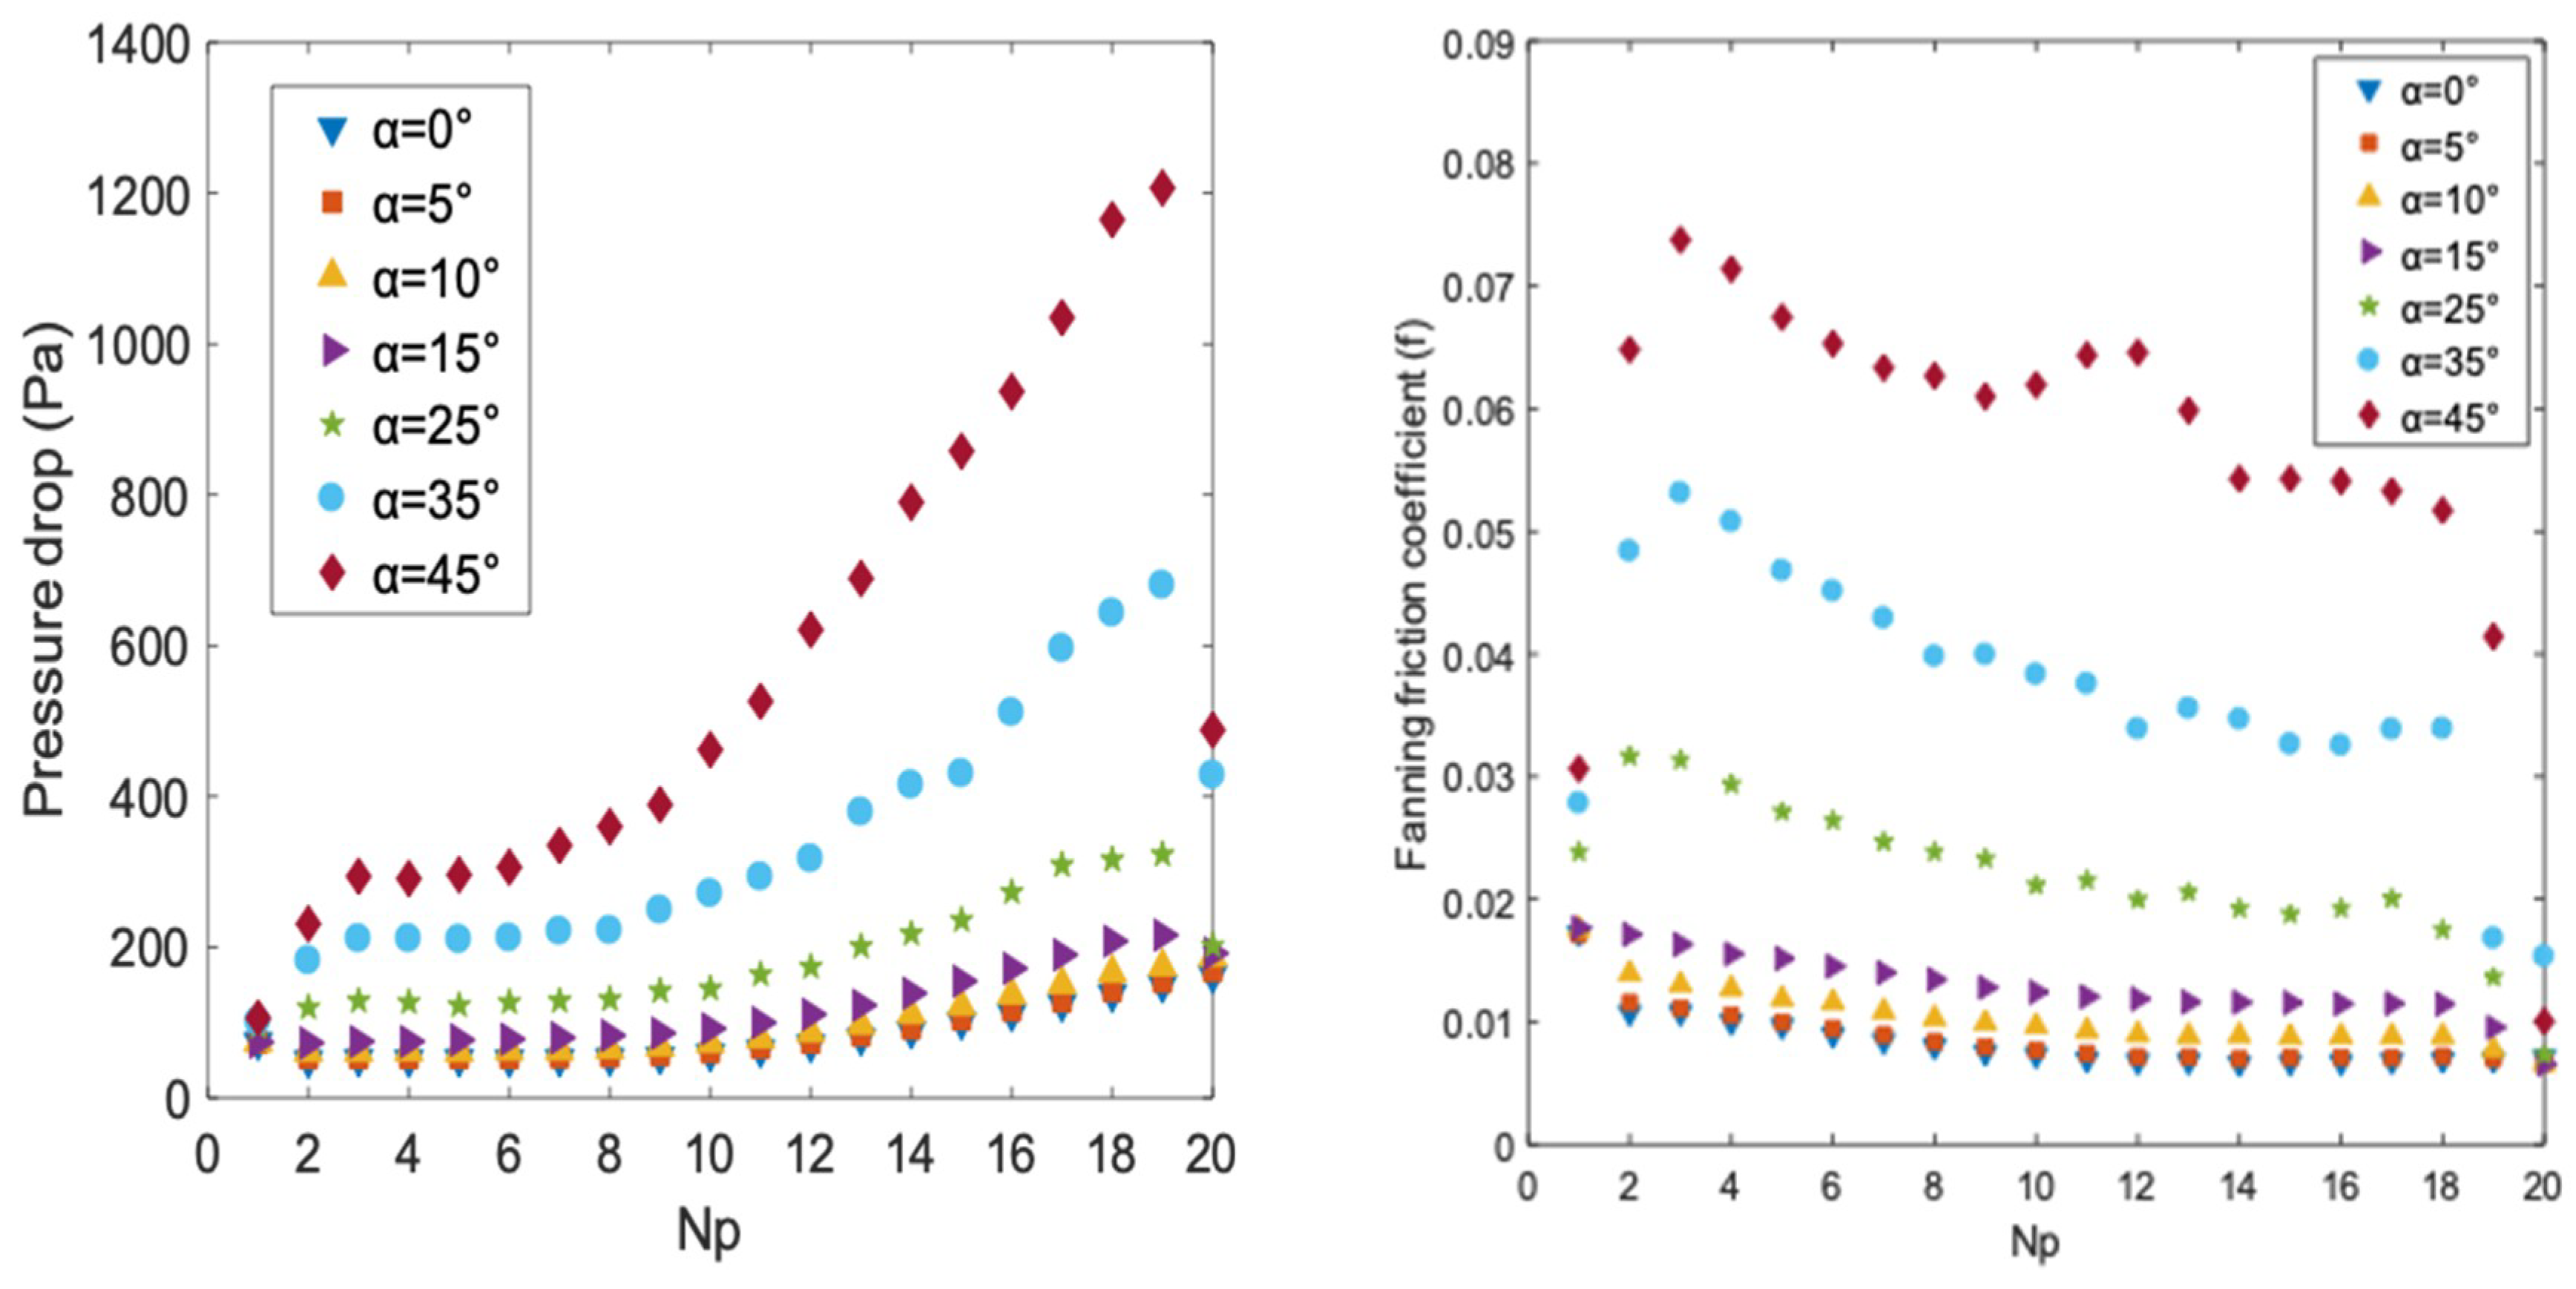
- As the channel bend angle is increased, the local convection heat transfer coefficient and pressure drop rise, and so do the Nu and Euler numbers. The enhancement of heat transfer capability of supercritical LNG is mainly owed to increased turbulence. The increase of pressure drop is mainly due to the rising of velocity and the increase of flow resistance caused by the existence of vortices.
- (3)
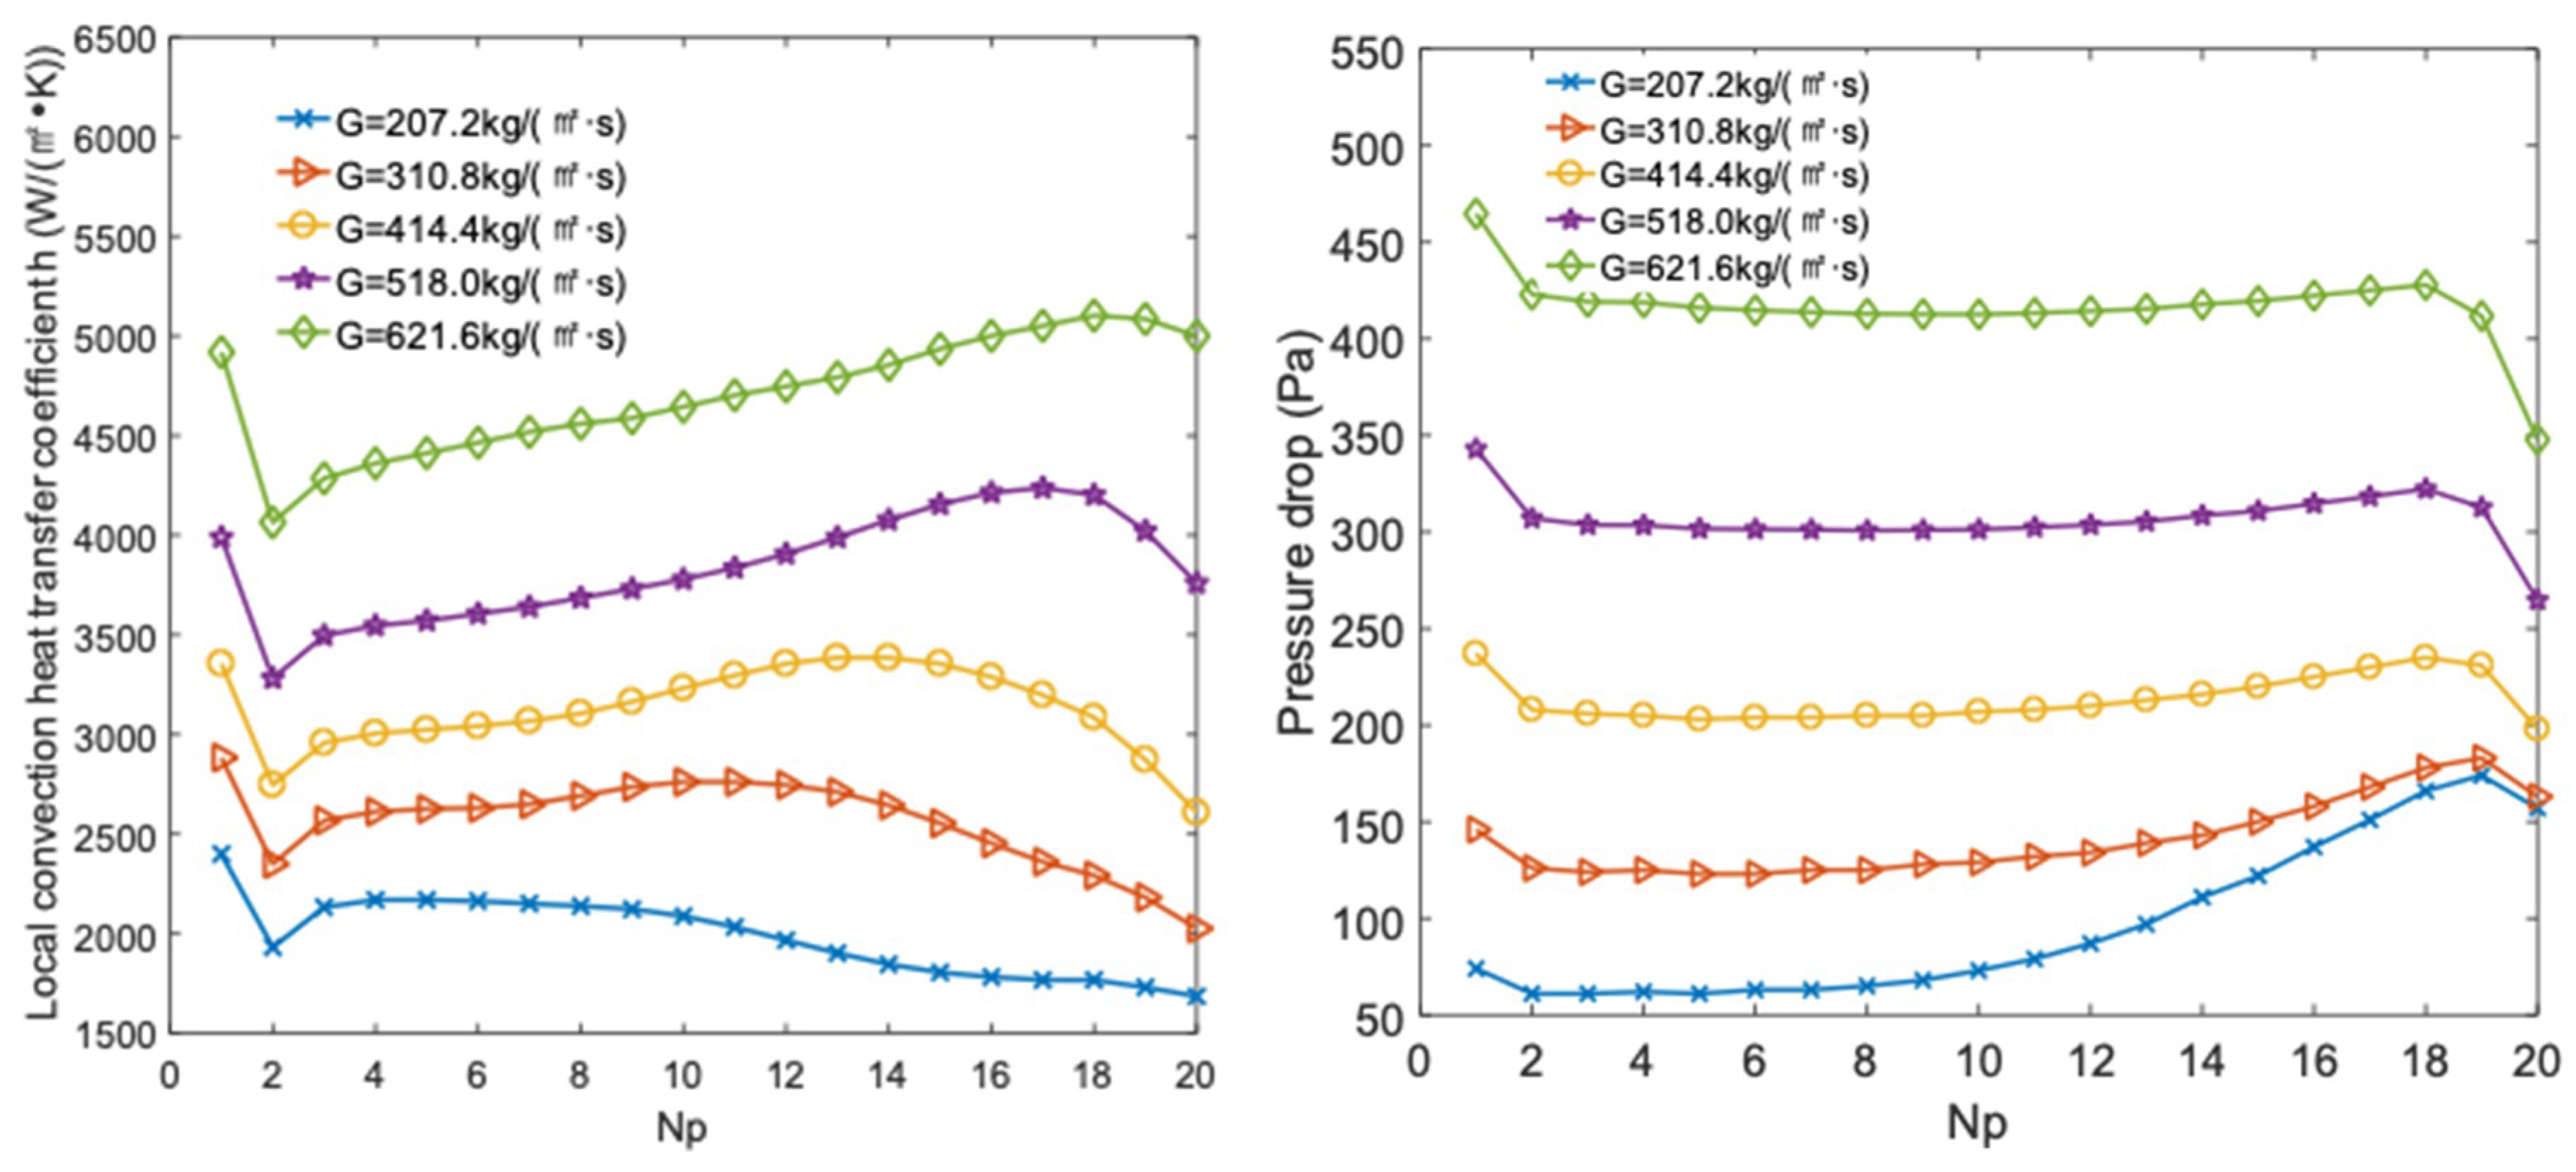
- The local convective heat transfer coefficient and pressure drop increase significantly as the mass flux is increased due to the enhancement of turbulent flow. When the mass flux is increased by 2-fold, the local heat transfer coefficient rises by 1.4 times, and the pressure drop increases 3.3 times. The Nu increases as mass flux is increased. However, at the last third of the channel, Nu decreases as the mass flux is raised because of the decreased heat per unit volume absorbed by the LNG. This suggests that when the mass flux is raised, the heat transfer performance of the whole channel is better, but with the development of the fluid’s flow, the local heat transfer performance is reduced at the last third of the channel owing to the reduction of heat-absorbed capacity by the unit volume fluid.
- (4)
- The improvement of heat transfer performance with bend angle depends on the mass flux. The supercritical LNG has better heat transfer performance when the bend angle is less than 15° when the mass flux ranges from 207.2 kg/(m2·s) to 621.6 kg/(m2·s), and improves at bend angles of 10° and lower compared to 15° at mass fluxes above 414.4 kg/(m2·s).
- (5)
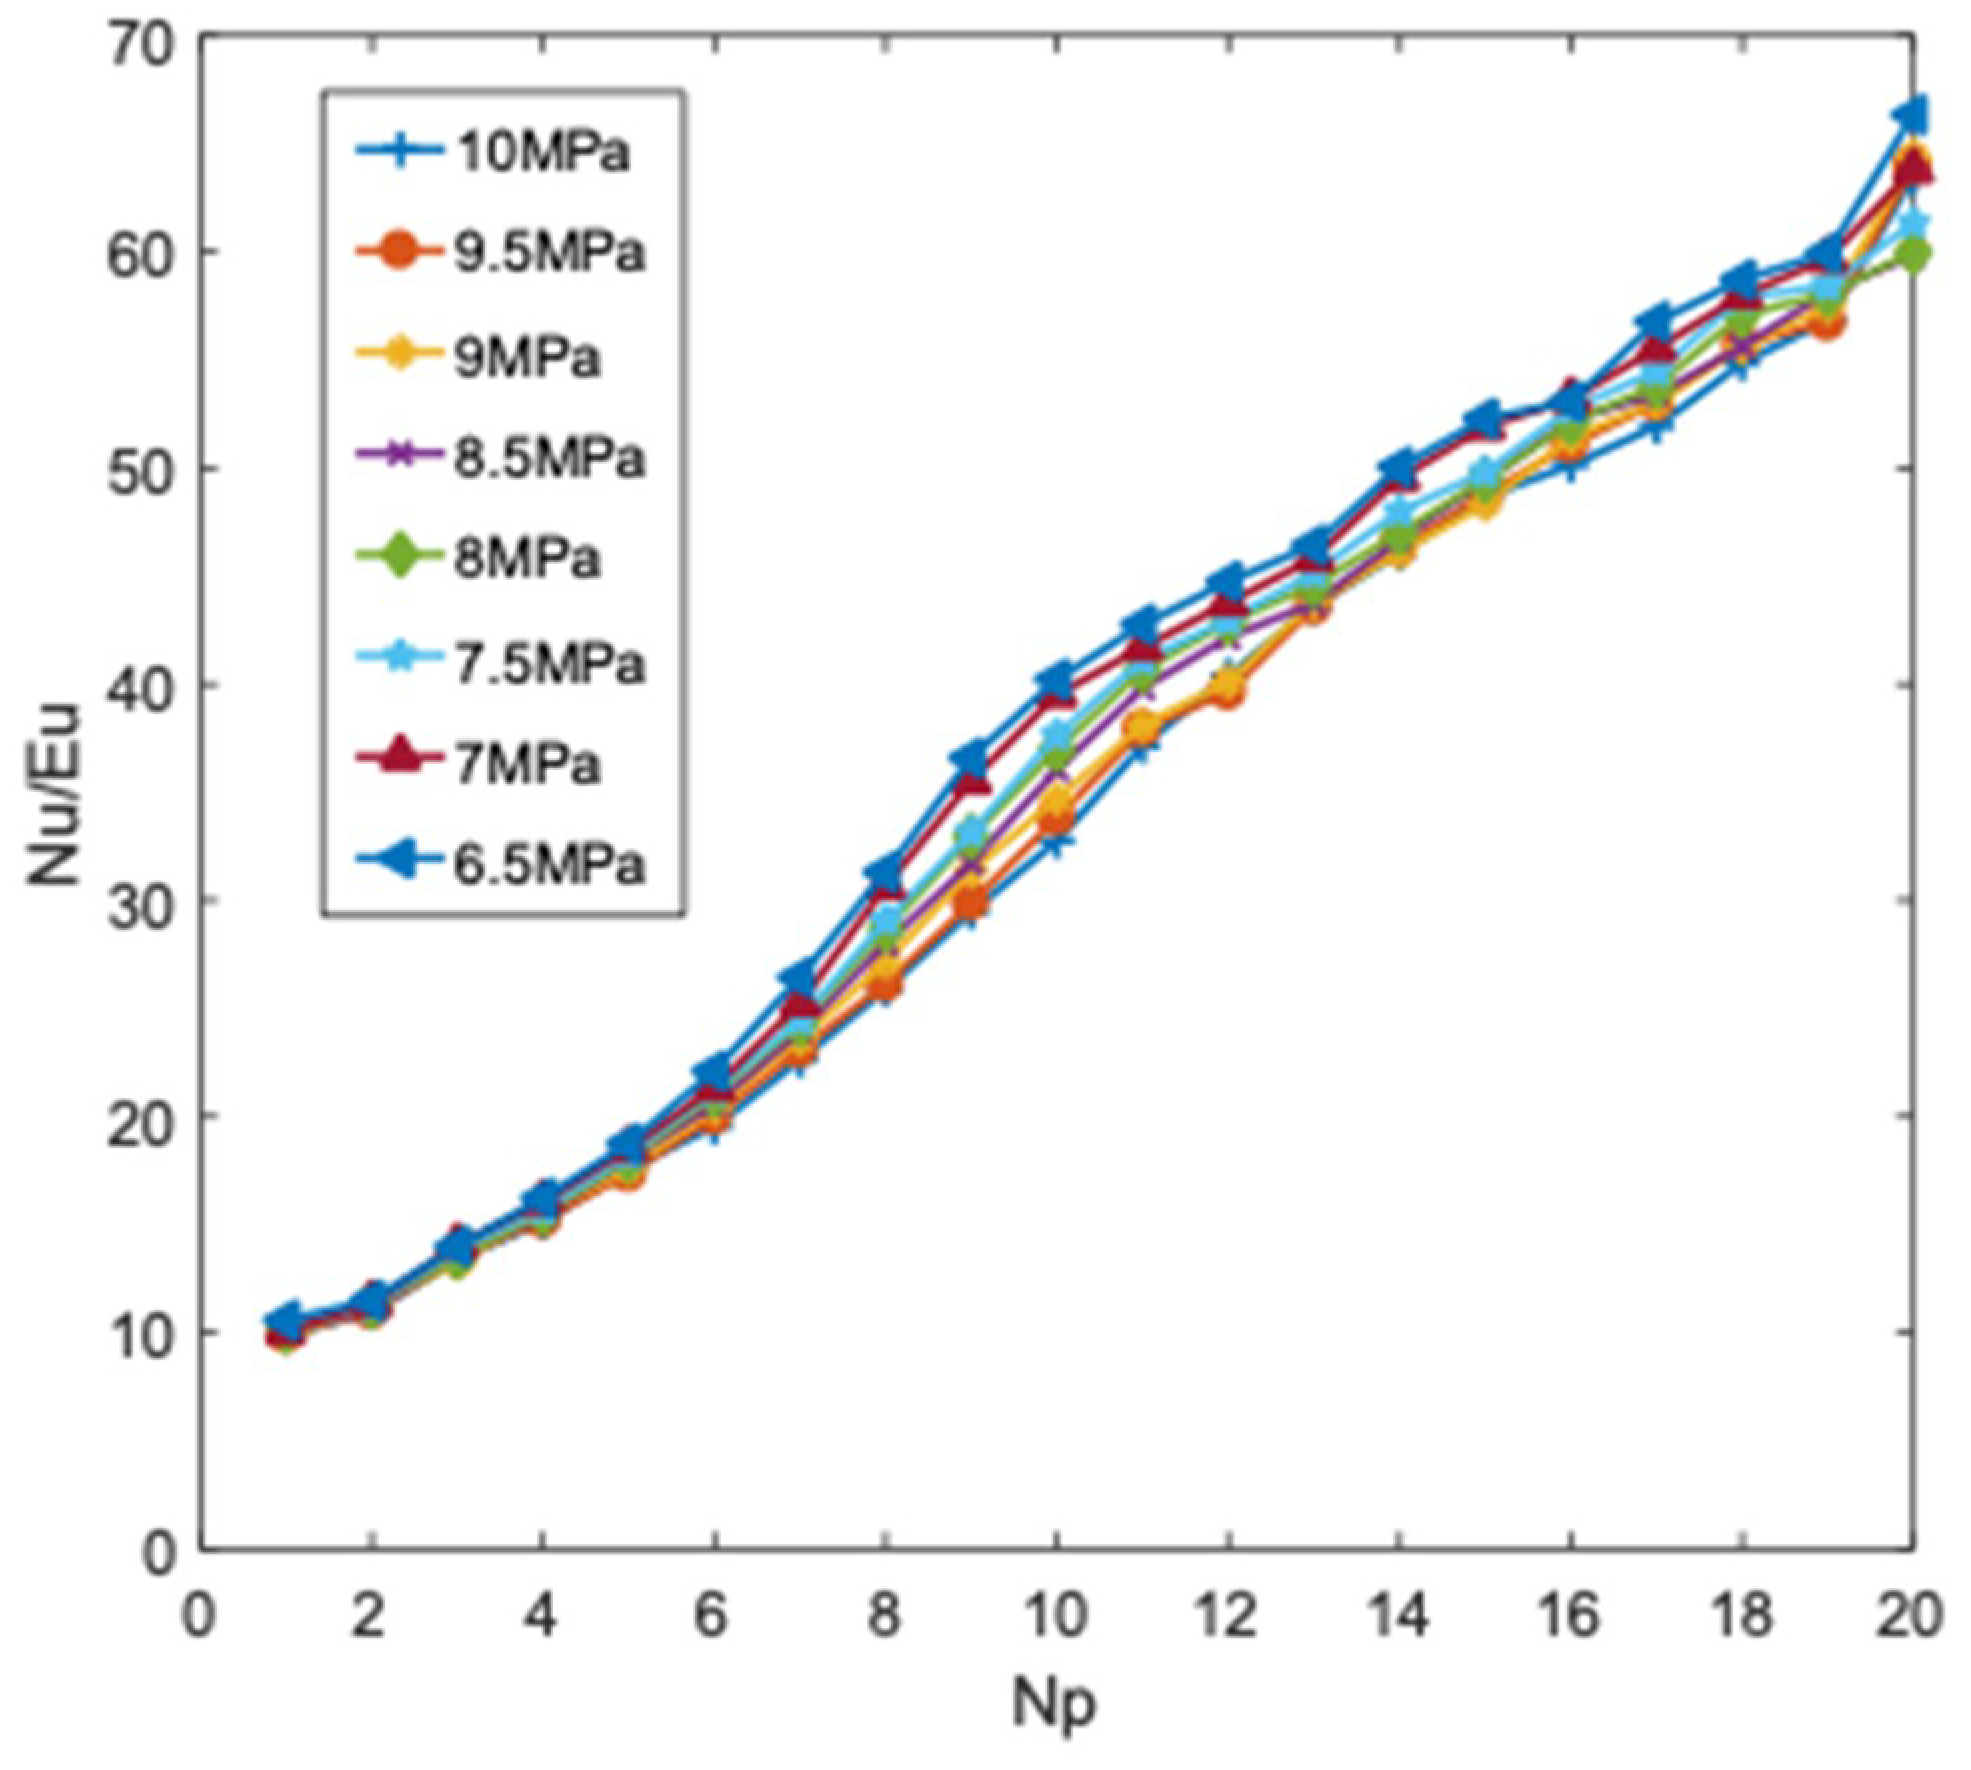
- Before the pseudo-critical temperature, the local convective heat transfer coefficient changes little with the inlet pressure, while it increases when the temperature surpasses pseudo-critical point. The pressure drop is reduced as the inlet pressure increases. Nu and EU decrease with increasing inlet pressure, while Nu/Eu reaches a maximum at 6.5 MPa. The results show that supercritical LNG has a better heat transfer performance in zigzag channel of PCHE at lower operating pressures.
Author Contributions
Funding
Conflicts of Interest
Nomenclature
| T | Temperature (K) |
| P | Pressure (Pa) |
| L | length of channel (mm) |
| Fanning factor | |
| v | Velocity (m/s) |
| Re | Reynolds number |
| h | Convective heat transfer coefficient (W/(m2·K)) |
| Nu | Nusselt number |
| Eu | Euler number |
| Cp | Specific heat (KJ/(kg·K)) |
| Dh | hydraulic diameter (m) |
| G | mass flux (kg/(m2·s)) |
| ∆P | pressure drop (Pa) |
| pressure drop due to friction (Pa) | |
| pressure drop due to acceleration (Pa) | |
| τ | shear stress at the wall (Pa) |
| Greek symbols | |
| µ | viscosity (Pa·s) |
| density (kg/m3) | |
| λ | thermal conductivity (W/(m·K)) |
| Subscript | |
| w | Wall |
| b | Bulk mean |
| in | inlet |
| out | outlet |
References
- Pham, T.N.; Long, N.V.D.; Lee, S.; Lee, M. Enhancement of single mixed refrigerant natural gas liquefaction process through process knowledge inspired optimization and modification. Appl. Therm. Eng. 2017, 110, 1230–1239. [Google Scholar] [CrossRef]
- Pu, L.; Qu, Z.G.; Bai, Y.H.; Qi, D.; Sun, K.; Yi, P. Thermal performance analysis of intermediate fluid vaporizer for liquefied natural gas. Appl. Therm. Eng. 2014, 65, 564–574. [Google Scholar] [CrossRef]
- Xu, S.; Chen, X.; Fan, Z. Thermal design of intermediate fluid vaporizer for subcritical liquefied natural gas. J. Nat. Gas Sci. Eng. 2016, 32, 10–19. [Google Scholar] [CrossRef]
- Pan, J.; Li, R.; Lv, T.; Wu, G.; Deng, Z. Thermal performance calculation and analysis of heat transfer tube in super open rack vaporizer. Appl. Therm. Eng. 2016, 93, 27–35. [Google Scholar] [CrossRef]
- Han, C.-L.; Ren, J.-J.; Wang, Y.-Q.; Dong, W.-P.; Bi, M.-S. Experimental investigation on fluid flow and heat transfer characteristics of a submerged combustion vaporizer. Appl. Therm. Eng. 2017, 113, 529–536. [Google Scholar] [CrossRef]
- Kim, J.H.; Baek, S.; Jeong, S.; Jung, J. Hydraulic performance of a microchannel PCHE. Appl. Therm. Eng. 2010, 30, 2157–2162. [Google Scholar] [CrossRef]
- Chu, W.-X.; Li, X.-H.; Ma, T.; Chen, Y.-T.; Wang, Q.-W. Experimental investigation on SCO2-water heat transfer characteristics in a printed circuit heat exchanger with straight channels. Int. J. Heat Mass Transf. 2017, 113, 184–194. [Google Scholar] [CrossRef]
- Figley, J.; Sun, X.; Mylavarapu, S.K.; Hajek, B. Numerical study on thermal hydraulic performance of a Printed Circuit Heat Exchanger. Prog. Nucl. Energy 2013, 68, 89–96. [Google Scholar] [CrossRef]
- Kim, W.; Baik, Y.-J.; Jeon, S.; Jeon, D.; Byon, C. A mathematical correlation for predicting the thermal performance of cross, parallel, and counterflow PCHEs. Int. J. Heat Mass Transf. 2017, 106, 1294–13022. [Google Scholar] [CrossRef]
- Yoon, S.-Y.; O’Brien, J.; Chen, M.; Sabharwall, P.; Sun, X. Development and validation of Nusselt number and friction factor correlations for laminar flow in semi-circular zigzag channel of printed circuit heat exchanger. Appl. Therm. Eng. 2017, 123, 1327–1344. [Google Scholar] [CrossRef]
- Ishizuka, T.; Kato, Y.; Muto, Y.; Nikitin, K.; Tri Lam, N. Thermal-hydraulic characteristics of a Printed Circuit Heat Exchanger in a supercritical CO2 loop. Nucl. React. Therm. Hydraul. 2006, 30, 109–116. [Google Scholar]
- Tsuzuki, N.; Kato, Y.; Ishiduka, T. High performance printed circuit heat exchanger. Appl. Therm. Eng. 2007, 27, 1702–1707. [Google Scholar] [CrossRef]
- Ngo, T.L.; Kato, Y.; Nikitin, K.; Tsuzuki, N. New printed circuit heat exchanger with S-shaped fins for hot water supplier. Exp. Therm. Fluid Sci. 2006, 30, 811–819. [Google Scholar] [CrossRef]
- Ngo, T.L.; Kato, Y.; Nikitin, K.; Ishizuka, T. Heat transfer and pressure drop correlations of microchannel heat exchangers with S-shaped and zigzag fins for carbon dioxide cycles. Exp. Therm. Fluid Sci. 2007, 32, 560–570. [Google Scholar] [CrossRef]
- Kim, D.E.; Kim, M.H.; Cha, J.E.; Kim, S.O. Numerical investigation on thermal hydraulic performance of new printed circuit heat exchanger model. Nucl. Eng. Des. 2008, 238, 3269–3276. [Google Scholar] [CrossRef]
- Zhao, Z.; Zhao, K.; Jia, D.; Jiang, P.; Shen, R. Numerical Investigation on the Flow and Heat Transfer Characteristics of Supercritical Liquefied Natural Gas in an Airfoil Fin Printed Circuit Heat Exchanger. Energies 2017, 10, 1828. [Google Scholar] [CrossRef]
- Lee, S.Y.; Park, B.G.; Chung, J.T. Numerical studies on thermal hydraulic performance of zigzag-type printed circuit heat exchanger with inserted straight channels. Appl. Therm. Eng. 2017, 123, 1434–1443. [Google Scholar] [CrossRef]
- Yoon, S.Y.; No, H.C.; Kang, G.B. Assessment of straight, zigzag, S-shape, and airfoil PCHEs for intermediate heat exchangers of HTGRs and SFRs. Nucl. Eng. Des. 2014, 270, 334–343. [Google Scholar] [CrossRef]
- Kim, I.H.; No, H.C. Physical model development and optimal design of PCHE for intermediate heat exchangers in HTGRs. Nucl. Eng. Des. 2012, 243, 243–250. [Google Scholar] [CrossRef]
- Huang, D.; Wu, Z.; Sunden, B.; Li, W. A brief review on convection heat transfer of fluids at supercritical pressures in tubes and the recent progress. Appl. Energy 2016, 162, 494–505. [Google Scholar] [CrossRef]
- Kim, I.H.; No, H.C. Thermal–hydraulic physical models for a Printed Circuit Heat Exchanger covering He, He-CO2 mixture, and water fluids using experimental data and CFD. Exp. Therm. Fluid Sci. 2013, 48, 213–221. [Google Scholar] [CrossRef]
- Yu, X.; Yang, X.; Wang, J. Heat Transfer and Pressure Loss of Immediate Heat Exchanger. Inst. Nucl. New Energy Technol. 2009, 43, 256–259. [Google Scholar]
- Sung, J.; Lee, J.Y. Effect of tangled channels on the heat transfer in a printed circuit heat exchanger. Int. J. Heat Mass Transf. 2017, 115, 647–656. [Google Scholar] [CrossRef]
- Nikitin, K.; Kato, Y.; Ngo, L. Printed circuit heat exchanger thermal-hydraulic performance in supercritical CO2 experimental loop. Int. J. Refrig. 2006, 29, 807–814. [Google Scholar] [CrossRef]
- Jeon, S.; Baik, Y.-J.; Byon, C.; Kim, W. Thermal performance of heterogeneous PCHE for supercritical CO2 energy cycle. Int. J. Heat Mass Transf. 2016, 102, 867–876. [Google Scholar] [CrossRef]
- Higashi, Y. NIST Thermodynamic and Transport Properties of Refrigerants and Refrigerant Matures (REFPROP). Netsu Bussei 2000, 14, 1575–1577. [Google Scholar]
- Kwon, J.G.; Kim, T.H.; Park, H.J.; Cha, J.E.; Kim, M.H. Optimization of airfoil-type PCHE for the recuperate of small scale Brayton cycle by cost-based objective function. Nucl. Eng. Des. 2016, 298, 192–200. [Google Scholar] [CrossRef]
- Han, C.L.; Ren, J.J.; Dong, W.-P.; Bi, M.-S. Numerical investigation of supercritical LNG convective heat transfer in a horizontal serpentine tube. Cryogenics 2016, 78, 1–13. [Google Scholar] [CrossRef]
- Xu, X.; Ma, T.; Li, L.; Zeng, M.; Chen, Y.; Huang, Y.; Wang, Q. Optimization of fin arrangement and channel configuration in an airfoil fin PCHE for supercritical CO2 cycle. Appl. Therm. Eng. 2014, 70, 867–875. [Google Scholar] [CrossRef]
- Zhao, Z.; Zhang, X.; Zhao, K.; Jiang, P.; Chen, Y. Numerical investigation on heat transfer and flow characteristics of supercritical nitrogen in a straight channel of printed circuit heat exchanger. Appl. Therm. Eng. 2017, 126, 717–729. [Google Scholar] [CrossRef]
- Yang, J.G.; Wu, H. Explicit Coupled Solution of Two-equation k-ω SST Turbulence Model and Its Application in Turbomachinery Flow Simulation. Acta Aeronaut. ET Astronaut. Sinaica 2014, 35, 116–124. [Google Scholar]
- Ren, Y.; Liu, H.L.; Shu, M.H. Improvement of SST k-ω SST Turbulence Model and Numerical Simulation in Centrifugal Pump. Trans. Chin. Soc. Agric. Mach. 2014, 43, 123–128. [Google Scholar]


| Inlet | Outlet | Left/Right Walls | Top/Bottom Walls | ||
|---|---|---|---|---|---|
| Pressure (MPa) | Temperature (K) | Mass flux (kg/m2·s) | Pressure outlet | Adiabatic | Constant heat flux (W/m2) |
| 10 | 121 | 207.2 | 7.5 × 10⁴ | ||
| Temperature Range (K) | Density |
|---|---|
| 121–223 | ρ = −1.29548 × 10⁻⁶T4 + 7.459 × 10⁻⁴T3 − 0.16537T2 + 15.12763T − 2.45869 |
| 223–271 | ρ = −5.30962× 10⁻⁴T3 + 0.43352T2 − 119.03258T + 11,091.66885 |
| 271–385 | ρ = 1.32923 × 10⁻⁷T4 − 1.93454 × 10⁻⁴T3 + 0.10675T2 − 26.70158T + 2634.06161 |
| Specific Heat | |
| 121–223 | = 0.00436T3 − 1.83425T2 + 263.05475T − 9567.33957 |
| 223–261 | = 0.06448T3 − 46.88971 × 10³T2 + 11,278.86482T − 892,240.75366 |
| 261–385 | = −0.00111T3 + 1.18621T2 − 423.72673T + 53,206.50774 |
| Thermal Conductivity | |
| 12–−235 | λ = 1.07039 × 10⁻⁸T3 − 4.35253 × 10⁻⁶T2 − 6.44568 × 10⁻⁴T + 0.30675 |
| 235–262 | λ = 7.96913 × 10⁻⁶T2 − 0.00432T + 0.62882 |
| 262–385 | λ = −6.69403 × 10⁻⁹T3 + 7.36829 × 10⁻⁶T2 − 0.00258 × 10⁻²T + 0.33402 |
| Viscosity | |
| 121–218 | μ = −7.71822 × 10⁻¹¹T3+ 4.71489 × 10⁻⁸T2 − 1.01809 × 10⁻⁵T + 8.02631 × 10⁻⁴ |
| 218–254 | μ = 6.9276 × 10⁻⁹T2 − 3.52808 × 10⁻⁶T + 4.64105 × 10⁻⁴ |
| 254–385 | μ = −2.07823 × 10⁻¹²T3 + 2.1834 × 10⁻⁹T2 − 7.43585 × 10⁻⁷T + 9.67009 × 10⁻⁵ |
| σω1 | σω2 | κ | α1 | β* | |
|---|---|---|---|---|---|
| SST | 0.5 | 0.865 | 0.41 | 0.31 | 0.09 |
| Case | Scale of Boundary Layer | Rows of Boundary Layer | Cells of Nodes | Heat Transfer Coefficient W/(m2·K) | Relative Error (%) |
|---|---|---|---|---|---|
| 1 | 0.01 | 5 | 2,988,329 | 2678.57 | 3.4% |
| 2 | 0.01 | 8 | 3,589,947 | 2680.44 | 3.47% |
| 3 | 0.003 | 5 | 2,974,634 | 2678.32 | 3.4% |
| 4 | 0.03 | 5 | 2,697,546 | 2669.23 | 3.04% |
| 5 | 0.01 | 5 | 815,644 | 2590.42 | 0 |
| 6 | 1,962,788 | 2636.39 | 1.8% | ||
| 7 | 4,456,851 | 2680.62 | 3.48% |
| Pressure (MPa) | Temperature Difference (K) | Relative Error (%) | Pressure Difference (Pa) | Relative Error (%) | ||
|---|---|---|---|---|---|---|
| Experiment | Simulation | Experiment | Simulation | |||
| 6.5 | 178.9 | 175.1 | 2.1 | 16,612.35 | 15,167.36 | 10.25 |
| 7 | 180.3 | 178 | 1.27 | 15,636.09 | 14,521.4 | 9.95 |
| 7.5 | 182.1 | 180.4 | 0.94 | 14,742.24 | 14,071.62 | 7.05 |
| 8 | 182.6 | 182.3 | 0.16 | 13,847.55 | 13,188.32 | 6.62 |
| 8.5 | 183.5 | 184 | 0.27 | 13,035.22 | 12,504.69 | 6.81 |
| 9 | 185.7 | 185.5 | 0.11 | 12,156.68 | 11,810.66 | 4.70 |
| 9.5 | 186.1 | 185.8 | 0.16 | 11,342.33 | 10,862.6 | 4.42 |
| 10 | 186.6 | 186.4 | 0.11 | 10,578.6 | 10,189.45 | 3.82 |
© 2019 by the authors. Licensee MDPI, Basel, Switzerland. This article is an open access article distributed under the terms and conditions of the Creative Commons Attribution (CC BY) license (http://creativecommons.org/licenses/by/4.0/).
Share and Cite
Zhao, Z.; Zhou, Y.; Ma, X.; Chen, X.; Li, S.; Yang, S. Numerical Study on Thermal Hydraulic Performance of Supercritical LNG in Zigzag-Type Channel PCHEs. Energies 2019, 12, 548. https://doi.org/10.3390/en12030548
Zhao Z, Zhou Y, Ma X, Chen X, Li S, Yang S. Numerical Study on Thermal Hydraulic Performance of Supercritical LNG in Zigzag-Type Channel PCHEs. Energies. 2019; 12(3):548. https://doi.org/10.3390/en12030548
Chicago/Turabian StyleZhao, Zhongchao, Yimeng Zhou, Xiaolong Ma, Xudong Chen, Shilin Li, and Shan Yang. 2019. "Numerical Study on Thermal Hydraulic Performance of Supercritical LNG in Zigzag-Type Channel PCHEs" Energies 12, no. 3: 548. https://doi.org/10.3390/en12030548
APA StyleZhao, Z., Zhou, Y., Ma, X., Chen, X., Li, S., & Yang, S. (2019). Numerical Study on Thermal Hydraulic Performance of Supercritical LNG in Zigzag-Type Channel PCHEs. Energies, 12(3), 548. https://doi.org/10.3390/en12030548


