Article

Experimental and Numerical Investigations on the Fluidized Heat Absorption inside Quartz Glass and Metal Tubes

by
Shengchun Zhang
1,2,3,4 and
Zhifeng Wang
1,2,3,4,*
1
Key Laboratory of Solar Thermal Energy and Photovoltaic System, Chinese Academy of Sciences, No.6 Beiertiao, Zhongguancun, Haidian District, Beijing 100190, China
2
Institute of Electrical Engineering, Chinese Academy of Sciences, No.6 Beiertiao, Zhongguancun, Haidian District, Beijing 100190, China
3
University of Chinese Academy of Sciences, No.6 Beiertiao, Zhongguancun, Haidian District, Beijing 100190, China
4
Beijing Engineering Research Center of Solar Thermal Power, No.6 Beiertiao, Zhongguancun, Haidian District, Beijing 100190, China
*
Author to whom correspondence should be addressed.
Energies 2019, 12(5), 806; https://doi.org/10.3390/en12050806
Submission received: 22 January 2019 / Revised: 22 February 2019 / Accepted: 24 February 2019 / Published: 28 February 2019

Abstract

:
Air as a heat transfer fluid has been widely studied in concentrated solar-power generations, but the solar energy absorbed by air inside transparent and opaque tubes has not been comparatively investigated. The heat transfer was studied experimentally and numerically for a fluidized granular bed air receiver with a non-uniform energy flux and the fluidization occurs inside cylindrical metal and quartz glass tubes. The experiments were conducted in a solar simulator with 19 xenon short-arc lamps and showed that the thermal efficiencies in the quartz tube are higher than those in the metal tube. A numerical model was established to study the fluidized heat transport inside the quartz tube, which includes effective thermal conductivities for the conduction, the Syamlal–O’Brien drag model to describe the pressure drop, a modified P-1 model for the radiation, and a two-fluid model (TFM) for gas–solid two-phase flow. The local thermal non-equilibrium model is used to relate the air temperatures to particle temperatures. Comparisons with experimental data show that this model can be used to predict the heat transport inside the quartz glass tube. The maximum relative error was 7.7% when the current is 100 A and the air mass flow rate is 0.53 g/s.

1. Introduction

The receiver is a key component which drives the working temperature of the thermodynamic cycle, thereby it determines the global efficiency of solar thermal power generation. Particle receivers can work at high temperatures (>700 °C) and keep good mechanical and chemical stability when the particle temperatures are higher than 1000 °C. Several particle receivers have been designed and tested. According to the ways of particle movement, the receivers can be classified into falling, fluidized, and centrifugal.
The falling particle receivers consist of free-falling particle receivers and obstructed-falling particle receivers. Kim et al. [1] investigated particle flow characteristics of the free-falling particle receiver on a small test bench. The distribution of the particles velocity, curtain thickness, and curtain opacity were experimentally determined. The terminal velocity of about 6–7 m/s in a vertical drop distance of 3 m/s was reached in all cases. Siegel et al. [2] studied the thermal characteristics of the free-falling particle receiver and showed a single-pass temperature increase of nearly 250 K in the experiment. Ho et al. [3] constructed and tested a 1.0 MWth high-temperature obstructed-falling particle receiver which realized continuously recirculating heat absorption. The interior of the receiver had many stainless-steel chevron-shaped porous mesh structures to slow down the flow of particles. The maximum particle temperature near the center of the receiver exceeded 700 °C and the tests showed that the particle temperatures and thermal efficiencies increased with the increase of irradiances. Numerical simulation and experimental investigation on the particle flow in interconnected porous media were conducted by Lee et al. [4]. The porous media increased the particle residence time within the receiver, thus a larger temperature rise was reached in a single pass compared with the free-falling particle receiver. A near-blackbody receiver with arrays of hexagonal heat transfer tubes was simulated by Martinek et al. [5] and Morris et al. [6]. The two-fluid model (TFM) and discrete element model (DEM) were applied and an average error on the overall heat transfer coefficient between TFM and DEM was less than 5%. Ketchem [7] established a near-blackbody particle receiver and a numerical model and the results from this simulation were in agreement with the experiments.
The fluidized particle receivers have been proposed for several decades. Bai et al. and Flamant et al. have done much research in recent years. Bai et al. [8,9,10] conducted experimental and numerical studies on an air receiver with silicon carbide particles in the transparent quartz tubes. The fluidization occurred inside the quartz tubes with the particles unable to be blown out of the tubes and air as a heat transfer fluid took the irradiation away by the convective heat transfer between particles and air. Dense gas-particle suspension used as a heat transfer fluid was proposed by Flamant et al. [11]. Marti et al. [12] simulated hydrodynamics and thermal performance of a dense gas-particle receiver. Pablo et al. [13] designed an apparatus to investigate the hydrodynamics and particle motion at ambient temperature and found that the amount of the secondary air injection was the most important parameter for stability and the uniform distribution of the solid’s flow in tubes. Benoit [14] studied a 150 kWth 16-tube experimental solar receiver and constructed a multi-tube receiver model. The receiver thermal efficiency was measured in the range 50%–90%. The incident solar flux was transformed into an equivalent heat generation rate inside the walls, which could consider the radiative heat loss between walls and surroundings.
The centrifugal particle receiver was developed by Wu et al. A centrifugal receiver was designed and constructed. For a face-down receiver inclination and incident irradiance of 700 kW/m2, Wu et al. [15] presented an outlet particle temperature of 900 °C and a receiver efficiency of about 75% (±4%).
Marti et al. [12], Urrutia et al. [16], and Benoit et al. [17] simulated hydrodynamic and thermal characteristics inside a single opaque tube. Marti et al. and Urrutia et al. applied the Dirchlet boundary condition in walls based on the average experimental results (average wall temperatures) and thought that wall-to-suspension heat transfer modes included conductive heat transfer by the solid phase and gas phase and radiative heat transfer between the walls and solid phase. However, Benoit et al. applied the Neumann boundary condition in walls based on the measured energy flux density and neglected radiative heat transfer and the heat flux was transferred to each phase by conduction.
2D and 3D simulations based on the two-fluid model have been used for the qualitative and quantitative analyses, respectively [18]. The differences between 2D simulation and 3D simulation have been discussed in many pieces of literature [19,20,21]. 2D simulation contains 2D Cartesian and axisymmetric assumption models. 2D Cartesian model does not accurately consider the effect of the boundary condition on the flow behavior in the 3D cylindrical fluidized bed. The high solids holdup and low solids velocity near the axis occurs for the 2D axisymmetric assumption model, which behaves as a free-slip wall [22]. Because the fluids and solids do not flow across this axis (free-slip wall), the flow field near the axis is inconsistent with the experimental results. However, 2D simulations for gas–solid flow can provide valuable information for understanding the flow with a smaller computational effort [23]. Li et al. [18] investigated the difference between 2D simulation and 3D simulation in CFB(circulating fluidized bed) risers and concluded that 3D simulation can obtain the quantitative results to investigate the gas–solid flow behaviors. Although 3D simulation can obtain more valuable information than 2D simulation, 3D simulation needs a higher configured computer and more time consumption. Simulating a cylindrical riser as an axis slice around the axis of the bed using the 2D Cartesian coordinate predicted the behaviors in agreement with the experimental data for bubble fluidization. However, the increasing superficial velocity brought a larger difference compared with the experimental data [21]. The cylindrical coordinate and Cartesian coordinate for 3D simulation had a difference on the flow behavior near the center axis. For the cylindrical coordinate, a free-slip, no-normal flow condition where gas and solids do not flow across was imposed on the center axis, thereby losing accuracy near the center axis. Bakshi et al. [24] modified the model for the cylindrical coordinate, and gas and solids can flow across the center axis. Bakshi’s model was applied to simulate the bubbling fluidization in the cylindrical beds and the results presented that the modified model using the 3D cylindrical coordinate was not only computationally more efficient, but also more accurate than using the 3D Cartesian coordinate.
Dirchlet and Neumann boundary conditions are not well suited to simulate the fluidized particle receivers. The Dirchlet boundary condition needs the known wall temperature and cannot be applied to obtain quasi-steady states of particle receivers. When the Neumann boundary condition is applied in the simulation of particle receivers, the radiative heat loss between walls and ambient environment is often neglected. In addition, a comparative study on the fluidized heat absorption inside the quartz tube and the opaque metal tube has not yet been carried out and it is unclear which has a higher thermal efficiency.
Because the difference in fluidized particle heat absorption between a single quartz tube and an opaque metal tube has not been investigated, experiments were conducted to investigate their thermal performances at different air mass flow rates, packed particle masses, and energy fluxes. Furthermore, a numerical model was established and applied to simulate the heat absorption inside a quartz glass tube and the varied heat loss caused by the varied particle temperatures is considered. A modified P-1 radiative model and heat transfer correlations were coupled into the Multiphase Flow with Interphase Exchange (MFIX) [25], which is an open source code for multiphase flows developed by the National Energy Technology Laboratory (NETL, Morgantown, WV, USA). Considering the non-uniform incident flux distribution, the 3D numerical model based on the Cartesian coordinate and two-fluid model (TFM) was used and verified by experiments. The cases with the packed particle mass of 240 g were simulated to understand the thermal performance of the receiver. The content in this paper is novel.

2. Experiments and Results

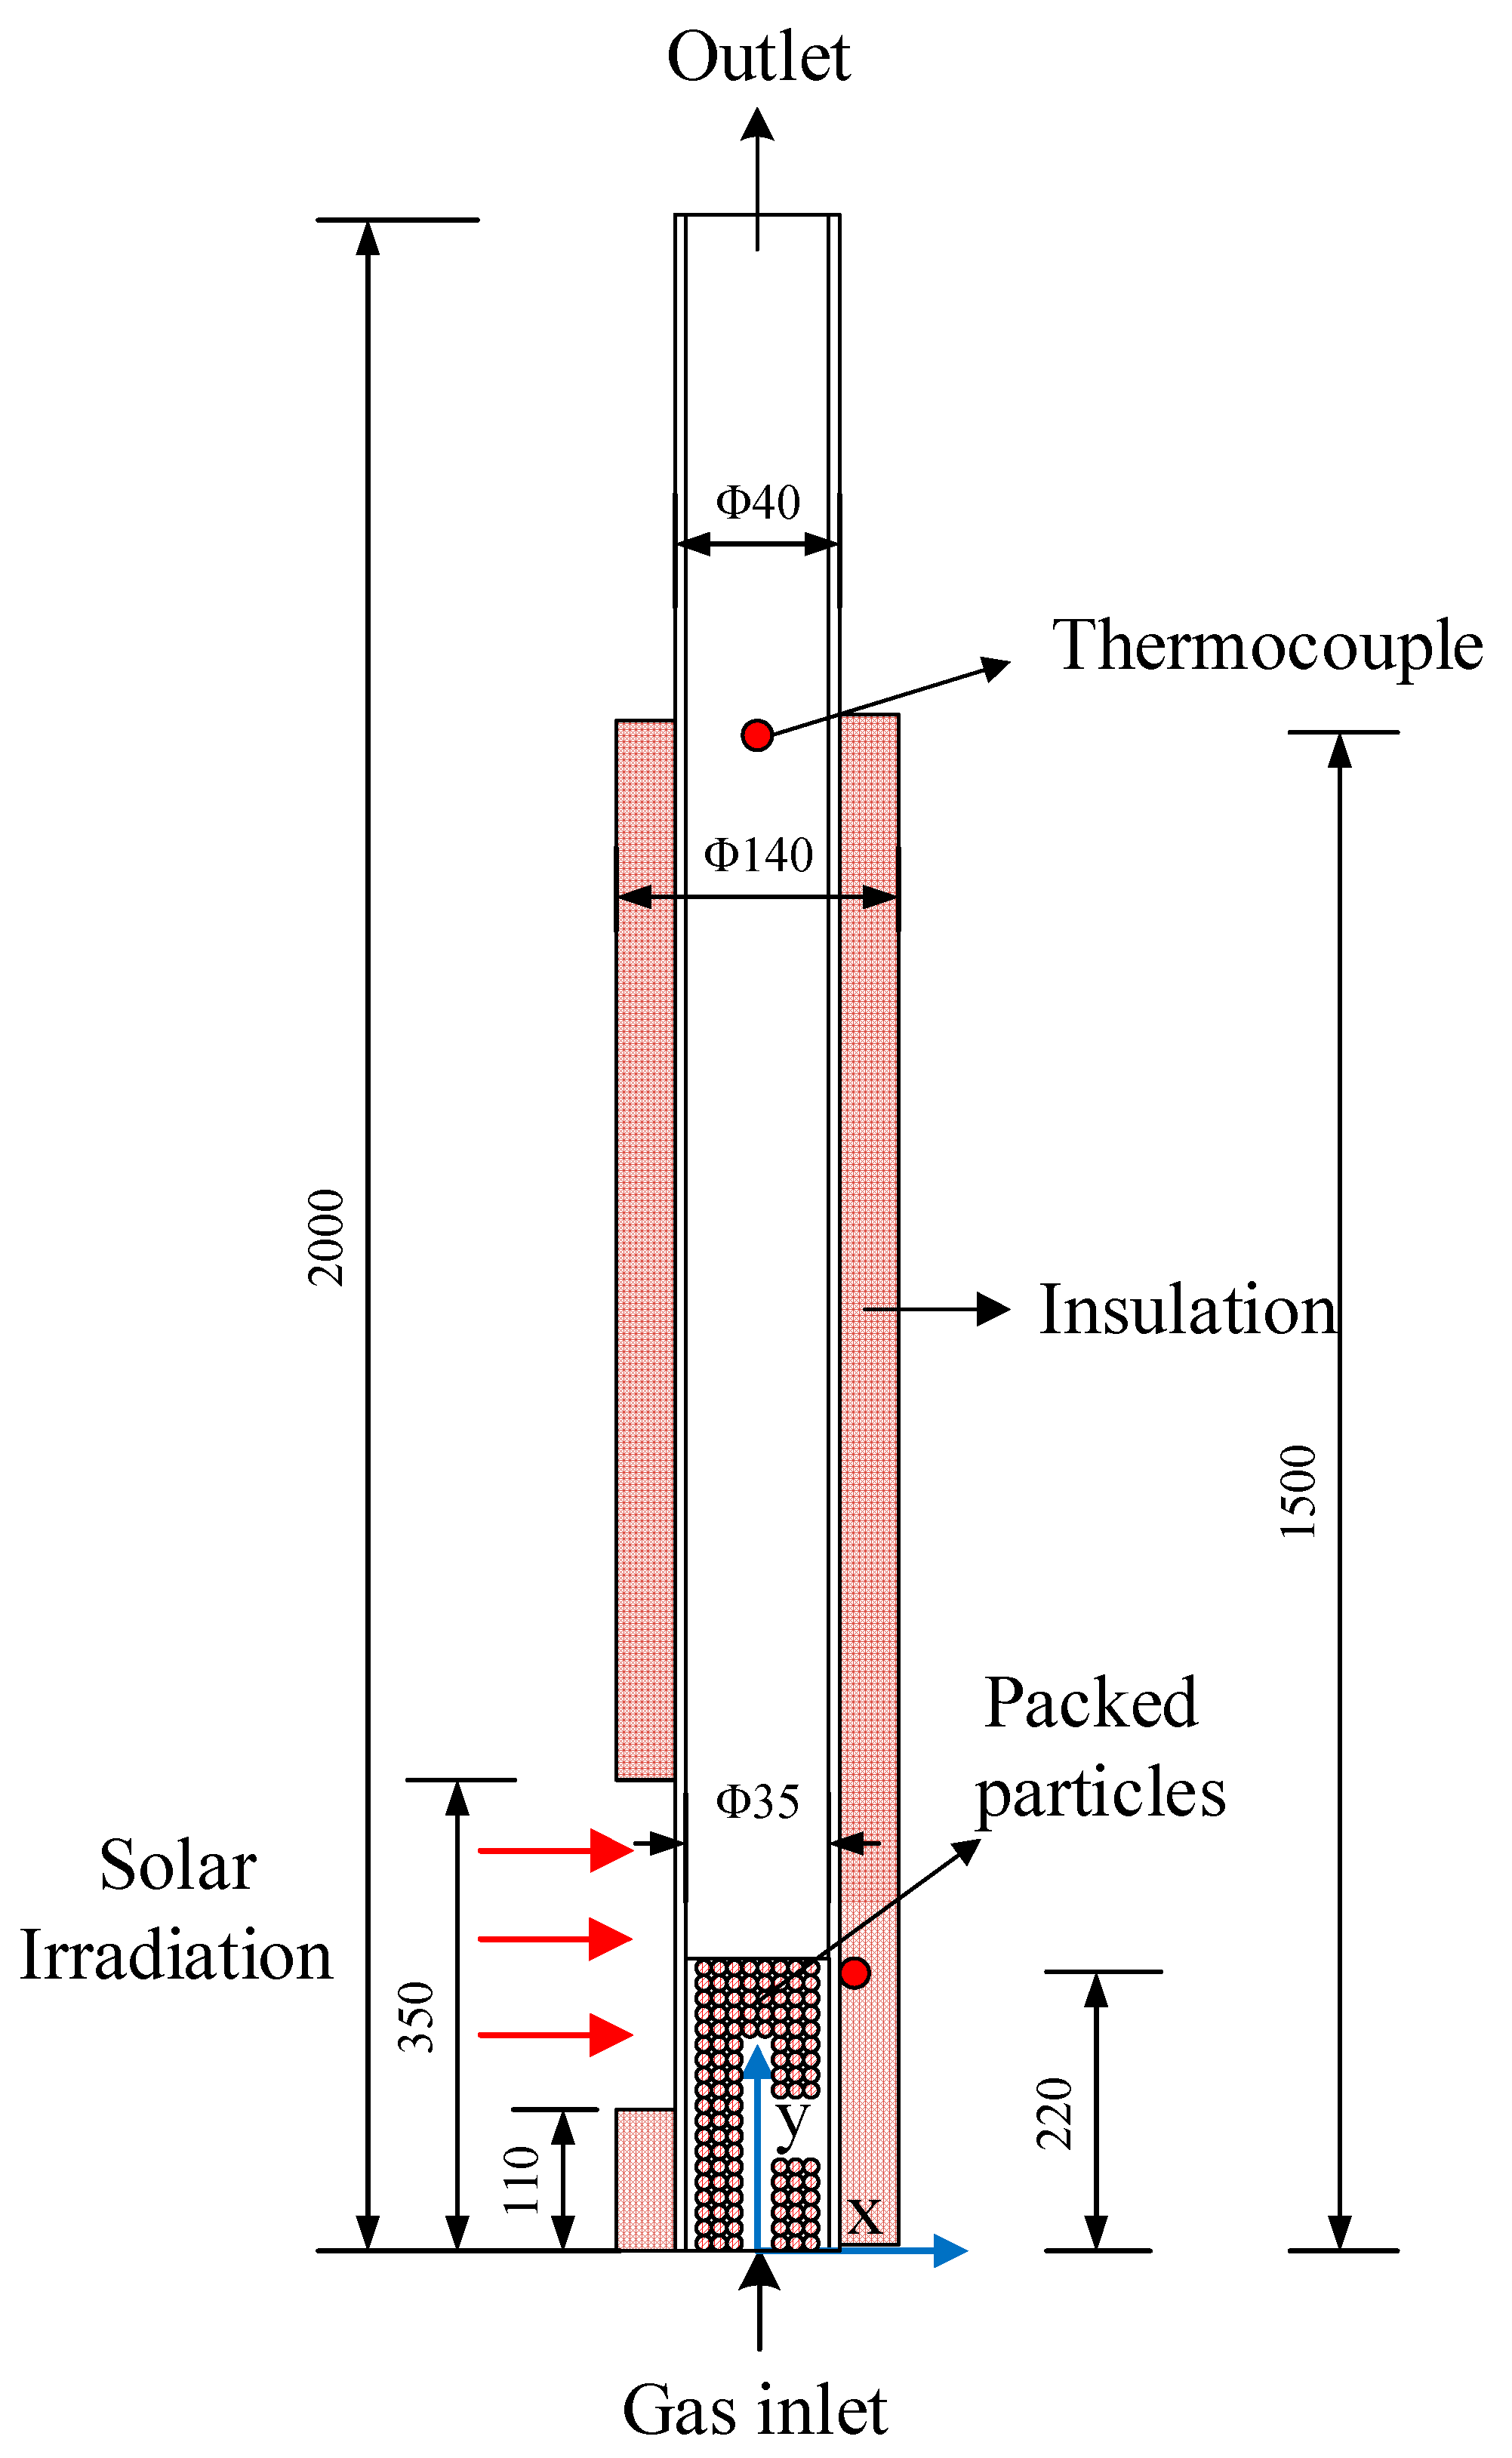
2.1. Experimental Apparatus

These tests were done at Yanqing District of Beijing. The system diagram is shown in Figure 1. This system included an air compressor, an air tank, a buffer tank, an equalizer valve, a mass flowmeter, a data acquisition device (not shown), a solar simulator, and a receiver with an opaque metal tube and a transparent quartz tube. The air was compressed and dried by the compressor and dryer, respectively. The compressed air entered the air tank, then flowed through the buffer tank and the equalizer valve and finally entered the receiver. Because the receiver was directly exposed to the incident flux from the solar simulator, the granular and air temperatures increased. The particles were fluidized inside the tube and were not blown out by controlling the air mass flow rate and the air was heated by the tube wall and particles. The air tank and buffer tank can store massive amount of air and maintain pressure stability, respectively. Hence, the air mass flow rate at the inlet of the receiver was relatively stable. If the mass flow rate changed, the ball valve at the inlet of the receiver or the equalizer valve was adjusted to maintain it.
The solar simulator has 19 xenon short-arc lamps that can work stably between ~50–150 A. When the current of each lamp reaches 150 A, the solar simulator has a maximum power of 28.95 kWth and achieves a peak energy flux of 2.33 MW/m2. All tests in this paper were carried out only when 1–7 lamps were turned on and the current was 50 A or 100 A. When the current of the lamps was 100 A, the peak energy flux was 486.41 kW/m2, as shown in Figure 2. When the current was 50 A, the peak flux was 167.67 kW/m2, as shown in Figure 3. The energy flux distributions of 1–7 lamps on the focal plane under 50 A or 100 A were measured separately and accumulated to obtain the energy flux distributions of Figure 2 or Figure 3.
The calibrated thermocouples were placed at the inlet of the receiver (a thermocouple), at 0.5 m away from the outlet of the tube (two thermocouples), and at the outer wall of the tube inside the receiver (three thermocouples), as shown in Figure 4. The mass flowmeter and the thermocouples were connected to a data acquisition with a sampling rate of 60 times/min. The uncertainties of the devices used in the experiments are listed in Table 1.

2.2. Uncertainty Analysis

The precision of the measuring equipment determined the data uncertainty. Based on Table 1 and the illustration of Moffat [26], the relative uncertainties of the thermal energy absorbed by air and the thermal efficiency were determined by Equations (2) and (4), respectively. The different incident fluxes caused the difference of the outlet air temperature Tg,out. In these experiments, Δ m · / m · ≤ 1%, Δ T / ( T o u t T i n ) ≤ 0.2%, and Δ q s o l a r / q s o l a r ≤ 1%. The relative uncertainties of the thermal energy absorbed by air and the thermal efficiency are 1.02% and 1.43%, respectively.
q a i r = m · c p g ( T g , o u t T g , i n )
Δ q a i r q a i r = ( Δ m · m · ) 2 + 2 ( Δ T g T g , o u t T g , i n ) 2
η 1 = q a i r i = 1 N U M q s o l a r A i
Δ η 1 η 1 = ( Δ q a i r q a i r ) 2 + ( Δ q s o l a r q s o l a r ) 2

2.3. Results and Discussions

The material of the metal tube was Q235B that can be easily oxidized at high temperatures. Thus, the experiments inside the opaque metal tube were conducted when the current was 50 A. However, the quartz tube can be used for a long time at temperatures not exceeding 1200 °C. The fluidized heat absorption inside the quartz tube was conducted when the current was 50 A or 100 A. All cases are listed in Table 2. The thermal efficiency is defined as Equation (5). The packed particle masses of 240 g and 160 g were tested and the opening height of the receiver was 0.11 m to 0.35 m. The silicon carbide particles with an average size of 500 μm were used and its minimum fluidization velocity was 0.235 m/s, as calculated by Wen and Yu model [27] when the air temperature is 20 °C. Thus the minimum fluidization air mass flow rate was 0.27 g/s. The air mass flow rates in all experiments were higher than 0.5 g/s.
η 1 = m · ( c p g , o u t T g , o u t c p g , i n T g , i n ) / i = 1 i = N U M q s o l a r d A i
The outlet and middle temperatures represent the air temperature at 1.50 m and the tube wall temperature at 0.22 m, respectively. In the experiments, if the tube was transparent, the thermocouples in the opening could be directly exposed to the incident flux, therefore, the wall temperature of the quartz tube increased quickly. The measured tube wall temperature of the quartz tube was not the actual temperature. However, the measured wall temperature of the metal tube was the actual temperature.
As shown in Table 2, all cases had lower thermal efficiencies compared with the experimental data from Wang [10]. The bed height increased with the increase of the packed particle mass when the inlet air mass flow rate was constant. A longer tube was used to ensure that particles were not blown out of the tube. The long tube had the higher thermal loss due to the increase of the tube surface area. In addition, the smaller the packed particle mass was, the larger the void porosity was. Therefore, part of the incident solar flux passed through gas-particle suspensions, and it was lost. In Case 11, 12, about 14% of the total particle mass was blown out when the length of the tube was 2.0 m.
The comparisons between Case 1 and Case 2 and between Case 3 and Case 4 in Figure 5 show that an increase in the air mass flow rate led to a lower outlet air temperature. The outlet air temperature of Case 2 was 5 °C lower than that of Case 1 and that of Case 4 was 3 °C lower than that of Case 3. Increasing air mass flow rate increased the bed height and renewal frequency of particles near the wall, thus the heat transfer between gas-particles suspensions and the walls was enhanced [28]. Therefore, the wall temperatures of Case 2 and Case 4 in the opening were lower than those of Case 1 and Case 3, respectively. The larger the air mass flow rate, the shorter the resident time inside the tube. As the mass flow rate increased, the heat loss of unit mass fluid decreased and the thermal efficiency increased. The comparisons between Case 1 and Case 3 and between Case 2 and Case 4 show that the increasing packed mass led to a higher outlet air temperature. The outlet air temperature of Case 3 was 7 °C higher than that of Case 1 and that of Case 4 was 9 °C higher than that of Case 2. The larger the mass of the packed particles, the higher the volume fraction of particles in the opening. Increasing volume fraction of particles enhanced the heat transfer between the suspensions and the tube wall and the wall temperature field in the opening tended to be lower. Increasing the mass of packed particles improved thermal efficiencies (Case 1, 31.7% and Case 3, 33.1%; Case 2, 36.3% and Case 4, 37.4%).
Experimental results of the fluidized heat absorption inside the quartz tube are shown in Figure 6 and Table 2. The comparisons between Case 5 and Case 6, between Case 7 and Case 8, between Case 9 and Case 10, and between Case 11 and Case 12 show that increasing the air mass flow rate improved the thermal efficiencies. The outlet air temperature increased with the air mass flow rate increasing in the lower incident solar flux (Case 5, 269 °C and Case 6, 273 °C; Case 9, 509 °C and Case 10, 564 °C). The air velocity and viscosity increased with the temperature increasing and increasing air temperature increased the bed height under the same air inlet mass flow rate [29]. Although the temperatures measured by the middle thermocouple were not the actual wall temperatures, the measured temperatures represent the changes of the transmittance. In the same incident flux, the higher the transmittance, the higher the measured temperature in the opening. The comparisons between Case 5 and Case 6 and between Case 7 and Case 8 show that the transmittance in the opening changed slightly when the air inlet mass flow rate increased from 0.67 g/s to 0.79 g/s. However, the comparison between Case 6 and Case 8 found that the heavier packed particle mass led to the lower transmittance in the opening and the lower temperatures were measured by the middle thermocouple. Under the high incident solar flux, because the rising air mass flow rate increased the particle concentration in the opening, the temperature measured by the middle thermocouple decreased from 987.3 °C in Case 11 to 905.9 °C in Case 12 when the air mass flow rate increased from 0.53 g/s to 0.59 g/s. Furthermore, the smaller particles (about 14% of the total mass) were blown out of the tube in Case 11 and 12. Eventually, the outlet air temperature increased by 83 °C (Case 11, 530 °C and Case 12, 613 °C). The rising air mass flow rate under the packed particle mass of 240 g and the current of 100 A brought a more obvious outlet air temperature rise than that under the packed particle mass of 160 g (160 g, 55 °C; 240 g, 83 °C). In addition, the outlet air temperature increased from 564 °C (Case 10) to 613 °C (Case 11) under 0.59 g/s when the packed mass increased from 160 g to 240 g.
The comparisons between Case 1–4 and Case 5–8 in Table 2 indicate that the fluidized heat absorption inside the quartz tube was better than that inside the metal tube. The outlet air temperature in Case 8 was 37 °C higher than that in Case 4. Although part of the incident solar flux passed through the quartz tube and gas-particles suspensions to the insulation, the gas-particle suspensions were directly exposed to the solar flux and had a faster temperature rise. For the metal tube, the heat was transferred to the back wall of the tube by radiation, convection, and conduction, so the heat resistance was higher. In addition, the incident flux was concentrated onto the metal tube wall, which led to the higher heat loss. Hence, the temperature fields inside the quartz tube in the opening were higher than inside the metal tube. The outlet air temperature increased with the increase of the air mass flow rate inside the quartz glass tube (Case 7, 297 °C and Case 8, 304 °C), however, that decreased with the increase of the air mass flow rate inside the metal tube (Case 3, 270 °C and Case 4, 267 °C). It should be noted that the quartz tube is easily damaged.

3. Model Description

3.1. Physical Model and Assumptions

A simplified geometric computation domain is shown in Figure 4. To reduce the computational consumption, the computation domain with the tube length 1.5 m and the tube internal diameter 35 mm was simulated. A large number of particles were packed in the tube before the experiment. The inlet air velocity is considered to be uniform and the solar flux is assumed to be the collimated irradiation. Three-dimensional simulations were performed for quantitative analysis in the Cartesian coordinate. MFIX uses quadrilateral cells in the computation area, but the tube cannot be treated as a regular cuboid. To simulate the fluidized heat absorption, a cut-cell method was used to represent the tube wall. The simulation was based on the following assumptions: (1) The quartz glass tube is completely transparent to thermal radiation. (2) The air is a completely transparent and incompressible medium in which the diffusion and absorption are neglected. (3) The radiative properties of particles are assumed to be isotropic and the particles are assumed to be grey bodies. As shown in Figure 7, the mesh sizes of 7.0 mm (20dp) and 2.5 mm (~5dp) were used in Section 4 and Section 5, respectively. There were 28552 and 25800 meshes in Section 4 and Section 5, respectively.

3.2. Governing Equations

These simulations were performed using the Multiphase Flow with Interphase eXchanges (MFIX) code, which is an open source code developed by National Energy Technology Laboratory (NETL). The MFIX was applied in the simulation of particle receivers [6]. However, the radiative heat transfer was considered using a simple radiative heat transfer coefficient in MFIX. The study adds a differential approximation radiation model (P-1 Model) to MFIX. The governing equations, including continuity, momentum conservation equations, energy equations of gas phase and solid phase, and constitutive equations, are summarized in Table 3 [30]. The interphase momentum exchange coefficient proposed by Syamlal et al. [31] was applied.

3.3. Radiative Transfer

A differential approximation (P-1 model) [32] was applied to solve radiative heat transfer. When the fluidized heat absorption occurred inside a quartz glass tube, the collimated irradiation passed through the transparent quartz glass tube and into the gas-particle suspensions. Most of the collimated irradiation was absorbed by gas-particle suspensions and the fraction of the irradiation transmitted the gas-particle suspensions into the white insulating material. The incident flux going into the insulation was diffusely reflected and partially absorbed. The irradiation that was not absorbed transmitted the quartz glass tube into the ambient environment and was lost. The radiative heat transfer equation of heat absorption inside the quartz glass tube is provided in Equation (33). The radiation was solved as the source term Srad of the solid energy equation.
· ( 1 3 β G ) = ( 1 ω ) β ( G 4 σ T s 4 ) ω β ( ε s ( 1 ζ ) ) q s o l a r e i = 1 N 1 β d x ,
where ζ is the gas-particle suspensions transmittance, determined by Equation (34).
ζ = e i = 1 N β d x
S r a d = · ( 1 3 β G ) + β ( ε s ( 1 ζ ) ) q s o l a r e i = 1 n β d x

3.4. Heat Transfer Correlations

The interphase heat transfer coefficient was provided by Gunn et al. [33]. The correlation was applied in the range of 0.35–1.0 of porosity and 0–105 of Reynolds number.
γ g s = 6 k g ( 1 ξ g ) N u g s d p 2
N u g s = ( 7 10 ξ g + 5 ξ g 2 ) ( 1 + 0.7 Re p 0.2 Pr 1 / 3 ) + ( 1.33 2.4 ξ g + 1.2 ξ g 2 ) Re p 0.7 Pr 1 / 3
The overall heat loss coefficient from the internal surface to the ambient environment is given in Equations (38) and (40). Equation (38) was applied in the tube that was directly exposed to the surroundings and Equation (40) was applied in the tube that was insulated. Equation (39) [34] and Equation (41) [35] were applied to calculate the convective heat transfer coefficients of the internal wall inside the cavity and the outer wall of the insulation, respectively.
h w 1 = 1 / ( D 1 2 k T ln ( D 2 / D 1 ) + D 1 h 1 D 2 )
h 1 = 0.0287 Re g 0.8 Pr 1 / 3 k g l
h w 2 = 1 / ( D 1 2 k T ln ( D 2 / D 1 ) + D 1 2 k I ln ( D 3 / D 2 ) + D 1 h 2 D 3 )
h 2 = 0.193 Re g 0.618 Pr 1 / 3 k g d 3
The effective thermal conductivity for the solid phase and gas phase was provided by Zehner and Schlunder [36]. This correlation was derived for packed beds, however, it is often used for more dilute systems. The estimated fractional contact area 7.26 ×10 −3 was recommended to simulate heat transfer in the fluidized bed.
k g , e f f = ( 1 1 ξ g ξ g ) k g ,
where k g , e f f is the effective thermal conductivity of the gas phase.
k s , e f f = k g 1 ξ g [ 0.00726 A + 0.99274 Γ ] ,
Γ = 2 1 B / A [ A 1 ( 1 B / A ) 2 B A ln ( A B ) B 1 1 B / A B + 1 2 ] ,
A = k s / k f ,
B = 1.25 ( ( 1 ξ g ) / ξ g ) 10 / 9 ,
where k s , e f f is the effective thermal conductivity of the solid phase.
The extinction coefficient of gas-particle suspensions was verified by Marti et al. [37] for opaque particles:
β = 3 ( 1 ξ g ) 2 d p Q e x t ( 1 + 1.84 ( 1 ξ g ) 3.15 ( 1 ξ g ) 2 + 7.2 ( 1 ξ g ) 3 ) ε g > 0.3 ,
where the extinction factor, Q e x t , is 2.0 for large opaque particles.

3.5. Initial Conditions and Boundary Conditions

The initial temperatures of the receiver, gas phase, and solid phase are constant and equal to ambient temperature.
T g | τ = 0 = T s | τ = 0 = T a
The boundary conditions for the fluidized heat absorption inside the quartz glass tube are different from that inside the opaque metal tube, especially in the zone that is not covered with insulation. The absorption modes of the incident solar flux are different. The incident rays can penetrate the quartz glass tube and be absorbed inside the receiver. However, the incident rays cannot penetrate the opaque metal tube and be absorbed on the surface of tube. The heat transfer modes between walls and gas-particle suspensions contain gas conduction, solid conduction, and radiation. The heat losses in the tube were allocated to gas phase and solid phase according to thermal conductivities [38]. The boundary conditions on the walls are shown as Equations (54)–(62). The internal surface temperature of the tube was assumed to be the average volume temperature of air and particle temperatures in near-wall grids, ξ g T g + ( 1 ξ g ) T s .
At the inlet:
Gas   phase :   ξ g k g , e f f n T g = 0 .
Solid   phase :   ( 1 ξ g ) k s , e f f n T s = 0 .
At the outlet:
Gas   phase :   ξ g k g , e f f n T g = 0 .
Solid   phase :   ( 1 ξ g ) k s , e f f n T s = 0 .
At   the   inlet   and   outlet :   1 3 β n G = 1 2 ( 4 σ T a 4 G ) .
On the insulated wall:
Gas   phase :   ξ g k g , e f f n T g = ( h w 2 ( ξ g T g + ( 1 ξ g ) T s T a ) + 1 3 β n G ) ξ g k g , e f f ξ g k g , e f f + ( 1 ξ g ) k s , e f f .
Solid   phase :   ( 1 ξ g ) k s , e f f n T s = ( h w 2 ( ξ g T g + ( 1 ξ g ) T s T a ) + 1 3 β n G ) ( 1 ξ g ) k s , e f f ξ g k g , e f f + ( 1 ξ g ) k s , e f f ,
1 3 β n G = ε w 2 ( 2 ε w ) ( 4 σ ( ξ g T g + ( 1 ξ g ) T s ) 4 G ) .
On the front walls exposed to the environment for the quartz glass tube:
Gas   phase :   ξ g k g , e f f n T g = ( h w 1 ( ξ g T g + ( 1 ξ g ) T s T a ) ) ξ g k g , e f f ξ g k g , e f f + ( 1 ξ g ) k s , e f f .
Solid   phase :   ( 1 ξ g ) k s , e f f n T s = ( h w 1 ( ξ g T g + ( 1 ξ g ) T s T a ) ) ( 1 ξ g ) k s , e f f ξ g k g , e f f + ( 1 ξ g ) k s , e f f .
Because the quartz tube has no reflection ( ξ w = 1 ), the radiative flux is given in Equation (59).
1 3 β n G = 1 2 ( 4 σ T a 4 G )
On the back walls exposed to the environment for the quartz glass tube:
Gas   phase :   ξ g k g , e f f n T g = ( 1 3 β n G q s o l a r ζ ) ξ g k g , e f f ξ g k g , e f f + ( 1 ξ g ) k s , e f f .
Solid   phase :   ( 1 ξ g ) k s , e f f n T s = ( 1 3 β n G q s o l a r ζ ) ( 1 ξ g ) k s , e f f ξ g k g , e f f + ( 1 ξ g ) k s , e f f ,
1 3 β n G = 1 2 ( 2 ε w ) ( ε w ( 4 σ ( ξ g T g + ( 1 ξ g ) T s ) 4 G ) + 4 ( 1 ε w ) q s o l a r ζ ) .

4. Model Validation on the Cold State

Because the particles with a density of 3210 kg/m3 and a size of 500 μm in the paper were used and classified as the Geldart Group B particles [39], the Geldart Group B particles (glass ballotini), with a density of 2500 kg/m3 and a size of 350 μm, were used to validate the model. The experiments were conducted by Makkawi et al. [40]. The cold fluidization was conducted in a cylindrical riser with an internal diameter of 13.8 cm and a height of 100 cm. The glass ballotini were packed with a height of 20 cm and a void porosity of 0.4 in the riser. The cases using 0.8 and 0.54 m/s, corresponding to the slugging and the bubbling flow regimes, were simulated by MFIX. Because of the high sphericity and smooth appearance of the glass ballotini, the no-slip and free-slip boundary conditions were used for the gas phase and solid phase, respectively.
The average cross-sectional void porosities along the axial height for 0.54 m/s and 0.8 m/s are given in Figure 8. The average cross-sectional void porosities at the axial height 0.143–0.181 m were measured by Electrical Capacitance Tomography. The numerical average cross-sectional void porosity for 0.54 m/s is 0.02 higher than the experimental result and the relative error is 4.03%. However, that for 0.8 m/s is 0.01 lower than the experimental result and the relative error is 1.91%. Figure 9 shows that the simulated time-average void porosities along the radial direction at the axial height 0.143–0.181 m for 0.54 m/s and 0.8 m/s agree with the experimental results. Therefore, the numerical model can be used to simulate the fluidization inside the tube.

5. Model Validation on the Thermal State

Because the lighter packed particle mass led to the higher void porosity in the opening when the inlet air mass flow rates were the same, it led to the slower rate of the outlet air temperature rise. Thus, the cases with the packed mass of 240 g are simulated. Although the average particle size was 500 μm, the larger and smaller particles are included. The particles larger than 500 μm and smaller than 500 μm accounted for 42.5% and 39.7% of the total particle mass, respectively. Under the higher incident flux (Case 9–12), the higher bed expansion occurred and the smaller particles (about 14% of the total mass) were blown out so that the average particle size was as high as 540 μm. Under the lower incident flux, the smaller particles were not blown out. The free-slip boundary condition for the solid phase led to a higher solid fraction, with a higher downward particle velocity close to the wall [41]. Gas and particle mixing was enhanced so that the temperature fields deviated from the reality. In addition, the inhomogeneous particle sizes led to the particle segregation under the fluidization, so that the particle mixing tends to get worse. Although the partial-slip wall boundary condition for the solid phase proposed by Johnson and Jackson [42] was widely used, the larger specularity coefficient of 0.5 was widely used, which is similar to the no-slip boundary condition [43]. Therefore, the no-slip boundary condition was used for the gas phase and the solid phase in this section. The application of multi-dispersed particle size distribution in the simulation significantly increases the computational consumption, so the uniform particle size distribution was used. However, the uniform particle size led to better particle mixing.
Figure 10 shows the comparison of the time-average outlet air temperatures obtained by experiment and simulation. Under a current of 50 A and an air mass flow rate of 0.69 g/s, the error is 10 °C with a relative error of 1.75%. However, under a current of 100 A and a mass flow rate of 0.53 g/s, the error is 62 °C with a relative error of 7.7%. The interphase drag models were developed at standard temperature and pressure and have not yet been verified at high temperatures. The Syamlal–O’Brien drag model may be overestimating the bed height so that the thermal energy obtained by particles is increased. Thus, the larger errors occur at high temperatures. Because the errors between experiments and simulations are less than 10%, this numerical model can be used to simulate the fluidized heat absorption inside the quartz glass tube.
The time-average quasi-steady air temperature distributions in the opening (0.11–0.35 m) are shown in Figure 11. Partial incident flux was not absorbed by particles and incident to the left side, thus the higher air temperature appears on the left side. Under the same incident flux, the higher the air mass flow rate, the higher the air temperature in the opening. Increasing the air mass flow rate increased the solid mass exposed to the incident flux. The interphase convective heat transfer between particles and air could not take away the thermal energy absorbed by the particles in time, so the air temperature with a higher air mass flow rate was higher in the opening. The higher air mass flow rate led to a higher air temperature at the axial height 0.35 m, due to the same convective heat loss coefficient and the volume averaging thermal inertia depending on the volume ratio of the solid phase to air. The uniform particle size and the assumption that the particles are spherical led to a more uniform air temperature distribution that could effectively avoid overheating on the right wall and reduce heat loss. If the heat loss of the outer pipeline is neglected, the thermal efficiency will increase (e.g., 44.1% with a current of 100 A and an air mass flow rate of 0.59 g/s from the simulation). Because the current bed height cannot completely cover the opening exposed to the incident flux, increasing the particle mass would increase the thermal efficiency. Wang et al. presented a thermal efficiency close to 68.4% when the outlet air temperature reached up to 700 °C [10].

6. Conclusions

The experiments were conducted to investigate the fluidized heat transport inside the quartz glass and metal tubes. The solar simulator with 19 xenon short-arc lamps that can work stably between 50–150 A was used. A model was developed to simulate the fluidized heat transport inside the quartz glass tube. The model used a modified P-1 model for the radiative heat transfer and the local thermal non-equilibrium model to investigate the temperature distributions with the pressure drop, modeled using the Syamlal–O’Brien drag model. The two-fluid model was used to simulate the gas-solid two-phase flow. The predictions are in agreement with the experimental data. The numerical average cross-sectional void porosity for 0.54 m/s was 0.02 higher than the experimental result with a relative error of 4.03% in the cold state. The maximum error of the outlet air temperature is 7.7% when the current was 100 A and the air mass flow rate was 0.53 g/s. This model can be used to investigate the fluidized heat transport inside the quartz glass tube. The experimental results are shown:
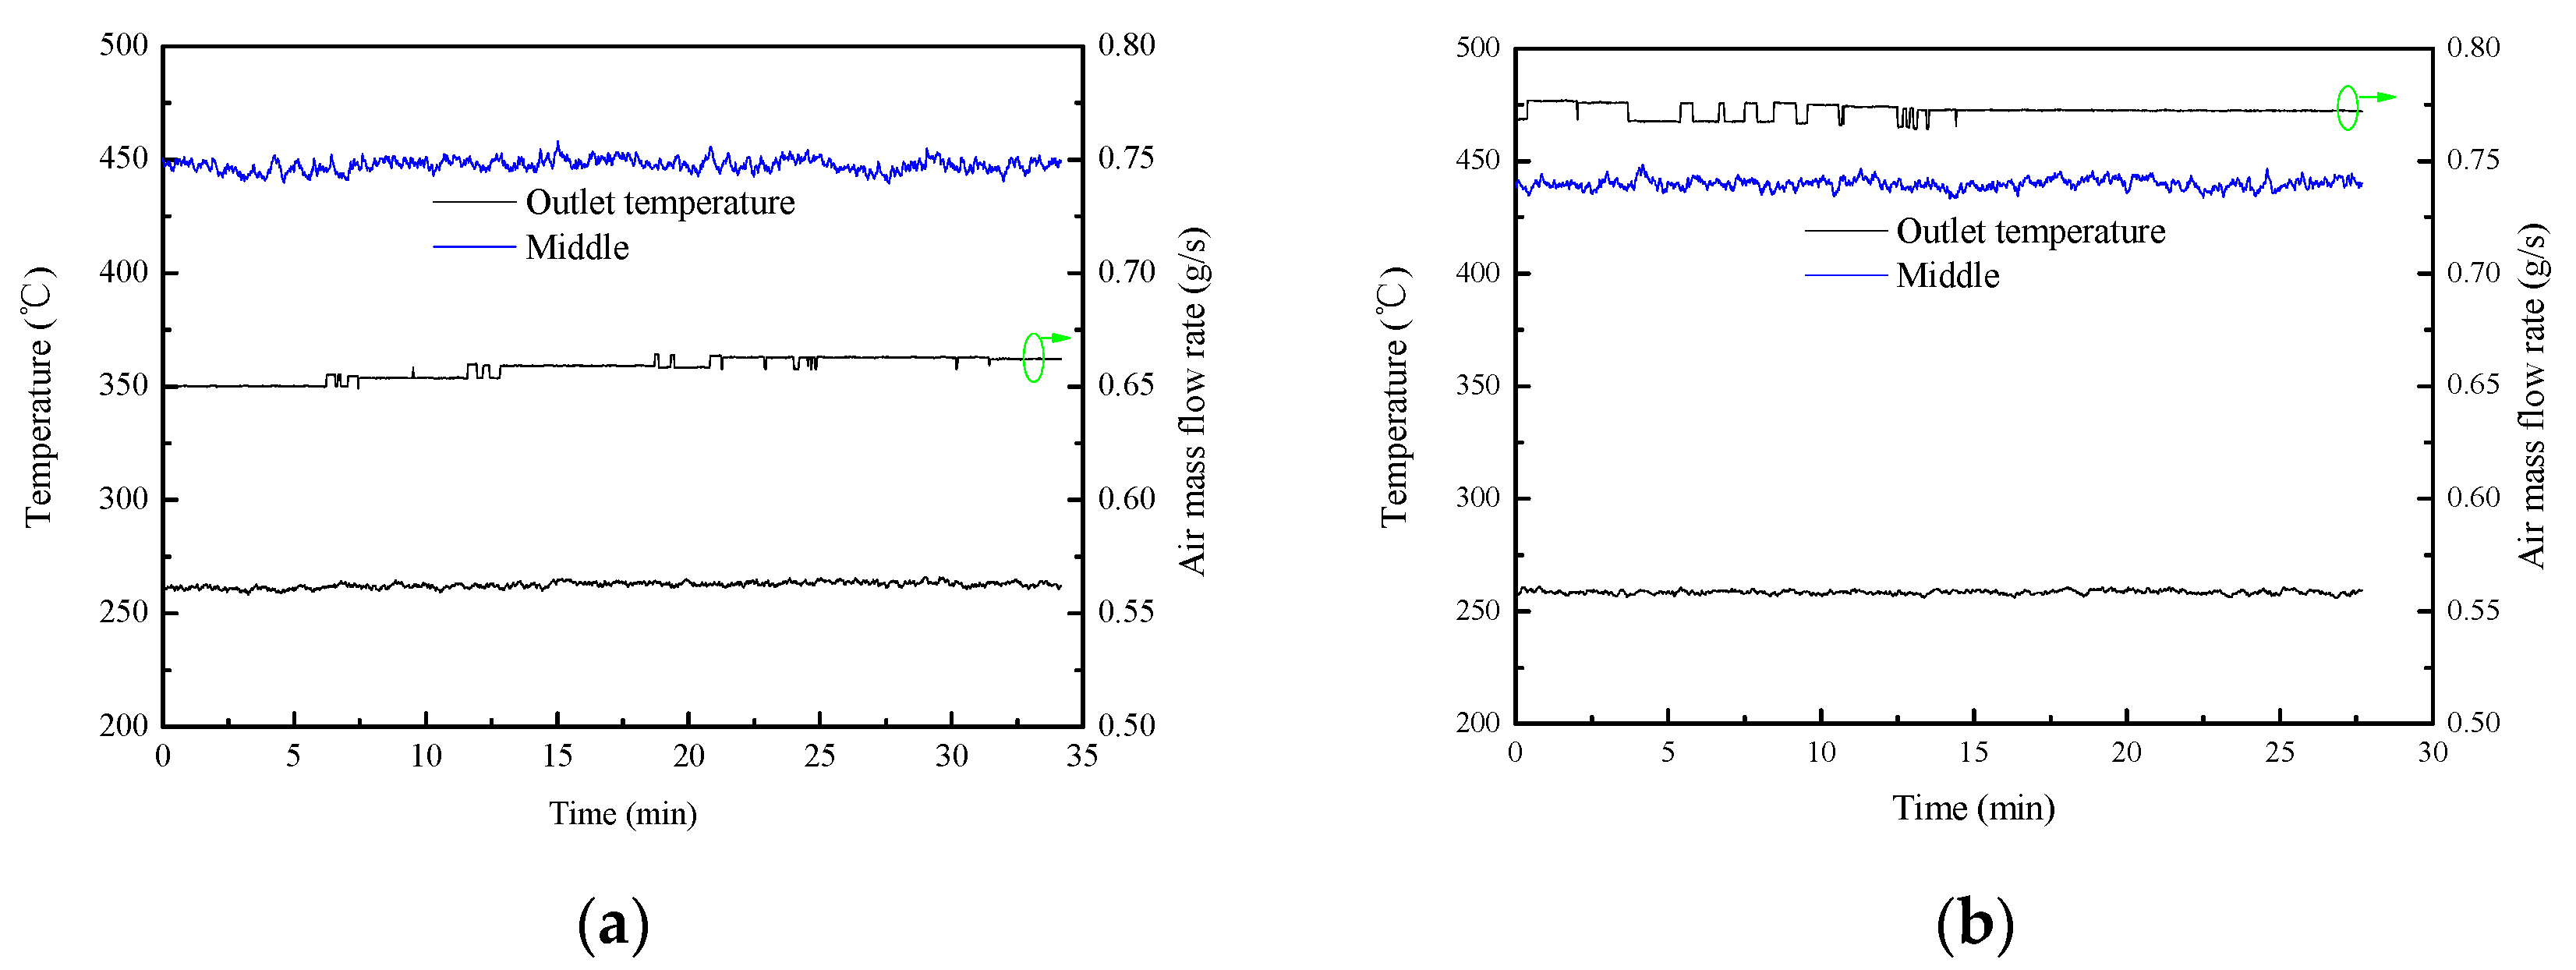
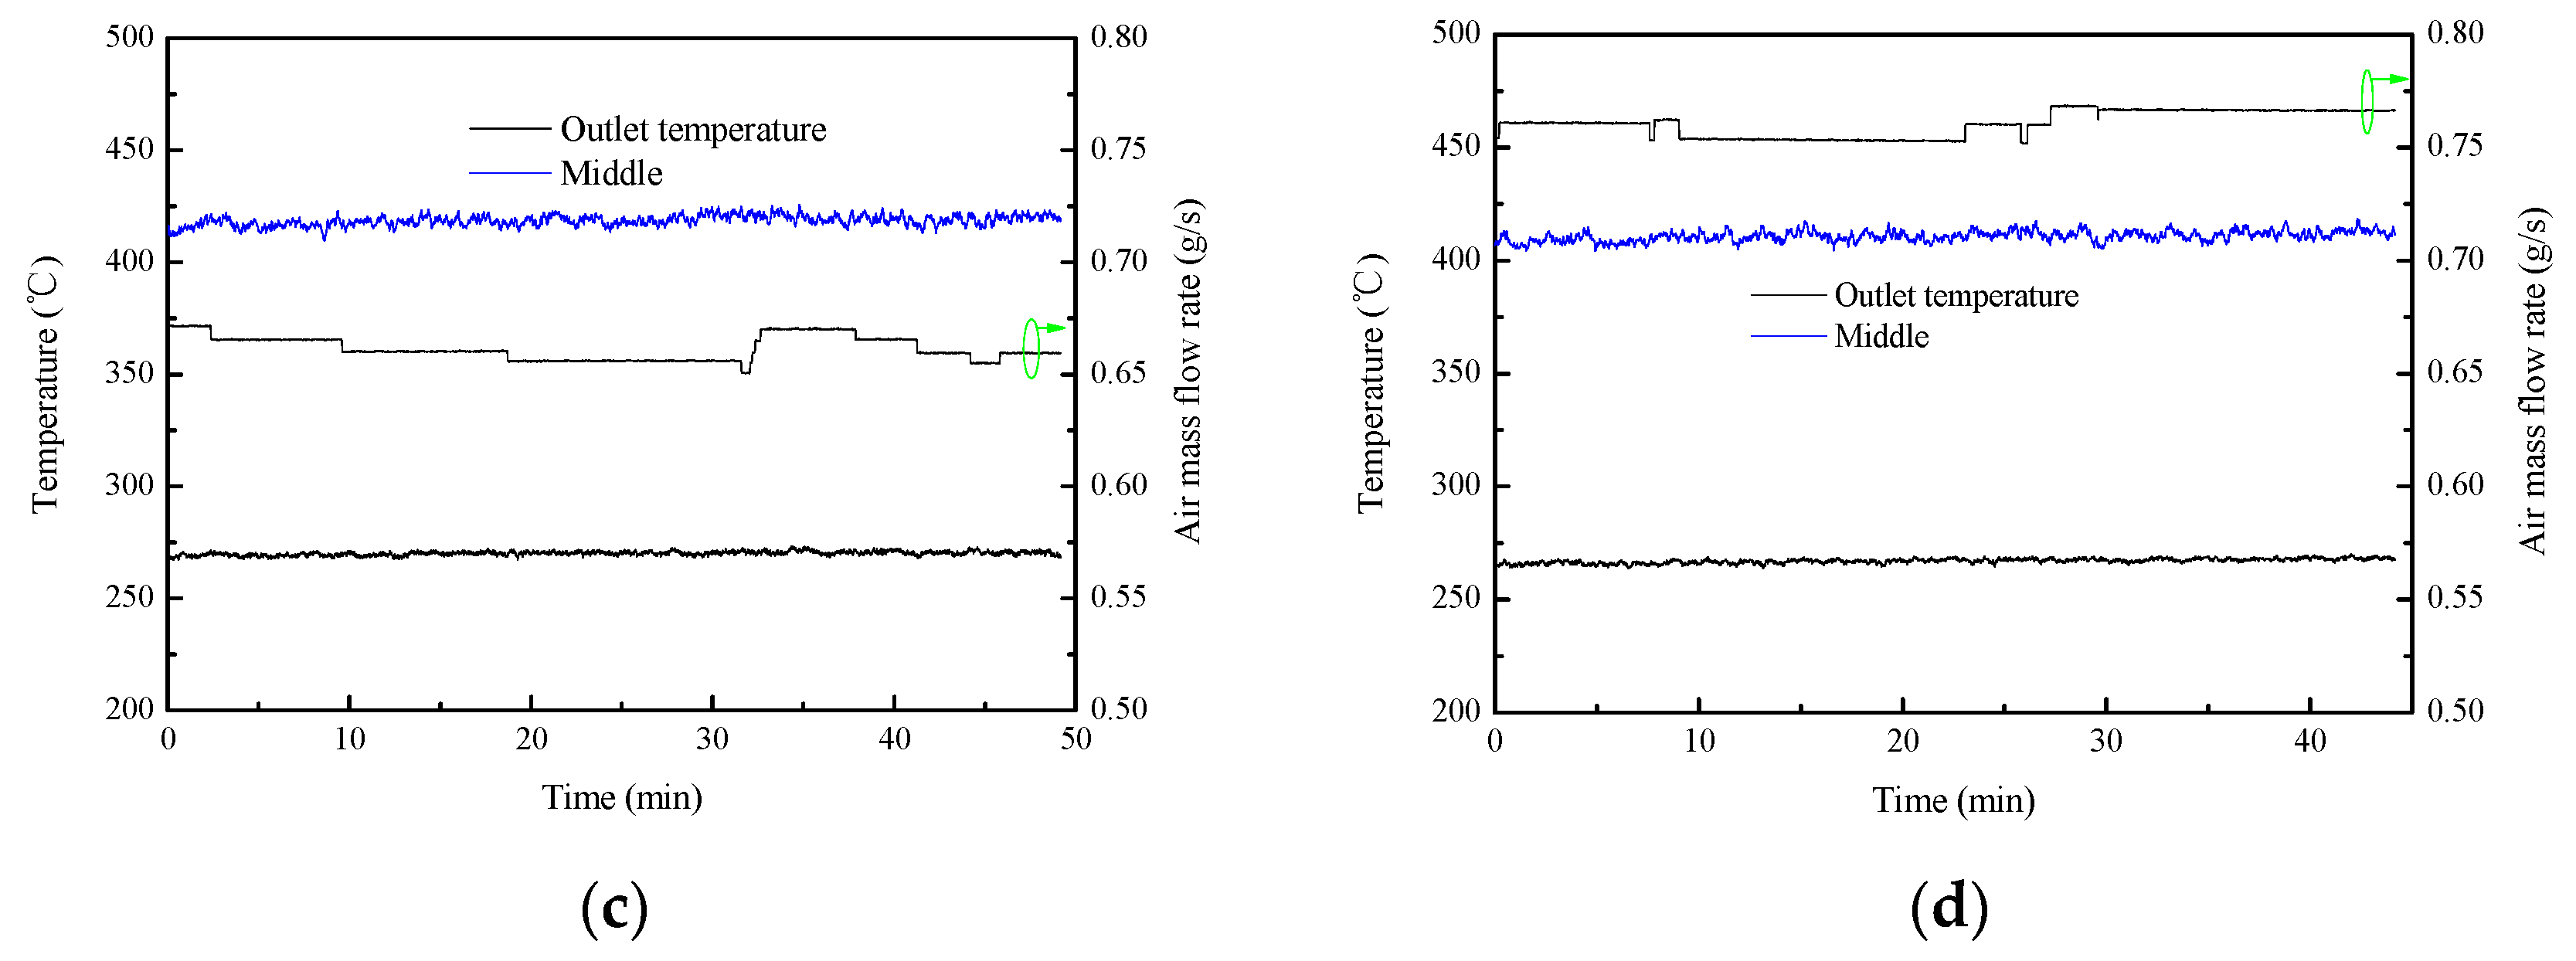
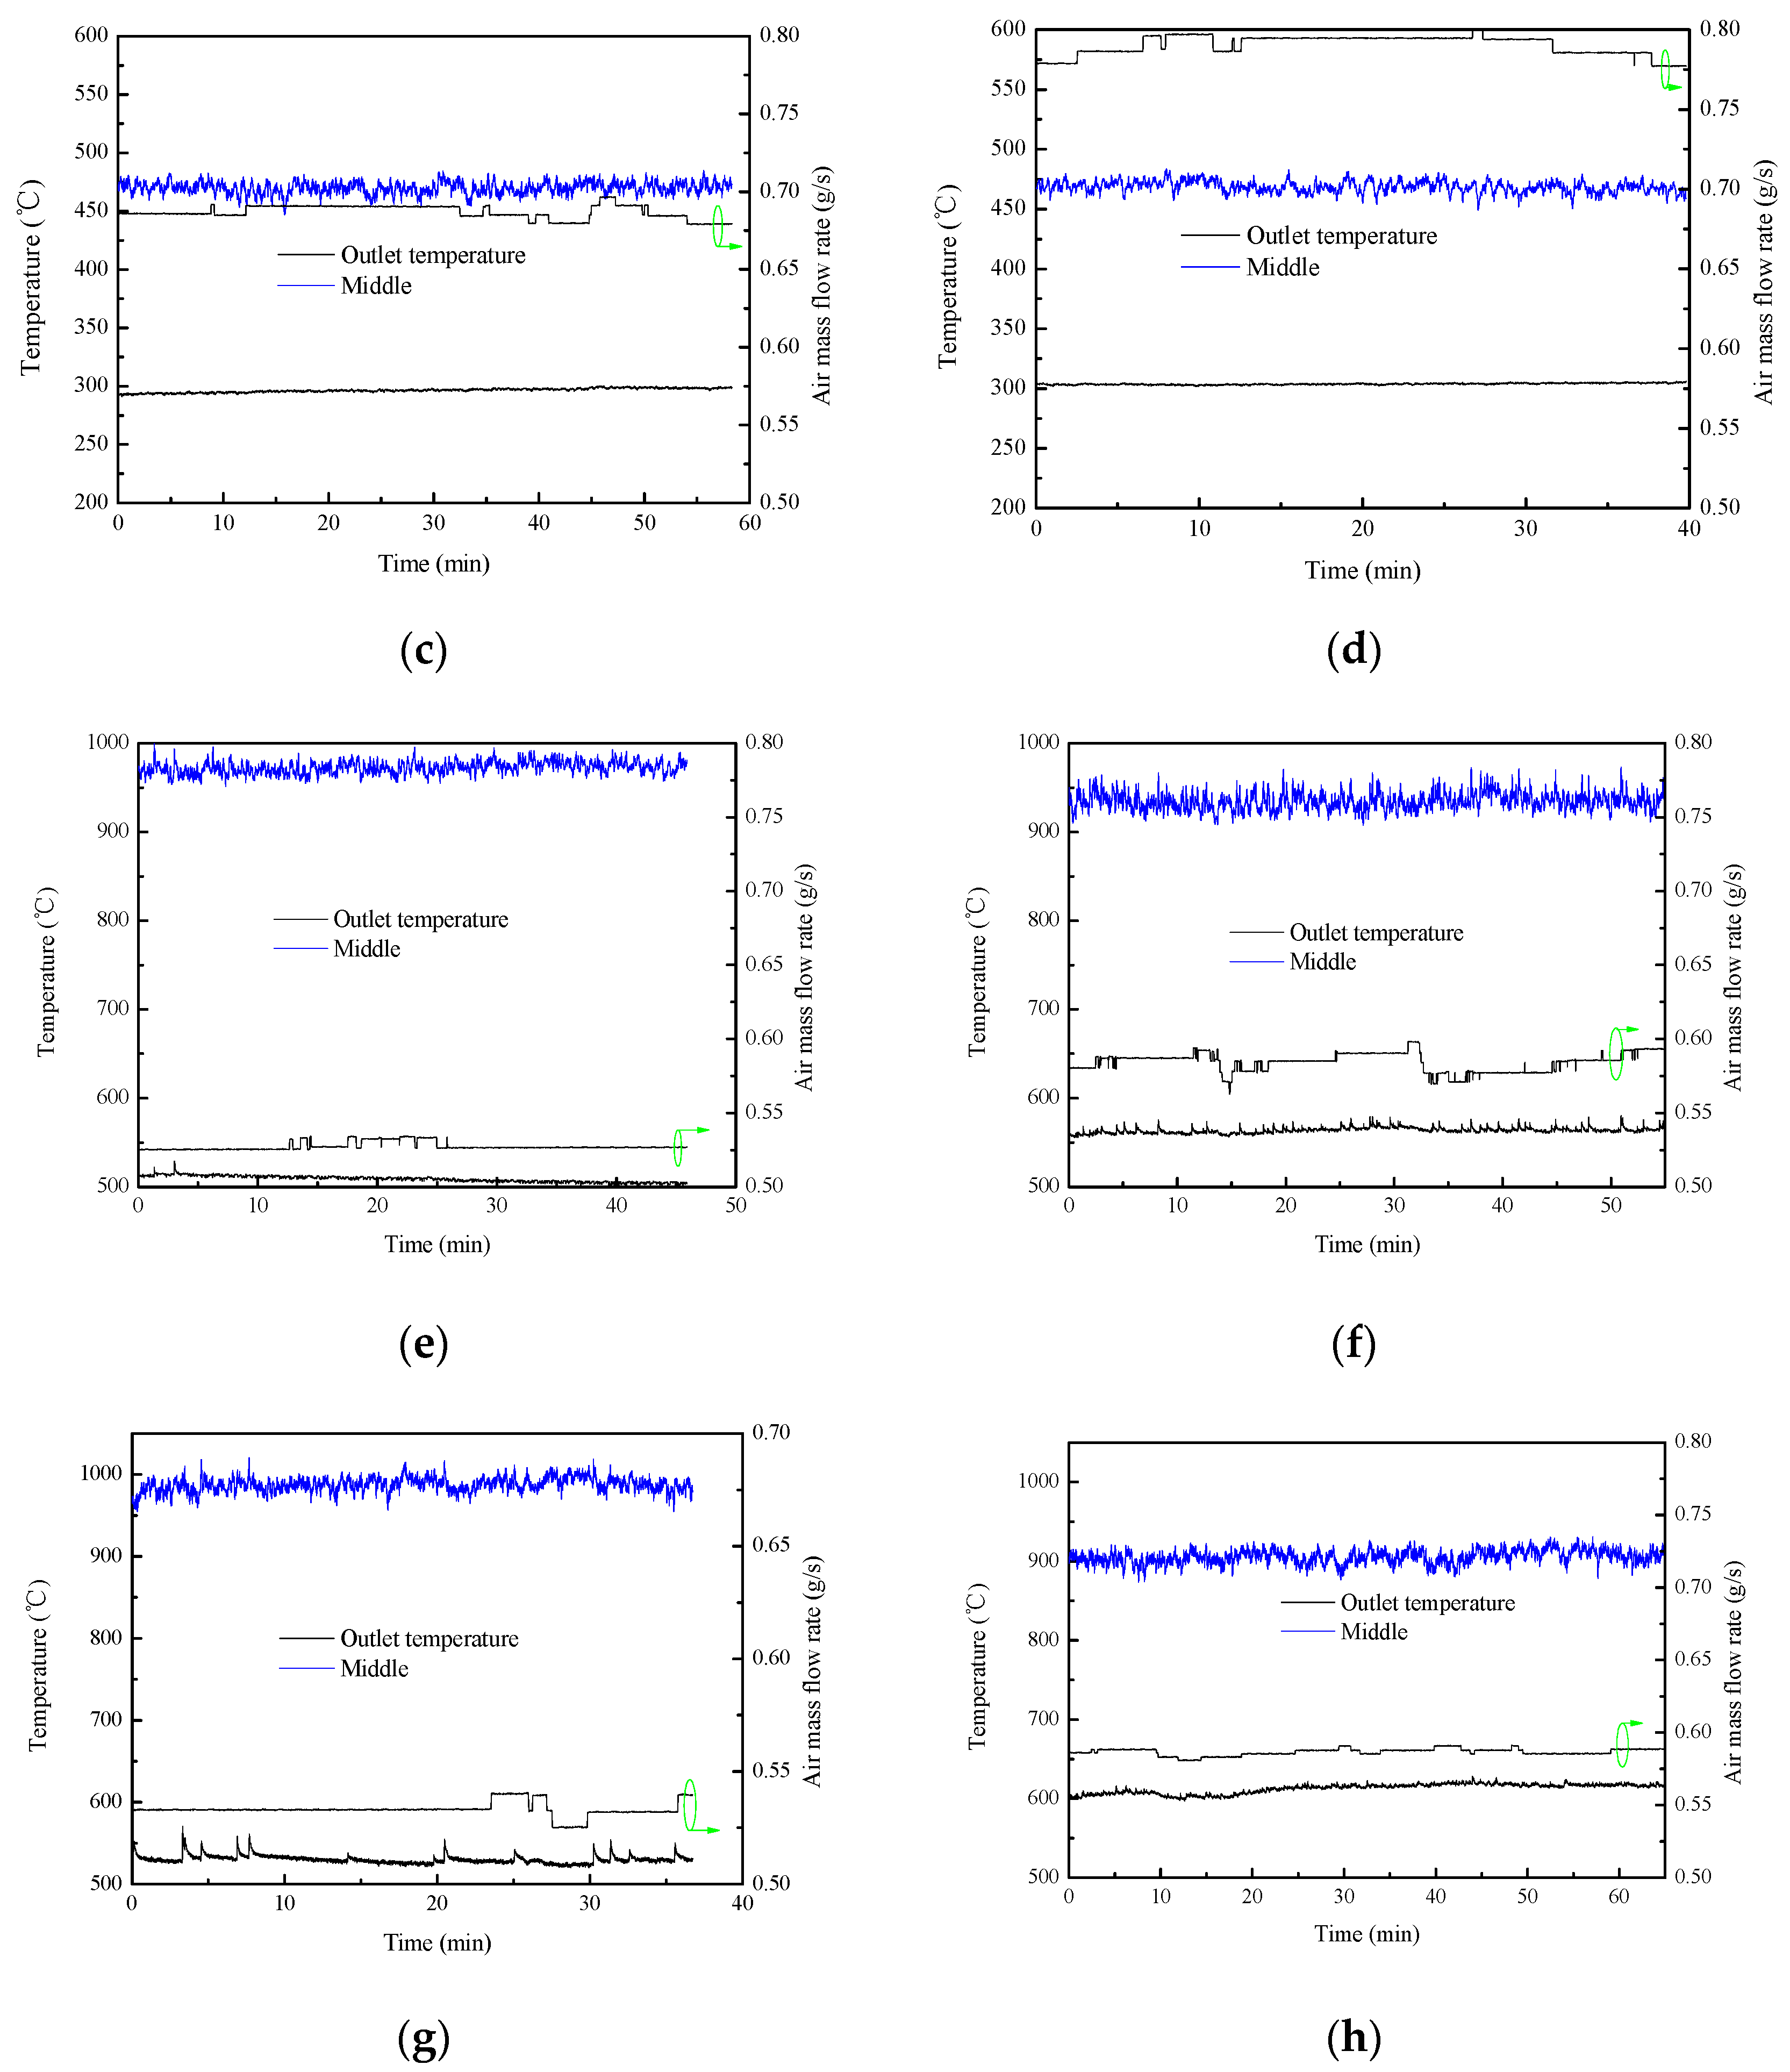
  • Case 1–4 shows that an increase in the air mass flow rate leads to a lower outlet air temperature and a higher thermal efficiency (e.g., Case 1, 263 °C, 31.7% and Case 2, 258 °C, 36.3%) and increasing packed particle mass enhances the heat transfer (e.g., Case 1, 31.7% and Case 3, 33.1%).
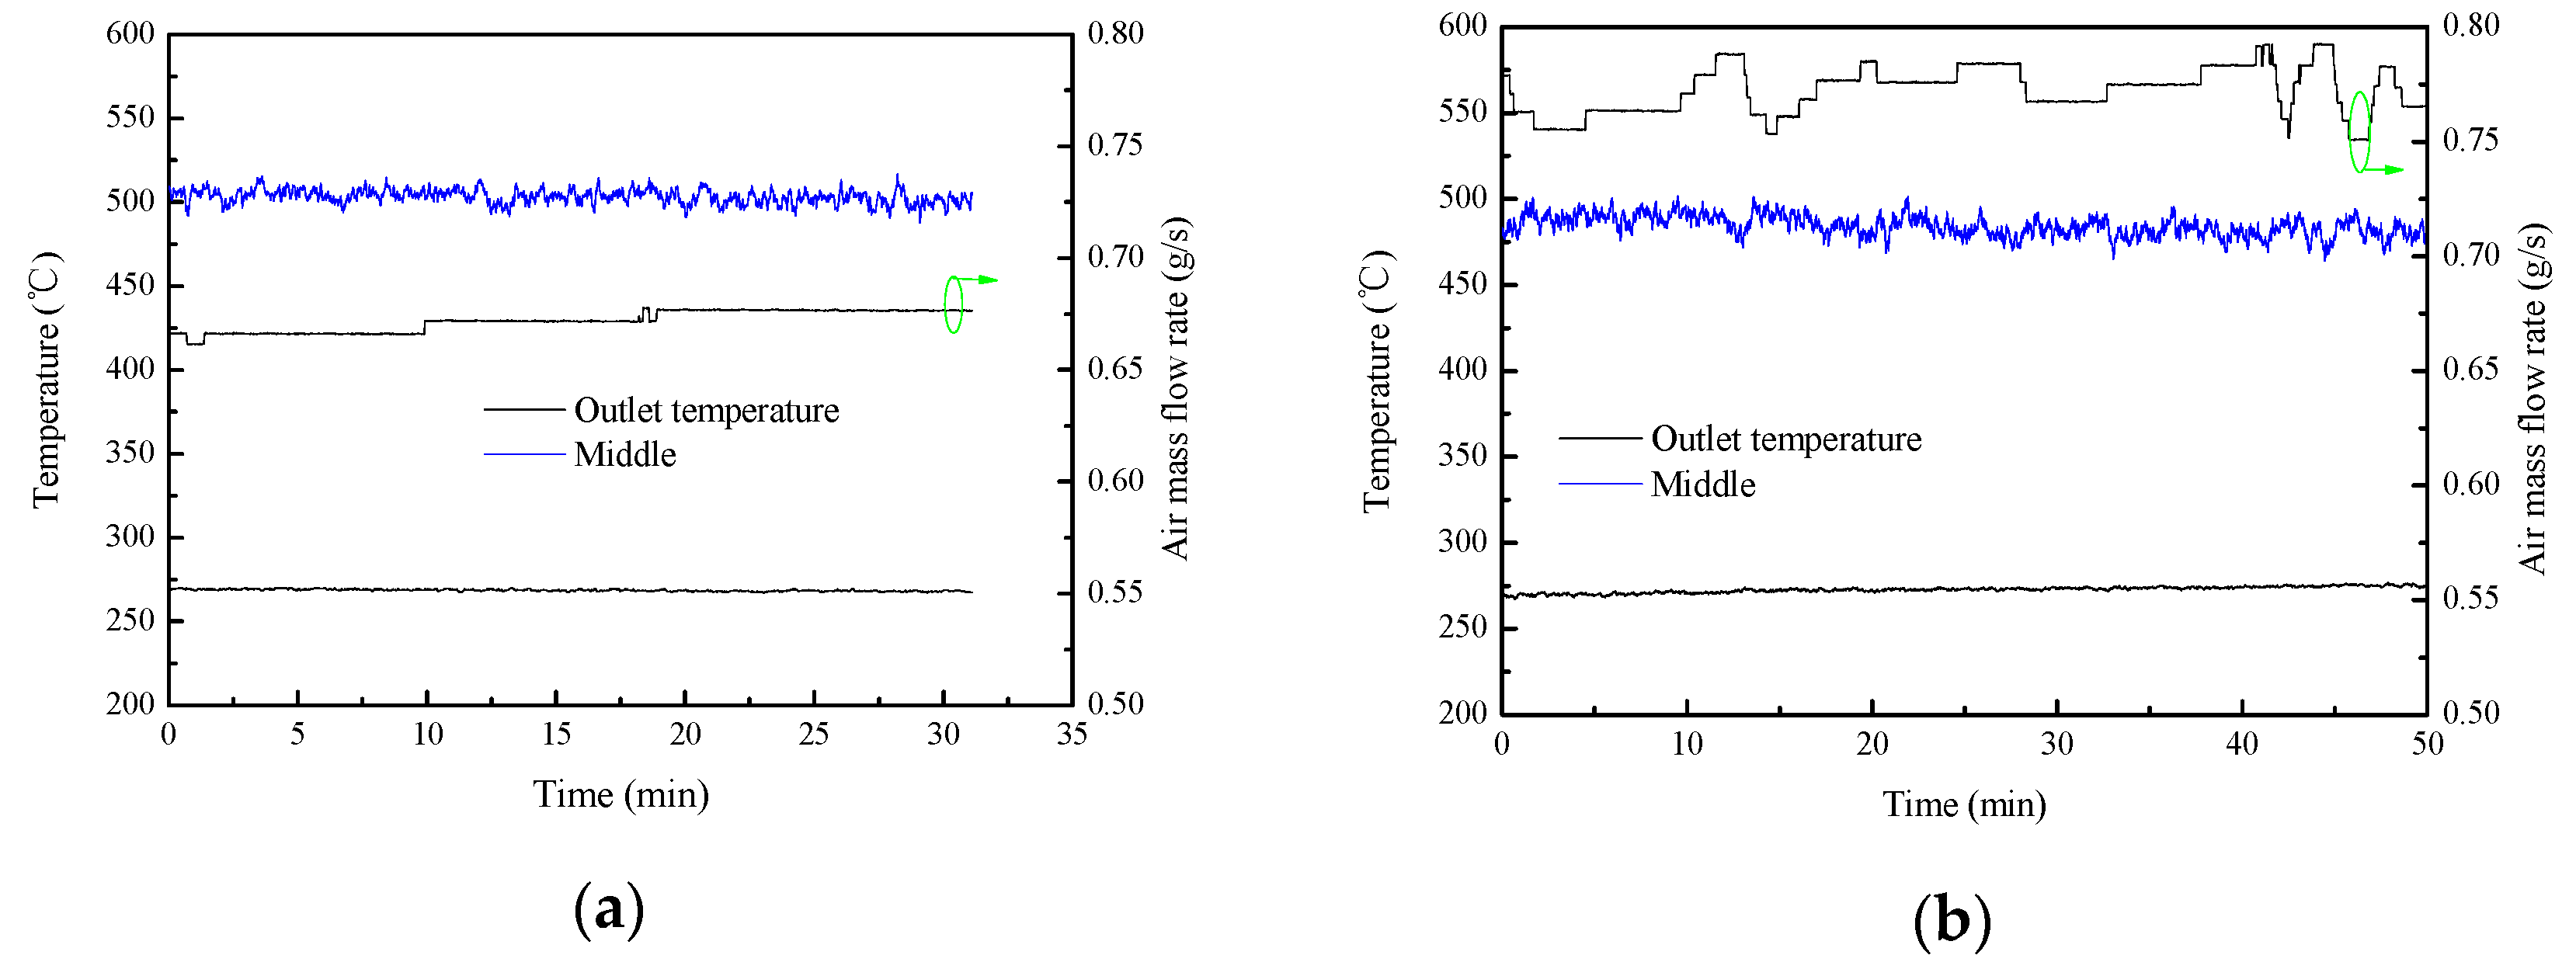
  • Case 5–12 shows that increasing air mass flow rate improves the thermal efficiencies (e.g., Case 11, 21.9% and Case 12, 24.2%) and the heat transfer is enhanced by increasing the packed particle mass (e.g., Case 10, 22.9% and Case 12, 24.2%).
  • The comparisons between Case 1–4 and Case 5–8 indicate that the fluidized heat absorption inside the quartz tube is better than that inside the metal tube (e.g., Case 4, 37.4% and Case 8, 44.6%). In addition, the outlet air temperature increases with the increase of the air mass flow rate inside the quartz glass tube (e.g., Case 7, 297 °C and Case 8, 304 °C), however, that decreases with the increase of the air mass flow rate inside the metal tube (e.g., Case 3, 270 °C and Case 4, 267 °C).
Because the packed particle height in this paper is not enough to fill the opening, research on the packing height above the opening will be carried out.

Author Contributions

S.Z. and Z.W. established all parts of the present work, including experimental design, and the implementation of simulation and experiment. Moreover, the paper was written by S.Z.

Funding

The authors wish to acknowledge the financial support by Beijing Municipal Science and Technology Commission (NO. Z181100004718002).

Acknowledgments

Thanks to the teachers and students of the research department for their help.

Conflicts of Interest

The authors declare no conflict of interest.

Nomenclature

ACoefficient
AiArea (m2)
BCoefficient
cpgAir specific heat (J/(kgK))
cpg,inInlet air specific heat (J/(kgK))
cpg,outOutlet air specific heat (J/(kgK))
cpsSolid specific heat (J/(kgK))
dpParticle size (m)
D1Internal diameter of the tube (m)
D2External diameter of the tube (m)
D3External diameter of tube insulation layer (m)
eRestitution coefficient for the collision between particles
ECoefficient
FCoefficient
gGravitational acceleration (m/s2)
g0Radial distribution function
GIncident radiation (W/m2)
h1Convective heat transfer coefficient on the inner wall of the receiver (W/(m2K))
h2Convective heat transfer coefficient on the outer wall of the tube (W/(m2K))
hw1Overall heat loss coefficient inside the receiver (W/(m2K))
hw2Overall heat transfer coefficient for the tube (W/(m2K))
iNumber
IUnit stress tensor
JsThe dissipation of fluctuating energy (kg/(m3s))
kgAir thermal conductivity (W/(m•K))
kg,effAir effective thermal conductivity (W/(m•K))
kIThermal conductivity of the insulting material (W/(m•K))
ksSolid thermal conductivity (W/(m•K))
ks,effSolid effective thermal conductivity (W/(m•K))
kTThermal conductivity of the tube (W/(m•K))
lThe height of the receiver cavity (m)
m ˙ Air mass flow rate (kg/s)
NNumber of the meshes along x axis
N1Number
NugsNusselt number
NUMNumber of meshes exposed to the incident flux
pgAir pressure (Pa)
psSolid pressure (Pa)
prPrandtl number
qairThermal energy absorbed inside the tube (kW)
qsolarIncident solar flux (W/m2)
QextExtinction factor
RegReynolds number
RepReynolds number
SgIdentity tensor
SsIdentity tensor
SradRadiative source term (W/m3)
TaAmbient temperature (K)
TgAir temperature (K)
Tg,inInlet air temperature (K, = Ta)
Tg,outOutlet air temperature(K)
TsSolid temperature (K)
vgAir velocity (m/s)
vrsTerminal solid velocity (m/s)
vsSolid velocity (m/s)
xCoordinate (m)
Symbols
αConstant
βExtinction coefficient (1/m)
βgsInterphase drag force (kg/(m3s))
γgsGas-solid heat transfer coefficient (W/(m2K))
ΓEffective conductivity parameter
εsParticle emissivity
εwWall emissivity
ζTransmittance
η 0 Function of restitution coefficient
η 1 Thermal efficiency
θsGranular temperature (m2/s2)
κp,θGranular conductivity (kg/(m•s))
μDilute phase shear viscosity (Pa•s)
μgAir viscosity (Pa•s)
μgeAir effective viscosity (Pa•s)
μsGranular shear viscosity (Pa•s)
ξgVoid porosity
ΠExchange term between solid and air
ρgAir density (kg/m3)
ρsSolid density (kg/m3)
σStefan–Boltzmann constant (5.67×10⁻⁸ W/(m2K4))
τTime (s)
τgAir stress-strain tensor (Pa)
τsSolid stress-strain tensor (Pa)
ω Scattering albedo

References

  1. Kim, K.; Siegel, N.; Kolb, G.; Rangaswamy, V.; Moujaes, S.F. A study of solid particle flow characterization in solar particle receiver. Sol. Energy 2009, 83, 1784–1793. [Google Scholar] [CrossRef]
  2. Siegel, N.P.; Ho, C.K.; Khalsa, S.S.; Kolb, G.J. Development and Evaluation of a Prototype Solid Particle Receiver: On-Sun Testing and Model Validation. J. Sol. Energy Eng. 2010, 132, 021008. [Google Scholar] [CrossRef]
  3. Ho, C.K.; Christian, J.M.; Yellowhair, J.; Siegel, N.; Jeter, S.; Golob, M.; Abdel-Khalik, S.I.; Nguyen, C.; Al-Ansary, H. On-Sun testing of an advanced falling particle receiver system. AIP Conf. Proc. 2016, 1734, 030022. [Google Scholar]
  4. Lee, T.; Lim, S.; Shin, S.; Sadowski, D.L.; Abdel-Khalik, S.I.; Jeter, S.M.; Al-Ansary, H. Numerical simulation of particulate flow in interconnected porous media for central particle-heating receiver applications. Sol. Energy 2015, 113, 14–24. [Google Scholar] [CrossRef] [Green Version]
  5. Martinek, J.; Ma, Z. Granular flow and heat-transfer study in a near-blackbody enclosed particle receiver. J. Sol. Energy Eng. 2015, 137, 051008. [Google Scholar] [CrossRef]
  6. Morris, A.B.; Ma, Z.; Pannala, S.; Hrenya, C.M. Simulations of heat transfer to solid particles flowing through an array of heated tubes. Sol. Energy 2016, 130, 101–115. [Google Scholar] [CrossRef] [Green Version]
  7. Ketchem, T.C. Experimental and Numerical Analysis of Heat Transfer in a Particle-Based Concentrated Solar Power Receiver. Ph.D. Thesis, Colorado School of Mines, Golden, CO, USA, 2015. [Google Scholar]
  8. Bai, F.; Zhang, Y.; Zhang, X.; Wang, F.; Wang, Y.; Wang, Z. Thermal performance of a quartz tube solid particle air receiver. Energy Procedia 2014, 49, 284–294. [Google Scholar] [CrossRef]
  9. Wang, F.; Bai, F.; Wang, Z.; Zhang, X. Numerical simulation of quartz tube solid particle air receiver. Energy Procedia 2015, 69, 573–582. [Google Scholar] [CrossRef]
  10. Wang, F.; Bai, F.; Wang, T.; Li, Q.; Wang, Z. Experimental study of a single quartz tube solid particle air receiver. Sol. Energy 2016, 123, 185–205. [Google Scholar] [CrossRef]
  11. Flamant, G.; Gauthier, D.; Benoit, H.; Sans, J.L.; Boissière, B.; Ansart, R.; Hemati, M. A new heat transfer fluid for concentrating solar systems: Particle flow in tubes. Energy Procedia 2014, 49, 617–626. [Google Scholar] [CrossRef]
  12. Marti, J.; Haselbacher, A.; Steinfield, A. A numerical investigation of gas-particle suspensions as heat transfer media for high-temperature concentrated solar power. Int. J. Heat Mass Transf. 2015, 90, 1056–1070. [Google Scholar] [CrossRef]
  13. García-Triñanes, P.; Seville, J.; Boissière, B.; Ansart, R.; Leadbeater, T.; Parker, D. Hydrodynamics and particle motion in upward flowing dense particle suspensions: Application in solar receivers. Chem. Eng. Sci. 2016, 146, 346–356. [Google Scholar] [CrossRef] [Green Version]
  14. Benoit, H. Tubular Solar Receiver with Dense Particle Suspension Upward Flow. Ph.D. Thesis, Universite De Perpignan Via Domitia, Perpignan, France, 2015. [Google Scholar]
  15. Wu, W.; Trebing, D.; Amsbeck, L.; Buck, R.; Pitz-Paal, R. Prototype testing of a centrifugal particle receiver for high-temperature concentrating solar applications. J. Sol. Energy Eng. 2015, 137, 041011. [Google Scholar] [CrossRef]
  16. Urrutia, A.R.; Benoit, H.; Zambon, M.; Gauthier, D.; Flamant, G.; Mazza, G. Simulation of the behavior of a dense SiC particle suspension as an energy transporting vector using computational fluid dynamics (CFD). Chem. Eng. Res. Des. 2016, 106, 141–154. [Google Scholar] [CrossRef]
  17. Benoit, H.; Ansart, R.; García-Triñanes, P.; Gauthier, D.; Flamant, G.; Simonin, O. 3D numerical simulation of upflow bubbling fluidized bed in opaque tube under high flux solar heating. AIChE J. 2018, 64, 3857–3867. [Google Scholar] [CrossRef]
  18. Li, T.; Pannala, S.; Shahnam, M. Reprint of “CFD simulations of circulating fluidized bed risers, part II, evaluation of differences between 2D and 3D simulations. Powder Technol. 2014, 265, 13–22. [Google Scholar] [CrossRef]
  19. Peirano, E.; Delloume, V.; Leckner, B. Two- or three-dimensional simulations of turbulent gas –solid flows applied to fluidization. Chem. Eng. Sci. 2001, 56, 4787–4799. [Google Scholar] [CrossRef]
  20. Xie, N.; Battaglia, F.; Pannala, S. Effects of using two-versus three-dimensional computational modeling of fluidized beds: Part I, hydrodynamics. Powder Technol. 2008, 182, 1–13. [Google Scholar] [CrossRef]
  21. Xie, N.; Battaglia, F.; Pannala, S. Effects of using two-versus three-dimensional computational modeling of fluidized beds: Part II, budget analysis. Powder Technol. 2008, 182, 14–24. [Google Scholar] [CrossRef]
  22. Go´mez, L.C.; Milioli, F.E. Numerical study on the influence of various physical parameters over the gas- solid two-phase flow in the 2D riser of a circulating fluidized bed. Powder Technol. 2003, 132, 216–225. [Google Scholar] [CrossRef]
  23. Almuttahar, A.; Taghipour, F. Computational fluid dynamics of a circulating fluidized bed under various fluidization conditions. Chem. Eng. Sci. 2008, 63, 1696–1709. [Google Scholar] [CrossRef]
  24. Bakshi, A.; Altantzis, C.; Ghoniem, A.F. Towards accurate three-dimensional simulation of dense multi-phase flows using cylindrical coordinates. Powder Technol. 2014, 264, 242–255. [Google Scholar] [CrossRef] [Green Version]
  25. Syamlal, M.; Rogers, W.; O’Brien, T.J. MFIX Documentation: Theory Guide; National Energy Technology Laboratory: Morgantown, WV, USA, 1993.
  26. Moffat, R.J. Describing the uncertainties in experimental results. Exp. Therm. Fluid Sci. 1988, 1, 3–17. [Google Scholar] [CrossRef] [Green Version]
  27. Wen, C.Y.; Yu, Y.H. Mechanics of fluidization. Chem. Eng. Prog. Symp. Ser. 1966, 62, 100–111. [Google Scholar]
  28. Blaszczuk, A.; Nowak, W. Bed-to-wall heat transfer coefficient in a supercritical CFB boiler at different bed particle sizes. Int. J. Heat Mass Transf. 2014, 79, 736–749. [Google Scholar] [CrossRef]
  29. Formisani, B.; Girimonte, R.; Mancuso, L. Analysis of the fluidization process of particle beds at high temperature. Chem. Eng. Sci. 1998, 53, 951–961. [Google Scholar] [CrossRef]
  30. Benyahia, S.; Syamlal, M.; O’Brien, T.J. Summary of MFIX Equations 2012-1; National Energy Technology Laboratory: Morgantown, WV, USA, 2012.
  31. Syamlal, M.; O’brien, T.J. Simulation of granular layer inversion in liquid fluidized beds. Int. J. Multiph. Flow 1988, 14, 473–481. [Google Scholar] [CrossRef]
  32. Modest, M.F. Radiative Heat Transfer, 2nd ed.; Academic Press: New York, NY, USA, 2003; pp. 465–580. [Google Scholar]
  33. Gunn, D.J. Transfer of heat or mass to particles in fixed and fluidized beds. Int. J. Heat Mass Transf. 1978, 21, 467–476. [Google Scholar] [CrossRef]
  34. Li, X.; Kong, W.; Wang, Z.; Chang, C.; Bai, F. Thermal model and thermodynamic performance of molten salt cavity receiver. Renew. Energy 2010, 35, 981–988. [Google Scholar] [CrossRef]
  35. Cengel, A. Heat Transfer: A Practical Approach, 2nd ed.; McGraw-Hill: New York, NY, USA, 2003; pp. 384–389. [Google Scholar]
  36. Zehner, P.; Schlunder, E.U. Warmeleitfahigkeit von Schuttungen bei Massigen Temperaturen. Chem. Ing. Tech. 1970, 42, 933–941. [Google Scholar] [CrossRef]
  37. Marti, J.; Roesle, M.; Steinfeld, A. Combined experimental numerical approach to determine radiation properties of particle suspensions. J. Heat Transf. 2014, 136, 092701. [Google Scholar] [CrossRef]
  38. Wang, P.; Vafai, K.; Liu, D.Y.; Xu, C. Analysis of collimated irradiation under local thermal non-equilibrium condition in a packed bed. Int. J. Heat Mass Transf. 2015, 80, 789–801. [Google Scholar] [CrossRef]
  39. Geldart, D. Types of gas fluidization. Powder Technol. 1973, 7, 285–292. [Google Scholar] [CrossRef]
  40. Makkawi, Y.T.; Wright, P.C.; Ocone, R. The effect of friction and inter-particle cohesive forces on the hydrodynamics of gas-solid flow: A comparative analysis of theoretical predictions and experiments. Powder Technol. 2006, 163, 69–79. [Google Scholar] [CrossRef]
  41. Li, T.; Zhang, Y.; Grace, J.R.; Bi, X. Numerical investigation of gas mixing in gas-solid fluidized beds. AIChE J. 2010, 56, 2280–2296. [Google Scholar] [CrossRef]
  42. Johnson, P.C.; Jackson, R. Frictional collisional constitutive relations for granular materials, with application to plane shearing. J. Fluid Mech. 1987, 176, 67–93. [Google Scholar] [CrossRef]
  43. Li, T.; Benyahia, S. Evaluation of wall boundary condition parameters for gas-solids fluidized bed simulations. AIChE J. 2013, 59, 3624–3632. [Google Scholar] [CrossRef]
Figure 1. Schematic diagram of the experimental bench.
Energies 12 00806 g001
Figure 2. Energy flux distribution of 1–7 lamps with 100 A current when the mirrors were clean.
Energies 12 00806 g002
Figure 3. Energy flux distribution of 1–7 lamps with 50 A current when the mirrors were clean.
Energies 12 00806 g003
Figure 4. The structure and corresponding coordinate system.
Energies 12 00806 g004
Figure 5. The fluidized heat absorption inside the metal tube. (a)Case 1; (b) Case 2; (c) Case 3; (d) Case 4.
Energies 12 00806 g005aEnergies 12 00806 g005b
Figure 6. The fluidized heat absorption inside the quartz tube. (a) Case 5; (b) Case 6; (c) Case 7; (d) Case 8; (e) Case 9; (f) Case 10; (g) Case 11; (h) Case 12.
Energies 12 00806 g006aEnergies 12 00806 g006b
Figure 7. Discretization of the cross-section. (a) Cartesian grid with a mesh size of 7.0 mm (Section 4); (b) Cartesian grid with a mesh size of 2.5 mm (Section 5).
Energies 12 00806 g007
Figure 8. Average cross-sectional void porosity along the axial height for 0.54 m/s and 0.8 m/s (experiment: the average cross-sectional void porosity at the axial height 0.143–0.181 m).
Energies 12 00806 g008
Figure 9. The time-average void porosity along the radial direction at the axial height 0.143–0.181 m.
Energies 12 00806 g009
Figure 10. The comparison of time-average quasi-steady outlet air temperatures (height 1.5 m) obtained by experiment and simulation.
Energies 12 00806 g010
Figure 11. The time-average quasi-steady air temperature distributions in the opening (0.11–0.35 m). The energy fluxes are incident from the left side. (a) 100 A and 0.53 g/s; (b) 100 A and 0.59 g/s; (c) 50 A and 0.69 g/s; (d) 50 A and 0.79 g/s.
Energies 12 00806 g011
Table 1. The performance of the devices.
NameSpecificationQuantityRemarkUncertainty
Air compressor1.2 MPa13 phase/
ThermocoupleType K6/±0.5%
Flow meterThermal mass flow meter10–41.9 Nm3/h±1%
Data acquisitionHP Agilent 34972A13M/60C/
Air tank/12 m3/
Buffer tank/10.3 m3/
Table 2. Cases and results.
Case2.0 m TubeCurrent (A)Initial Packed Particle Mass (g)Inlet Air Temperature (°C)Outlet Air Temperature (°C)Air Mass Flow Rate (g/s)Thermal Efficiency (%)
1Q235B50160242630.6631.7
2Q235B50160242580.7736.3
3Q235B50240232700.6633.1
4Q235B50240232670.7637.4
5Quartz50160232690.6733.7
6Quartz50160232730.7738.5
7Quartz50240212970.6938.5
8Quartz50240213040.7944.6
9Quartz100160275090.5317.5
10Quartz100160275640.5822.9
11Quartz100240255300.5321.9
12Quartz100240256130.5924.2
Table 3. Summary of governing equations.
Gas-phase Equations
Continuity equation
τ ( ξ g ρ g ) + · ( ξ g ρ g v g ) = 0
Momentum equation
τ ( ξ g ρ g v g ) + · ( ξ g ρ g v g v g ) = ξ g p g + · τ g ¯ ¯ β g s ( v s v g ) + ξ g ρ g g
Energy equation
τ ( ξ g ρ g c p g T g ) + v g · ( ξ g ρ g c p g T g ) = · ( ξ g k g , e f f T g ) γ g s ( T g T s )
Solid-phase Equations
Continuity equation
τ ( ( 1 ξ g ) ρ s ) + · ( ( 1 ξ g ) ρ s v s ) = 0
Momentum equation
τ ( ( 1 ξ g ) ρ s v s ) + · ( ( 1 ξ g ) ρ s v s v s ) = ( 1 ξ g ) p g + · τ s ¯ ¯ + β g s ( v s v g ) + ( 1 ξ g ) ρ s g
Energy equation
τ ( ( 1 ξ g ) ρ s c p s T s ) + v s · ( ( 1 ξ g ) ρ s c p s T s ) = · ( ( 1 ξ g ) k s , e f f T s ) + γ g s ( T g T s ) + S r a d
Constitutive Equations
Gas stress tensor
τ g ¯ ¯ = 2 μ g e S g ¯ ¯
S g ¯ ¯ = 1 2 ( v g + ( v g ) T ) 1 3 · v g I ¯ ¯
Solid phase stress tensor
τ s ¯ ¯ = ( p s + η 0 μ b · v s ) I ¯ ¯ + 2 μ s S s ¯ ¯
S s ¯ ¯ = 1 2 ( v s + ( v g ) T ) 1 3 ( · v g ) I ¯ ¯
p s = ( 1 ξ g ) ρ s θ s ( 1 + 4 g 0 ( 1 ξ g ) η 0 )
μ s = ( 2 + α 3 ) [ μ s * g 0 η 0 ( 2 η 0 ) ( 1 + 5 8 g 0 ( 1 ξ g ) η 0 ) ( 1 + 5 8 η 0 ( 3 η 0 2 ) g 0 ( 1 ξ g ) ) + 5 8 η 0 μ b ]
μ s * = ( 1 ξ g ) ρ s θ s g 0 μ ( 1 ξ g ) ρ s θ s g 0 + 2 β g s μ ( 1 ξ g ) ρ s
μ = 5 96 ρ s d p π θ s
μ b = 256 5 π μ ( 1 ξ g ) 2 g 0
η 0 = 1 + e 2
Granular temperature
3 2 [ τ ( ( 1 ξ g ) ρ s θ s ) + · ( ( 1 ξ g ) ρ s θ s v s ) ] = τ s ¯ ¯ : v s + · ( κ p , θ θ s ) + Π ( 1 ξ g ) ρ s J s
κ p , θ = κ s * g 0 [ ( 1 + 12 5 η 0 ( 1 ξ g ) g 0 ) ( 1 + 12 5 η 0 2 ( 4 η 0 3 ) ( 1 ξ g ) g 0 ) + 64 25 π ( 41 33 η 0 ) η 0 2 ( 1 ξ g ) 2 g 0 2 ]
κ s = ( 1 ξ g ) ρ s θ s g 0 κ ( 1 ξ g ) ρ s θ s g 0 + 6 β g s κ 5 ( 1 ξ g ) ρ s
κ = 75 d p ρ s π θ s 48 η 0 ( 41 33 η 0 )
J s = 48 π η 0 ( 1 η 0 ) ( 1 ξ g ) g 0 θ s 3 / 2 d p
Π = 3 β g s θ s + 81 ( 1 ξ g ) μ g 2 | v g v s | 2 g 0 d p 3 ρ s π θ s
Interphase drag model
β g s = 3 ξ g ( 1 ξ g ) ρ g | v g v s | 4 ν r s 2 d p ( 0.63 + 4.8 ν r s / Re p ) 2
ν r s = 0.5 ( E 0.06 Re p + ( 0.06 Re p ) 2 + 0.12 Re p ( 2 F E ) + E 2 )
E = ξ g 4.14
F = { 0.8 ξ g 1.28 , ξ g 0.85 ξ g 2.65 , ξ g > 0.85
Re p = ρ g ξ g | v g v s | d p μ g

