Numerical Investigation of the Impacts of Borehole Breakouts on Breakdown Pressure


Abstract
:1. Introduction
2. Model Structure and Methodology
2.1. Rock Failure Criterion
2.1.1. Rock Compression Failure Criterion
2.1.2. Rock Tension Failure Criterion
2.2. Analytical Solution for the Width of Breakouts
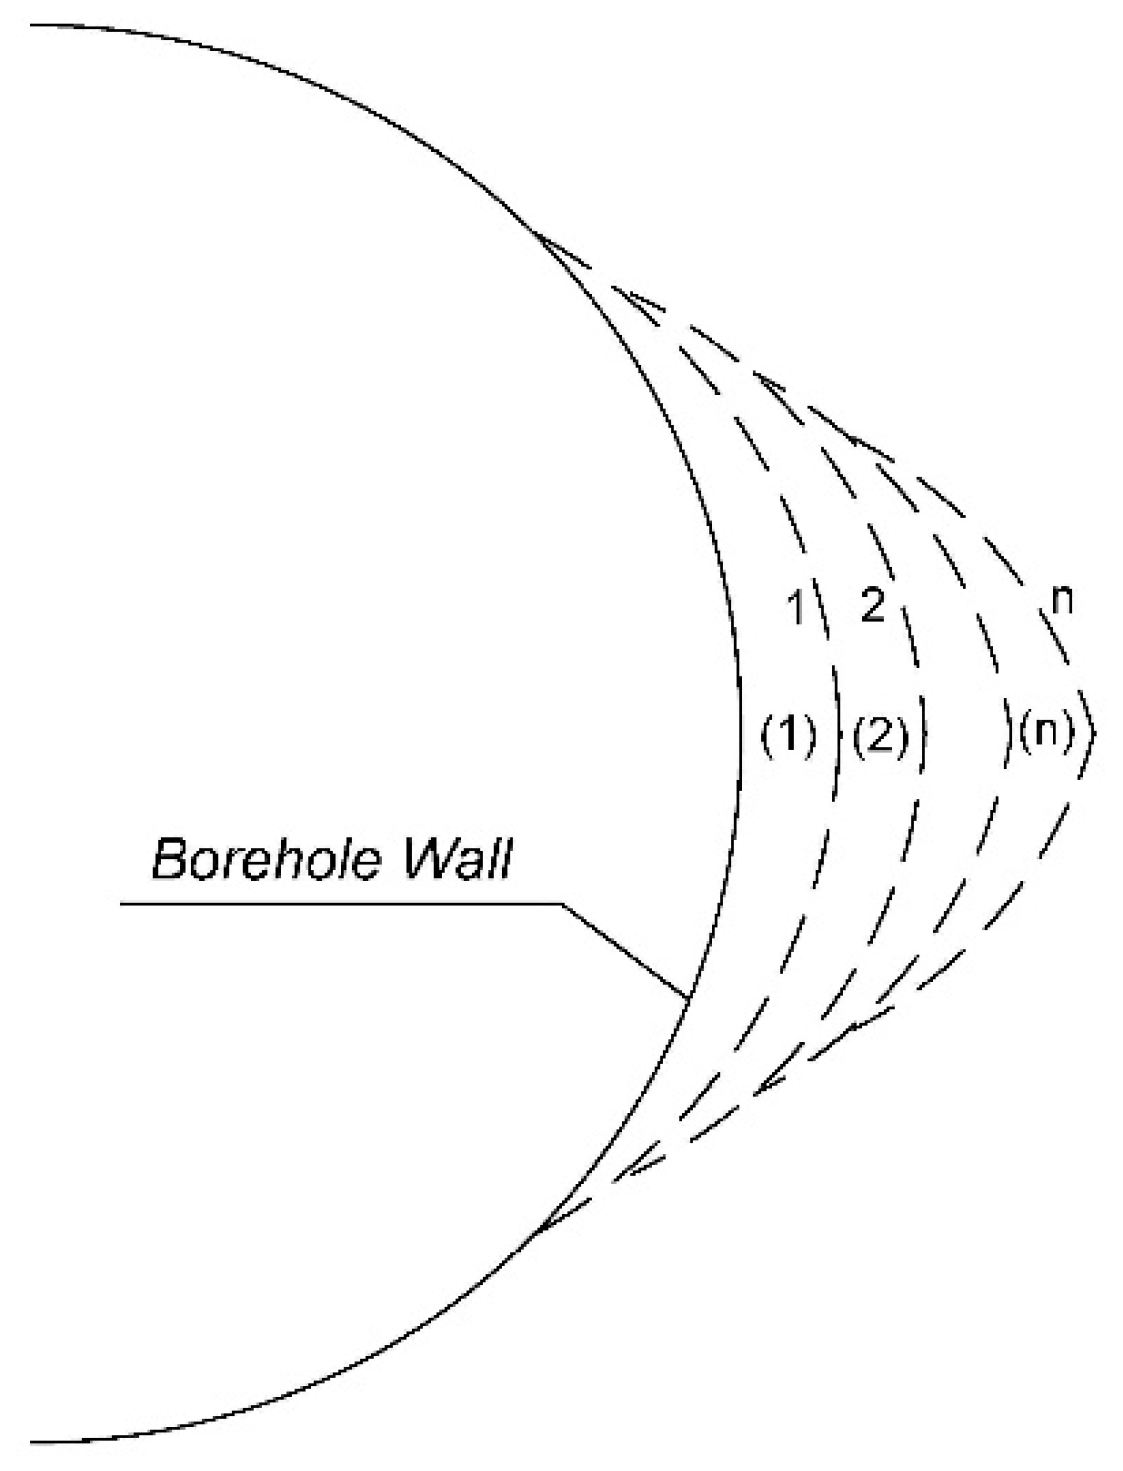
2.3. Simulation of the Borehole Breakouts by the Finite Element Method
2.4. Finite Element Implementation
2.4.1. Constitutive Model
2.4.2. Elements Choosing
2.4.3. Governing Equations
3. Verification and Numerical Experiments
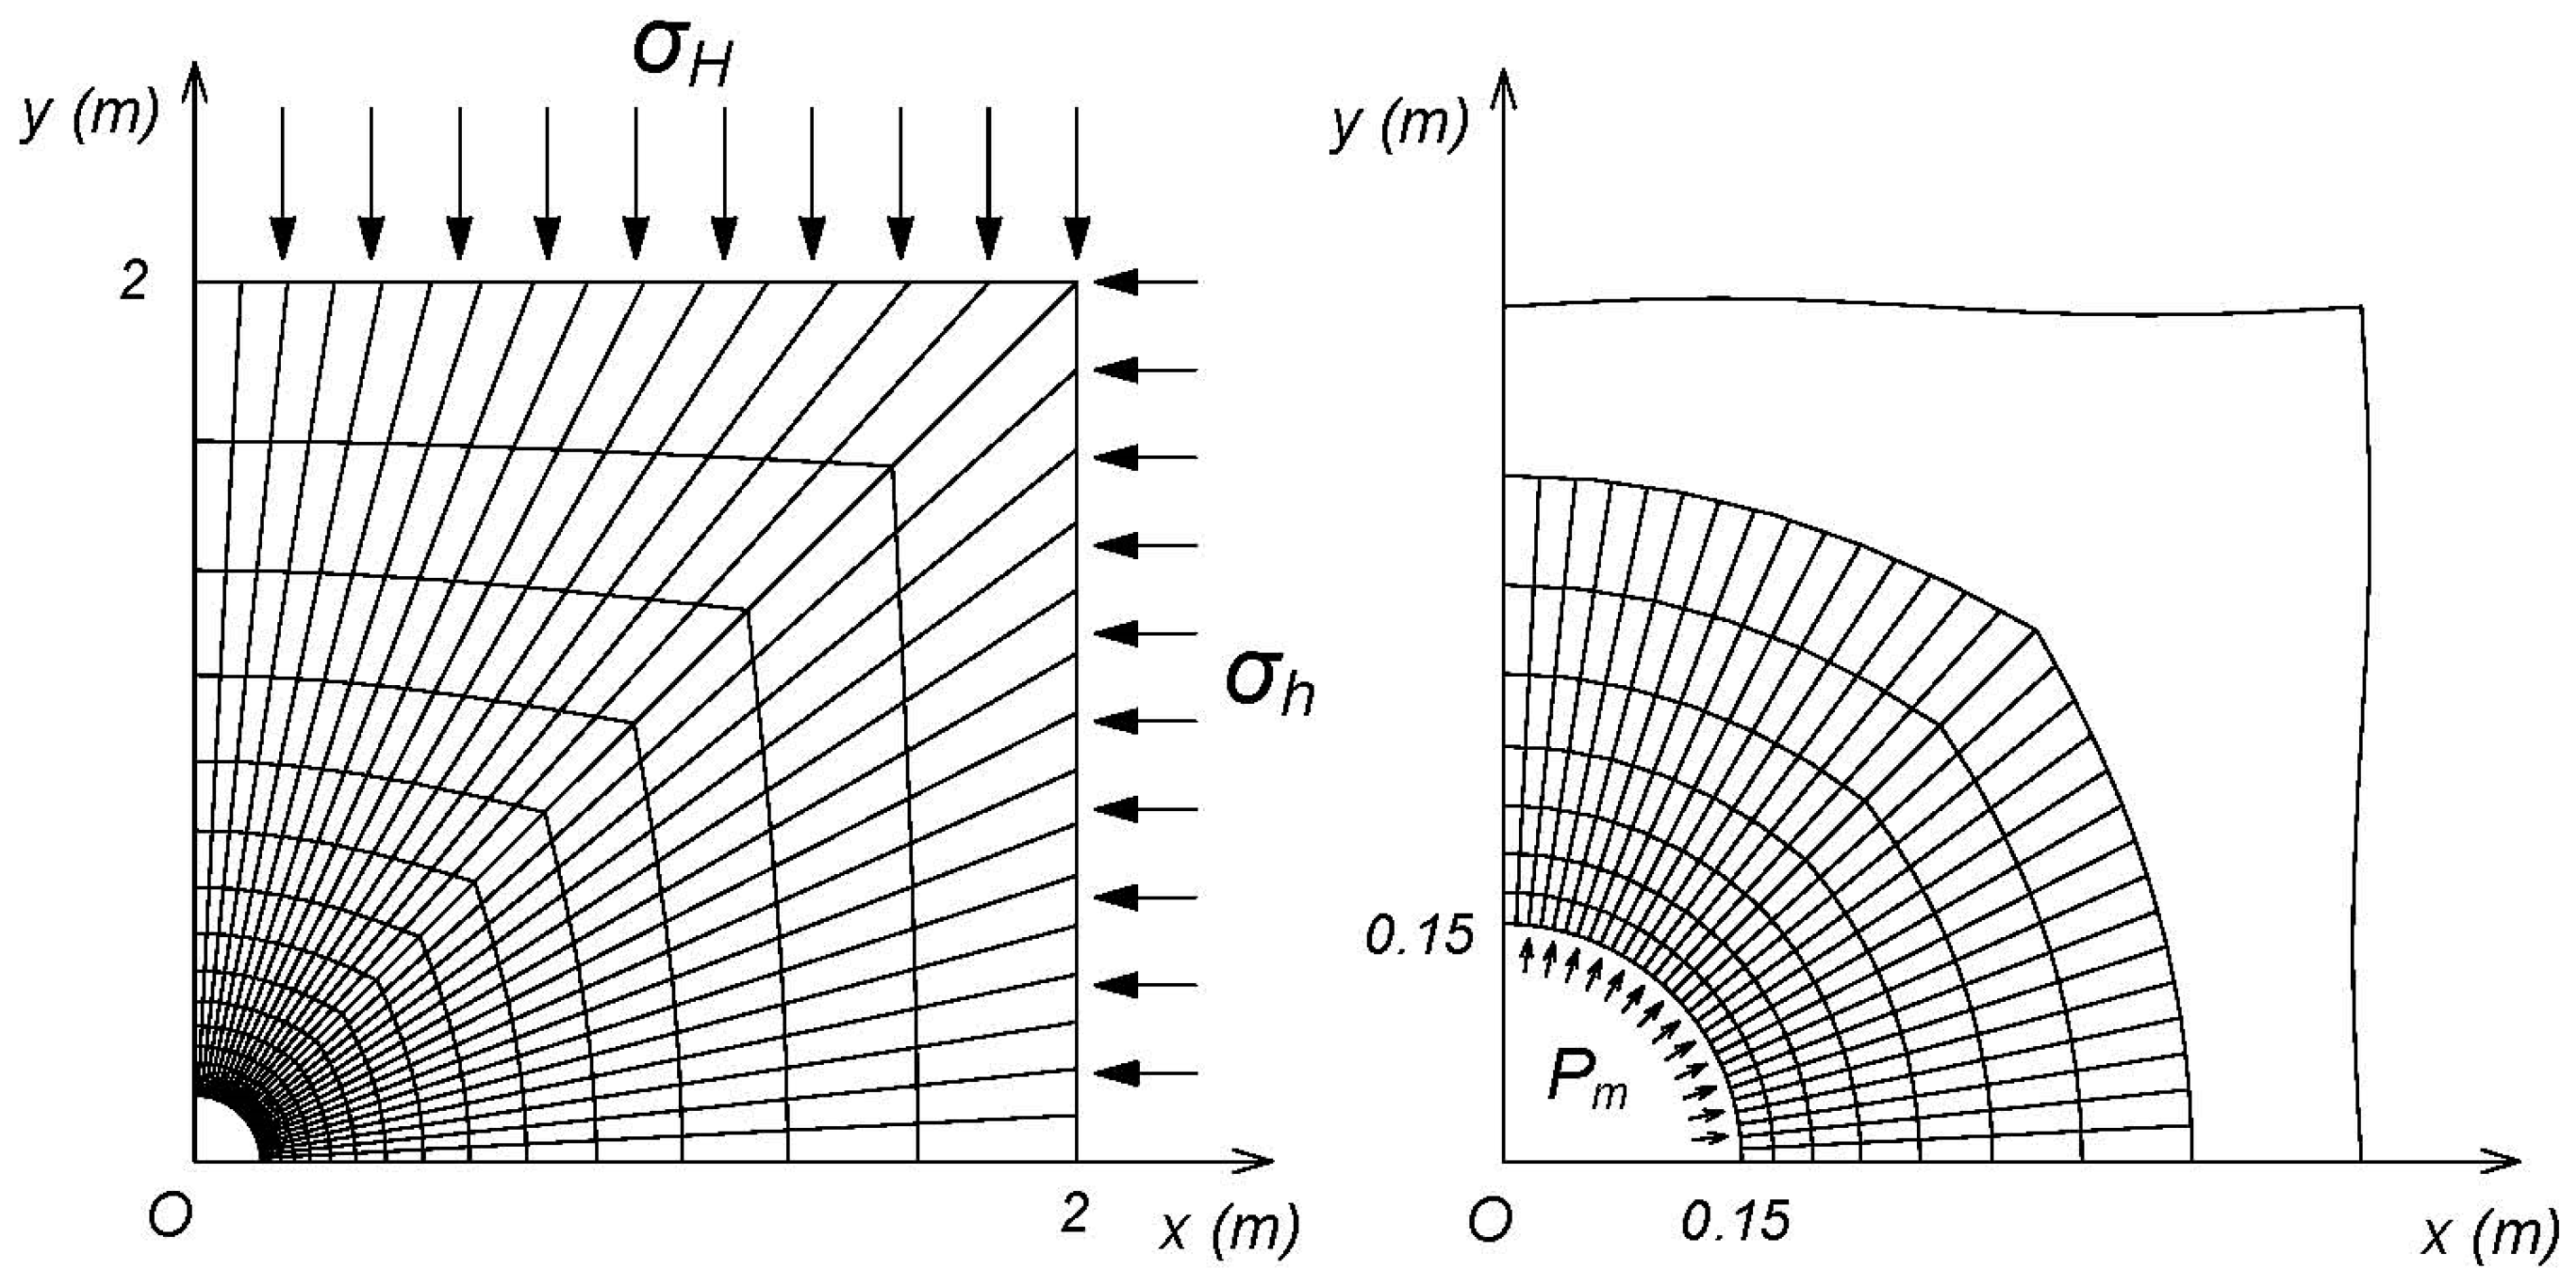
3.1. Finite Element Model for Borehole Breakouts
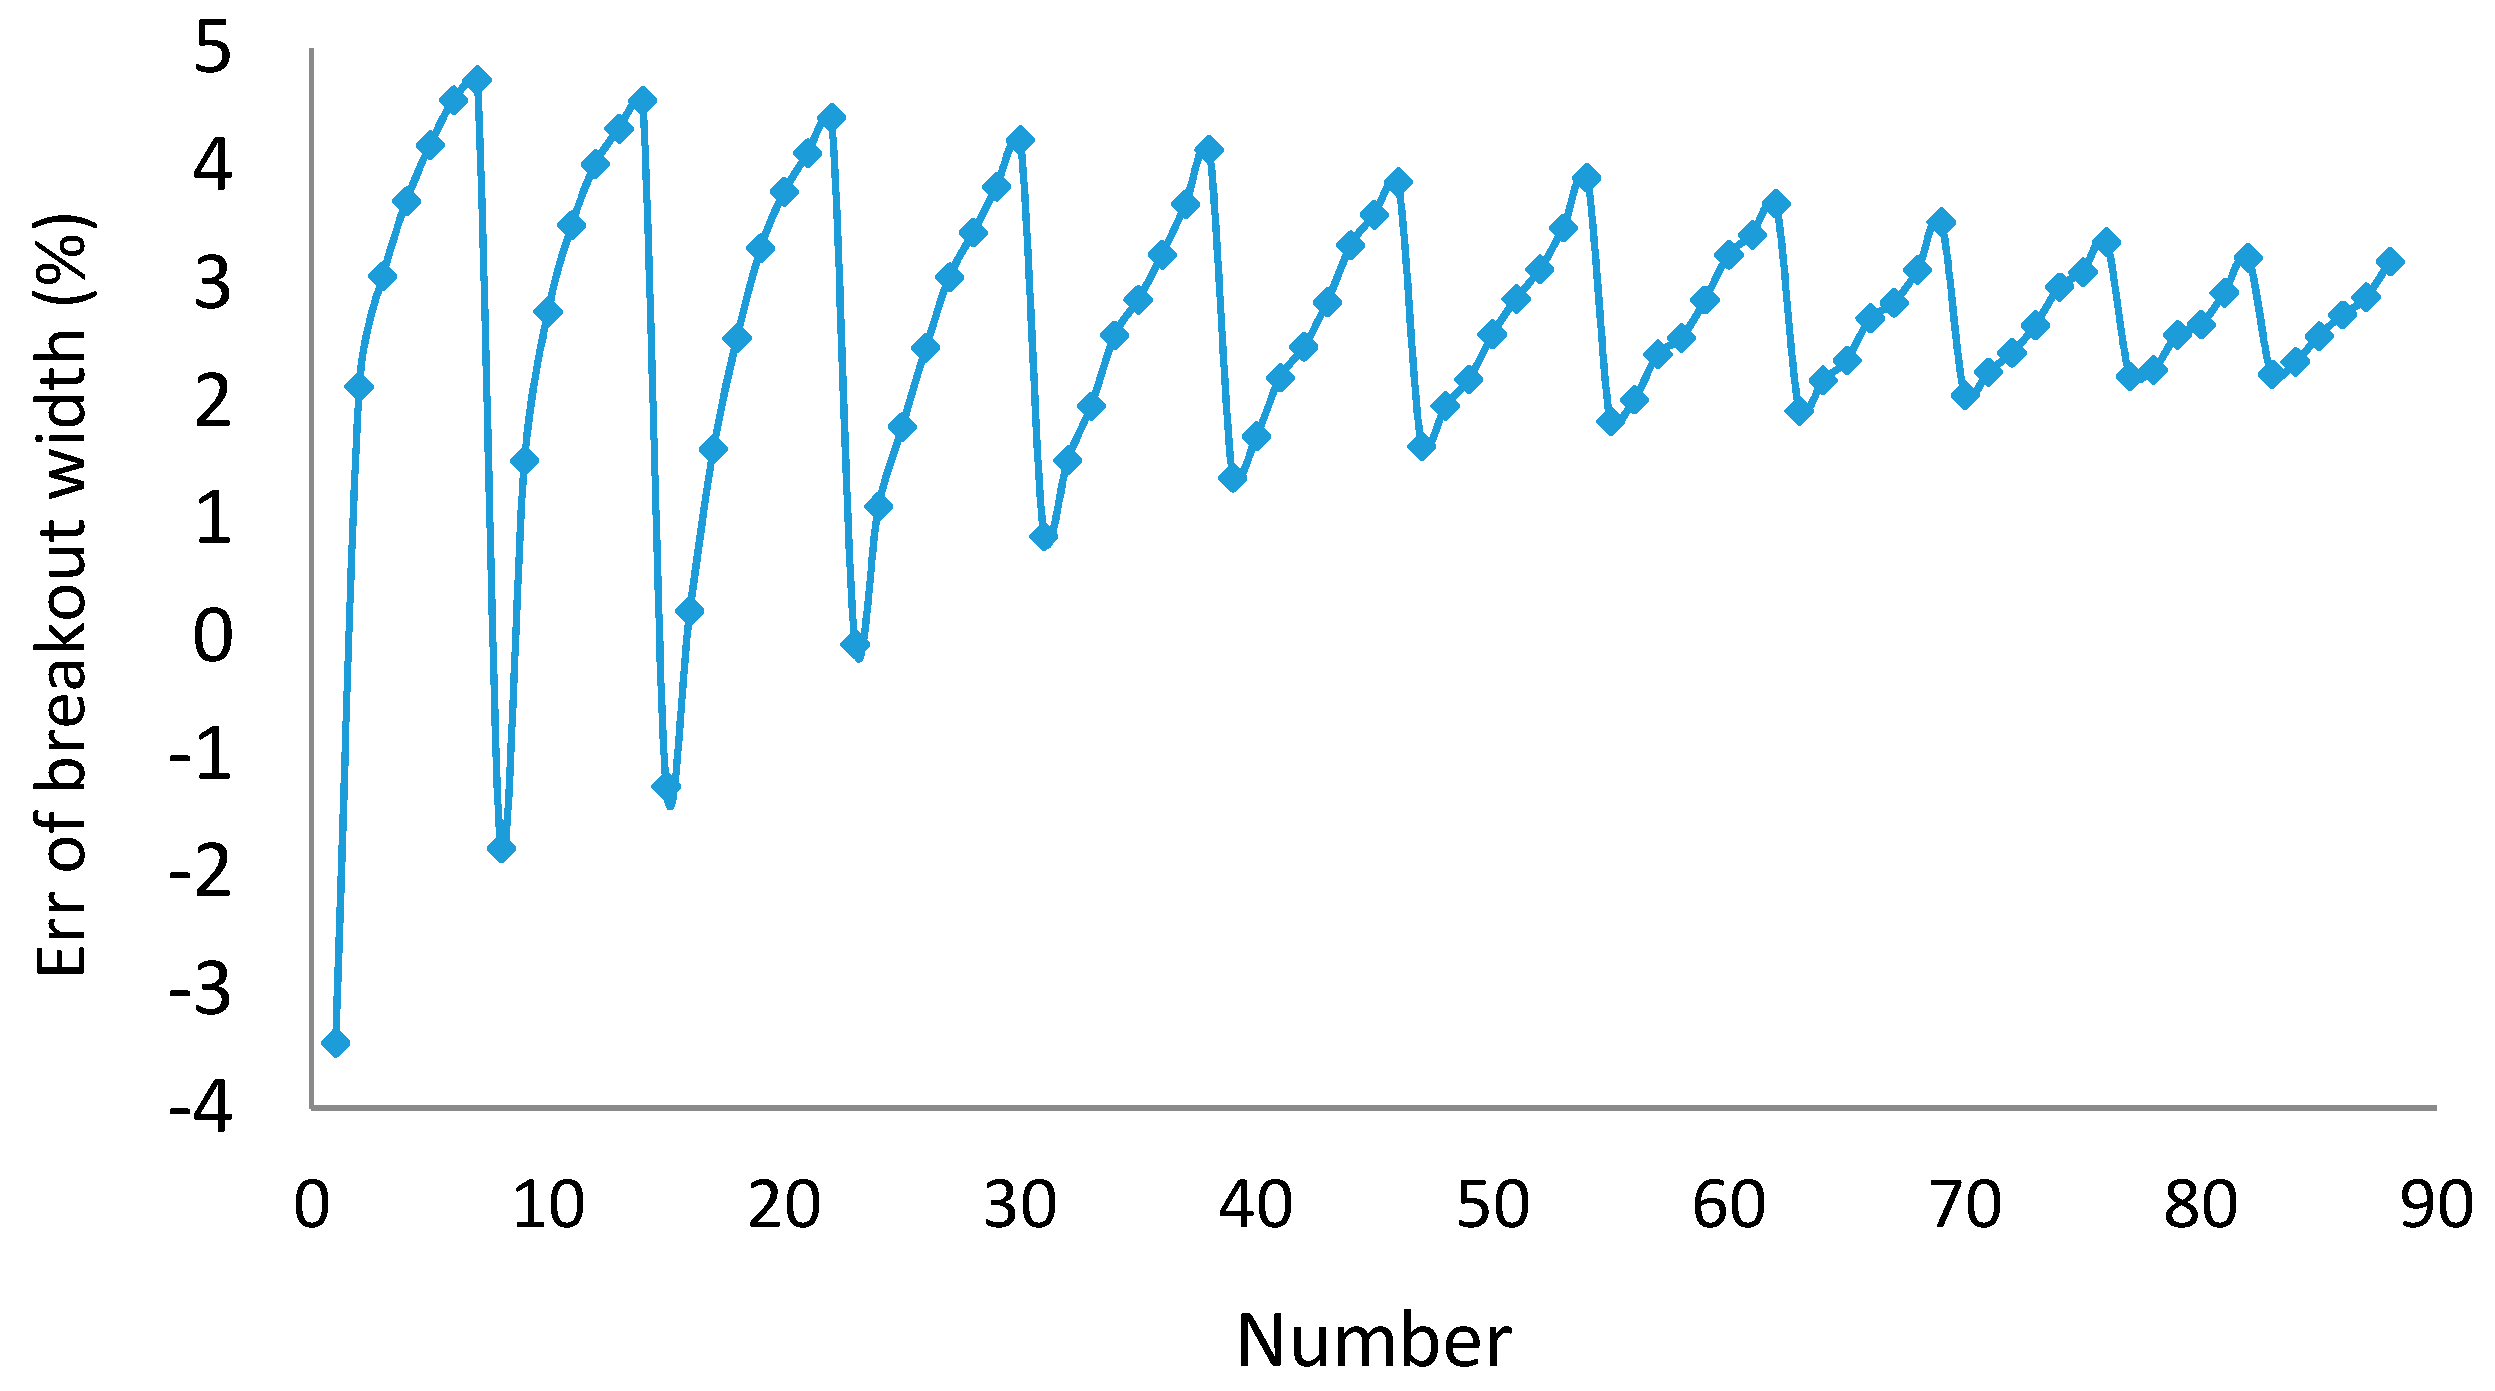
3.2. Verification of the Finite Element Model for Borehole Breakouts
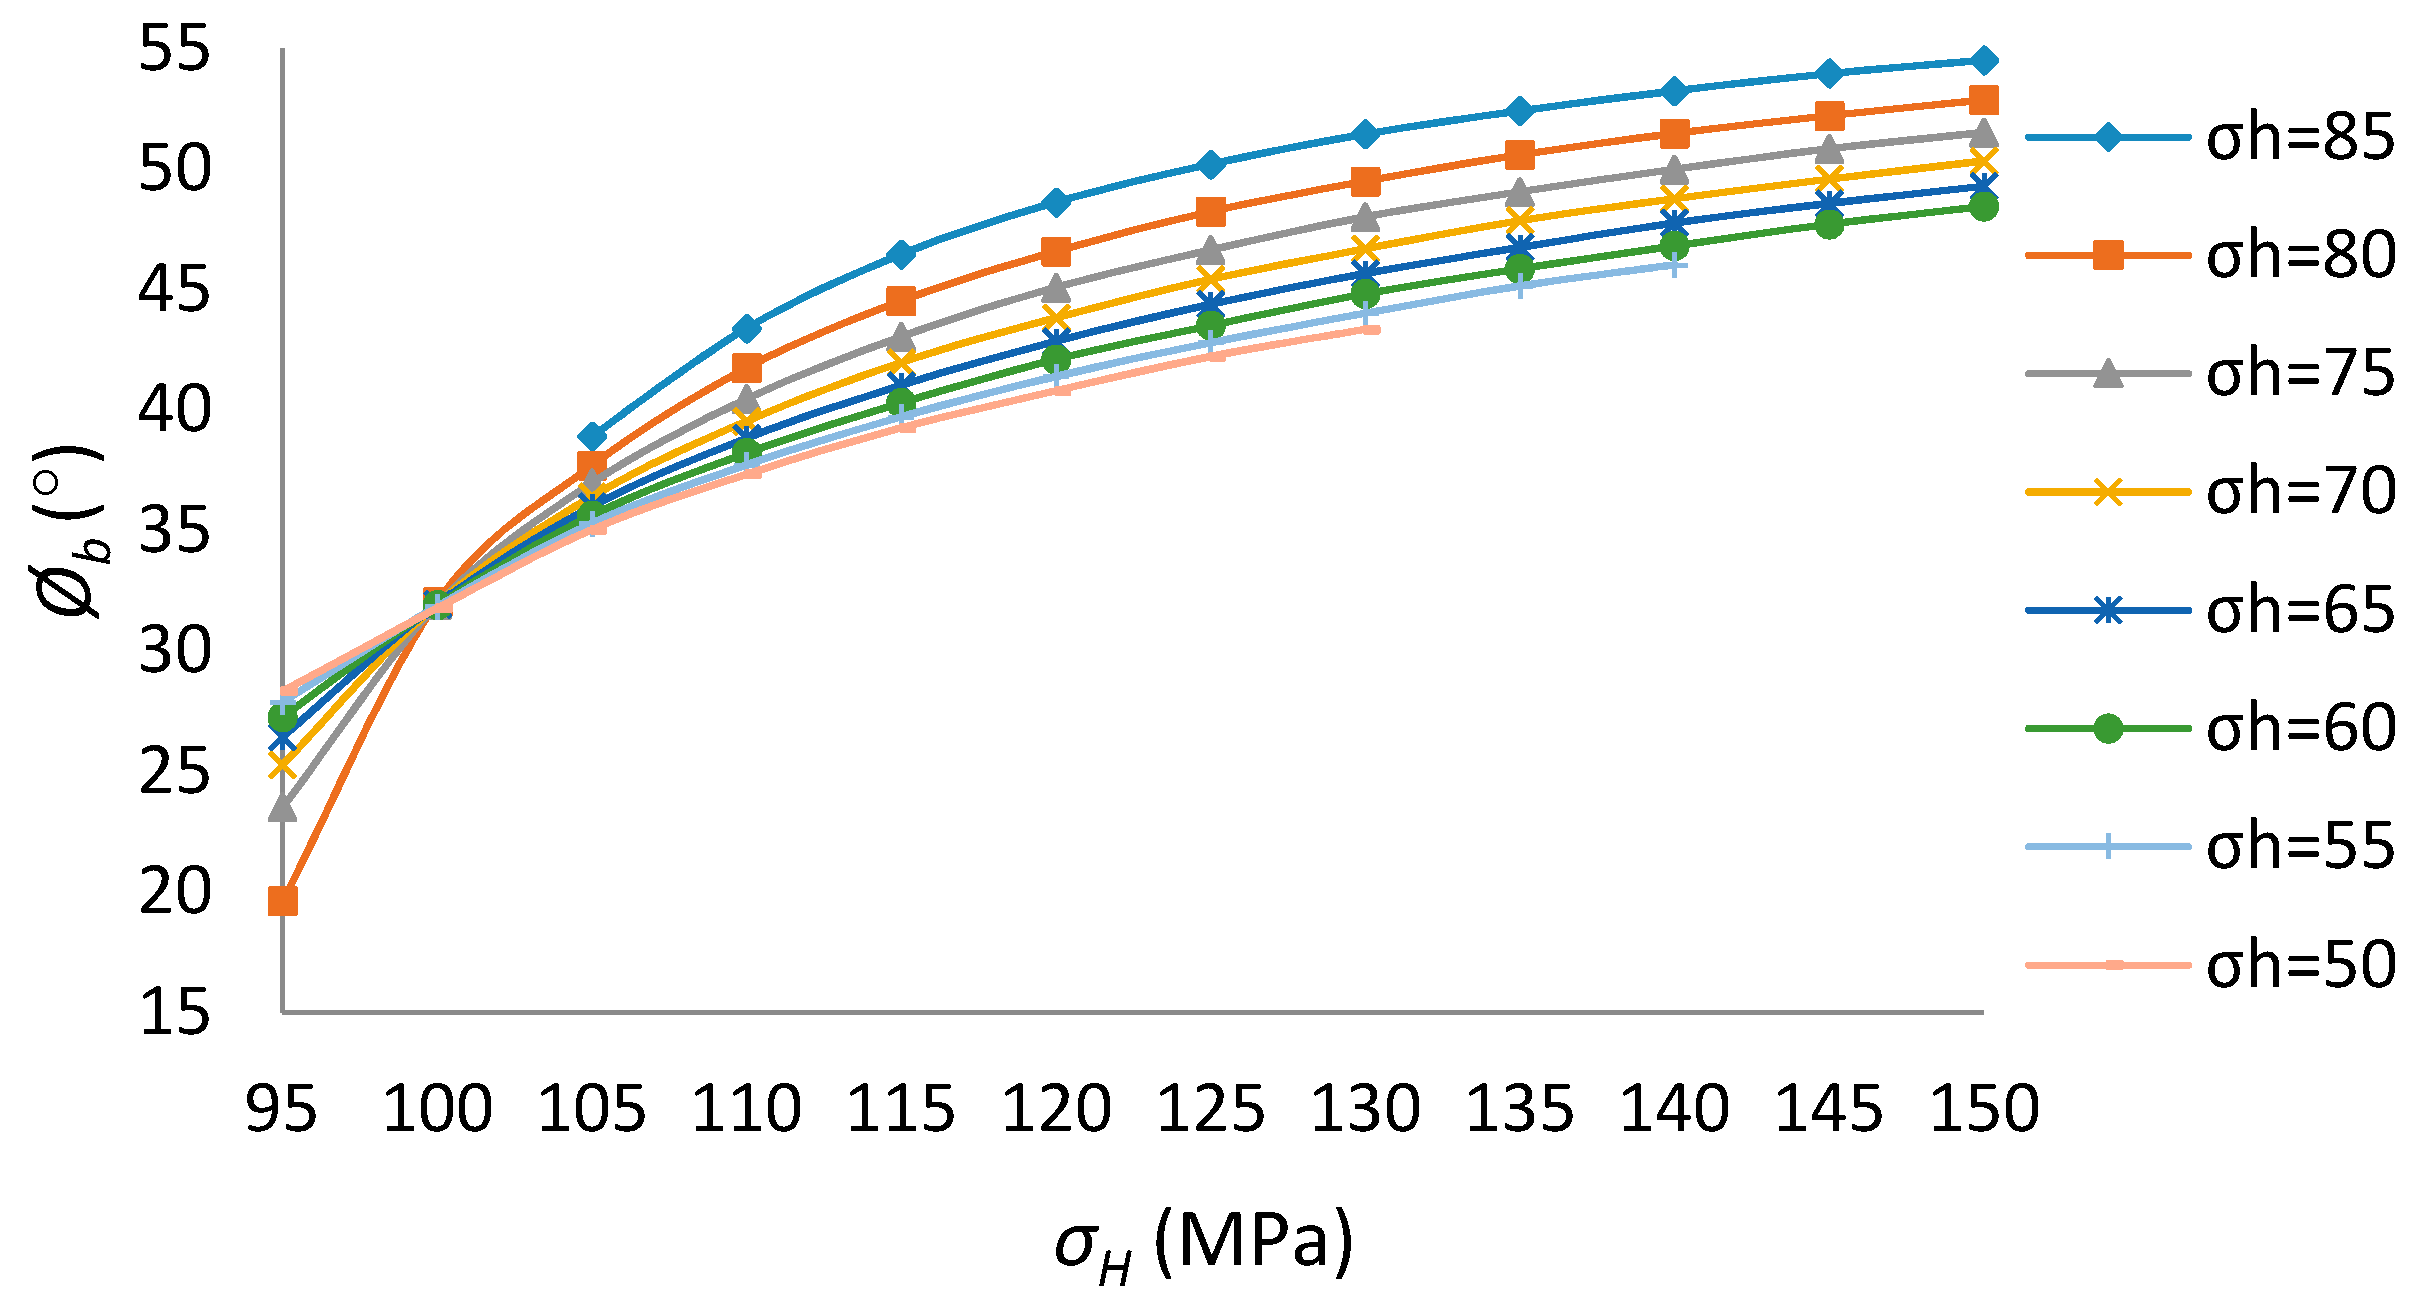
3.3. Relationship between In Situ Stress and a Borehole Breakout
3.4. Analysis of Mesh Dependency (Influence of Finite Element Mesh Size)
3.5. Verification of the Process of Borehole Breakouts
3.6. Numerical Experiments on Breakdown Pressure of the Borehole That Had Breakouts
4. Conclusions
Author Contributions
Conflicts of Interest
Nomenclature
| Cohesive strength | |
| Internal friction angle | |
| Normal stress on the failure plane | |
| Shear stress on the failure plane | |
| The maximum principal stress | |
| The minimum principal stress | |
| F | Breakout coefficient |
| Tensile strength of rock | |
| Radial stress | |
| Circumferential stress | |
| Vertical stress | |
| Tangential shear stress | |
| The maximum horizontal in situ stress | |
| The minimum horizontal in situ stress | |
| Vertical in situ stress | |
| Radius of a borehole | |
| Distance from the center of the borehole | |
| Angle from the maximum principal stress | |
| Fluid pressure in the borehole | |
| Breakout width | |
| Breakout depth | |
| Breakdown pressure of borehole | |
| Stress vector | |
| Strain vector | |
| Elastic stiffness matrix | |
| Young’s modulus | |
| Poisson’s ratio | |
| Lamé constants | |
| Vector for the nodal loads | |
| Vector for unknown displacement | |
| Node displacement | |
| Shape function | |
| Elastic stiffness | |
| Matrix relating strain and displacement |
References
- Han, H.; Yin, S. Determination of Geomechanical Properties and In-situ Stress from Borehole Deformation. Energies 2018, 11, 131. [Google Scholar] [CrossRef]
- Zhang, H.; Yin, S.; Aadnoy, B. Poroelastic modeling of borehole breakouts for in-situ stress determination by finite element method. J. Pet. Sci. Eng. 2018, 162, 674–684. [Google Scholar] [CrossRef]
- Kirsch, G. Die theorie der elastizitaet und die beduerfnisse der festigkeitslehre. VDI Z. 1898, 29, 797–807. [Google Scholar]
- Schmitt, D.R.; Zoback, M.D. Poroelastic effects in the determination of maximum horizontal principal stress in hydraulic fracturing tests—A proposed breakdown equation employing a modified effective stress relation for tensile failure. Int. J. Rock Mech. Min. Sci. Geomech. Abstr. 1989, 26, 499–506. [Google Scholar] [CrossRef]
- Bell, J.S. Practical methods for estimating in situ stresses for borehole stability applications in sedimentary basins. J. Pet. Sci. Eng. 2003, 38, 111–119. [Google Scholar] [CrossRef]
- Zoback, M.D.; Barton, C.A.; Brudy, M.; Castillo, D.A.; Finkbeiner, T.; Grollimund, B.R.; Moos, D.B.; Peska, P.; Ward, C.D.; Wiprut, D.J. Determination of stress orientation and magnitude in deep wells. Int. J. Rock Mech. Min. Sci. 2003, 40, 1049–1076. [Google Scholar] [CrossRef]
- Thorsen, K. In situ stress estimation using borehole failures—Even for inclined stress tensor. J. Pet. Sci. Eng. 2011, 79, 86–100. [Google Scholar] [CrossRef]
- Leeman, E.R. The treatment of stress in rock: I. The rock stress measurement: II. Borehole rock stress measuring instrument: III. The results of some rock stress investigations. J. S. Afr. Inst. Min. Metall. 1964, 65, 254–284. [Google Scholar]
- Cox, J.W. The high resolution dip meter reveals dip-related borehole and formation characteristics. In Proceedings of the Trans 11th SPWLA logging Symposium, Los Angeles, CA, USA, 3–6 May 1970; pp. D1–D26. [Google Scholar]
- Carr, W.J. Summary of Tectonic and Structural Evidence for Stress Orientation at the Nevada Test Site; Open File Report; US Geological Survey: Denver, CO, USA, 1974; pp. 74–176.
- Bell, J.S.; Gough, D.I. Northeast-Southwest compressive stress in Alberta: Evidence from oil wells. Earth Planet. Sci. Lett. 1979, 45, 475–482. [Google Scholar] [CrossRef]
- Zoback, M.D.; Moos, D.L.; Mastin, L.; Anderson, R.N. Wellbore breakout and in-situ stress. J. Geophys. Res. 1985, 90, 5523–5538. [Google Scholar] [CrossRef]
- Mastin, L. The Development of Borehole Breakouts in Sandstone. Master’s Thesis, Stanford University, Stanford, CA, USA, 1984. [Google Scholar]
- Haimson, B.C.; Herrick, C.G. In situ stress evaluation from borehole breakouts experimental studies. In Proceedings of the 26th US Rock Mechanics Symposium, Rapid City, SD, USA, 26–28 June 1985; Balkema: Rotterdam, The Netherlands, 1985; pp. 1207–1218. [Google Scholar]
- Haimson, B.C.; Herrick, C.G. Borehole breakouts-a new tool for estimating in situ stress? In Proceedings of the First International Symposium on Rock Stress and Rock Stress Measurement; Centek Publications: Luleå, Sweden, 1986; pp. 271–281. [Google Scholar]
- Zheng, Z.; Kemeny, J.; Cook, N.G.W. Analysis of borehole breakouts. J. Geophys. Res. 1989, 94, 7171–7182. [Google Scholar] [CrossRef]
- Yuan, S.C.; Harrison, J.P. Modeling breakout and near-well fluid flow of a borehole in an anisotropic stress field. In Proceedings of the 41st ARMA, Golden, CO, USA, 17–21 June 2006. [Google Scholar]
- Haimson, B.C. Micromechanisms of borehole instability leading to breakouts in rocks. Int. J. Mech. Min. Sci. 2007, 44, 157–173. [Google Scholar] [CrossRef]
- Papamichos, E. Borehole failure analysis in a sandstone under anisotropic stresses. Int. J. Numer. Anal. Methods Geomech. 2010, 34, 581–603. [Google Scholar] [CrossRef]
- Cook, B.K.; Lee, M.Y.; Di, G.A.A.; Bronowski, D.R.; Perkins, E.D.; Williams, J.R. Discrete element modeling applied to laboratory simulation of near-wellbore mechanics. Int. J. Geomech. 2004, 4, 19–27. [Google Scholar] [CrossRef]
- Fakhimi, A.; Carvalho, F.; Ishida, T.; Labuz, J.F. Simulation of failure around a circular opening in rock. Int. J. Rock Mech. Min. Sci. 2002, 39, 507–515. [Google Scholar] [CrossRef]
- Lee, H.; Moon, T.; Haimson, B.C. Borehole Breakouts Induced in Arkosic Sandstones and a Discrete Element Analysis. Rock Mech. Rock Eng. 2016, 49, 1369–1388. [Google Scholar] [CrossRef]
- Gomar, M.; Goodarznia, I.; Shadizadeh, S.R. Transient thermo-poroelastic finite element analysis of borehole breakouts. Int. J. Rock Mech. Min. Sci. 2014, 71, 418–428. [Google Scholar] [CrossRef]
- Rahmati, H. Micromechanical Study of Borehole Breakout Mechanism. Ph.D. Thesis, University of Alberta, Edmonton, AB, USA, 2013. [Google Scholar]
- Zoback, M.D. Reservoir Geomechanics; Petroleum Industry Press: Beijing, China, 2012. [Google Scholar]
- Guenot, A. Borehole breakouts and stress fields. Int. J. Rock Mech. Min. Sci. Geomech. Abstr. 1989, 26, 185–195. [Google Scholar] [CrossRef]
- Haimson, B.C.; Song, I. Laboratory study of borehole breakouts in Cordova Cream: A case of shear failure mechanism. Int. J. Rock Mech. Min. Sci. Geomech. Abstr. 1993, 30, 1047–1056. [Google Scholar] [CrossRef]
- Wang, J.; Deng, J.; Li, B. Numerical Simulation of Borehole Collapse Procedure and Prediction on Well-hole Enlargement. Petrol. Drill. Tech. 2000, 28, 13–14. [Google Scholar]
- Zhang, G.; Chen, M. Correlation between bore hole surrounding rock damage and drilling fluid density. Oil Drill. Prod. Technol. 2002, 24, 31–51. [Google Scholar]
- Zhang, G.; Chen, M. Three-dimensional finite element model for relationship between wellbore failure and mud density. Petrol. Drill. Technol. 2004, 32, 37–38. [Google Scholar]
- Moos, D.; Wilson, S.; Barton, C.E. Impact of rock properties on the relationship between wellbore breakout width and depth. In Proceedings of the 1stCanada—U.S.Rock Mechanics Symposium, Vancouver, BC, Canada, 27–31 May 2007. [Google Scholar]
- Lee, H.; Chang, C.; Ong, S.H.; Song, I. Effect of anisotropic borehole wall failures when estimating in situ stresses: A case study in the Nankai accretionary wedge. Mar. Pet. Geol. 2013, 48, 411–422. [Google Scholar] [CrossRef]
- Meier, T.; Rybacki, E.; Reinicke, A.; Dresen, G. Influence of borehole diameter on the formation of borehole breakouts in black shale. Int. J. Rock Mech. Min. Sci. 2013, 62, 74–85. [Google Scholar] [CrossRef]
- Exadaktylos, G.E.; Liolios, P.A.; Stavropoulou, M.C. A semi-analytical elastic stress-displacement solution for notched circular openings in rocks. Int. J. Solids Struct. 2003, 40, 1165–1187. [Google Scholar] [CrossRef]
- Zhang, X.; Jeffrey, R.G.; Bunger, A.P.; Thiercelin, M. Initiation and growth of a hydraulic fracture from a circular wellbore. Int. J. Rock Mech. Min. Sci. 2011, 48, 984–995. [Google Scholar] [CrossRef]
- Zhang, X.; Jeffrey, R.G.; Bunger, A.P. Hydraulic fracturing growth from a non-circular wellbore. In Proceedings of the 45th US Rock Mechanics/Geomechanics Symposium, San Francisco, CA, USA, 26–29 June 2011. [Google Scholar]
- Ma, T.; Chen, P.; Yang, C.; Zhao, J. Wellbore stability analysis and well path optimization based on the breakout width model and Mogi-Coulomb criterion. J. Pet. Sci. Eng. 2015, 135, 678–701. [Google Scholar] [CrossRef]
- Krzysztof, S. A new design of support for burst-prone rock mass in underground ore mining. In Proceedings of the E3S Web of Conferences 71, 00006, 2018; XVIII Conference of PhD Students and Young Scientists, Szklarska Poreba, Poland, 22–25 May 2018. [Google Scholar]
- Varahanaresh, S.; Ahmad, G. Effect of rock anisotropy on wellbore stresses and hydraulic fracture propagation. Int. J. Rock Mech. Min. Sci. 2018, 112, 369–384. [Google Scholar]
- Al-Ajmi, A.M.; Zimmerman, R.W. A new well path optimization model for increased mechanical borehole stability. J. Pet. Sci. Eng. 2009, 69, 53–62. [Google Scholar] [CrossRef]
- Chen, Z.; Zhang, H.; Shen, B.; Yin, G.; Wang, X. A study on safe and dangerous drilling azimuths of horizontal well. Acta Pet. Sin. 2013, 34, 164–168. [Google Scholar]
- Qi, B.; Chen, P.; Xia, H.; Wei, C. Optimizing the Method Used to Design the Trajectory of a Horizontal Well. Chem. Technol. Fuels Oil. 2014, 50, 337–343. [Google Scholar]
- Aadnoy, B.S.; Looyeh, R. Petroleum Rock Mechanics: Drilling Operations and Well Design, 1st ed.; Gulf Professional Publishing: Oxford, UK, 2011. [Google Scholar]
- Yin, S. Geomechanics—Reservoir Modeling by Displacement Discontinuity—Finite Element Method; University of Waterloo: Waterloo, ON, Canada, 2008. [Google Scholar]


| Parameter | Value |
|---|---|
| Young’s Modulus, (GPa) | 14.4 |
| Poisson Ratio, | 0.2 |
| Cohesion, (MPa) | 20 |
| Inner friction angle, (°) | 40 |
| Radius of borehole, (m) | 0.15 |
| Vertical stress, (MPa) | 40 |
| Mud pressure, (MPa) | 20 |
| Tensile strength, (MPa) | 5 |
| Maximum principal stress, (MPa) | 95–150 |
| Maximum principal stress, (MPa) | 50–85 |
| Test# | Test# | Test# | Test# | ||||||||
|---|---|---|---|---|---|---|---|---|---|---|---|
| 1 | 95 | 80 | 23 | 110 | 85 | 45 | 120 | 55 | 67 | 135 | 65 |
| 2 | 95 | 75 | 24 | 110 | 80 | 46 | 120 | 50 | 68 | 135 | 60 |
| 3 | 95 | 70 | 25 | 110 | 75 | 47 | 125 | 85 | 69 | 135 | 55 |
| 4 | 95 | 65 | 26 | 110 | 70 | 48 | 125 | 80 | 70 | 140 | 85 |
| 5 | 95 | 60 | 27 | 110 | 65 | 49 | 125 | 75 | 71 | 140 | 80 |
| 6 | 95 | 55 | 28 | 110 | 60 | 50 | 125 | 70 | 72 | 140 | 75 |
| 7 | 95 | 50 | 29 | 110 | 55 | 51 | 125 | 65 | 73 | 140 | 70 |
| 8 | 100 | 80 | 30 | 110 | 50 | 52 | 125 | 60 | 74 | 140 | 65 |
| 9 | 100 | 75 | 31 | 115 | 85 | 53 | 125 | 55 | 75 | 140 | 60 |
| 10 | 100 | 70 | 32 | 115 | 80 | 54 | 125 | 50 | 76 | 140 | 55 |
| 11 | 100 | 65 | 33 | 115 | 75 | 55 | 130 | 85 | 77 | 145 | 85 |
| 12 | 100 | 60 | 34 | 115 | 70 | 56 | 130 | 80 | 78 | 145 | 80 |
| 13 | 100 | 55 | 35 | 115 | 65 | 57 | 130 | 75 | 79 | 145 | 75 |
| 14 | 100 | 50 | 36 | 115 | 60 | 58 | 130 | 70 | 80 | 145 | 70 |
| 15 | 105 | 85 | 37 | 115 | 55 | 59 | 130 | 65 | 81 | 145 | 65 |
| 16 | 105 | 80 | 38 | 115 | 50 | 60 | 130 | 60 | 82 | 145 | 60 |
| 17 | 105 | 75 | 39 | 120 | 85 | 61 | 130 | 55 | 83 | 150 | 85 |
| 18 | 105 | 70 | 40 | 120 | 80 | 62 | 130 | 50 | 84 | 150 | 80 |
| 19 | 105 | 65 | 41 | 120 | 75 | 63 | 135 | 85 | 85 | 150 | 75 |
| 20 | 105 | 60 | 42 | 120 | 70 | 64 | 135 | 80 | 86 | 150 | 70 |
| 21 | 105 | 55 | 43 | 120 | 65 | 65 | 135 | 75 | 87 | 150 | 65 |
| 22 | 105 | 50 | 44 | 120 | 60 | 66 | 135 | 70 | 88 | 150 | 60 |
| Test# | Test# | Test# | Test# | ||||
|---|---|---|---|---|---|---|---|
| 1 | 2.5 | 23 | 24.5 | 45 | 49.7 | 67 | 67.8 |
| 2 | 6.9 | 24 | 27.8 | 46 | 50.4 | 68 | 68.3 |
| 3 | 9.9 | 25 | 30.4 | 47 | 52.2 | 69 | 68.7 |
| 4 | 12.7 | 26 | 32.5 | 48 | 52.9 | 70 | 77.5 |
| 5 | 15 | 27 | 33.7 | 49 | 53.8 | 71 | 76.5 |
| 6 | 17.2 | 28 | 35.6 | 50 | 54.1 | 72 | 75.9 |
| 7 | 19 | 29 | 36.9 | 51 | 54.8 | 73 | 75.1 |
| 8 | 10 | 30 | 38.6 | 52 | 55.1 | 74 | 74.8 |
| 9 | 14.4 | 31 | 34.1 | 53 | 55.9 | 75 | 74.4 |
| 10 | 17.5 | 32 | 36.4 | 54 | 56.6 | 76 | 74.6 |
| 11 | 19.7 | 33 | 38.2 | 55 | 60.6 | 77 | 85.4 |
| 12 | 22 | 34 | 39.3 | 56 | 61.3 | 78 | 83.8 |
| 13 | 23.8 | 35 | 41.1 | 57 | 60.9 | 79 | 83.1 |
| 14 | 25.5 | 36 | 42.2 | 58 | 61.2 | 80 | 81.8 |
| 15 | 14 | 37 | 43.2 | 59 | 61.5 | 81 | 81.6 |
| 16 | 18.9 | 38 | 44.2 | 60 | 61.9 | 82 | 81.2 |
| 17 | 22.2 | 39 | 43.8 | 61 | 61.8 | 83 | 93.1 |
| 18 | 25.1 | 40 | 44.7 | 62 | 62.5 | 84 | 91 |
| 19 | 27.1 | 41 | 45.8 | 63 | 69.3 | 85 | 90.2 |
| 20 | 28.8 | 42 | 47.1 | 64 | 68.8 | 86 | 88.9 |
| 21 | 30.4 | 43 | 47.7 | 65 | 68.3 | 87 | 87.9 |
| 22 | 31.8 | 44 | 48.9 | 66 | 68.3 | 88 | 87.3 |
| Test# | Analytic | Numeric | Err % | Test# | Analytic | Numeric | Err % | Test# | Analytic | Numeric | Err % | Test# | Analytic | Numeric | Err % |
|---|---|---|---|---|---|---|---|---|---|---|---|---|---|---|---|
| 1 | 20.3 | 19.6 | −3.4 | 23 | 43.4 | 43.4 | −0.1 | 45 | 40 | 41.4 | 3.6 | 67 | 45.5 | 46.7 | 2.8 |
| 2 | 23 | 23.5 | 2.1 | 24 | 41.3 | 41.7 | 1.1 | 46 | 39.3 | 40.8 | 3.9 | 68 | 44.5 | 45.9 | 3.1 |
| 3 | 24.5 | 25.3 | 3.1 | 25 | 39.7 | 40.5 | 1.8 | 47 | 49.4 | 50.2 | 1.6 | 69 | 43.6 | 45.1 | 3.5 |
| 4 | 25.5 | 26.4 | 3.7 | 26 | 38.6 | 39.5 | 2.5 | 48 | 47.3 | 48.2 | 2 | 70 | 52.2 | 53.2 | 2.1 |
| 5 | 26.2 | 27.3 | 4.2 | 27 | 37.7 | 38.8 | 3.1 | 49 | 45.6 | 46.6 | 2.2 | 71 | 50.3 | 51.5 | 2.3 |
| 6 | 26.7 | 27.9 | 4.6 | 28 | 36.9 | 38.2 | 3.4 | 50 | 44.3 | 45.4 | 2.6 | 72 | 48.8 | 50 | 2.4 |
| 7 | 27.1 | 28.3 | 4.7 | 29 | 36.3 | 37.7 | 3.8 | 51 | 43.1 | 44.4 | 2.9 | 73 | 47.5 | 48.8 | 2.6 |
| 8 | 31.8 | 31.3 | −1.8 | 30 | 35.8 | 37.3 | 4.2 | 52 | 42.2 | 43.5 | 3.1 | 74 | 46.4 | 47.8 | 3 |
| 9 | 31.5 | 31.9 | 1.5 | 31 | 46.1 | 46.5 | 0.9 | 53 | 41.4 | 42.8 | 3.5 | 75 | 45.4 | 46.8 | 3.1 |
| 10 | 31.2 | 32.1 | 2.8 | 32 | 43.9 | 44.5 | 1.5 | 54 | 40.6 | 42.2 | 3.9 | 76 | 44.5 | 46 | 3.4 |
| 11 | 31 | 32.1 | 3.5 | 33 | 42.2 | 43 | 2 | 55 | 50.5 | 51.4 | 1.8 | 77 | 52.8 | 54 | 2.2 |
| 12 | 30.9 | 32.2 | 4 | 34 | 40.9 | 42 | 2.6 | 56 | 48.5 | 49.5 | 2 | 78 | 51 | 52.2 | 2.3 |
| 13 | 30.8 | 32.1 | 4.3 | 35 | 39.9 | 41 | 2.9 | 57 | 46.9 | 48 | 2.4 | 79 | 49.6 | 50.8 | 2.6 |
| 14 | 30.7 | 32.1 | 4.6 | 36 | 39 | 40.3 | 3.2 | 58 | 45.5 | 46.7 | 2.5 | 80 | 48.3 | 49.6 | 2.7 |
| 15 | 39.4 | 38.9 | −1.3 | 37 | 38.3 | 39.7 | 3.7 | 59 | 44.4 | 45.7 | 2.9 | 81 | 47.2 | 48.6 | 2.9 |
| 16 | 37.6 | 37.7 | 0.2 | 38 | 37.7 | 39.3 | 4.1 | 60 | 43.4 | 44.8 | 3.2 | 82 | 46.2 | 47.7 | 3.2 |
| 17 | 36.4 | 37 | 1.6 | 39 | 48 | 48.6 | 1.4 | 61 | 42.6 | 44 | 3.4 | 83 | 53.3 | 54.5 | 2.2 |
| 18 | 35.5 | 36.4 | 2.5 | 40 | 45.8 | 46.6 | 1.7 | 62 | 41.8 | 43.4 | 3.7 | 84 | 51.7 | 52.9 | 2.3 |
| 19 | 34.8 | 36 | 3.3 | 41 | 44.1 | 45.1 | 2.2 | 63 | 51.4 | 52.4 | 1.9 | 85 | 50.2 | 51.5 | 2.6 |
| 20 | 34.3 | 35.6 | 3.8 | 42 | 42.8 | 43.8 | 2.5 | 64 | 49.5 | 50.6 | 2.2 | 86 | 49 | 50.3 | 2.7 |
| 21 | 33.9 | 35.3 | 4.1 | 43 | 41.7 | 42.9 | 2.8 | 65 | 47.9 | 49.1 | 2.3 | 87 | 47.9 | 49.3 | 2.9 |
| 22 | 33.6 | 35 | 4.4 | 44 | 40.7 | 42.1 | 3.3 | 66 | 46.6 | 47.9 | 2.7 | 88 | 46.9 | 48.4 | 3.2 |
| Test# | E300 | E450 | E600 | Test# | E300 | E450 | E600 | Test# | E300 | E450 | E600 | Test# | E300 | E450 | E600 |
|---|---|---|---|---|---|---|---|---|---|---|---|---|---|---|---|
| 1 | 1.2 | 2.5 | 2.6 | 23 | 19.9 | 24.5 | 25 | 45 | 45.8 | 49.7 | 51 | 67 | 63.3 | 67.8 | 70.9 |
| 2 | 4.1 | 6.9 | 6.6 | 24 | 24.3 | 27.8 | 28.2 | 46 | 46.6 | 50.4 | 52.1 | 68 | 63 | 68.3 | 70 |
| 3 | 8.2 | 9.9 | 9.5 | 25 | 26.9 | 30.4 | 30.8 | 47 | 47.2 | 52.2 | 54.4 | 69 | 63.2 | 68.7 | 70 |
| 4 | 10.9 | 12.7 | 12.3 | 26 | 28.9 | 32.5 | 33.2 | 48 | 47.5 | 52.9 | 54.3 | 70 | 70.1 | 77.5 | 79.7 |
| 5 | 13.5 | 15 | 14.6 | 27 | 30.9 | 33.7 | 34.8 | 49 | 48.7 | 53.8 | 54.9 | 71 | 69.6 | 76.5 | 78.6 |
| 6 | 15.5 | 17.2 | 17 | 28 | 32.6 | 35.6 | 36.4 | 50 | 49.6 | 54.1 | 55.3 | 72 | 69.4 | 75.9 | 77.9 |
| 7 | 17.7 | 19 | 19 | 29 | 33.8 | 36.9 | 37.8 | 51 | 50.1 | 54.8 | 56 | 73 | 68.8 | 75.1 | 77.4 |
| 8 | 7.4 | 10 | 10.4 | 30 | 35.2 | 38.6 | 39.3 | 52 | 50.8 | 55.1 | 56.8 | 74 | 68.6 | 74.8 | 78 |
| 9 | 12 | 14.4 | 14.5 | 31 | 29.8 | 34.1 | 35 | 53 | 51.6 | 55.9 | 57.6 | 75 | 68.9 | 74.4 | 77.9 |
| 10 | 15.3 | 17.5 | 17.4 | 32 | 31.9 | 36.4 | 37.3 | 54 | 52.2 | 56.6 | 58.1 | 76 | 68.8 | 74.6 | 78.1 |
| 11 | 18 | 19.7 | 20.3 | 33 | 34.4 | 38.2 | 39.1 | 55 | 54.7 | 60.6 | 63.2 | 77 | 77.5 | 85.4 | 87.9 |
| 12 | 19.8 | 22 | 22 | 34 | 36 | 39.3 | 40.5 | 56 | 55.4 | 61.3 | 63.1 | 78 | 76.7 | 83.8 | 86.5 |
| 13 | 22 | 23.8 | 23.8 | 35 | 37.5 | 41.1 | 42 | 57 | 55.5 | 60.9 | 63.2 | 79 | 75.9 | 83.1 | 85.1 |
| 14 | 23.6 | 25.5 | 25.8 | 36 | 38.6 | 42.2 | 43.3 | 58 | 56 | 61.2 | 62.9 | 80 | 75.4 | 81.8 | 84.6 |
| 15 | 10 | 14 | 14.7 | 37 | 39.8 | 43.2 | 44.5 | 59 | 56.6 | 61.5 | 63 | 81 | 74.8 | 81.6 | 84.1 |
| 16 | 16.5 | 18.9 | 19.8 | 38 | 40.8 | 44.2 | 45.6 | 60 | 57.1 | 61.9 | 63.2 | 82 | 74.8 | 81.2 | 83.6 |
| 17 | 20 | 22.2 | 23.1 | 39 | 38.4 | 43.8 | 44.7 | 61 | 57.4 | 61.8 | 63.9 | 83 | 85.1 | 93.1 | 95.8 |
| 18 | 22.6 | 25.1 | 25.6 | 40 | 40.3 | 44.7 | 46.4 | 62 | 58 | 62.5 | 64.5 | 84 | 83.3 | 91 | 93.7 |
| 19 | 24.5 | 27.1 | 27.4 | 41 | 41.7 | 45.8 | 46.9 | 63 | 62.6 | 69.3 | 71 | 85 | 82.4 | 90.2 | 93 |
| 20 | 26.5 | 28.8 | 29.4 | 42 | 42.9 | 47.1 | 48.3 | 64 | 62.5 | 68.8 | 70.9 | 86 | 81.6 | 88.9 | 91.8 |
| 21 | 28.1 | 30.4 | 31.1 | 43 | 43.9 | 47.7 | 49.1 | 65 | 62.3 | 68.3 | 71.2 | 87 | 80.7 | 87.9 | 90.4 |
| 22 | 29.7 | 31.8 | 32.6 | 44 | 44.8 | 48.9 | 50.1 | 66 | 62.6 | 68.3 | 70.9 | 88 | 82.8 | 87.3 | 90.2 |
| Test# | E300/E600 | E450/E600 | Test# | E300/E600 | E450/E600 | Test# | E300/E600 | E450/E600 | Test# | E300/E600 | E450/E600 |
|---|---|---|---|---|---|---|---|---|---|---|---|
| 1 | 0.462 | 0.955 | 23 | 0.793 | 0.98 | 45 | 0.898 | 0.973 | 67 | 0.892 | 0.956 |
| 2 | 0.622 | 1.041 | 24 | 0.861 | 0.986 | 46 | 0.895 | 0.968 | 68 | 0.9 | 0.977 |
| 3 | 0.865 | 1.035 | 25 | 0.871 | 0.985 | 47 | 0.867 | 0.959 | 69 | 0.903 | 0.981 |
| 4 | 0.891 | 1.033 | 26 | 0.871 | 0.978 | 48 | 0.875 | 0.975 | 70 | 0.879 | 0.972 |
| 5 | 0.929 | 1.03 | 27 | 0.888 | 0.968 | 49 | 0.888 | 0.981 | 71 | 0.886 | 0.974 |
| 6 | 0.914 | 1.016 | 28 | 0.896 | 0.978 | 50 | 0.897 | 0.979 | 72 | 0.891 | 0.975 |
| 7 | 0.931 | 1.001 | 29 | 0.893 | 0.976 | 51 | 0.895 | 0.978 | 73 | 0.889 | 0.971 |
| 8 | 0.714 | 0.961 | 30 | 0.896 | 0.982 | 52 | 0.894 | 0.97 | 74 | 0.88 | 0.959 |
| 9 | 0.826 | 0.995 | 31 | 0.849 | 0.974 | 53 | 0.896 | 0.972 | 75 | 0.884 | 0.955 |
| 10 | 0.878 | 1.004 | 32 | 0.855 | 0.977 | 54 | 0.898 | 0.974 | 76 | 0.882 | 0.956 |
| 11 | 0.887 | 0.974 | 33 | 0.882 | 0.978 | 55 | 0.866 | 0.959 | 77 | 0.882 | 0.972 |
| 12 | 0.903 | 1.003 | 34 | 0.888 | 0.97 | 56 | 0.877 | 0.971 | 78 | 0.887 | 0.968 |
| 13 | 0.923 | 0.998 | 35 | 0.891 | 0.978 | 57 | 0.879 | 0.964 | 79 | 0.892 | 0.976 |
| 14 | 0.914 | 0.989 | 36 | 0.891 | 0.976 | 58 | 0.89 | 0.974 | 80 | 0.892 | 0.967 |
| 15 | 0.68 | 0.952 | 37 | 0.896 | 0.972 | 59 | 0.898 | 0.976 | 81 | 0.89 | 0.971 |
| 16 | 0.835 | 0.955 | 38 | 0.894 | 0.97 | 60 | 0.904 | 0.979 | 82 | 0.895 | 0.971 |
| 17 | 0.867 | 0.962 | 39 | 0.858 | 0.979 | 61 | 0.899 | 0.967 | 83 | 0.888 | 0.972 |
| 18 | 0.884 | 0.98 | 40 | 0.868 | 0.964 | 62 | 0.9 | 0.969 | 84 | 0.888 | 0.97 |
| 19 | 0.895 | 0.99 | 41 | 0.889 | 0.978 | 63 | 0.882 | 0.976 | 85 | 0.886 | 0.97 |
| 20 | 0.901 | 0.978 | 42 | 0.887 | 0.974 | 64 | 0.88 | 0.97 | 86 | 0.889 | 0.968 |
| 21 | 0.902 | 0.975 | 43 | 0.894 | 0.972 | 65 | 0.875 | 0.96 | 87 | 0.892 | 0.973 |
| 22 | 0.91 | 0.975 | 44 | 0.896 | 0.976 | 66 | 0.882 | 0.963 | 88 | 0.917 | 0.967 |
| Test# | Analytic | E300 | E450 | E600 | Test# | Analytic | E300 | E450 | E600 | Test# | Analytic | E300 | E450 | E600 |
|---|---|---|---|---|---|---|---|---|---|---|---|---|---|---|
| 1 | 20.3 | 15.5 | 19.6 | 19.7 | 31 | 46.1 | 45.7 | 46.5 | 46.1 | 61 | 42.6 | 44.4 | 44 | 43.6 |
| 2 | 23 | 21 | 23.5 | 22.9 | 32 | 43.9 | 44.1 | 44.5 | 44.1 | 62 | 41.8 | 43.7 | 43.4 | 43 |
| 3 | 24.5 | 24.4 | 25.3 | 24.8 | 33 | 42.2 | 42.8 | 43 | 42.6 | 63 | 51.4 | 52.5 | 52.4 | 52 |
| 4 | 25.5 | 26.5 | 26.4 | 26 | 34 | 40.9 | 41.8 | 42 | 41.5 | 64 | 49.5 | 50.7 | 50.6 | 50.2 |
| 5 | 26.2 | 27.5 | 27.3 | 26.9 | 35 | 39.9 | 41.1 | 41 | 40.6 | 65 | 47.9 | 49.4 | 49.1 | 48.7 |
| 6 | 26.7 | 28.2 | 27.9 | 27.5 | 36 | 39 | 40.5 | 40.3 | 39.9 | 66 | 46.6 | 48 | 47.9 | 47.4 |
| 7 | 27.1 | 28.8 | 28.3 | 28 | 37 | 38.3 | 39.9 | 39.7 | 39.3 | 67 | 45.5 | 47 | 46.7 | 46.4 |
| 8 | 31.8 | 28.2 | 31.3 | 31.1 | 38 | 37.7 | 39.4 | 39.3 | 38.8 | 68 | 44.5 | 46.2 | 45.9 | 45.5 |
| 9 | 31.5 | 30.9 | 31.9 | 31.4 | 39 | 48 | 48.2 | 48.6 | 48.1 | 69 | 43.6 | 45.5 | 45.1 | 44.8 |
| 10 | 31.2 | 31.7 | 32.1 | 31.5 | 40 | 45.8 | 46.4 | 46.6 | 46.1 | 70 | 52.2 | 53.4 | 53.2 | 52.8 |
| 11 | 31 | 32 | 32.1 | 31.6 | 41 | 44.1 | 45.1 | 45.1 | 44.6 | 71 | 50.3 | 51.6 | 51.5 | 51 |
| 12 | 30.9 | 32.2 | 32.2 | 31.6 | 42 | 42.8 | 43.9 | 43.8 | 43.4 | 72 | 48.8 | 50.3 | 50 | 49.6 |
| 13 | 30.8 | 32.4 | 32.1 | 31.7 | 43 | 41.7 | 42.9 | 42.9 | 42.5 | 73 | 47.5 | 49.1 | 48.8 | 48.4 |
| 14 | 30.7 | 32.5 | 32.1 | 31.8 | 44 | 40.7 | 42.2 | 42.1 | 41.6 | 74 | 46.4 | 48 | 47.8 | 47.4 |
| 15 | 39.4 | 35.7 | 38.9 | 38.8 | 45 | 40 | 41.6 | 41.4 | 41 | 75 | 45.4 | 47.1 | 46.8 | 46.4 |
| 16 | 37.6 | 36.8 | 37.7 | 37.6 | 46 | 39.3 | 41.1 | 40.8 | 40.5 | 76 | 44.5 | 46.4 | 46 | 45.7 |
| 17 | 36.4 | 36.6 | 37 | 36.6 | 47 | 49.4 | 50.1 | 50.2 | 49.8 | 77 | 52.8 | 54.2 | 54 | 53.5 |
| 18 | 35.5 | 36.3 | 36.4 | 36 | 48 | 47.3 | 48.2 | 48.2 | 47.8 | 78 | 51 | 52.5 | 52.2 | 51.8 |
| 19 | 34.8 | 36 | 36 | 35.6 | 49 | 45.6 | 46.7 | 46.6 | 46.2 | 79 | 49.6 | 51.1 | 50.8 | 50.4 |
| 20 | 34.3 | 35.8 | 35.6 | 35.2 | 50 | 44.3 | 45.6 | 45.4 | 45 | 80 | 48.3 | 50 | 49.6 | 49.2 |
| 21 | 33.9 | 35.6 | 35.3 | 34.9 | 51 | 43.1 | 44.6 | 44.4 | 44 | 81 | 47.2 | 49 | 48.6 | 48.2 |
| 22 | 33.6 | 35.4 | 35 | 34.7 | 52 | 42.2 | 43.7 | 43.5 | 43.1 | 82 | 46.2 | 48 | 47.7 | 47.3 |
| 23 | 43.4 | 41.8 | 43.4 | 43.2 | 53 | 41.4 | 43 | 42.8 | 42.4 | 83 | 53.3 | 54.8 | 54.5 | 54.1 |
| 24 | 41.3 | 40.9 | 41.7 | 41.4 | 54 | 40.6 | 42.4 | 42.2 | 41.8 | 84 | 51.7 | 53.2 | 52.9 | 52.5 |
| 25 | 39.7 | 40.1 | 40.5 | 40.1 | 55 | 50.5 | 51.4 | 51.4 | 51 | 85 | 50.2 | 51.8 | 51.5 | 51.1 |
| 26 | 38.6 | 39.3 | 39.5 | 39.1 | 56 | 48.5 | 49.6 | 49.5 | 49.1 | 86 | 49 | 50.7 | 50.3 | 49.9 |
| 27 | 37.7 | 38.7 | 38.8 | 38.4 | 57 | 46.9 | 48.1 | 48 | 47.6 | 87 | 47.9 | 49.8 | 49.3 | 48.9 |
| 28 | 36.9 | 38.2 | 38.2 | 37.8 | 58 | 45.5 | 46.9 | 46.7 | 46.3 | 88 | 46.9 | 49.2 | 48.4 | 48 |
| 29 | 36.3 | 37.8 | 37.7 | 37.3 | 59 | 44.4 | 45.9 | 45.7 | 45.3 | - | - | - | - | - |
| 30 | 35.8 | 37.5 | 37.3 | 37 | 60 | 43.4 | 45.2 | 44.8 | 44.4 | - | - | - | - | - |
| Test# | E300 | E450 | E600 | Test# | E300 | E450 | E600 | Test# | E300 | E450 | E600 | Test# | E300 | E450 | E600 |
|---|---|---|---|---|---|---|---|---|---|---|---|---|---|---|---|
| 1 | −24 | −3.4 | −2.9 | 23 | −3.6 | −0.1 | −0.6 | 45 | 4.1 | 3.6 | 2.6 | 67 | 3.4 | 2.8 | 2 |
| 2 | −8.9 | 2.1 | −0.4 | 24 | −0.8 | 1.1 | 0.2 | 46 | 4.7 | 3.9 | 3 | 68 | 3.8 | 3.1 | 2.3 |
| 3 | −0.5 | 3.1 | 1.1 | 25 | 0.8 | 1.8 | 0.8 | 47 | 1.3 | 1.6 | 0.8 | 69 | 4.3 | 3.5 | 2.7 |
| 4 | 3.9 | 3.7 | 2 | 26 | 1.8 | 2.5 | 1.3 | 48 | 1.8 | 2 | 1 | 70 | 2.4 | 2.1 | 1.2 |
| 5 | 5 | 4.2 | 2.7 | 27 | 2.6 | 3.1 | 1.9 | 49 | 2.3 | 2.2 | 1.3 | 71 | 2.6 | 2.3 | 1.4 |
| 6 | 5.8 | 4.6 | 3.2 | 28 | 3.3 | 3.4 | 2.3 | 50 | 2.9 | 2.6 | 1.7 | 72 | 3 | 2.4 | 1.6 |
| 7 | 6.5 | 4.7 | 3.5 | 29 | 4 | 3.8 | 2.7 | 51 | 3.4 | 2.9 | 1.9 | 73 | 3.4 | 2.6 | 1.8 |
| 8 | −11.4 | −1.8 | −2.2 | 30 | 4.6 | 4.2 | 3.1 | 52 | 3.7 | 3.1 | 2.3 | 74 | 3.5 | 3 | 2.1 |
| 9 | −1.9 | 1.5 | −0.2 | 31 | −0.8 | 0.9 | 0 | 53 | 4 | 3.5 | 2.6 | 75 | 3.8 | 3.1 | 2.3 |
| 10 | 1.5 | 2.8 | 0.9 | 32 | 0.5 | 1.5 | 0.5 | 54 | 4.4 | 3.9 | 2.8 | 76 | 4.1 | 3.4 | 2.5 |
| 11 | 3.1 | 3.5 | 1.7 | 33 | 1.4 | 2 | 1 | 55 | 1.7 | 1.8 | 0.9 | 77 | 2.7 | 2.2 | 1.4 |
| 12 | 4.3 | 4 | 2.3 | 34 | 2.2 | 2.6 | 1.4 | 56 | 2.3 | 2 | 1.2 | 78 | 2.8 | 2.3 | 1.5 |
| 13 | 5.1 | 4.3 | 2.8 | 35 | 3 | 2.9 | 1.9 | 57 | 2.6 | 2.4 | 1.4 | 79 | 3 | 2.6 | 1.7 |
| 14 | 5.8 | 4.6 | 3.3 | 36 | 3.8 | 3.2 | 2.3 | 58 | 2.9 | 2.5 | 1.7 | 80 | 3.5 | 2.7 | 1.9 |
| 15 | −9.4 | −1.3 | −1.6 | 37 | 4.2 | 3.7 | 2.6 | 59 | 3.4 | 2.9 | 2 | 81 | 3.8 | 2.9 | 2.1 |
| 16 | −2.3 | 0.2 | −0.1 | 38 | 4.6 | 4.1 | 3 | 60 | 4 | 3.2 | 2.2 | 82 | 3.9 | 3.2 | 2.4 |
| 17 | 0.5 | 1.6 | 0.6 | 39 | 0.5 | 1.4 | 0.3 | 61 | 4.3 | 3.4 | 2.5 | 83 | 2.7 | 2.2 | 1.5 |
| 18 | 2.2 | 2.5 | 1.4 | 40 | 1.3 | 1.7 | 0.7 | 62 | 4.5 | 3.7 | 2.9 | 84 | 3 | 2.3 | 1.6 |
| 19 | 3.4 | 3.3 | 2.1 | 41 | 2.2 | 2.2 | 1.2 | 63 | 2 | 1.9 | 1.1 | 85 | 3.1 | 2.6 | 1.7 |
| 20 | 4.3 | 3.8 | 2.5 | 42 | 2.6 | 2.5 | 1.5 | 64 | 2.4 | 2.2 | 1.3 | 86 | 3.4 | 2.7 | 1.9 |
| 21 | 4.9 | 4.1 | 2.9 | 43 | 3 | 2.8 | 1.9 | 65 | 3 | 2.3 | 1.5 | 87 | 3.9 | 2.9 | 2.1 |
| 22 | 5.5 | 4.4 | 3.3 | 44 | 3.5 | 3.3 | 2.2 | 66 | 3.1 | 2.7 | 1.8 | 88 | 4.7 | 3.2 | 2.3 |
| Element | Iteration1 | Iteration2 | Iteration3 | |||||||||
| σ1 | σ2 | σ3 | F | σ1 | σ2 | σ3 | F | σ1 | σ2 | σ3 | F | |
| 1 | 197.2 | 53.5 | 30.6 | 1.045 | 216.8 | 58.4 | 35.2 | 1.047 | 241.2 | 64.8 | 42.7 | 1.04 |
| 2 | 196.5 | 53.4 | 30.5 | 1.044 | 214.9 | 57.9 | 34.9 | 1.046 | 236.1 | 63.6 | 41.7 | 1.024 |
| 3 | 195.3 | 53.1 | 30.3 | 1.043 | 211.5 | 57.2 | 34.4 | 1.043 | 227.1 | 61.4 | 40 | 1.018 |
| 4 | 193.4 | 52.7 | 30.1 | 1.041 | 206.7 | 56.1 | 33.6 | 1.039 | 214.3 | 58.4 | 37.5 | 1.009 |
| 5 | 191 | 52.1 | 29.8 | 1.038 | 200.2 | 54.6 | 32.6 | 1.032 | 198.1 | 54.5 | 34.4 | 1.001 |
| 6 | 187.9 | 51.5 | 29.4 | 1.034 | 192.1 | 52.7 | 31.4 | 1.024 | 179.1 | 49.9 | 30.3 | 0.997 |
| 7 | 184.3 | 50.6 | 28.9 | 1.029 | 182.3 | 50.4 | 29.8 | 1.015 | 162.3 | 45.7 | 26.4 | 0.992 |
| 8 | 180.1 | 49.7 | 28.4 | 1.023 | 170.8 | 47.7 | 27.7 | 1.004 | 150.2 | 42.8 | 23.7 | 0.981 |
| 9 | 175.4 | 48.6 | 27.8 | 1.016 | 159.2 | 44.9 | 25.5 | 0.994 | 141.9 | 40.9 | 22.4 | 0.967 |
| 10 | 170.2 | 47.5 | 27.3 | 1.008 | 149.5 | 42.6 | 23.6 | 0.985 | 136 | 39.6 | 21.8 | 0.954 |
| Element | Iteration4 | Iteration5 | Iteration6 | |||||||||
| σ1 | σ2 | σ3 | F | σ1 | σ2 | σ3 | F | σ1 | σ2 | σ3 | F | |
| 1 | 256.8 | 69.1 | 48.8 | 1.018 | 266.9 | 72.1 | 53.4 | 1.003 | 269.3 | 72.8 | 54.7 | 0.998 |
| 2 | 247.4 | 66.8 | 46.7 | 1.015 | 251.7 | 68.3 | 49.7 | 1 | 251.4 | 68.3 | 50 | 0.997 |
| 3 | 230.8 | 62.8 | 43 | 1.009 | 227.9 | 62.3 | 43.7 | 0.997 | 226.6 | 62 | 43.4 | 0.997 |
| 4 | 209.7 | 57.6 | 38.3 | 1.002 | 203.1 | 56 | 37 | 0.997 | 202.1 | 55.8 | 36.7 | 0.998 |
| 5 | 186.4 | 51.8 | 32.6 | 0.997 | 180.5 | 50.3 | 31 | 0.997 | 179.9 | 50.1 | 30.8 | 0.997 |
| 6 | 167.1 | 46.9 | 27.6 | 0.995 | 162.9 | 45.9 | 26.4 | 0.995 | 162.4 | 45.7 | 26.3 | 0.995 |
| 7 | 153.4 | 43.6 | 24.3 | 0.99 | 150.2 | 42.8 | 23.7 | 0.987 | 149.8 | 42.7 | 23.6 | 0.986 |
| 8 | 143.4 | 41.2 | 22.6 | 0.977 | 140.8 | 40.6 | 22.2 | 0.973 | 140.5 | 40.5 | 22.2 | 0.972 |
| 9 | 136.5 | 39.7 | 21.8 | 0.963 | 134.5 | 39.2 | 21.6 | 0.957 | 134.2 | 39.2 | 21.6 | 0.957 |
| 10 | 131.6 | 38.6 | 21.4 | 0.949 | 129.9 | 38.3 | 21.3 | 0.943 | 129.7 | 38.2 | 21.3 | 0.943 |
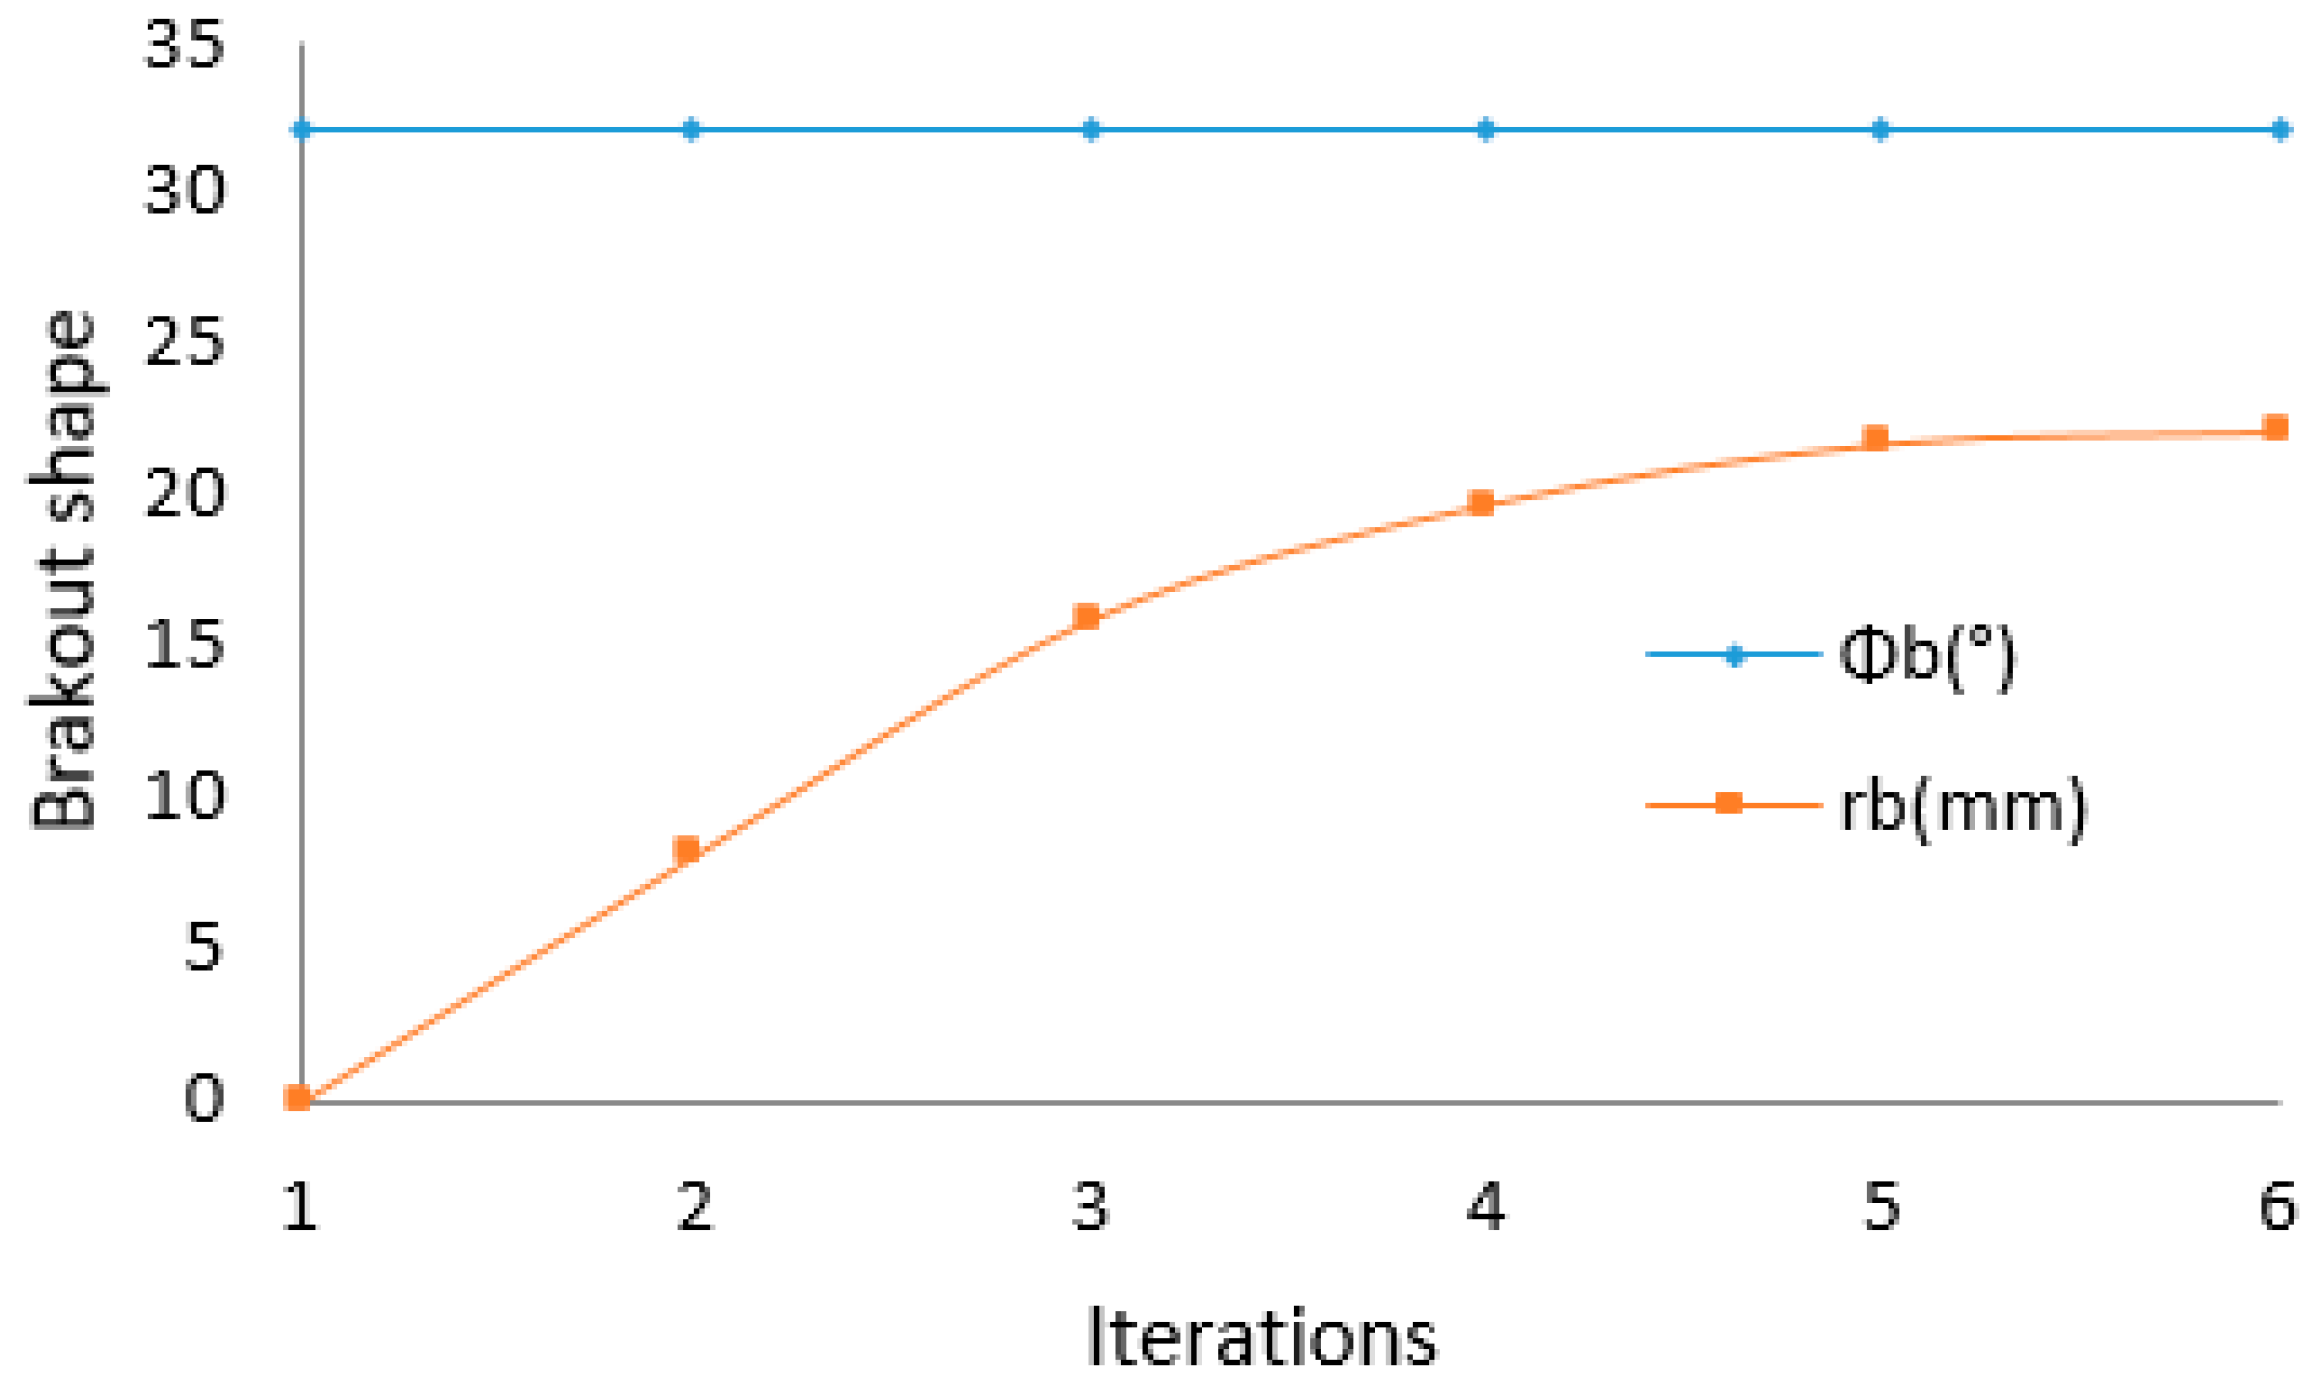
| Iteration | ||
|---|---|---|
| 1 | 32.2 | 0 |
| 2 | 32.2 | 8.2 |
| 3 | 32.2 | 15.9 |
| 4 | 32.2 | 19.7 |
| 5 | 32.2 | 21.7 |
| 6 | 32.2 | 22 |
| Parameter | Value |
|---|---|
| Young’s Modulus, (GPa) | 14.4 |
| Poisson Ratio, | 0.2 |
| Cohesion, (MPa) | 20 |
| Inner friction angle, (°) | 40 |
| Radius of borehole, (m) | 0.15 |
| Vertical stress, (MPa) | 40 |
| Mud pressure, (MPa) | 20 |
| Tensile strength, (MPa) | 5 |
| Maximum principal stress, (MPa) | 85–135 |
| Maximum principal stress, (MPa) | 37–82 |
| Test# | σH (MPa) | σh (MPa) | φb (°) | rb (mm) | Test# | σH (MPa) | σh (MPa) | φb (°) | rb (mm) | Test# | σH (MPa) | σh (MPa) | φb (°) | rb (mm) |
|---|---|---|---|---|---|---|---|---|---|---|---|---|---|---|
| 1 | 134.7 | 81.6 | 50.5 | 65.7 | 25 | 116.6 | 62.2 | 40.7 | 42.3 | 49 | 98.9 | 43 | 31.3 | 25.1 |
| 2 | 138.7 | 79.6 | 50.7 | 71.6 | 26 | 118 | 59.3 | 40.8 | 44.8 | 50 | 98.9 | 41.3 | 31.3 | 25.7 |
| 3 | 142.8 | 77.6 | 50.8 | 77.4 | 27 | 119.4 | 56.5 | 41 | 46.8 | 51 | 95.1 | 68.4 | 24.2 | 9 |
| 4 | 146.9 | 75.6 | 50.9 | 82.9 | 28 | 120.8 | 53.6 | 41.1 | 49.2 | 52 | 94.6 | 64.9 | 24.8 | 10.3 |
| 5 | 151 | 73.7 | 51 | 88.2 | 29 | 122.2 | 50.7 | 41.2 | 51.4 | 53 | 94.2 | 61.4 | 25.1 | 11.7 |
| 6 | 155 | 71.7 | 51.1 | 93.4 | 30 | 122.9 | 49.3 | 41.2 | 52.5 | 54 | 93.8 | 57.9 | 25.2 | 12.9 |
| 7 | 159.1 | 69.7 | 51.2 | 98 | 31 | 104 | 71.3 | 34.6 | 20.9 | 55 | 93.3 | 54.4 | 25.4 | 13.5 |
| 8 | 163.2 | 67.7 | 51.2 | 102.7 | 32 | 104.6 | 68.2 | 35 | 23.1 | 56 | 92.9 | 51 | 25.6 | 14.6 |
| 9 | 167.3 | 65.8 | 51.3 | 107.3 | 33 | 105.2 | 65.1 | 35.3 | 25.6 | 57 | 92.5 | 47.5 | 25.7 | 15.6 |
| 10 | 169.3 | 64.8 | 51.3 | 109.5 | 34 | 105.8 | 61.9 | 35.5 | 27.8 | 58 | 92 | 44 | 25.8 | 16.4 |
| 11 | 120.8 | 76.9 | 45.2 | 44.9 | 35 | 106.4 | 58.8 | 35.7 | 29.4 | 59 | 91.6 | 40.5 | 26 | 17.1 |
| 12 | 123.3 | 74.4 | 45.4 | 48.5 | 36 | 107 | 55.7 | 35.9 | 31.1 | 60 | 91.4 | 38.8 | 26.1 | 17.5 |
| 13 | 125.8 | 71.9 | 45.6 | 52.7 | 37 | 107.6 | 52.5 | 36 | 32.9 | 61 | 92.3 | 67.4 | 19.1 | 5.2 |
| 14 | 128.3 | 69.4 | 45.7 | 56.4 | 38 | 108.2 | 49.4 | 36.1 | 34.5 | 62 | 91.5 | 63.8 | 19.6 | 6.2 |
| 15 | 130.8 | 66.9 | 45.8 | 60.2 | 39 | 108.8 | 46.3 | 36.2 | 35.8 | 63 | 90.8 | 60.3 | 20 | 7.2 |
| 16 | 133.3 | 64.4 | 45.9 | 63.7 | 40 | 109 | 44.7 | 36.3 | 36.7 | 64 | 90 | 56.7 | 20.3 | 8 |
| 17 | 135.8 | 61.9 | 46 | 67.1 | 41 | 98.9 | 69.6 | 29.4 | 13.9 | 65 | 89.3 | 53.1 | 20.5 | 8.9 |
| 18 | 138.3 | 59.4 | 46.1 | 70.3 | 42 | 98.9 | 66.3 | 29.9 | 15.7 | 66 | 88.5 | 49.5 | 20.7 | 9.2 |
| 19 | 140.8 | 56.9 | 46.2 | 73.7 | 43 | 98.9 | 63 | 30.2 | 17.5 | 67 | 87.7 | 45.9 | 20.8 | 9.8 |
| 20 | 142.1 | 55.7 | 46.2 | 75.2 | 44 | 98.9 | 59.6 | 30.5 | 19.1 | 68 | 87 | 42.3 | 20.9 | 10.5 |
| 21 | 111.1 | 73.7 | 39.9 | 30.6 | 45 | 98.9 | 56.3 | 30.7 | 20.3 | 69 | 86.2 | 38.7 | 20.9 | 11.1 |
| 22 | 112.5 | 70.8 | 40.2 | 33.5 | 46 | 98.9 | 53 | 30.9 | 21.7 | 70 | 85.9 | 37 | 21 | 11.4 |
| 23 | 113.9 | 68 | 40.4 | 36.7 | 47 | 98.9 | 49.6 | 31 | 23 | |||||
| 24 | 115.3 | 65.1 | 40.6 | 39.6 | 48 | 98.9 | 46.3 | 31.1 | 23.8 |
| Test# | Circular | Breakout | Test# | Circular | Breakout | Test# | Circular | Breakout |
|---|---|---|---|---|---|---|---|---|
| 1 | 115 | 119 | 25 | 75 | 78.4 | 49 | 35 | 38.6 |
| 2 | 105 | 107.4 | 26 | 65 | 67.8 | 50 | 30 | 33.6 |
| 3 | 95 | 95.3 | 27 | 55 | 57.2 | 51 | 115 | 119 |
| 4 | 85 | 82.8 | 28 | 45 | 46.5 | 52 | 105 | 109 |
| 5 | 75 | 69.7 | 29 | 35 | 35.7 | 53 | 95 | 99 |
| 6 | 65 | 56.2 | 30 | 30 | 30.2 | 54 | 85 | 89 |
| 7 | 55 | 42.4 | 31 | 115 | 119.4 | 55 | 75 | 78.9 |
| 8 | 45 | 28 | 32 | 105 | 109.4 | 56 | 65 | 68.9 |
| 9 | 35 | 13.1 | 33 | 95 | 99.3 | 57 | 55 | 58.9 |
| 10 | 30 | 5.5 | 34 | 85 | 89.2 | 58 | 45 | 48.8 |
| 11 | 115 | 119.8 | 35 | 75 | 79 | 59 | 35 | 38.8 |
| 12 | 105 | 109.2 | 36 | 65 | 68.8 | 60 | 30 | 33.8 |
| 13 | 95 | 98.5 | 37 | 55 | 58.5 | 61 | 115 | 118.9 |
| 14 | 85 | 87.5 | 38 | 45 | 48.3 | 62 | 105 | 108.9 |
| 15 | 75 | 76.3 | 39 | 35 | 37.9 | 63 | 95 | 98.8 |
| 16 | 65 | 65 | 40 | 30 | 32.7 | 64 | 85 | 88.8 |
| 17 | 55 | 53.4 | 41 | 115 | 119.2 | 65 | 75 | 78.8 |
| 18 | 45 | 41.6 | 42 | 105 | 109.2 | 66 | 65 | 68.8 |
| 19 | 35 | 29.6 | 43 | 95 | 99.1 | 67 | 55 | 58.8 |
| 20 | 30 | 23.6 | 44 | 85 | 89.1 | 68 | 45 | 48.8 |
| 21 | 115 | 119.7 | 45 | 75 | 79 | 69 | 35 | 38.7 |
| 22 | 105 | 109.5 | 46 | 65 | 69 | 70 | 30 | 33.7 |
| 23 | 95 | 99.2 | 47 | 55 | 58.9 | |||
| 24 | 85 | 88.8 | 48 | 45 | 48.8 |
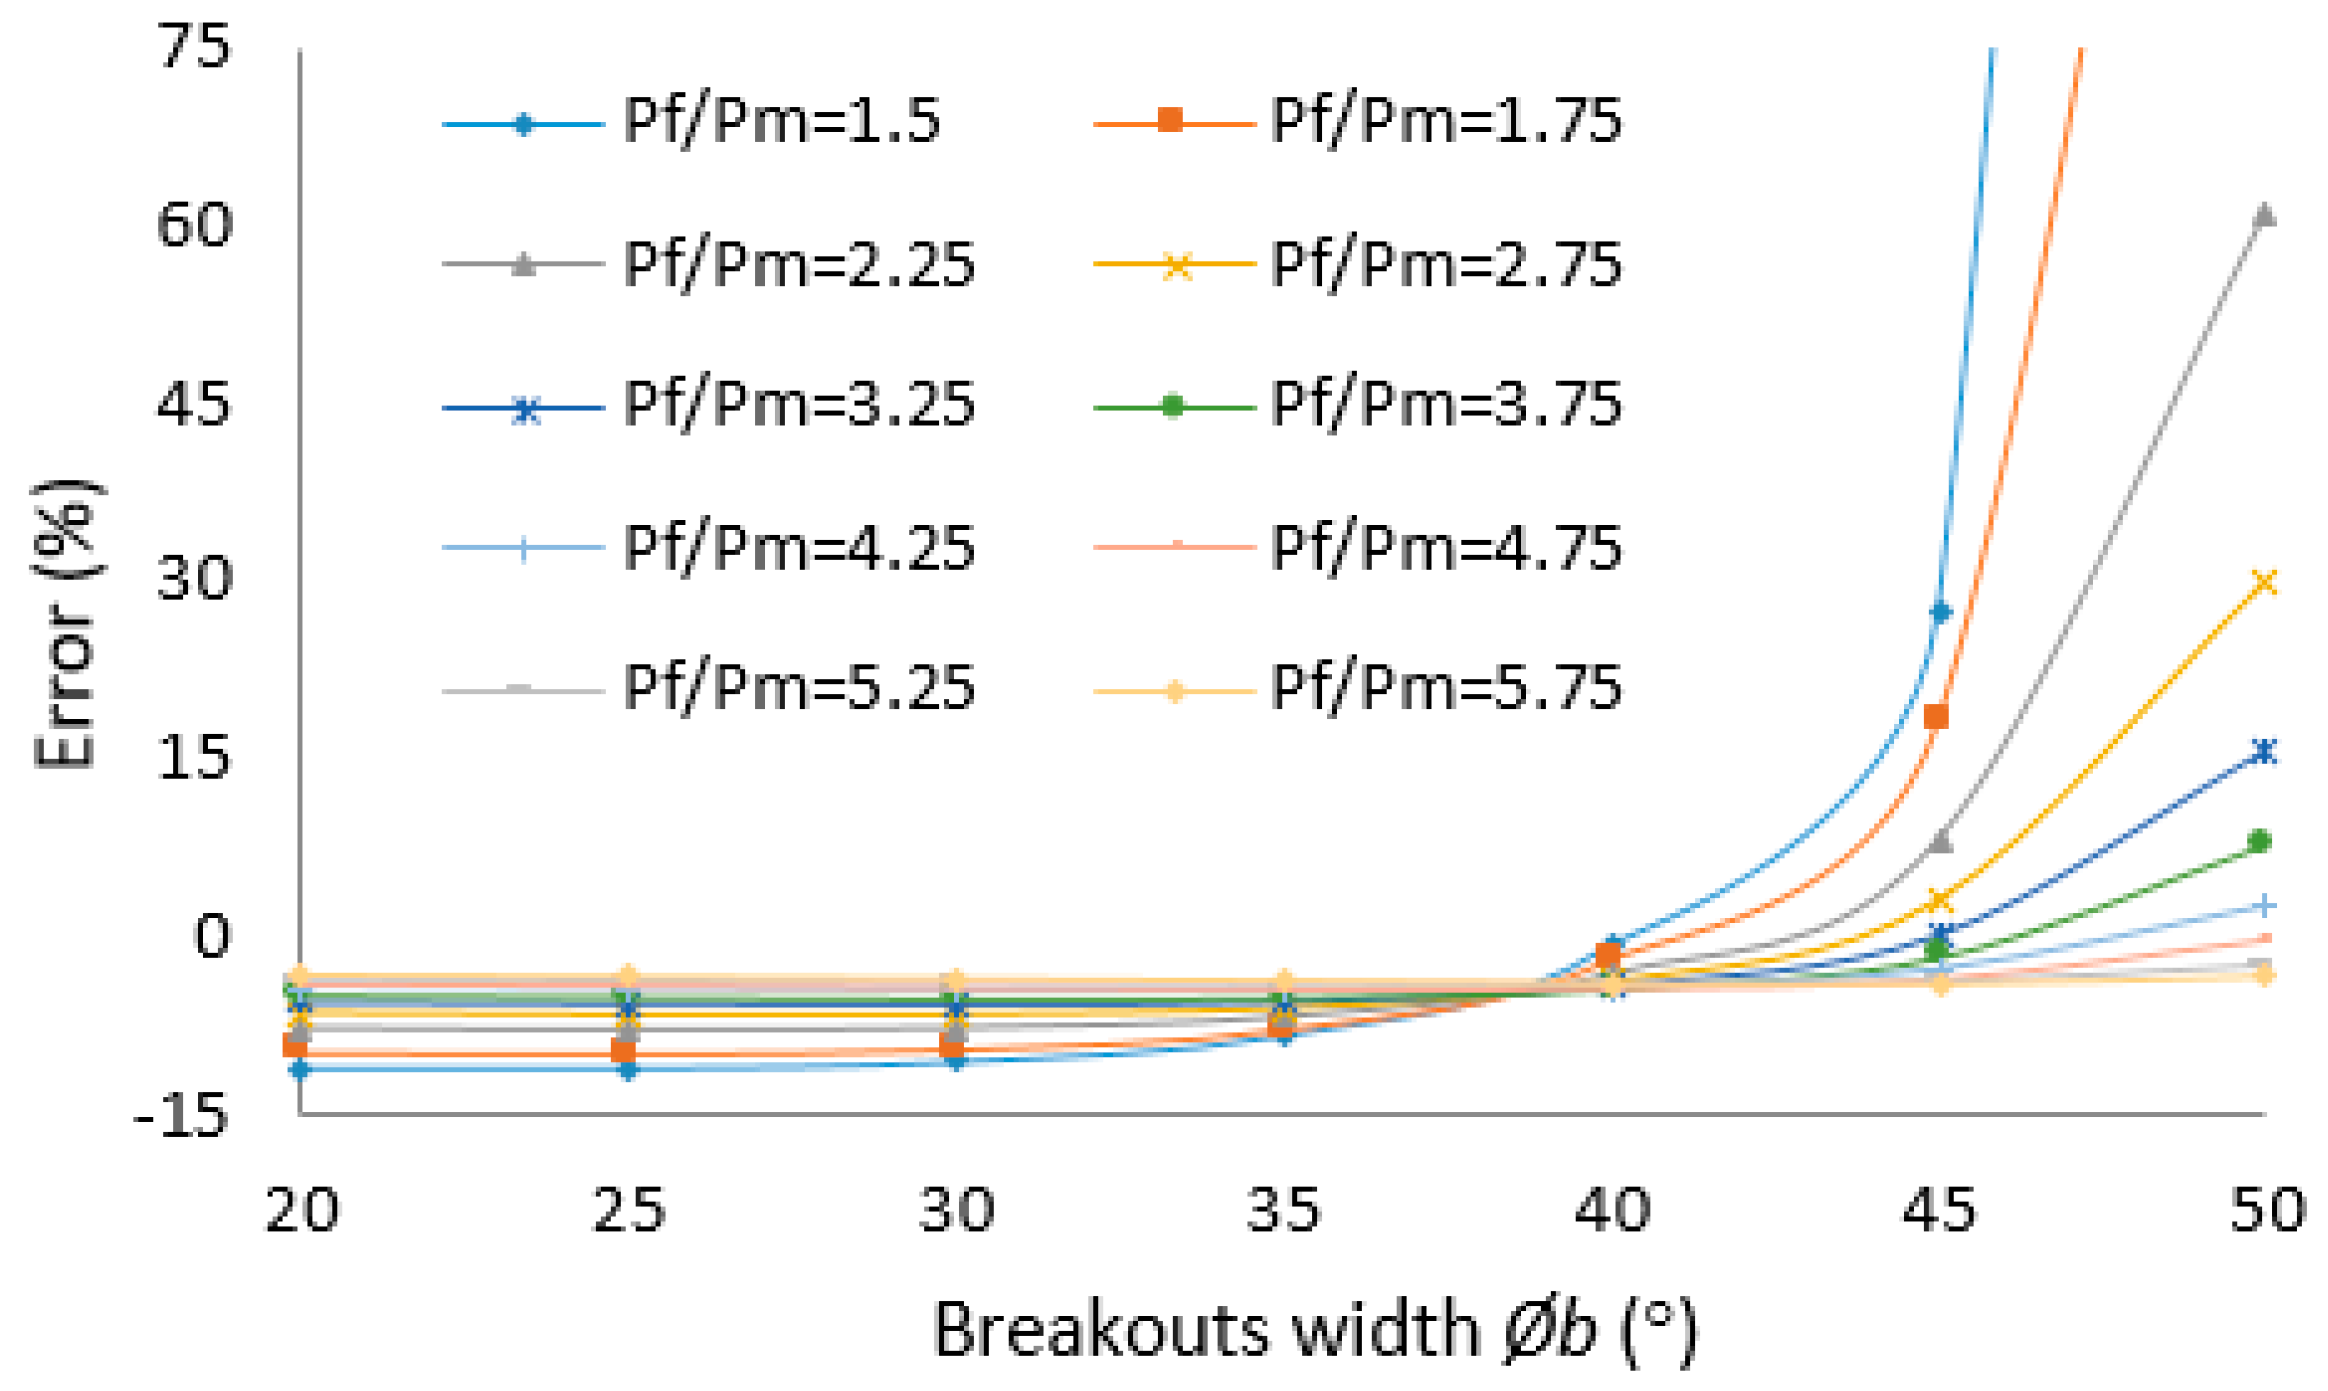
| 5.75 | −3.37 | −3.99 | −3.90 | −3.71 | −3.51 | −3.37 | −3.24 |
| 5.25 | −2.23 | −3.87 | −4.10 | −4.00 | −3.81 | −3.67 | −3.54 |
| 4.75 | −0.30 | −3.51 | −4.25 | −4.30 | −4.18 | −4.02 | −3.88 |
| 4.25 | 2.70 | −2.86 | −4.33 | −4.66 | −4.61 | −4.46 | −4.32 |
| 3.75 | 7.56 | −1.75 | −4.32 | −5.04 | −5.10 | −4.99 | −4.86 |
| 3.25 | 15.56 | 0.04 | −4.18 | −5.49 | −5.75 | −5.67 | −5.53 |
| 2.75 | 29.83 | 2.98 | −3.87 | −6.06 | −6.59 | −6.60 | −6.45 |
| 2.25 | 60.81 | 8.05 | −3.18 | −6.76 | −7.72 | −7.87 | −7.69 |
| 1.75 | 167.42 | 18.16 | −1.85 | −7.74 | −9.41 | −9.78 | −9.67 |
| 1.50 | 441.69 | 27.33 | −0.75 | −8.35 | −10.58 | −11.15 | −11.07 |
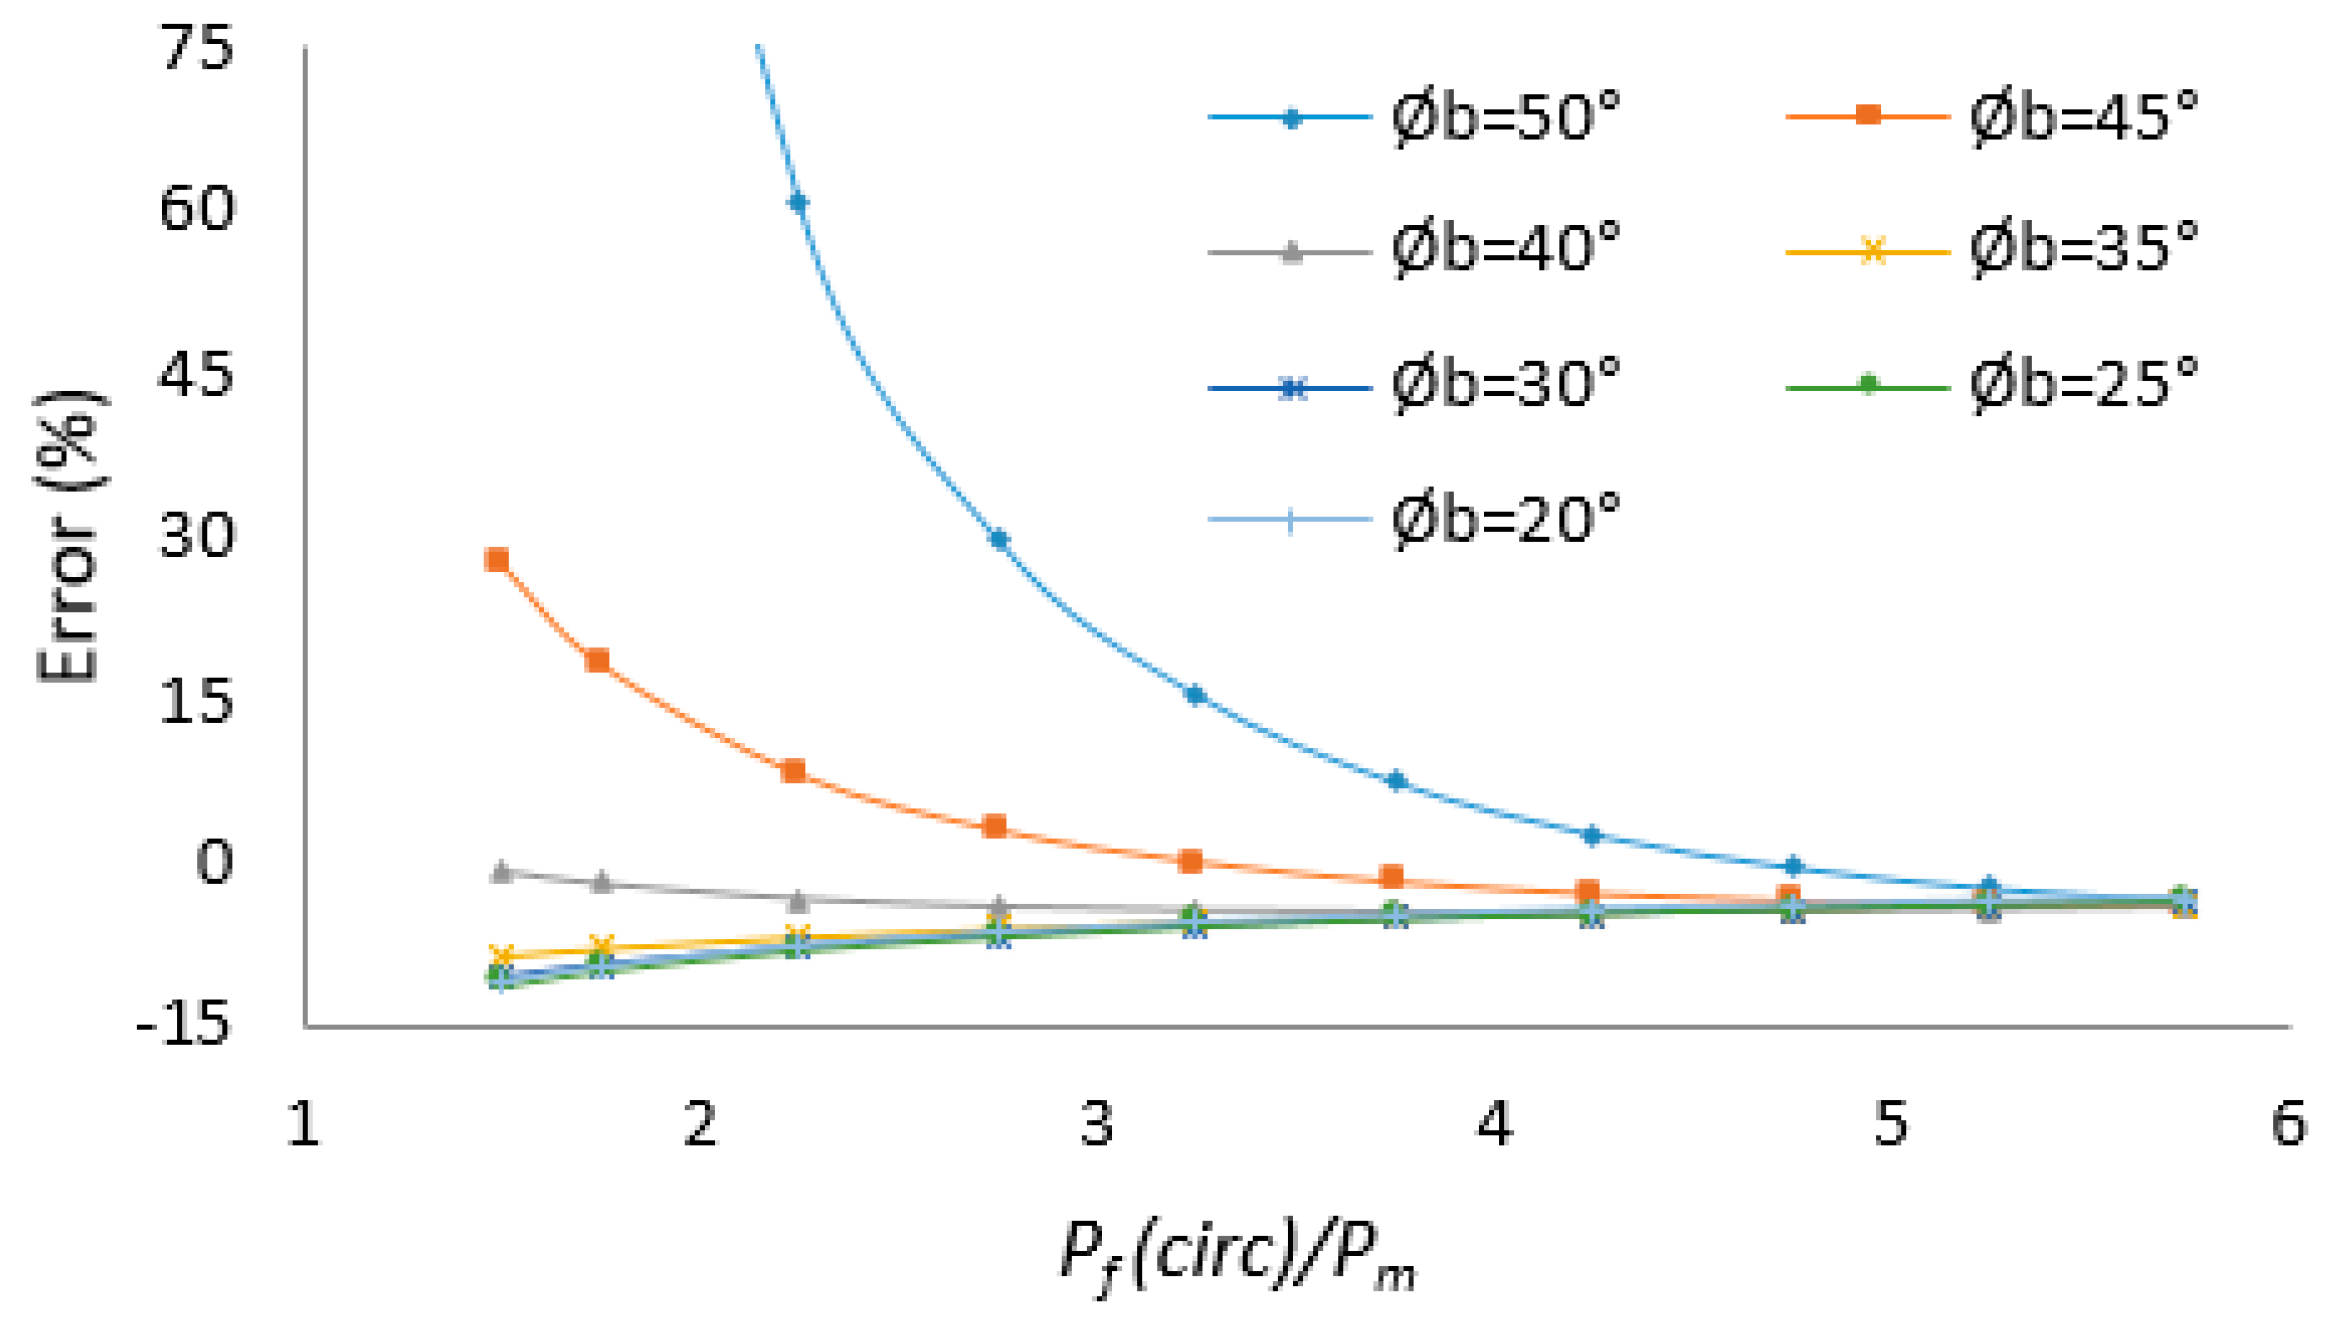
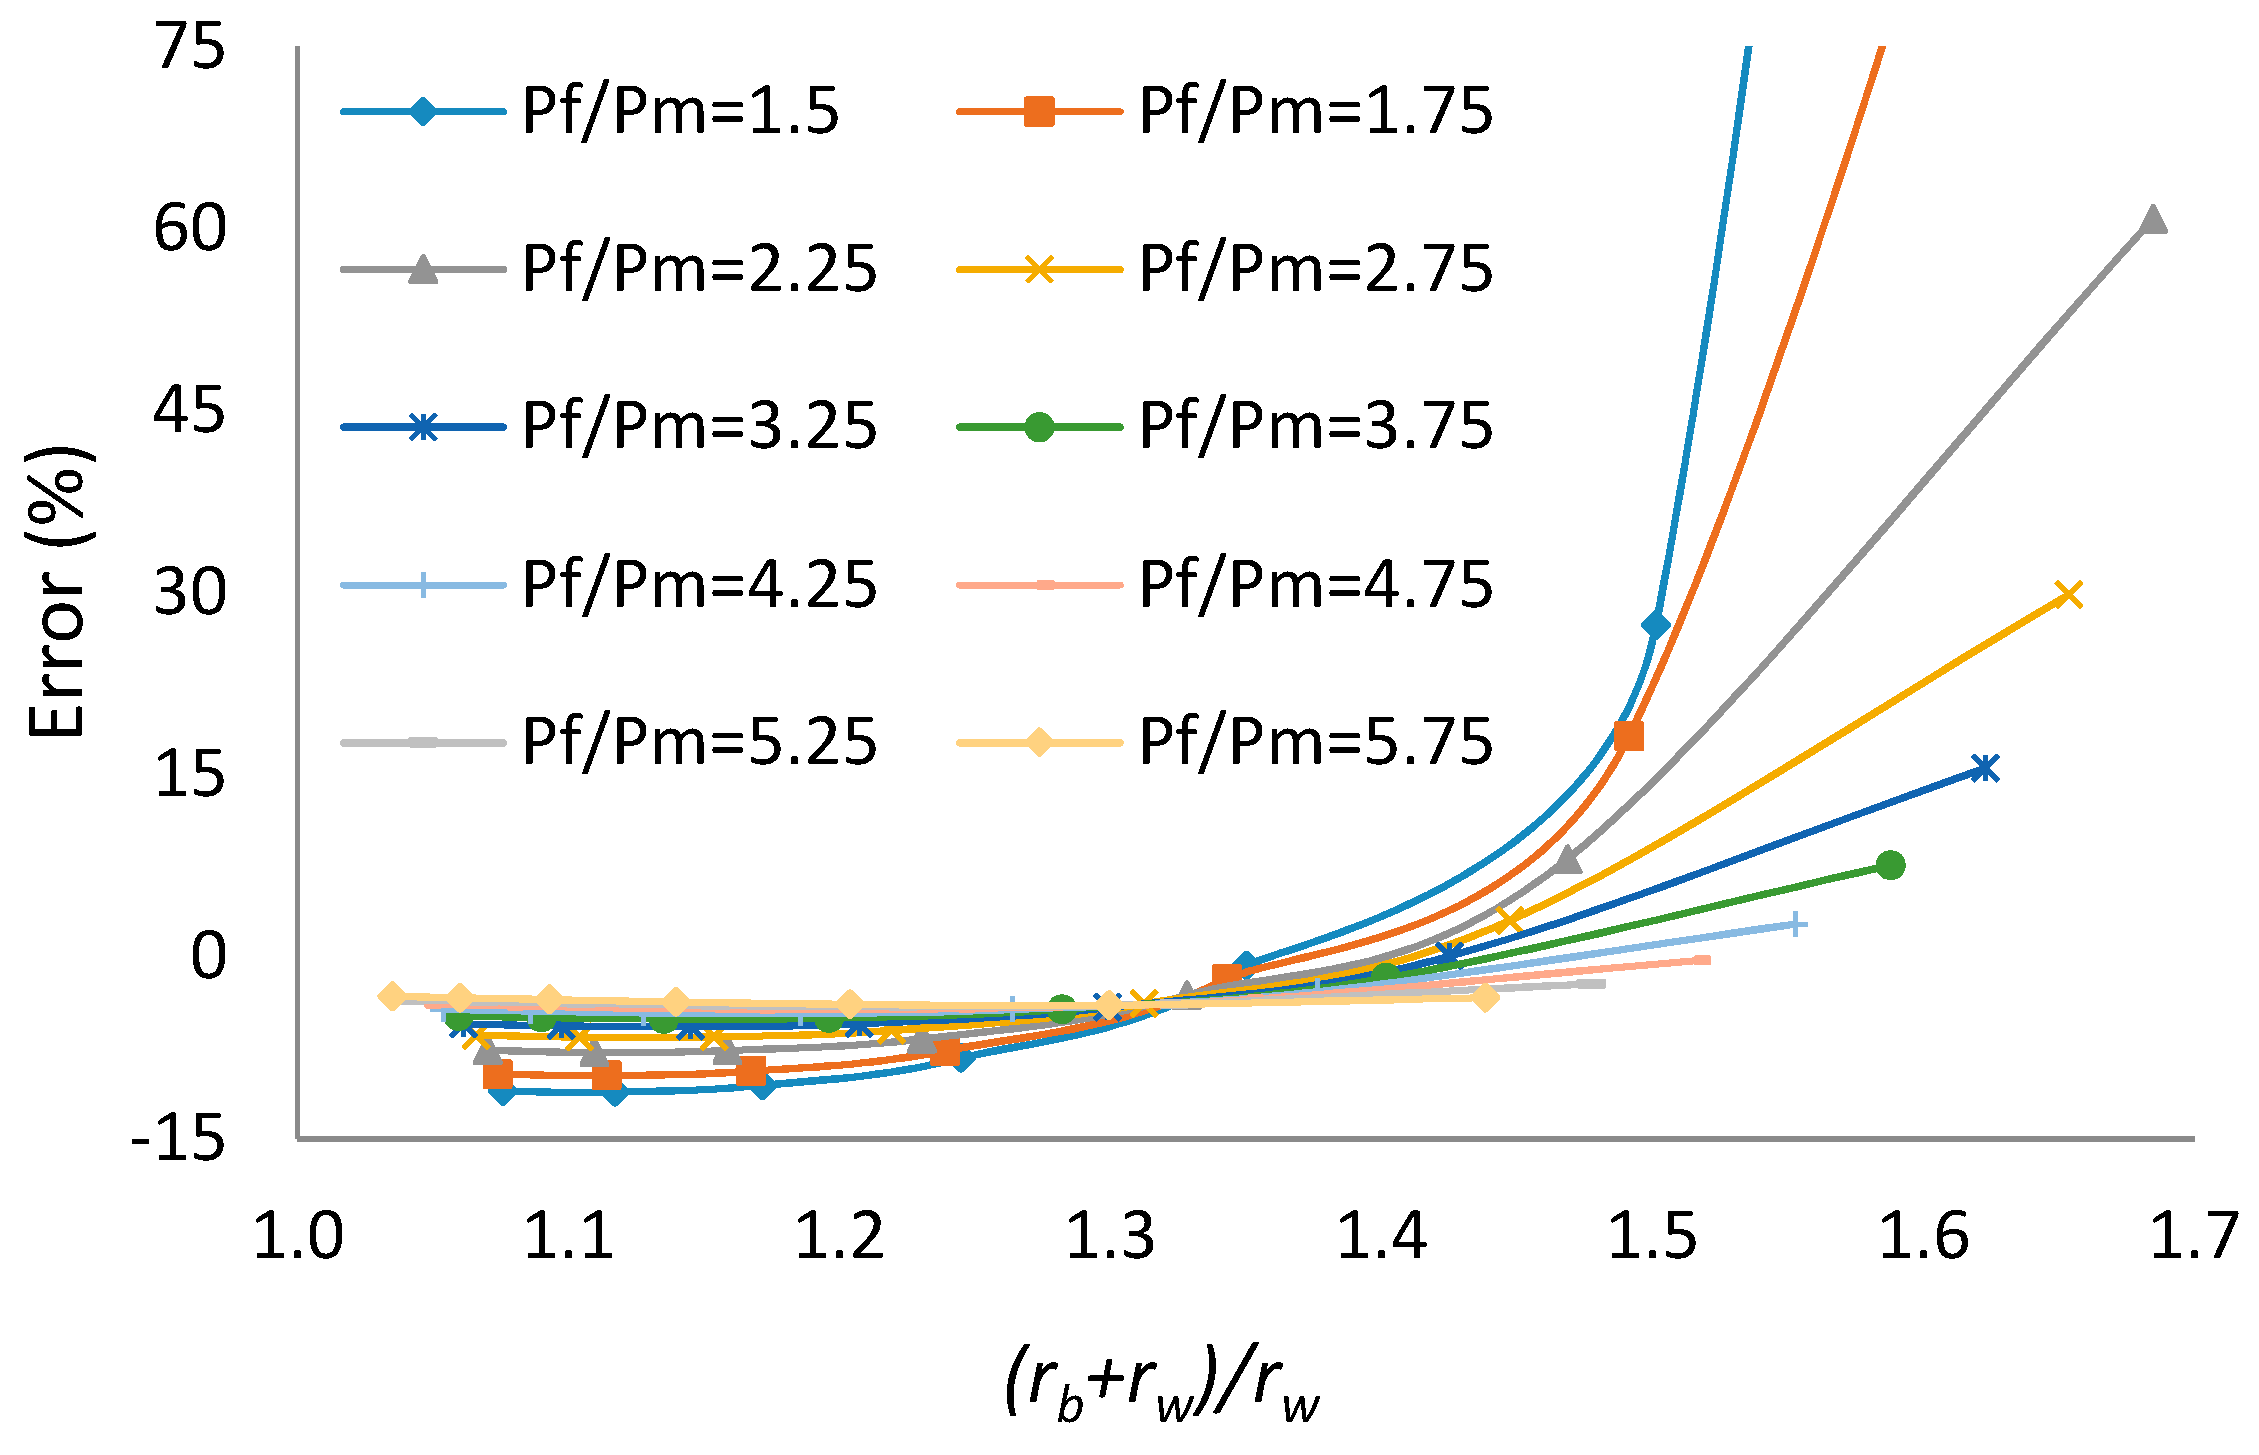
| Pf/Pm | 1 | 2 | 3 | 4 | 5 | 6 | 7 | |
|---|---|---|---|---|---|---|---|---|
| 5.75 | (rw+rb)/rw | 1.44 | 1.30 | 1.20 | 1.14 | 1.09 | 1.06 | 1.03 |
| Err (%) | −3.37 | −3.99 | −3.90 | −3.71 | −3.51 | −3.37 | −3.24 | |
| 5.25 | (rw+rb)/rw | 1.48 | 1.32 | 1.22 | 1.15 | 1.10 | 1.07 | 1.04 |
| Err (%) | −2.23 | −3.87 | −4.10 | −4.00 | −3.81 | −3.67 | −3.54 | |
| 4.75 | (rw+rb)/rw | 1.52 | 1.35 | 1.24 | 1.17 | 1.12 | 1.08 | 1.05 |
| Err (%) | −0.30 | −3.51 | −4.25 | −4.30 | −4.18 | −4.02 | −3.88 | |
| 4.25 | (rw+rb)/rw | 1.55 | 1.38 | 1.26 | 1.19 | 1.13 | 1.09 | 1.05 |
| Err (%) | 2.70 | −2.86 | −4.33 | −4.66 | −4.61 | −4.46 | −4.32 | |
| 3.75 | (rw+rb)/rw | 1.59 | 1.40 | 1.28 | 1.20 | 1.14 | 1.09 | 1.06 |
| Err (%) | 7.56 | −1.75 | −4.32 | −5.04 | −5.10 | −4.99 | −4.86 | |
| 3.25 | (rw+rb)/rw | 1.62 | 1.42 | 1.30 | 1.21 | 1.14 | 1.10 | 1.06 |
| Err (%) | 15.56 | 0.04 | −4.18 | −5.49 | −5.75 | −5.67 | −5.53 | |
| 2.75 | (rw+rb)/rw | 1.65 | 1.45 | 1.31 | 1.22 | 1.15 | 1.10 | 1.07 |
| Err (%) | 29.83 | 2.98 | −3.87 | −6.06 | −6.59 | −6.60 | −6.45 | |
| 2.25 | (rw+rb)/rw | 1.68 | 1.47 | 1.33 | 1.23 | 1.16 | 1.11 | 1.07 |
| Err (%) | 60.81 | 8.05 | −3.18 | −6.76 | −7.72 | −7.87 | −7.69 | |
| 1.75 | (rw+rb)/rw | 1.72 | 1.49 | 1.34 | 1.24 | 1.17 | 1.11 | 1.07 |
| Err (%) | 167.42 | 18.16 | −1.85 | −7.74 | −9.41 | −9.78 | −9.67 | |
| 1.50 | (rw+rb)/rw | 1.73 | 1.50 | 1.35 | 1.24 | 1.17 | 1.12 | 1.08 |
| Err (%) | 441.69 | 27.33 | −0.75 | −8.35 | −10.58 | −11.15 | −11.07 |
© 2019 by the authors. Licensee MDPI, Basel, Switzerland. This article is an open access article distributed under the terms and conditions of the Creative Commons Attribution (CC BY) license (http://creativecommons.org/licenses/by/4.0/).
Share and Cite
Zhang, H.; Yin, S.; Aadnoy, B.S. Numerical Investigation of the Impacts of Borehole Breakouts on Breakdown Pressure. Energies 2019, 12, 888. https://doi.org/10.3390/en12050888
Zhang H, Yin S, Aadnoy BS. Numerical Investigation of the Impacts of Borehole Breakouts on Breakdown Pressure. Energies. 2019; 12(5):888. https://doi.org/10.3390/en12050888
Chicago/Turabian StyleZhang, Hua, Shunde Yin, and Bernt S. Aadnoy. 2019. "Numerical Investigation of the Impacts of Borehole Breakouts on Breakdown Pressure" Energies 12, no. 5: 888. https://doi.org/10.3390/en12050888
APA StyleZhang, H., Yin, S., & Aadnoy, B. S. (2019). Numerical Investigation of the Impacts of Borehole Breakouts on Breakdown Pressure. Energies, 12(5), 888. https://doi.org/10.3390/en12050888