1. Introduction
Limited carbon resources and environmental concerns are some of the reasons leading the energy industry to exploit alternative energy sources. Wind energy systems have been developed and applied for sites with suitable conditions, the first modern commercial-scale wind turbines were placed in United States approximately 40 years ago. Nowadays, the most common and profitable applications for wind energy systems are the large wind farms. Commercial-scale wind generators for wind farms are within 3 MW and 5 MW, and all have a predominantly horizontal axis and are three bladed. One problem of these large wind farms is the row arrangement of the generators. The towers are usually placed in rows, requiring large areas of land for rotors up to 100 m in diameter. Previous research has suggested safe distances to avoid the wind turbines blade/components damage and output power waste. However, the optimum spacing between turbines in a wind farm is still a challenging and open question in wind energy research.
Several efforts using different methodologies have been done to achieve layout optimization, focusing on finding optimal spacing between turbines in a wind farm. Park and Law [
1] applied sequential convex programming to maximize wind farm output power by optimizing the placement of wind turbines of the Horns wind farm in Denmark. They found that the optimal spacing between wind turbines is dependent on the wind direction. Scattering the turbines helped to avoid wake chain effects, so that downstream rotors were not significantly affected. Moreover, the same study considered wind statistical data to optimize the wind farm power production over a long period, resulting in a 7.3% power increase. Son et al. [
2] found that the total wind farm output power is strongly related to the distance between the first and second wind turbine rows. When the referred distance became larger, the output power considerably dropped in comparison to smaller distances. This means that the increase of the spacing between the first and second rows is ineffective in improving output power. On the other hand, decreased distances made the second wind turbine row much less efficient. They discovered the importance of keeping turbines as close as possible, but with enough space so that the second row can have guaranteed output power. Longer distances did not contribute to increase the total output power. Further, increasing the space between the fourth and the fifth rows has a better contribution than increasing the space between the first and second rows. Wu and Porté-Agel [
3] investigated two layout configurations in the same area with 30 turbines either arranged in aligned or staggered conditions. In comparison to the aligned configuration, the staggered one allows better wake recovery. This exposes the downstream turbines to higher local wind speeds (consequently higher performance) and lower turbulence intensity. Stevens et al. [
4] found that the distance of 10 diameters (or higher) would minimize the cost per unit of energy production, and the same is true for a distance of 15 diameters if the objective function was evaluated using dimensionless parameters. Those value are significantly higher than applied values in wind farms (6–10 turbine diameters). Meyers and Meneveau [
5] found that the current wind farms layout solutions in literature have characteristics with considerably lower spacing than computationally optimized layout solutions.
Moreover, other efforts have attempted to achieve wind farm optimization using control strategies to mitigate wake effects, applying sub-optimal operating conditions. This means that each rotor will not necessarily deliver the best aerodynamic performance, but the goal is to find the best solution that avoids wake interaction effects, increasing the total wind farm output power. Park and Law et al. [
6] studied control strategies for wake effects mitigation, showing that control techniques can be applied for each individual rotor to improve overall wind farm efficiency. González et al. [
7] proposed the individual selection of an operating point on each wind turbine in order to maximize the overall wind farm output power. This is performed by studying the optimal pitch angle and Tip Speed Ratio (TSR) of each rotor in regards to the total wind farm output power. Additionally, the methodology also allows decreased turbulence intensity levels in the produced wakes. The results showed increased power production when the wind speed is lower than the rated wind speed, and for non-prevailing wind directions. Lee et al. [
8] found an increase of 4.5% in the total output power by applying pitch angle control for the Horns Rev wind farm. Kazda et al. [
9] applied weakened wake conditions for upstream turbines by using sub-optimal operations through control strategies. They found that a 12.5% reduction for the upstream turbines resulted in a 2.5% increase in the sum of the upstream and downstream turbines. This could be achieved by either a change of 3.5° in the pitch angle or by a 24% reduction in TSR compared to optimum TSR. For the case of two upstream turbines operating at 87.5% of optimal conditions, the sum of total power of the upstream and downstream turbines increased by 9.7%. Gil et al. [
10] applied control strategies, achieving from 1.86% up to 6.24% in energy captured by using sub-optimal operating points. Chowdhurry et al. [
11] found that using variable rotor diameters improved efficiency, achieving 30% increase in the total power generation.
All these efforts in the literature described above provided relevant contributions to wind farm optimization and turbine spacing research. However, they did not consider a rigorous evaluation of three-dimensional wake effects, which this study will achieve. Most of the computational studies from literature proposed design optimization frameworks in which the wind turbine models were not based on data validated against experimental measurements of the wake flow field. In the context of science applied to wind farm optimization, this work proposes a numerical Computational Fluid Dynamics (CFD) model to rigorously analyze wind turbine wake flow field, characterizing wake flow characteristics for the most relevant wind farm parameters: velocity flow field and turbulence intensity. The current study will do a full computational analysis of the near-wake aerodynamic behavior, considering configurations not analyzed before in literature: several different loading, free-stream velocity and pitch angle conditions. The goal is to achieve a validated model by comparing computational and experimental data from existing literature. Engineering tools such as CFD or wake analytical methods have been improved to accurately characterize wake characteristics, but there are few experiments to effectively validate wind turbine wake flow. The present study provides an advance in relation to previous models as it propose a physical model in which the near wake is validated against a critical wind farm design parameter: the velocity flow field. With a reliable CFD model validated in terms of flow field, this model could be applied to improve wind farm layout design by including both near and far wake regions. Literature shows a variety of techniques and different goals in regards to wind turbine CFD. The next section shows a description of the main experimental approaches found in literature, which will be useful to provide data to develop and validate the numerical model in this study.
1.1. Brief Description of Wind Tunnel Experiments
A full review of low-speed wind tunnel studies and scaled turbines is provided by Crespo et al. [
12]; additionally, other recent relevant studies can be found in the literature [
13,
14,
15,
16,
17,
18,
19,
20,
21,
22]. Most of these studies are meant to validate wind turbine simulations, and some of them are described below to provide an overview of low-speed wind tunnel experiments. The objective of this literature review is to show the way that experimental data can be used in order to validate wind turbine simulations.
Wind turbine experiments conducted by the Norwegian University of Science and Technology validated the numerical results against wind tunnel measurements in terms of mean velocity, turbulence intensity and the power and thrust coefficients. This research center has low-speed wind tunnel facilities, with dimensions of 2.71 m wide, 1.8 m high and 11.1 m long. An experimental study was performed using two aligned prototype rotors of 0.944 m and 0.894 m, and the blade consists of 14% S826 NREL (National Renewable Energy Laboratory) profile for the two rotors [
13]. The velocity profile was characterized using Pitot-Static tubes, and the thrust force was determined using a Six-Component Balance Force.
A qualitative study of the rotor wake behavior by Chamorro and Porté-Angel [
14] analyzed a 150 mm diameter three-bladed wind turbine prototype, which was tested using a wind tunnel with 37.5 m length driven by a 200 hp fan. The experimental data was used to produce a qualitative study of the wake behavior, since the Reynolds number is different compared to full-scale wind turbines. A particularly interesting aspect that distinguishes this study from the others is that the authors were able to characterize the surface roughness by placing straight chains of approximately 5 mm height covering a 10 m section of the tunnel. These chains were aligned perpendicular to the flow direction and separated from each other by 0.20 m. The mean wind velocity in the tunnel was measured using Pitot static tubes, and constant TSR values (λ = 4.2 for smooth surfaces and λ = 4.4 rough surfaces) were maintained in order to reflect the typical operational conditions of full-scale field turbines (typically 3 < λ < 6).
In another experiment, a virtual wind-tunnel model (24.4 m × 36.6 m) with the same dimension of the NASA (National Aeronautics and Space Administration) wind tunnel was analyzed using the ANSYS Fluent package [
15]. The model validation was performed comparing the pressure coefficient at different span-wise sections along the turbine blade. In addition, the wind turbine output power was compared to published experimental results for the NREL phase VI rotor tested in the NASA wind tunnel. Several other studies in literature utilized data from the NREL/NASA framework to develop CFD studies using pressure coefficient values on the blades and aerodynamic torque data for comparison and validation. Zhou et al. [
23] performed LES (Large Eddy Simulation) of the NREL phase IV to evaluate the effect of different inflow conditions on the aerodynamic loading and near wake characteristics. Hsu et al. [
24] implemented a finite-element (Lagrangian-Eulerian) model of the NREL Phase IV using a non-structured rotating mesh refined close to the rotor disc. Wake characterization was not the focus of the study, what explains the wake made out of coarse non-structured cells with no refinement. Gundling et al. [
25] evaluated low and high fidelity models using the NREL Phase VI for predicting wind turbine performance, aeroelastic behavior and wakes: 1) The Blade Element method with a free-vortex wake; 2) The actuator disc method; 3) The full-rotor method. Mo et al. [
26] did a study in more depth to understand wake aerodynamics performing a LES of the NREL Phase VI using dynamic Smagorinsky-model, additionally verification of the average Turbulence Intensity was performed against an analytical model. They found that the downstream distance where instability and vortex breakdowns occur is dependent on wind free-stream inlet conditions (7 m·s
−1 happens at four rotor diameters, while 15.1 m∙s
−1 between 11 and 13 diameters), and a decrease of the turbulence intensity happened after instability and vortex breakdowns. Choudhry et al. [
27] performed a very similar CFD study of the NREL phase VI using computational methods similar to the ones found in the study conducted by Mo et al. [
26], finding that regions of velocity deficit and high turbulence intensity are within the high vorticity region.
Sturge et al. [
16] utilized an open-circuit suction tunnel, driven by an eight-blade axial fan positioned at the outlet. In this experiment, the wind speed is controlled by using a variable frequency drive. The air flow passes through a honeycomb mesh with cells 0.01 m wide and 0.1 m long. The dimensions vary along the tunnel, with a 6.25:1 contraction section and 1.2 m high × 1.2 m wide × 3 m long test section. Afterwards, analysis of static pressure along the blade showed a large reduction in the suction peak along the leading edge, which reduced the lift generated by the rotor and consequently the torque production.
The wake flow of a 5 × 5 array of 50 mm micro-wind turbines was studied and analyzed by Houssain et al. [
18] using a wind tunnel. These 1/10 scaled prototypes were placed in a 3 m × 1.8 m wind tunnel, allowing the velocity profile and turbulence intensity (velocity fluctuations) behind the array to be measured at different downstream locations. The wake flow was characterized by using hot-wire anemometer, ultrasonic anemometer measurements, and Particle Image Velocimetry (PIV). The full-scale rotor of 500 mm diameter was analyzed as well. The results for velocity deficit and the turbulence intensity were similar for both rotors.
In this sense, the MEXICO (Model Experiments in Controlled Conditions) experiment [
28] was one of the most comprehensive collaborative efforts by the International Energy Agency (IEA), who created the task 29 to gain understanding about wind turbine aerodynamics, as well as to improve aerodynamic models used for wind turbine design. A series of tests for a small wind turbine prototype were performed using the DNW German Dutch open section wind tunnel. Although the rotor wake measurements comprised only the near wake region right behind to the wind turbine (up to 1.33D downstream of the rotor), the experiment is a very rich source of data useful to validate wind turbine CFD wake models.
This present work covers the gap of characterizing the wind turbine wake flow field based on experimental data from existing literature, which describes the validation of a wind turbine CFD simulation using velocity wake data from the MEXICO experiment. The goal is to extend the understanding of the wake flow field beyond the distances analyzed in these experiments, and also analyzing the influence of variable operating conditions on near wake aerodynamic behavior. In order to do so, variable operating conditions with regards to the TSR and the Pitch Angle (θ) were simulated to understand how these specific design parameters affect the flow field. The second part of this work will extend the analysis beyond the near wake, characterizing the far wake aerodynamic behavior according to the same TSR and Pitch Angle (θ) conditions.
1.2. Detailed Overview of the MEXICO Experiment
The experiments described in the previous section only performed rotor measurements. However, computational models based on CFD assumptions also need flow field measurements to be successfully validated. The most comprehensive experimental flow field measurement study was the MEXICO Experiment [
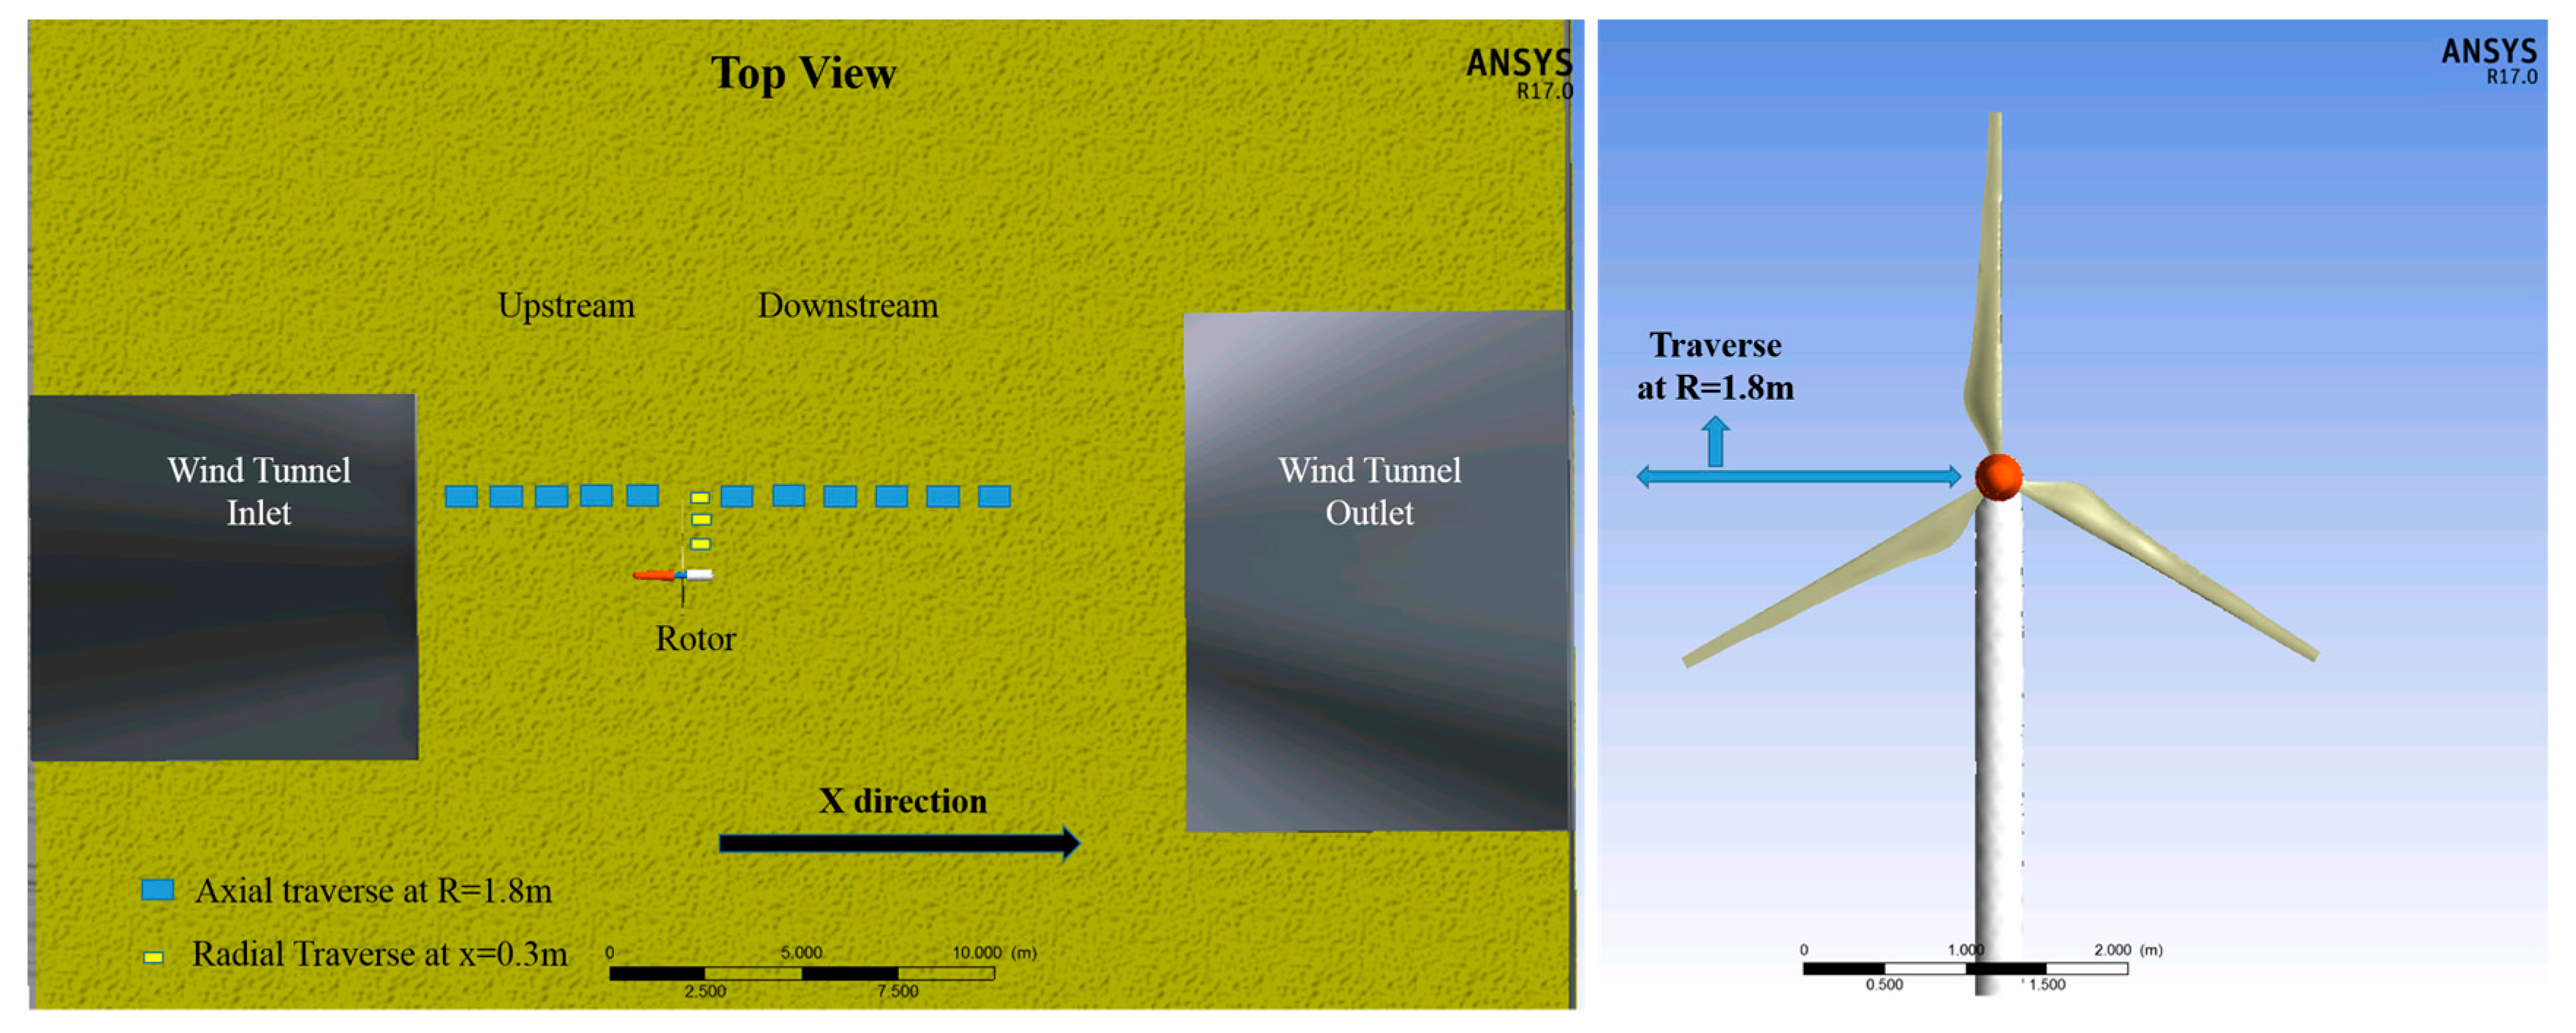
28], which used a rotor prototype of 4.5 m diameter and the largest wind tunnel existent in the European continent. PIV techniques were employed to collect flow field measurements around the rotor plane (
Figure 1). Several recent studies utilized data from the MEXICO experiment to validate their CFD models [
29,
30,
31,
32,
33,
34,
35,
36,
37,
38,
39,
40,
41,
42,
43,
44,
45] with different research goals as detailed below.
In regards to Lifting Line codes, Yang et al. [
29] showed the necessity for developing new techniques to account for 3D rotational effects on predicting loading for rotors. They created a new technique to determine the angle of attack on rotating blades using data from the MEXICO experiment, a Blade Element Momentum (BEM) code relying on 2D airfoil data was found to over-predict the loading of the rotor; this discrepancy was attributed to the 3D effects originated from the rotor geometry. Xudong et al. [
30] developed an aerodynamic/aero-elastic design tool to optimize wind turbine blades and validated the results using MEXICO data for turbine loading.
Regarding the first round of PIV wake measurements (axial flow), Bechmann et al. [
31] performed a CFD simulation of the MEXICO rotor using RANS (Reynolds Averaged Navier Stokes) equations further downstream up to 2.5 diameters behind the rotor. All the simulations were done fully turbulent, but there might be laminar flow at the leading edge of the blades; further work is needed to demonstrate the length of accuracy of laminar turbulent-transition models. Micallef et al. [
32] characterized the radial velocities in the near wake close to the MEXICO rotor using a potential-flow panel model to characterize the wake radial induction. Tip vortex characterization performed by tracking its location showed that the radial flow velocity in the rotor plane is not fully dominated by the blade vorticity. Carrión et al. [
33] assumed periodic boundary conditions to model only one of the MEXICO rotor blades under axial flow conditions, finding good agreement for the wake flow field by using a compressible multi-block solver without needing to switch between compressible and incompressible flow. Herraez et al. [
34] validated a CFD model in OpenFoam using the Spalart-Allmaras turbulence model, showing comparisons for pressure distributions from several blade sections, and PIV near wake measurements. Shen et al. [
35] performed CFD simulations of the MEXICO rotor including the geometry of the wind tunnel, and regarding tunnel wall effects this study found that tunnel effects are not significantly influenced by the fluid flow. Garcia et al. [
36] developed a hybrid filament-mesh vortex method to improve computational efficiency, using the MEXICO experimental dataset for near wake validation. Nilsson et al. [
37] described vortex structures in the near wake of the MEXICO rotor using the actuator line method. The trajectory of the tip vortices and wake expansion were described according to the TSR, implementing a RANS LES model. Wimshurst and Willden [
38] simulated the near wake flow field of the MEXICO rotor using multiple reference frame approach. The actuator line method using 2D aerodynamic data was compared to a 3D polar actuator line model. Zhong et al. [
39] developed a numerical tool combining Lagrangian dynamic large-eddy and actuator line models using PIV wake data for validation, finding that the tip vortices contribute to a maximum velocity deficit peak and turbulence intensity peak near the blade tip. Guntur and Sørensen [
40] developed a full rotor CFD model of the MEXICO rotor focusing on the flow at the inboard part of the blades, analyzing the boundary layer separation at this region to understand differences in behavior between 3D flow and 2D flow. This latter study showed that the fluid flow separation starts at a higher angle of attack for the 3D case.
In regards to the second round of measurements (yawed flow), Sørensen et al. [
41] did the first attempts to validate the near wake flow field in yawed flow. Tsalicoglou et al. [
42] performed RANS computations of the MEXICO rotor wake for yawed and uniform flow cases, showing that the velocity deficit in the near wake (up to two diameters downstream) does not follow a Gaussian distribution. Additionally, the interaction with structures of the wind turbine (nacelle and tower) is more significant for yawed flows. The effects on the wake caused by the tower and the blade could still be observed at the end of the near wake. Grasso and Garrel [
43] showed that the lifting line code coupled with the free wake method can accurately represent the near wake at uniform or yawed conditions. Shen et al. [
44] developed an actuator line/Navier-Stokes model using the MEXICO rotor experimental dataset under yawed flow for flow field validation, considering both loading and velocity flow field for the simulation.
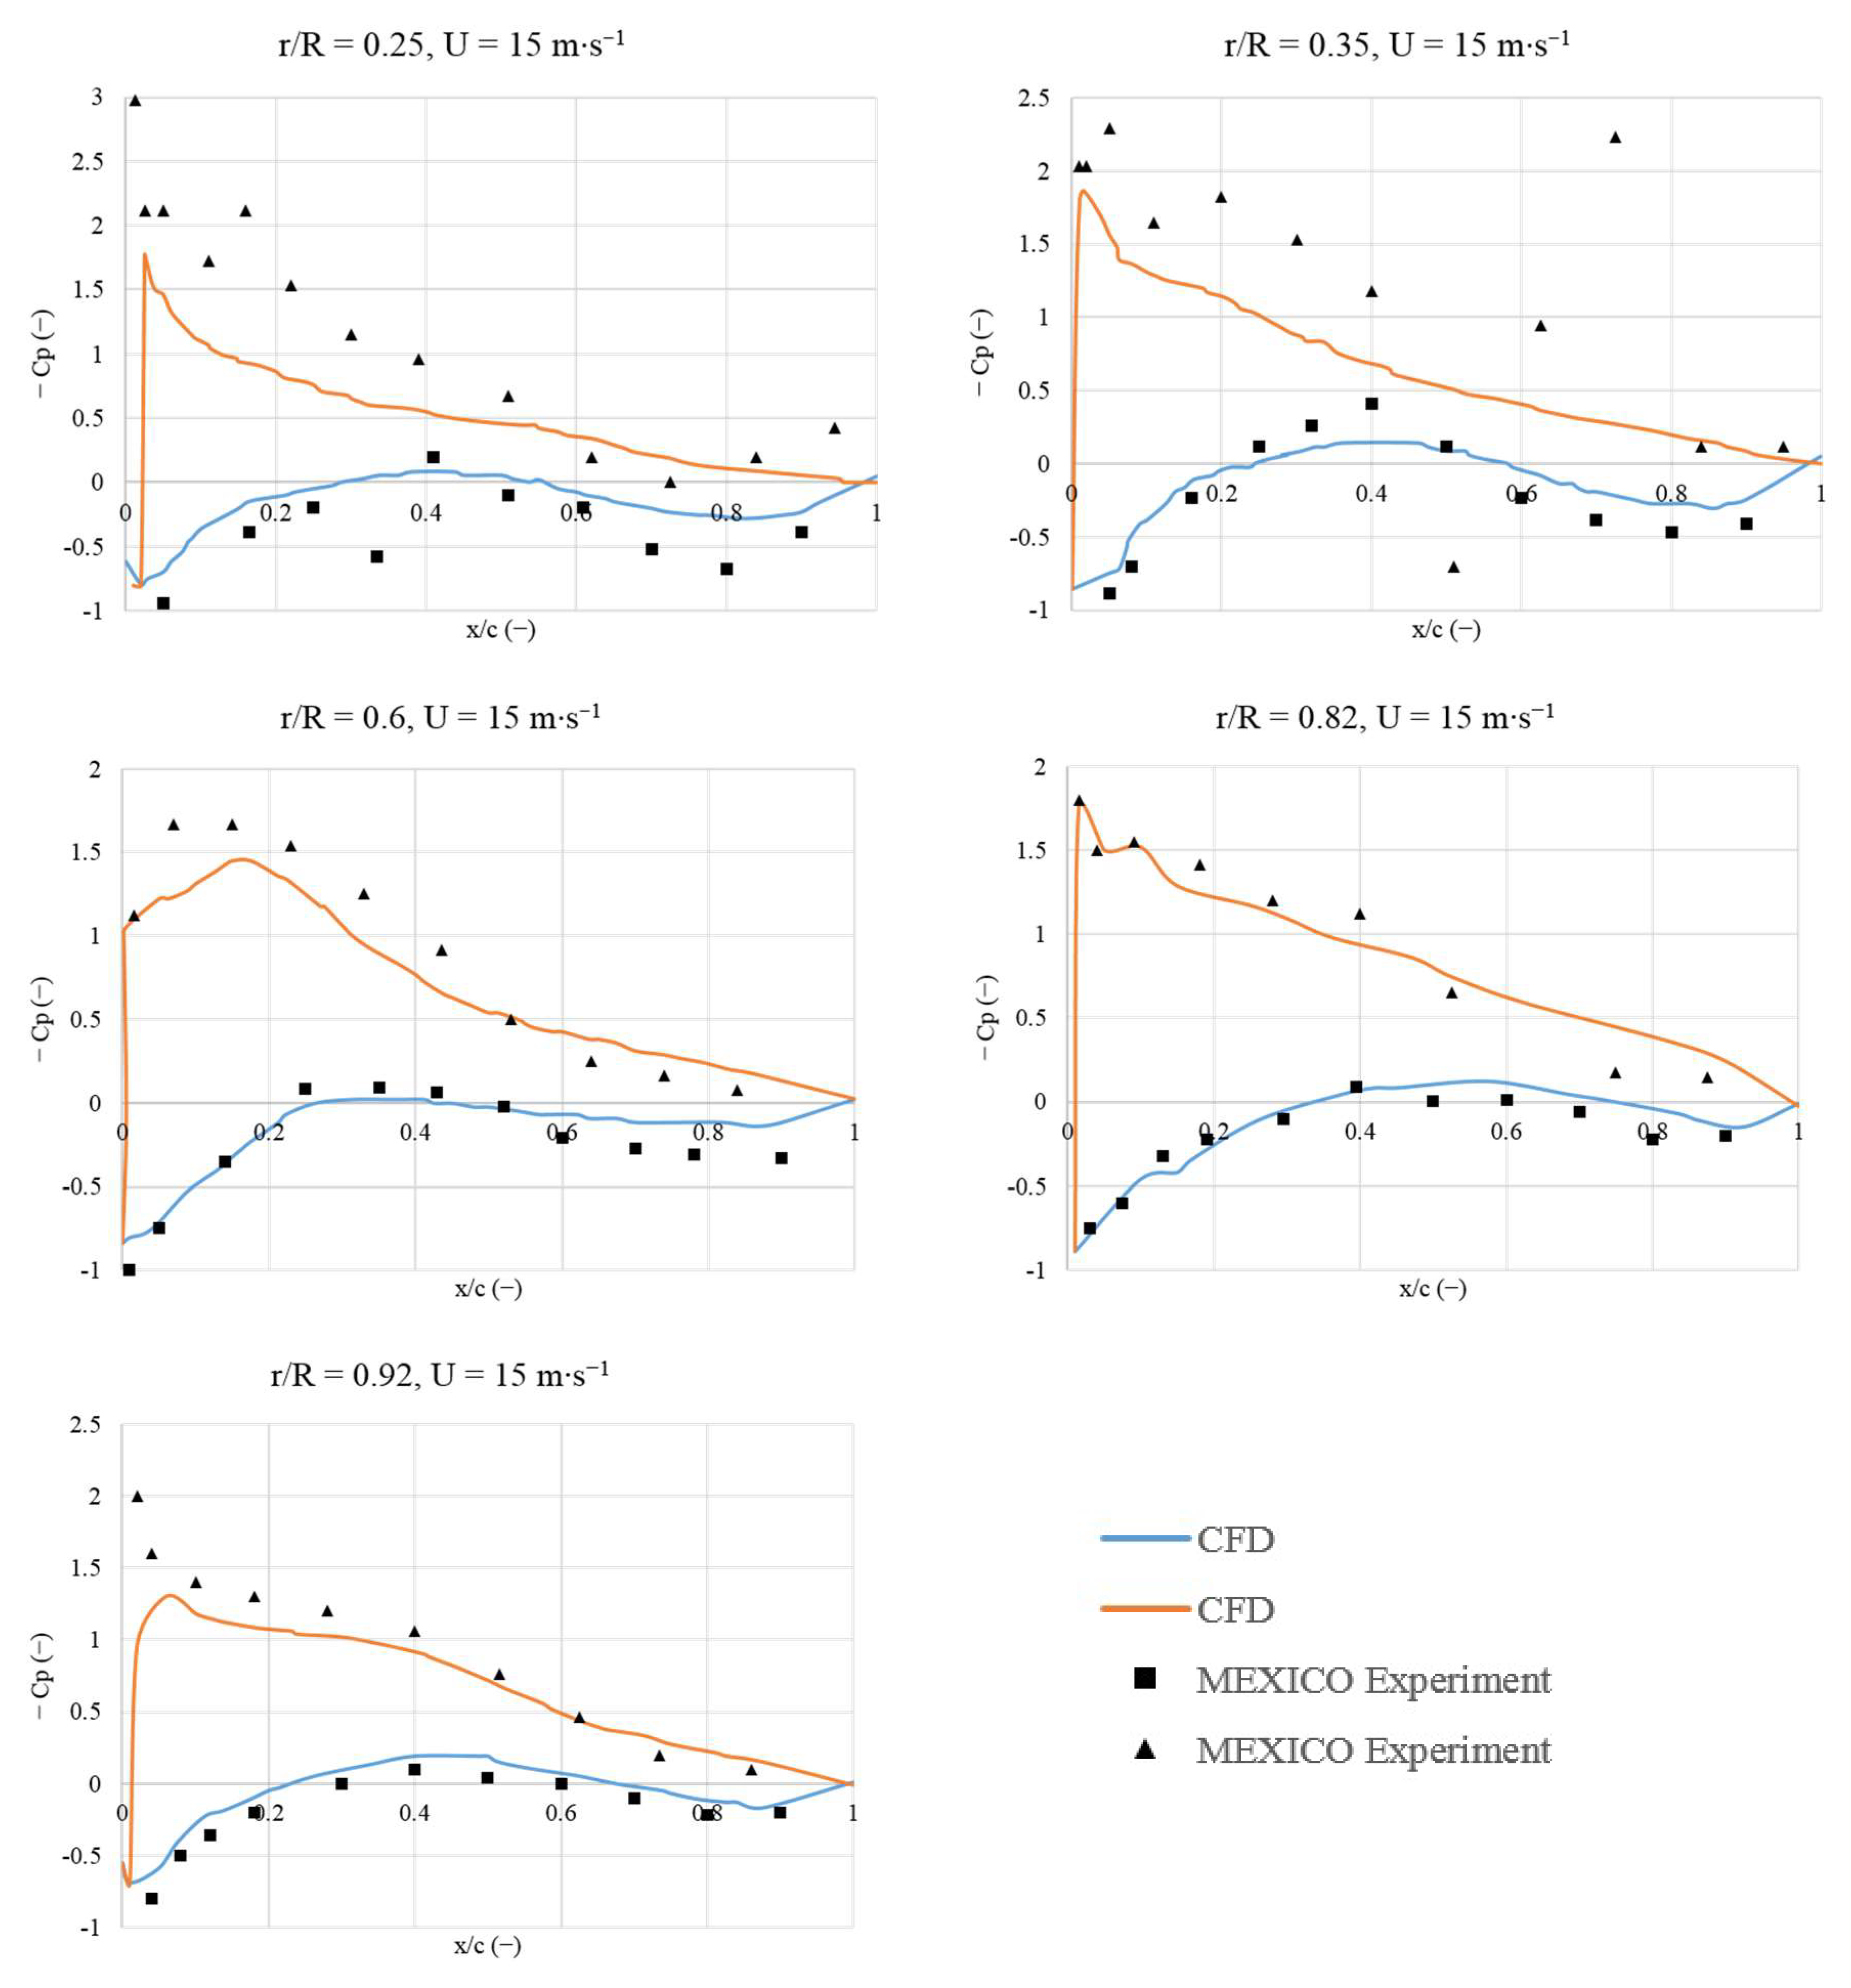
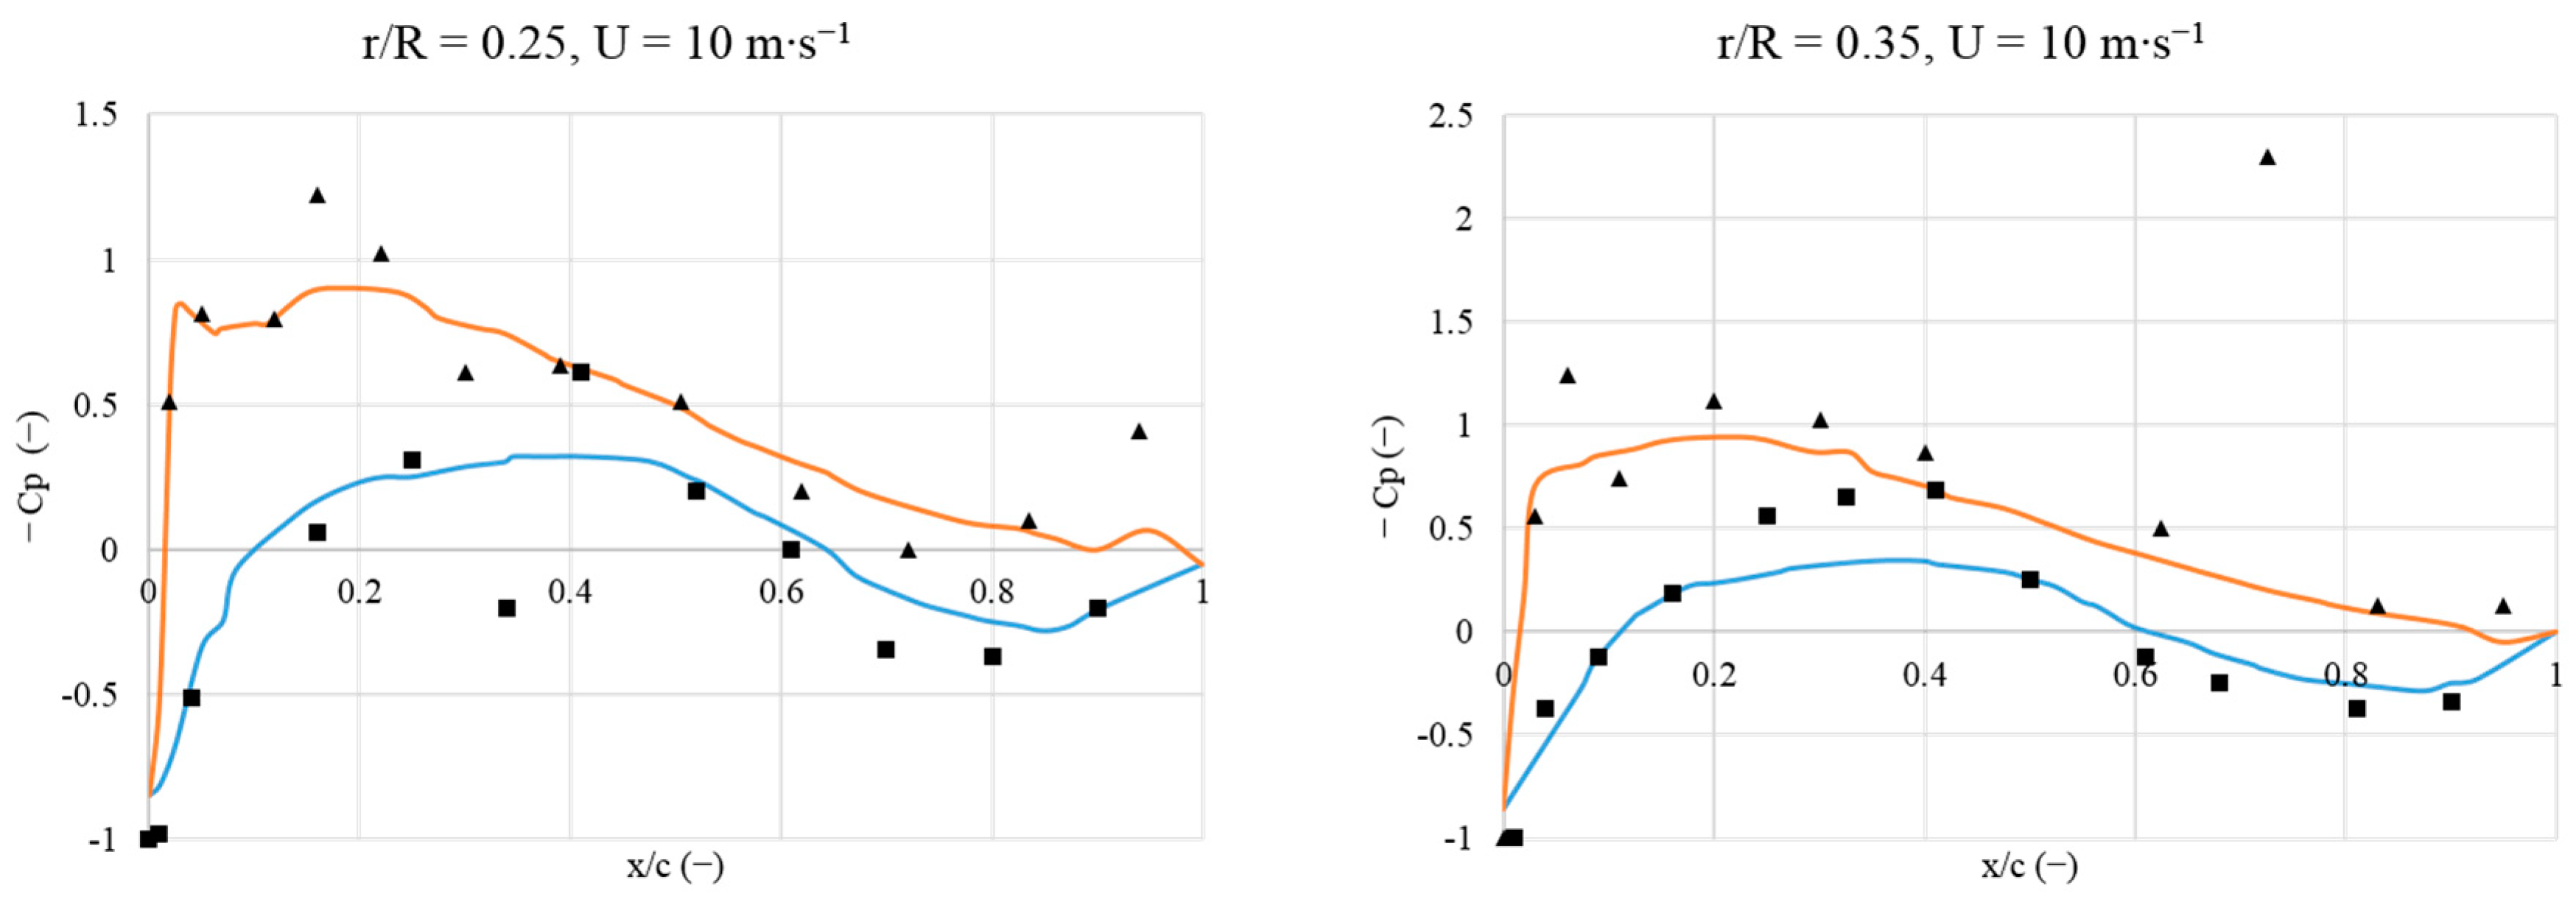
4. Discussion
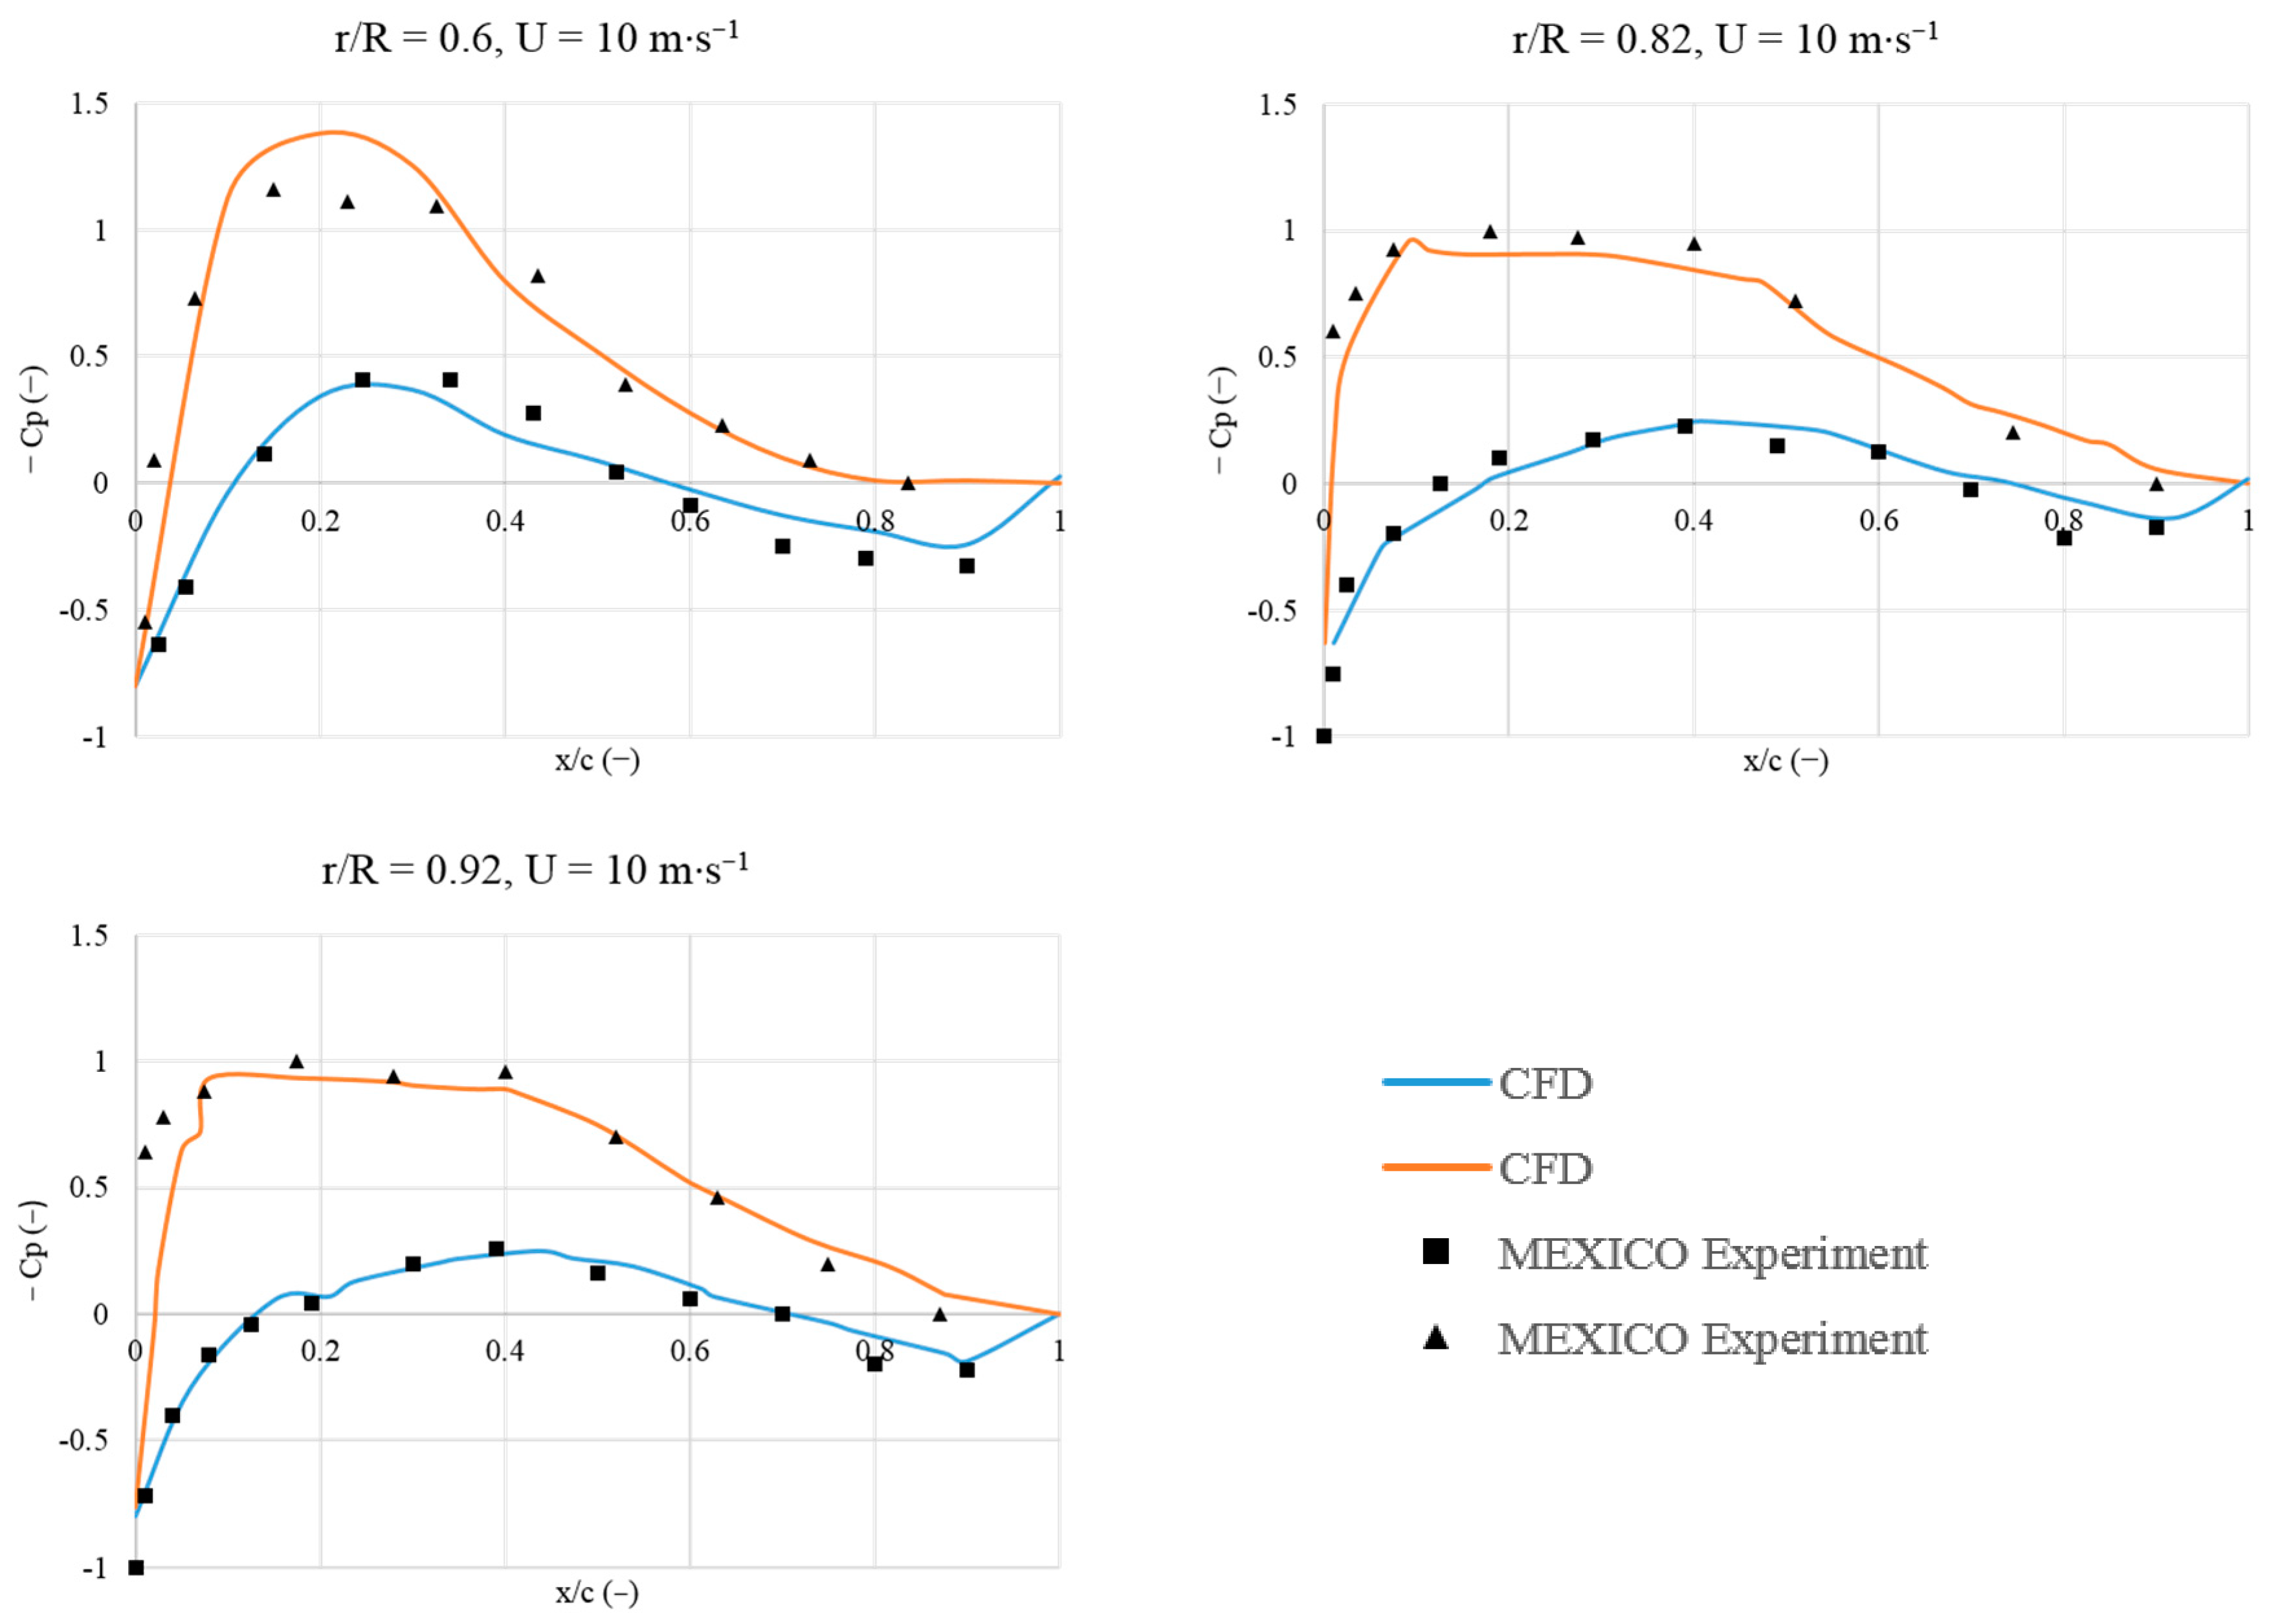
Discrepancies between experimental and computational data were also verified in other studies. First of all, the type of experiment apparently plays an important role in regards to the discrepancies. Particle image velocimetry (PIV) is a technique very sensitive to experimental conditions. In the case of the MEXICO experiment, the light path close to the hub of the wind turbine can potentially disturb and induce the oscillations in the velocity profile observed in the traverse at R = 1.4 m. The problem with light reflection caused by the blade or the nacelle was also described by Carrión et al. [
33], however the numerical discrepancies found in this study could be related to numerical reasons. Wimshurst and Willden [
38] mentioned that the upstream axial free-stream velocity is lower in the MEXICO experiment than the computational simulation, arguing that the open tunnel configuration caused expansion of the streamtube between the wind tunnel nozzle and the collector, consequently causing smaller axial induction downstream of the rotor. The computed axial velocity was lower than the experimental axial velocity, which was explained by the greater force applied to the flow by the rotor. Shen et al. [
35] observed that the computed axial free-stream velocity upstream of the rotor was 2.5% lower than the experimental (15 m·s
−1), and the discrepancies in the near wake were attributed to smaller thrust prediction. A potential contribution to discrepancies is attributed to the type of experiment (PIV measurements), which does instantaneous measurements containing fluctuations. Additionally, the wake fluctuation caused by the tip vortex could not be captured by the computational physical model employed in that study. The type of mesh refinement from Shen’s study was claimed to be dependent on the upstream velocity, where a coarse mesh causes excessive dissipation. The sudden drop in velocity for the radial traverse at x = 0.3 m was attributed to the vortex shedding from the transition between the airfoils DU and Riso, and the intensity of the vortex was related to the change of circulation on the blade. Nilsson et al. [
37] attributed the slightly overestimated axial velocity to the thrust, which was underestimated for all flow configurations. Furthermore, the light in the tunnel might have reflected on the turbine hub, affecting the experimental PIV measurements at the blade inboard radial position 0.62R (closer to the hub). Garcia et al. [
36] found under-prediction of the thrust close to the blade root, attributed to rotational Coriolis effects and centrifugal forces in the boundary layer. Sorensen [
41] found that the size of the nacelle influenced the inboard blade flow for yawed cases, so that the nacelle must also be included for accurate CFD modeling at the inboard region.
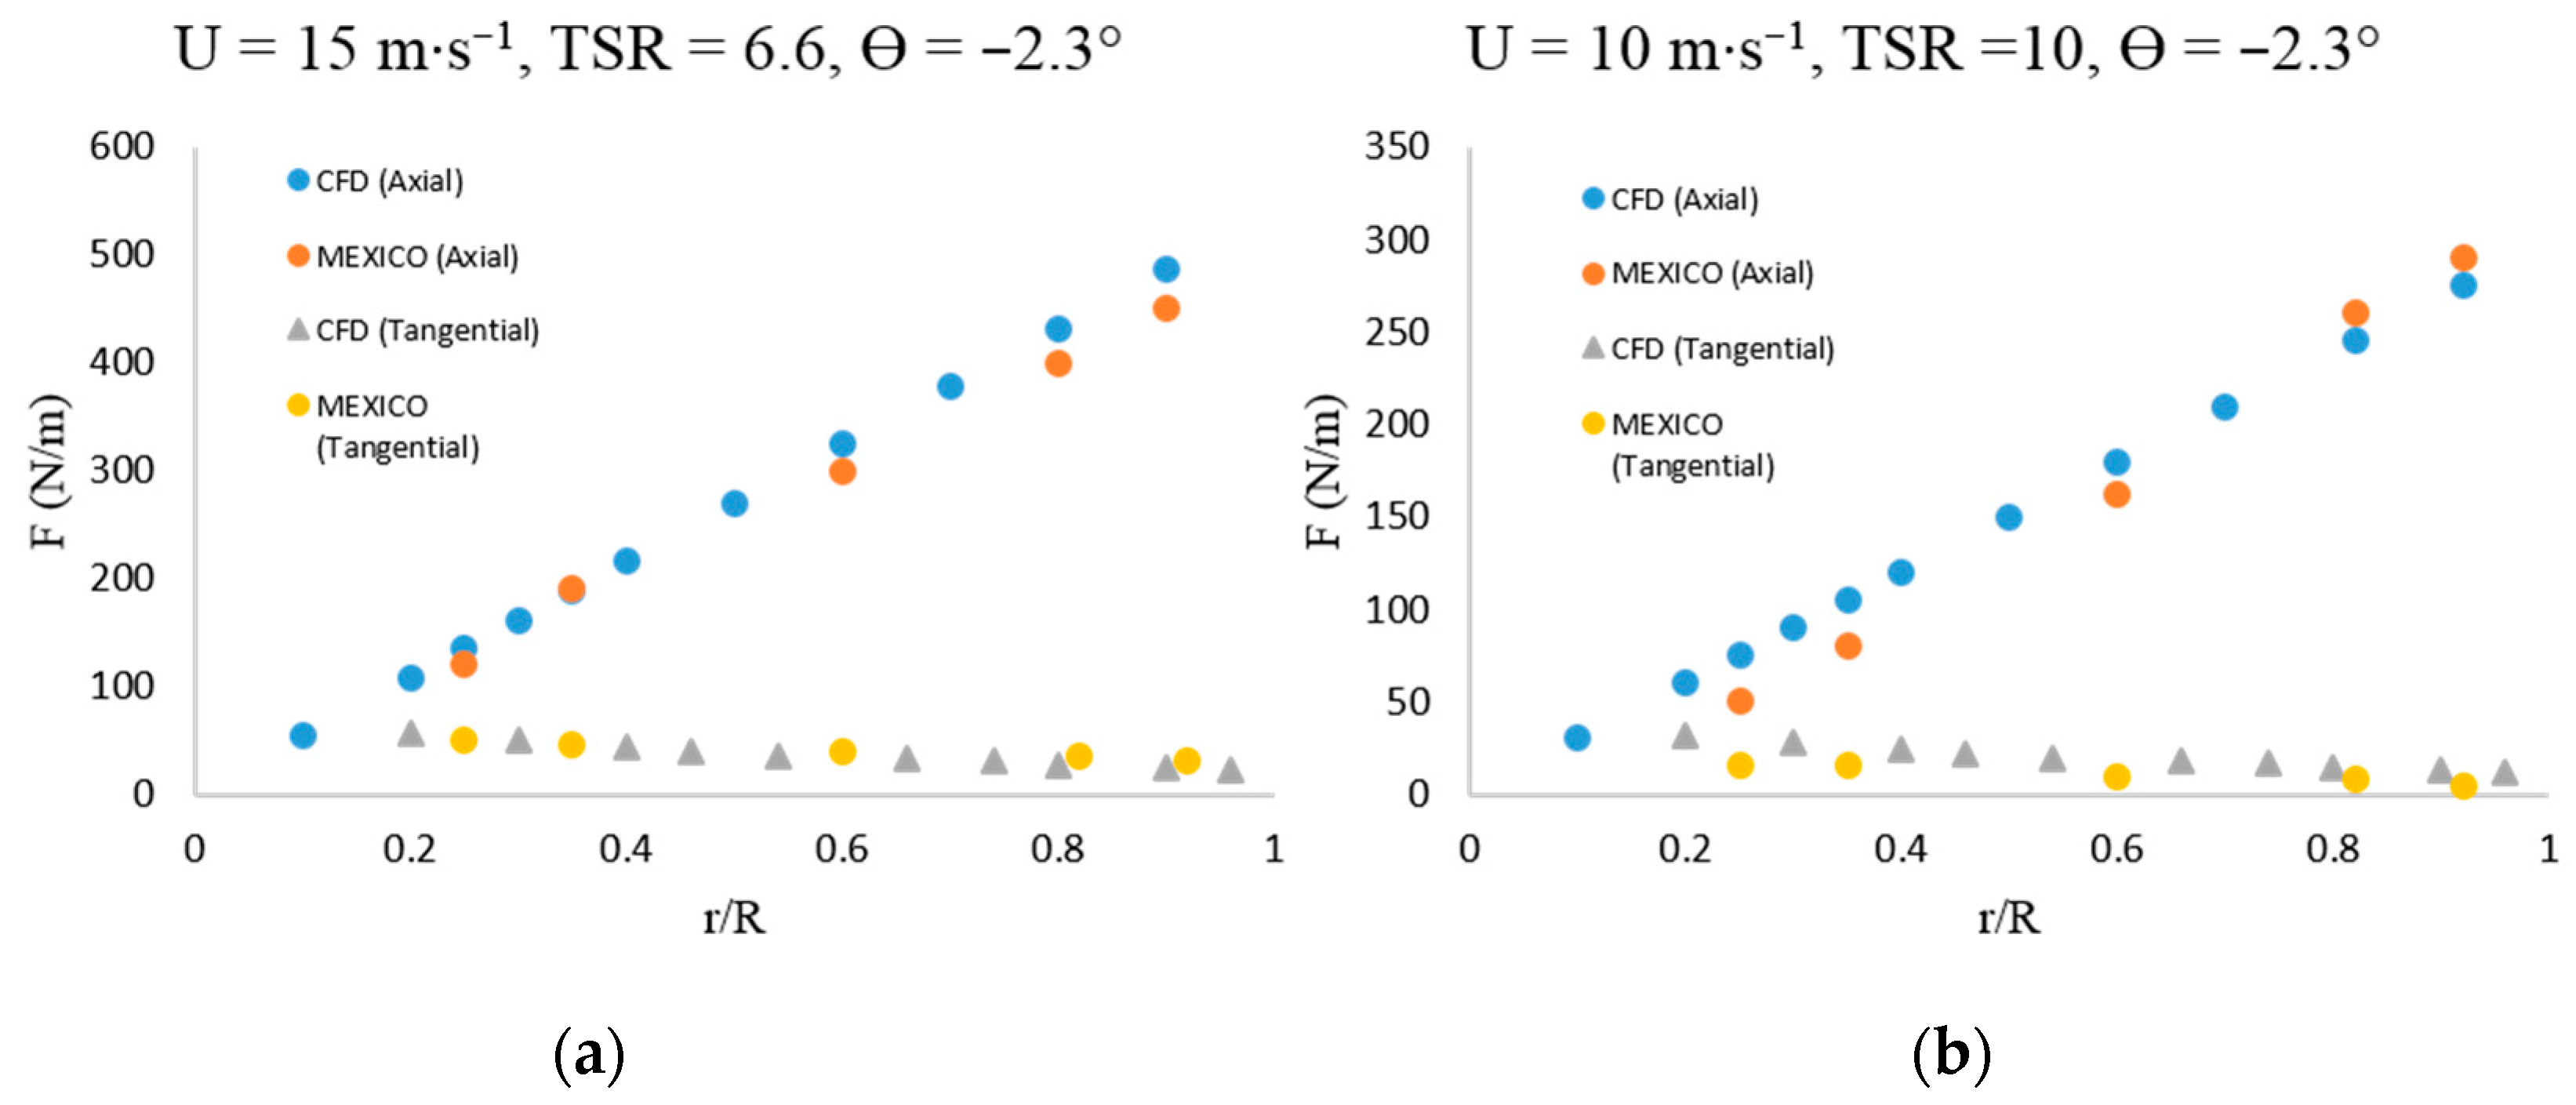
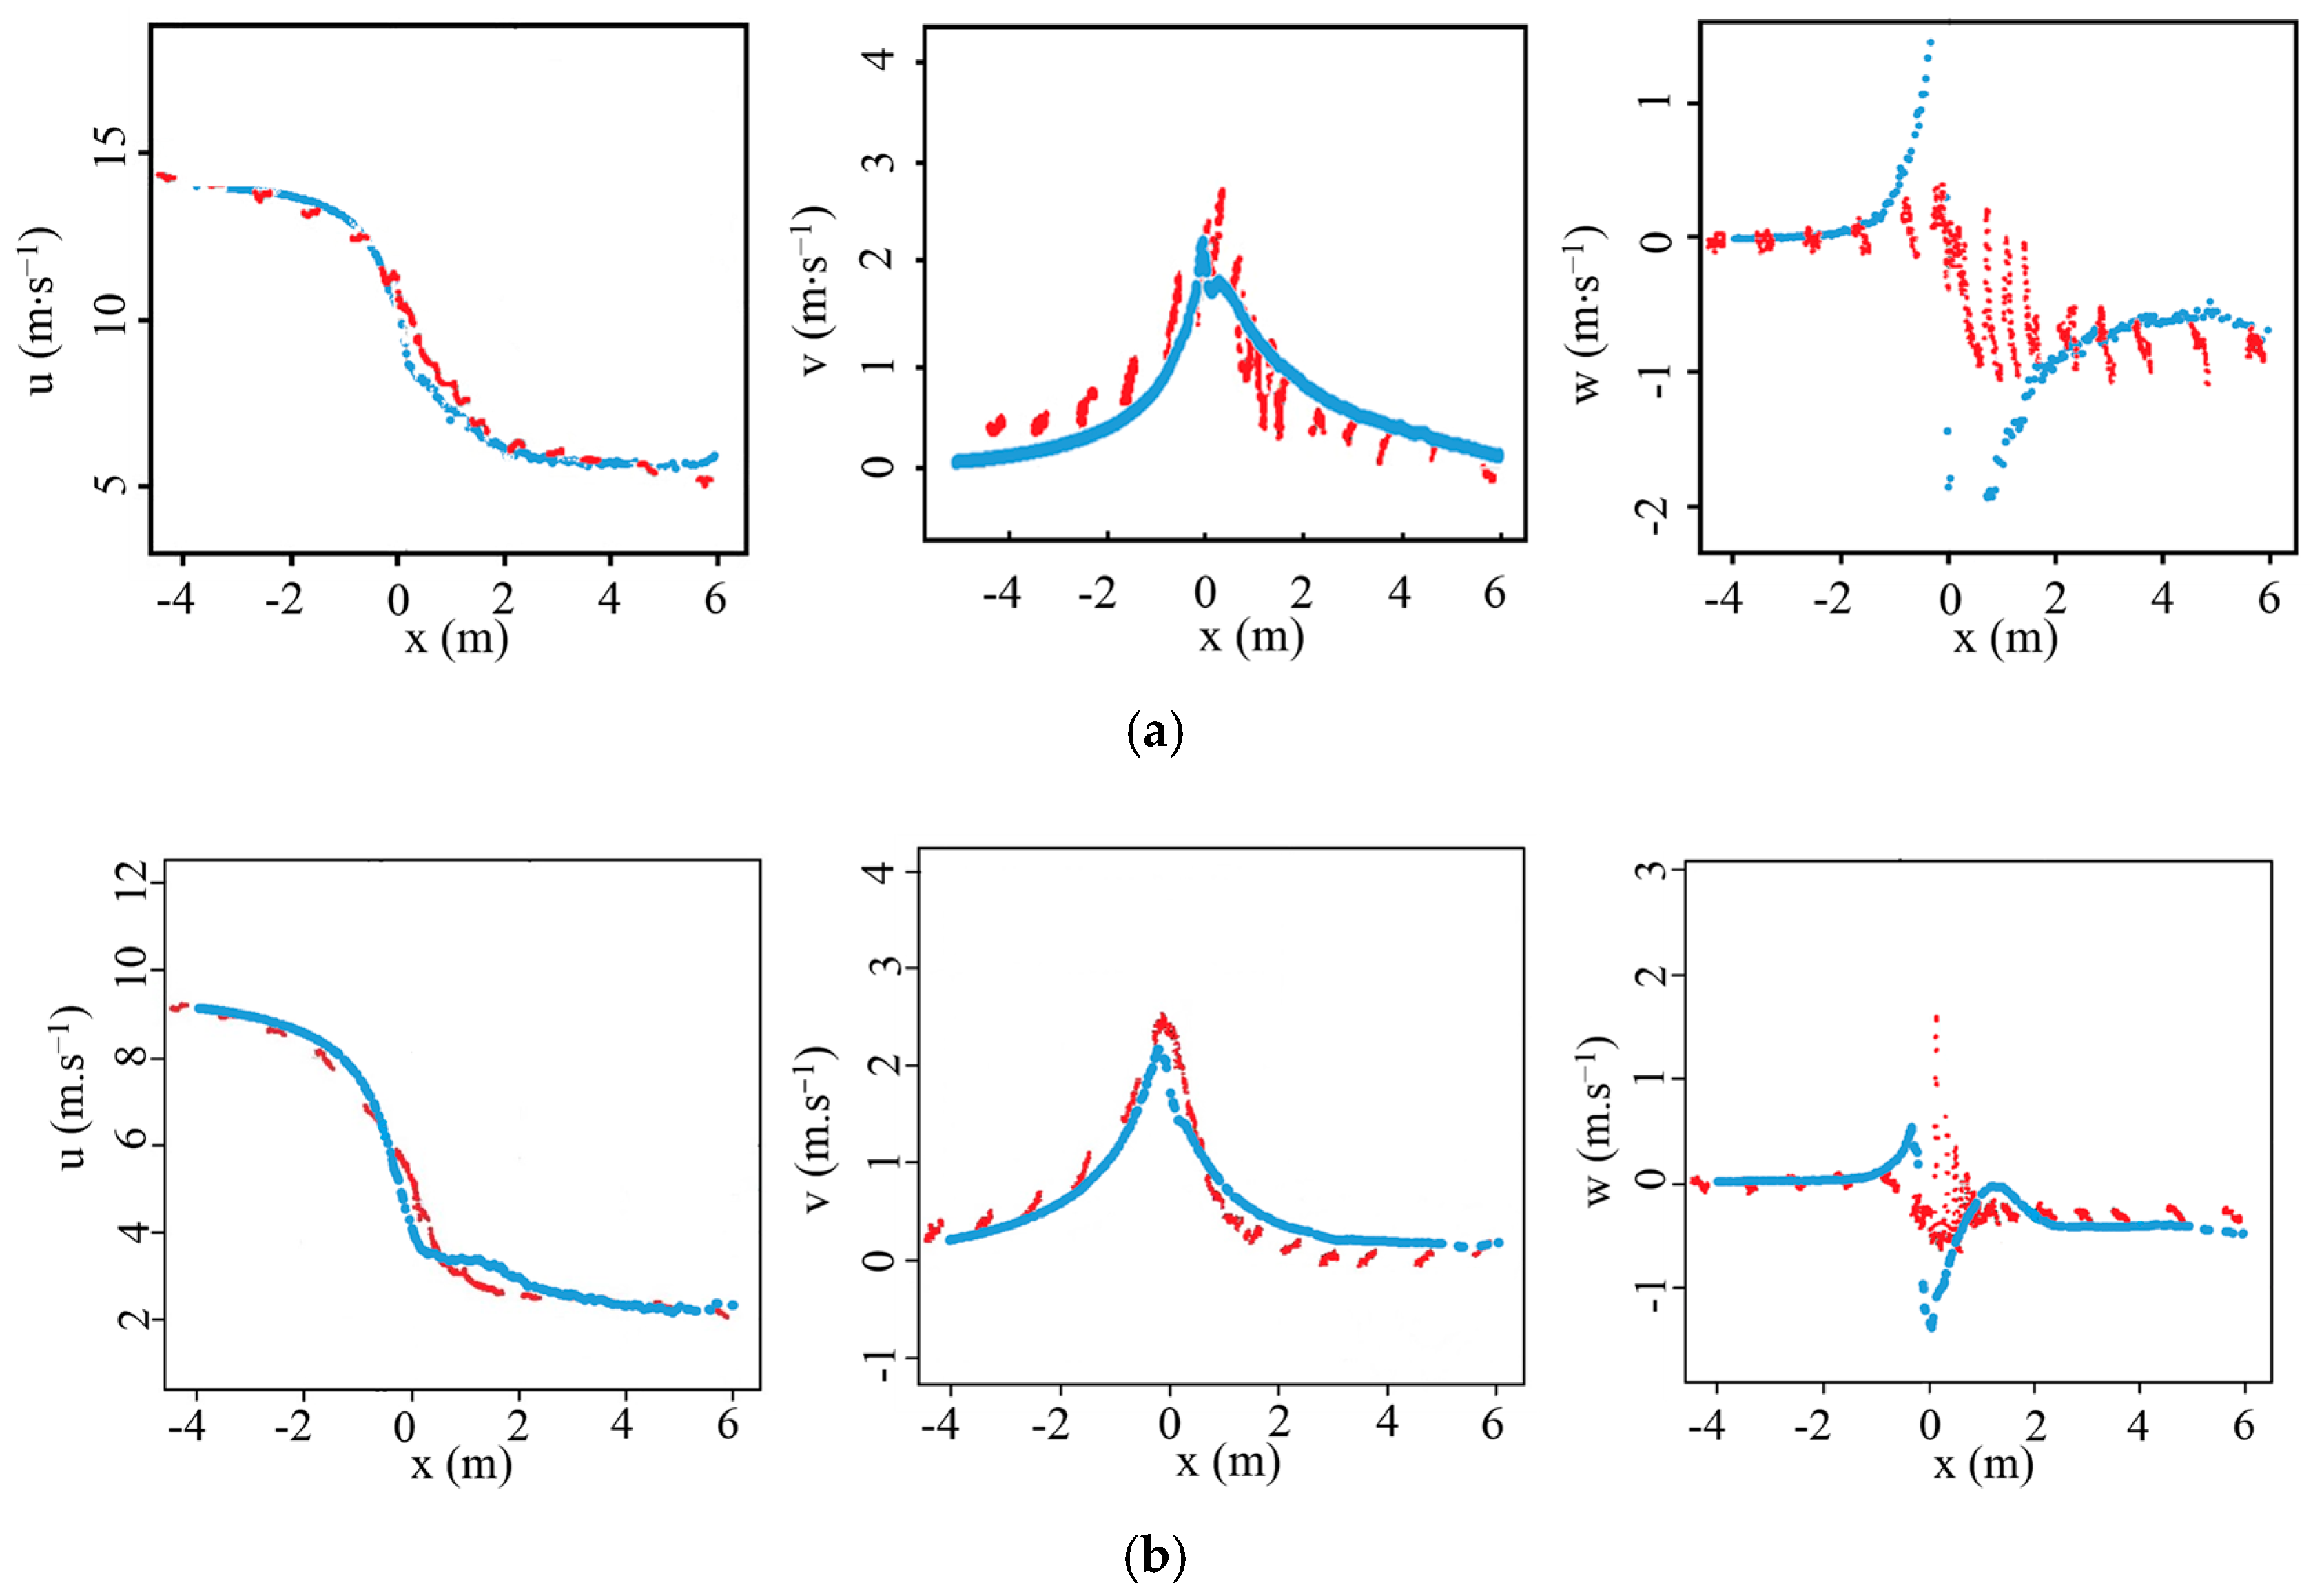
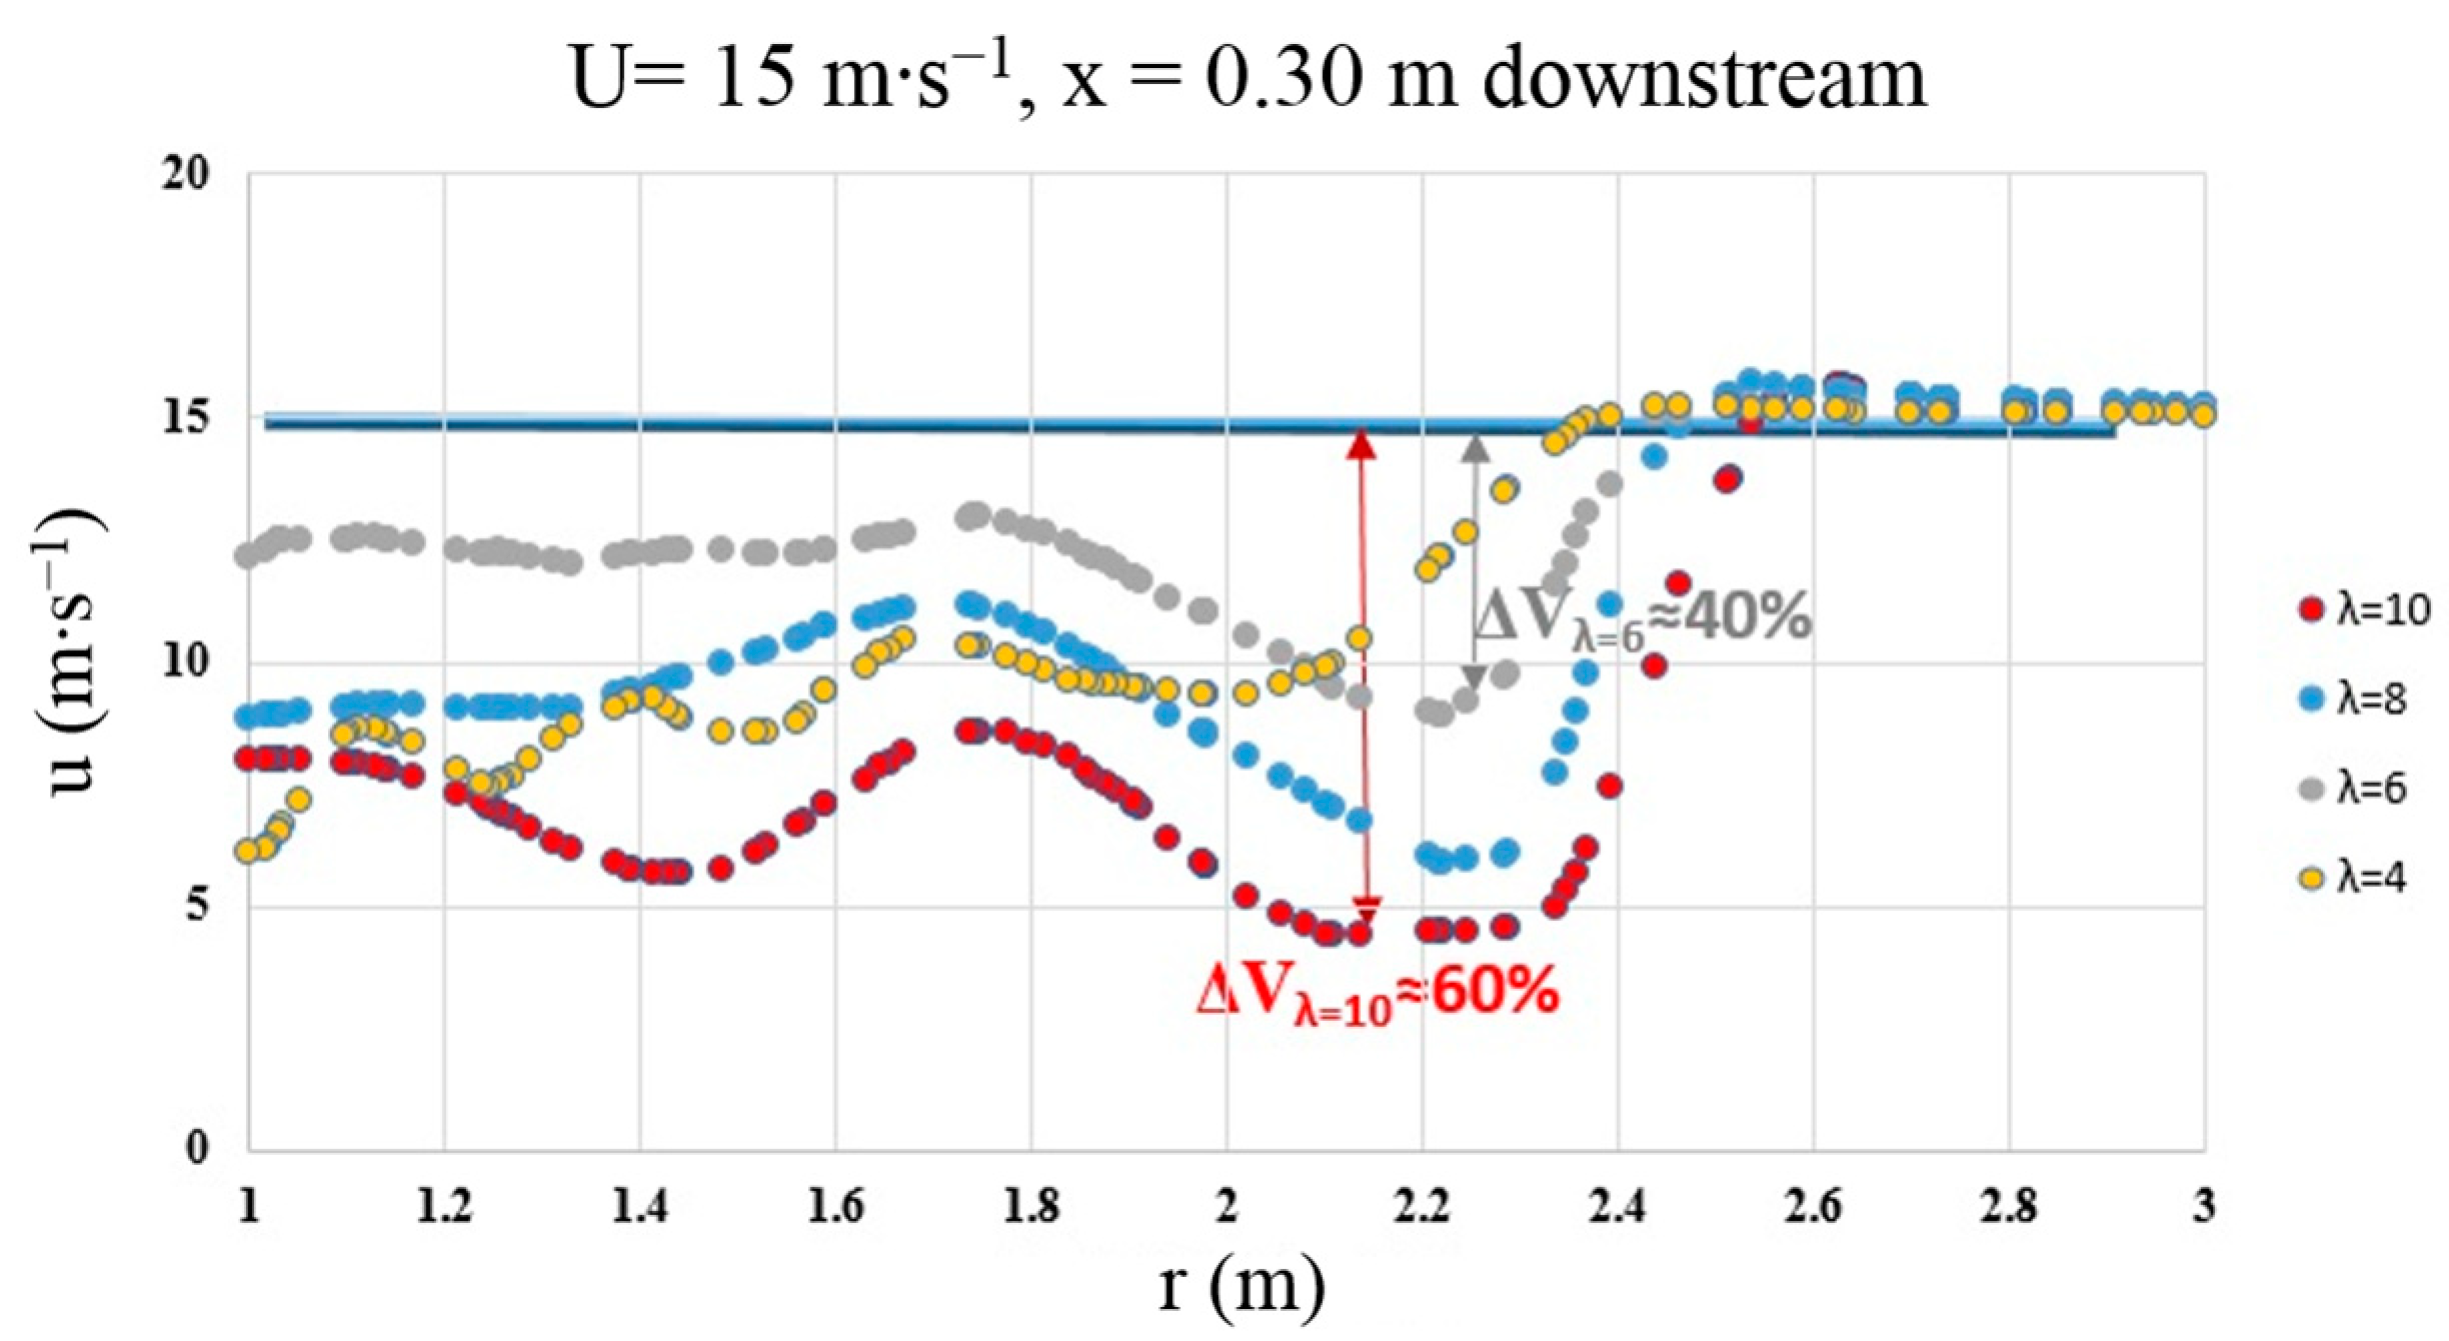
Our work, unlike previous efforts in literature, simulated the near wake of the MEXICO rotor within an extended downstream region including three diameters, while considering other TSR, free-stream velocity and pitch angle operating conditions. The same trend between axial induction and rotor loading was observed in other studies [
27,
31], in which the axial induction significantly increased from TSR = 4.2 to TSR = 10. Furthermore, the rotor loading influences the shape of the velocity profile at several downstream positions (
Figure 10,
Figure 11). While little perturbation to the velocity curves is observed for lower rotor loading, unsteady behavior/oscillation is present for higher rotor loading. The dependence of the velocity deficit on the streamwise distance is clearly more significant for higher TSR. These results agree with other studies in literature [
46].
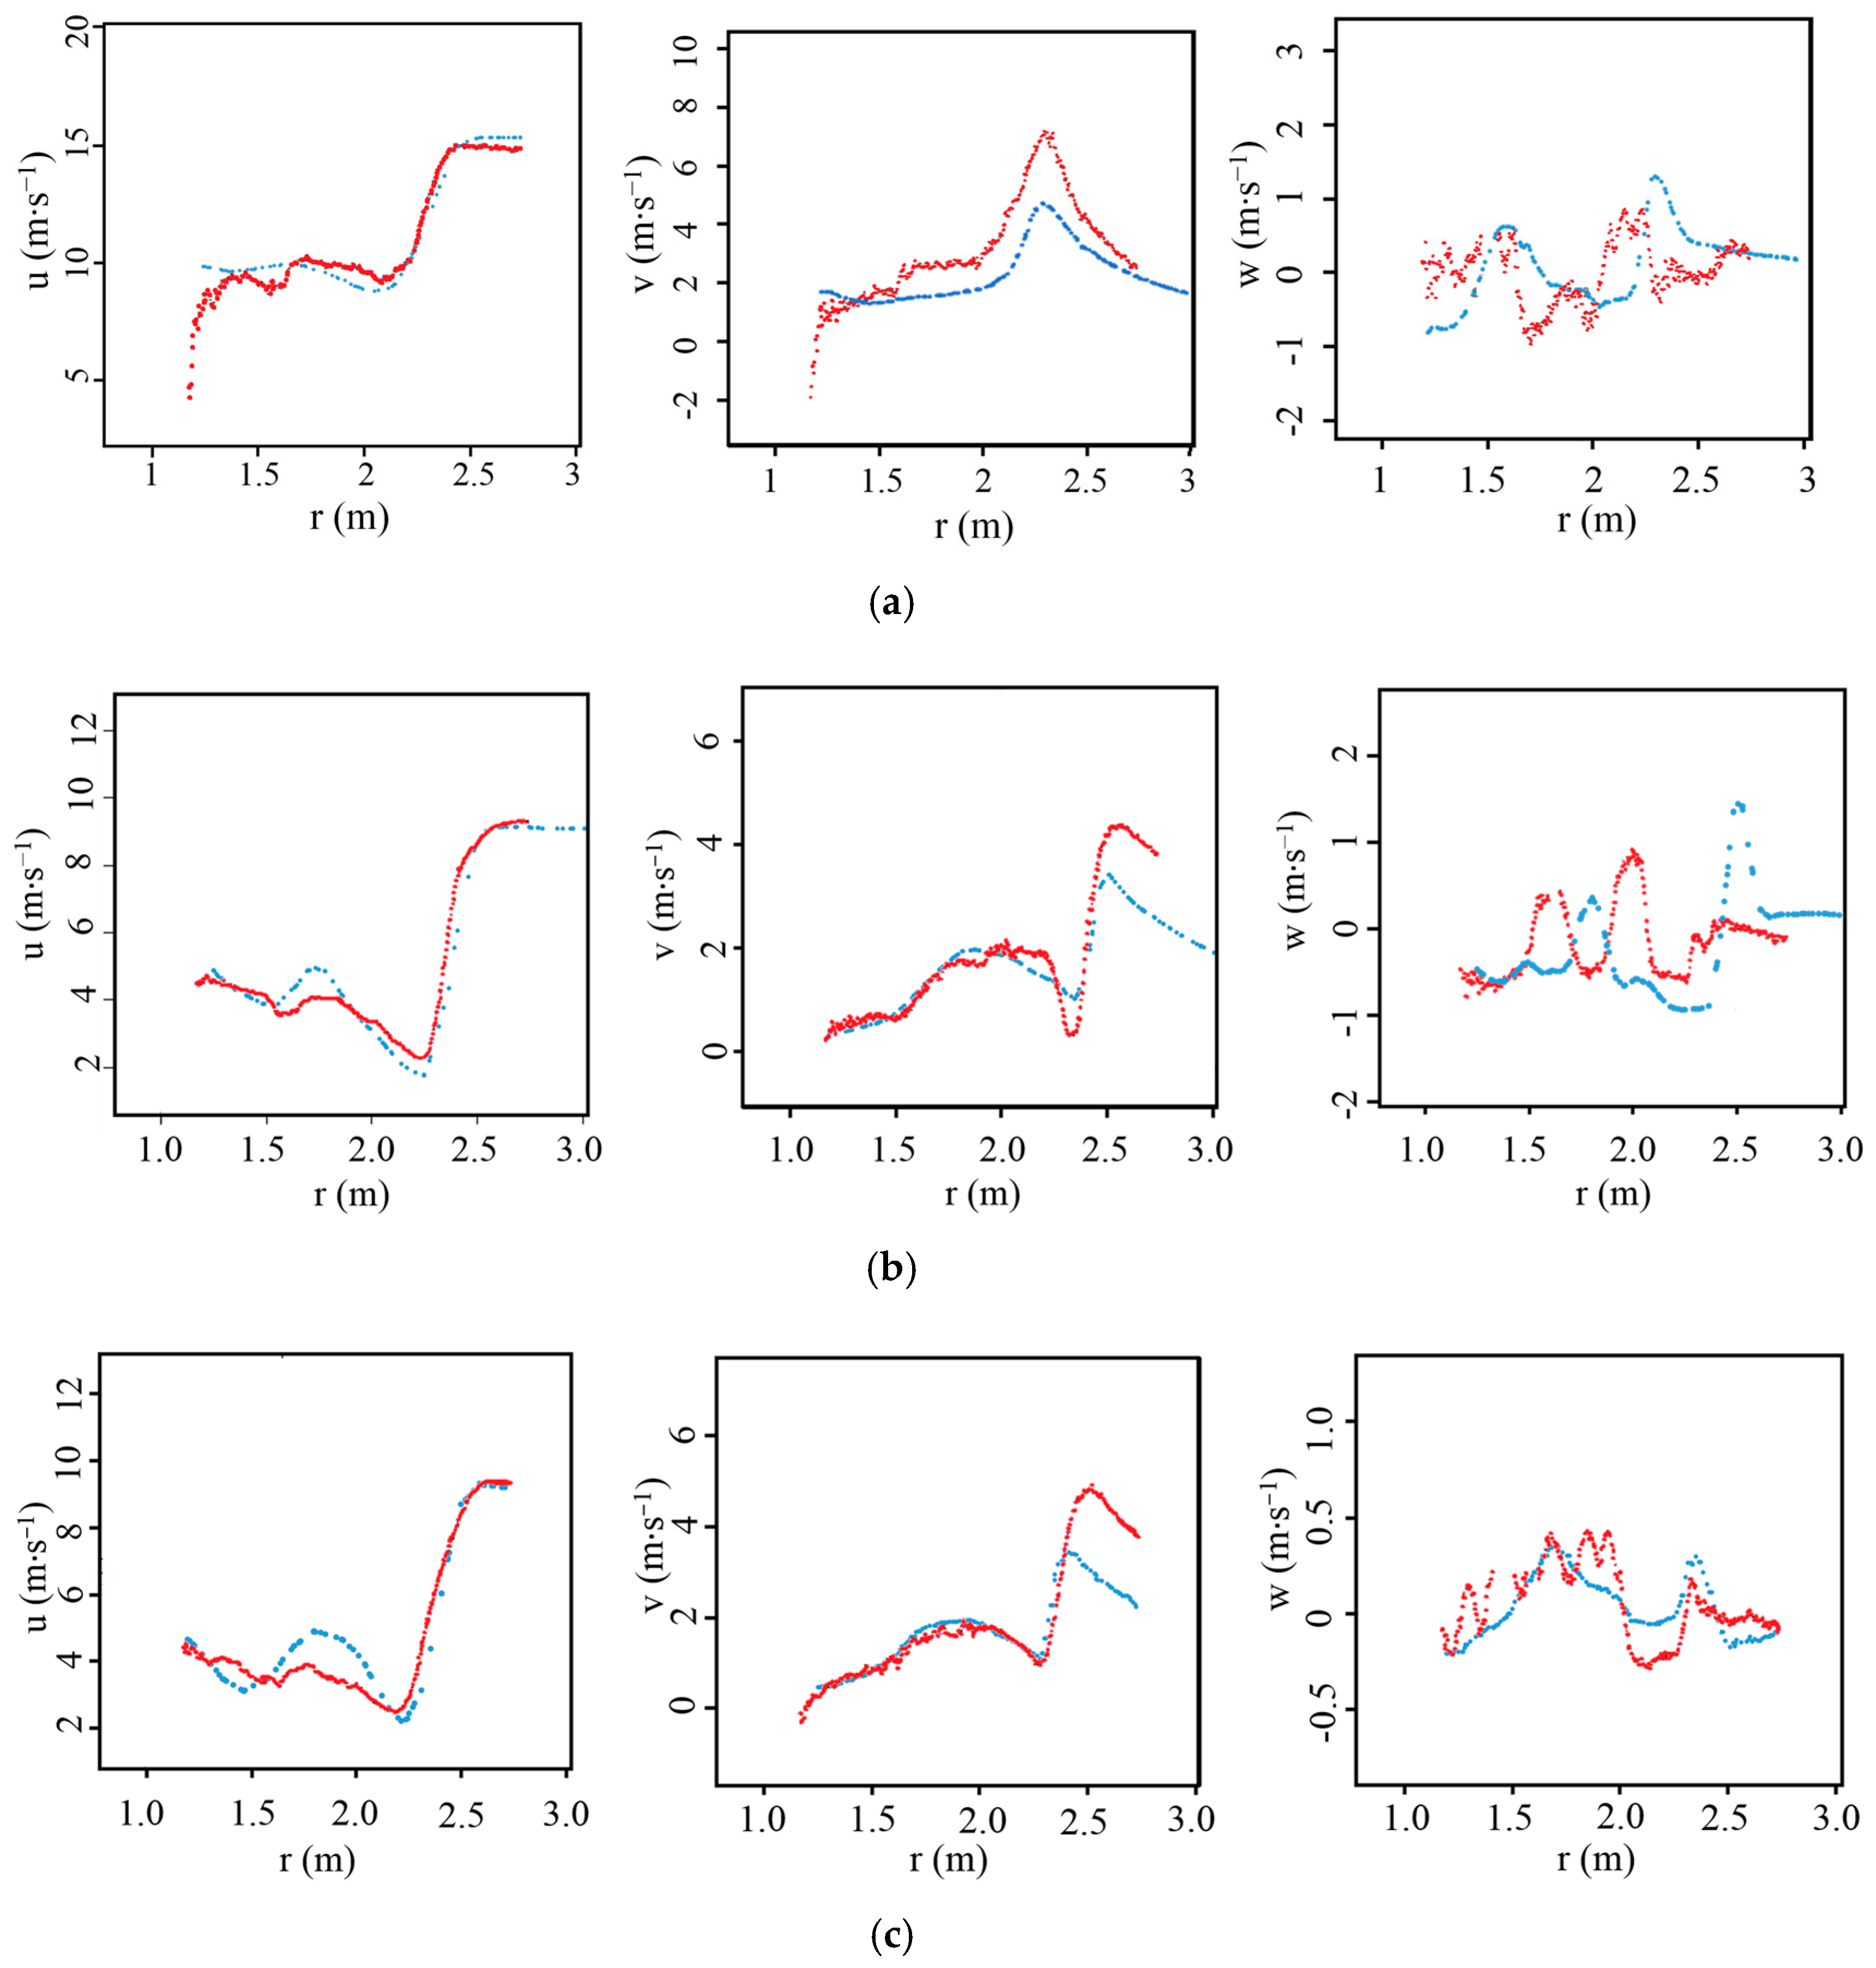
Figure 11 shows the radial traverse in the wake immediately behind the MEXICO rotor at x = 0.3 m, confirming the trend between loading and velocity deficit, even immediately adjacent to the rotor. Moreover, the tip vortices cause the region close to the blade tip to present the highest velocity deficit in comparison to the other blade radial locations; this will determine the wake expansion. Tari et al. [
47] also found that the axial induction of horizontal axis wind turbines increases with the TSR, in which a maximum axial velocity deficit occurs between 0.75 < r/R < 0.9.
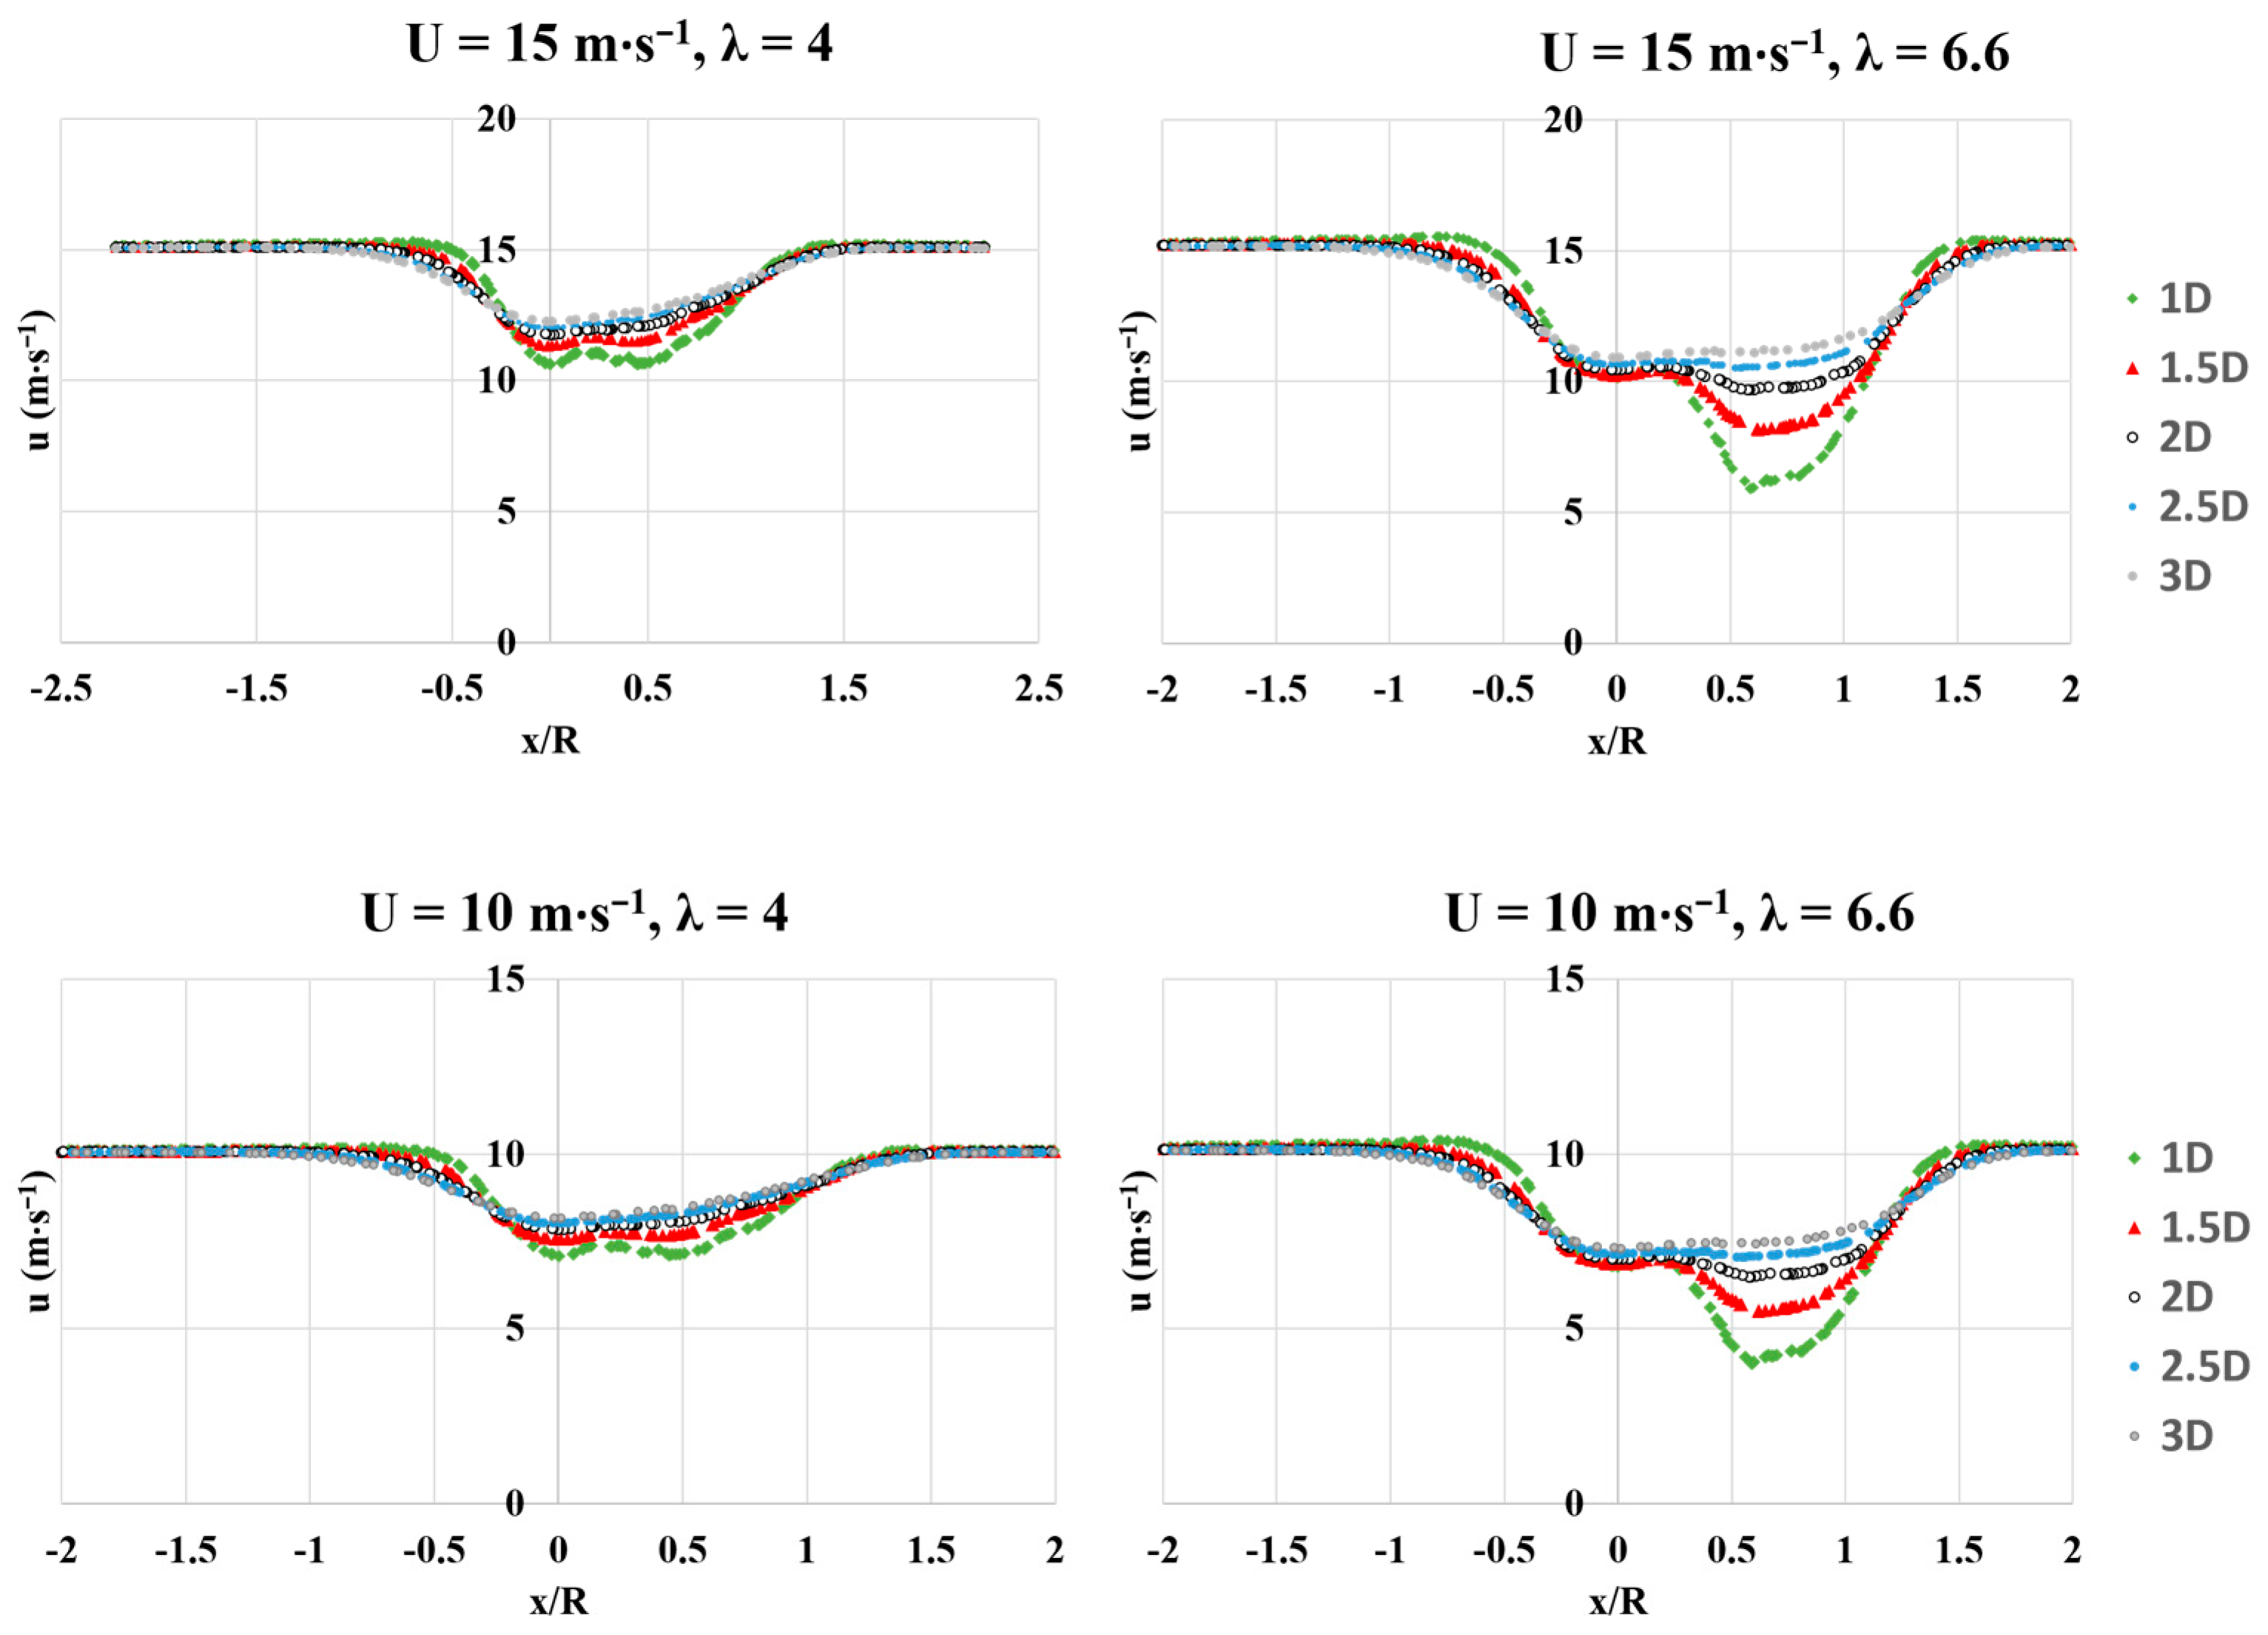
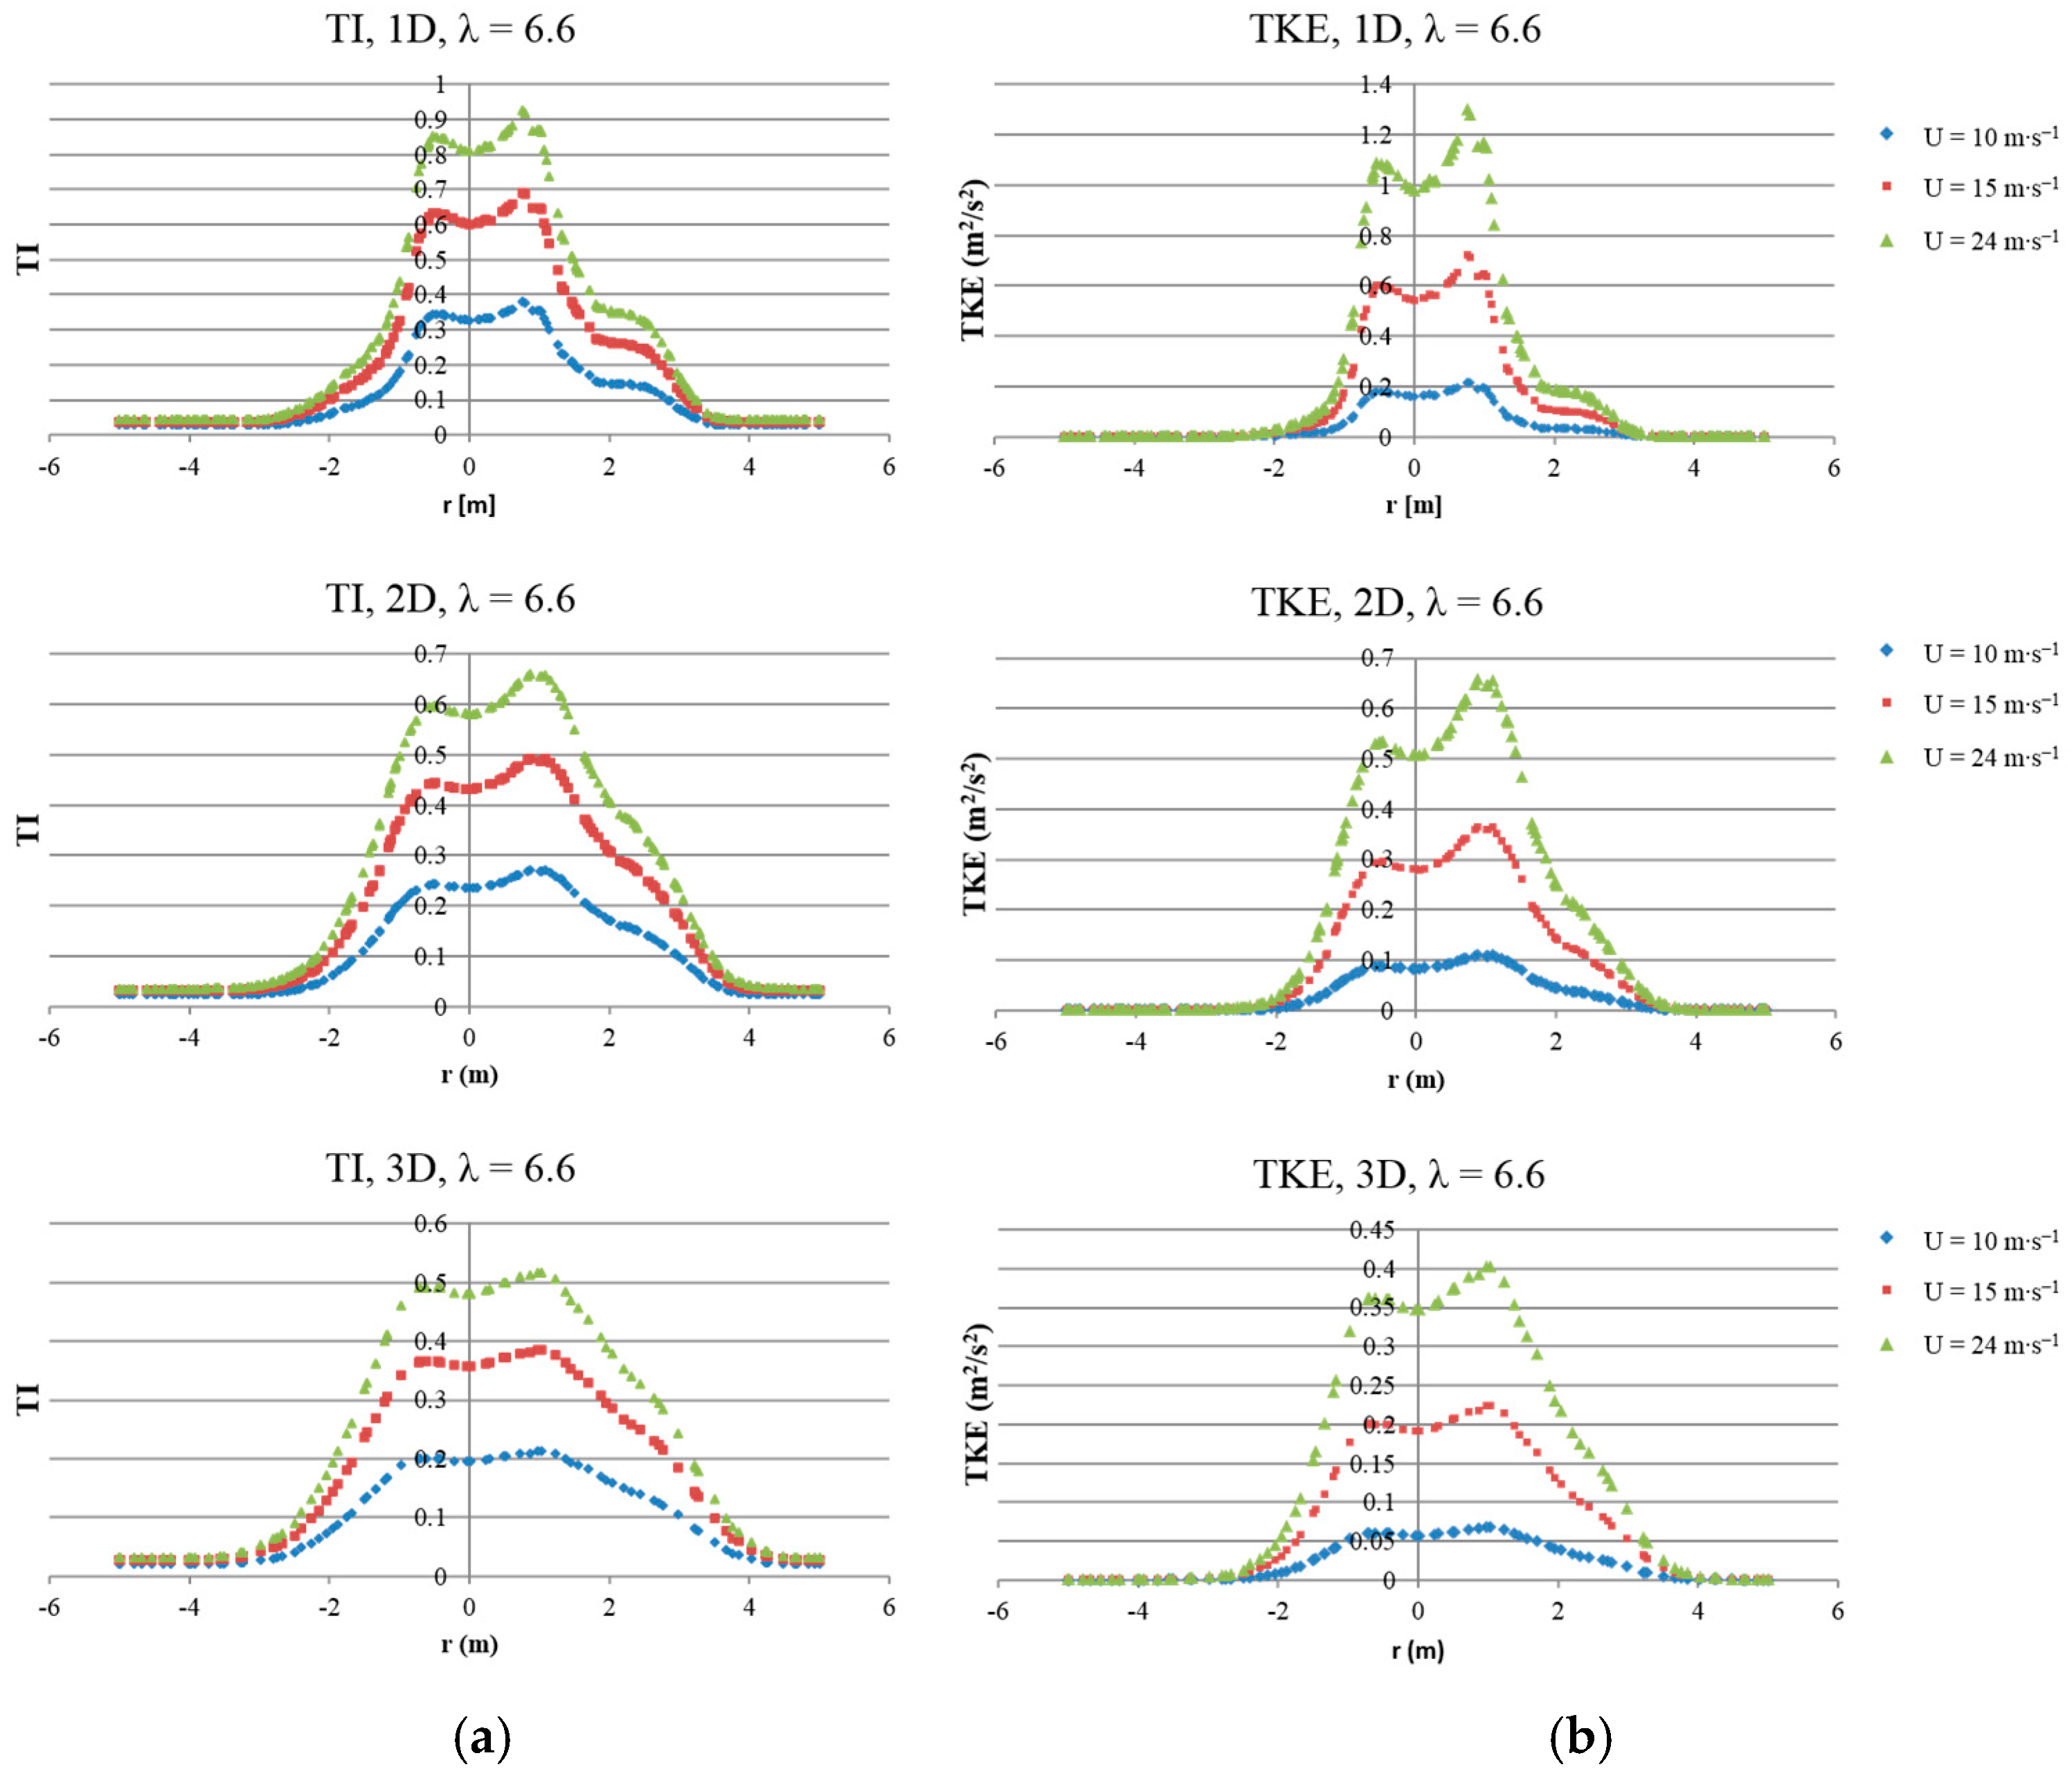
The TI aerodynamic behavior in the near and far wake was also characterized in previous studies. For instance, Shives & Crawford [
48] found that the oscillating /fluctuating behavior is less significant for x/D > 5 in comparison to the near wake, and the curve shape becomes more similar to a Gaussian distribution. This trend was different in comparison to the velocity curve behavior, where the velocity curve starts to define its shape at x/D > 3. Chamorro et al. [
49] investigated the effect of the Reynolds number on the wake characteristics, finding that the TI profile in the near wake is dependent on the Reynolds number, and independent at approximately x/D = 4. It is pointed that the non-uniformity of the boundary layer influences the TI profiles to present relatively asymmetric distribution, which could also explain the asymmetric shape of the velocity profile (
Figure 10). Additionally, the effect of the TI could still be observed even up to 12 rotor diameters downstream. Xie and Archer [
50] found that the streamwise component of the Turbulence Kinetic Energy (TKE) is dominant for horizontal axis wind turbines. Turbulence Intensity contours showed that the streamwise component of the TI reaches a maximum at 5D, which extends up to approximately 15D, when it starts decaying. A low TI region happens immediately behind the rotor, which contradicts the TI trend behavior found in our study (
Figure 9). Zhou et al. [
23] investigated the influence of the inflow characteristics on the near wake of the NREL Phase IV, finding that the combination of inflow turbulence and wind shear can also have an impact on the turbulence generation in the near wake.
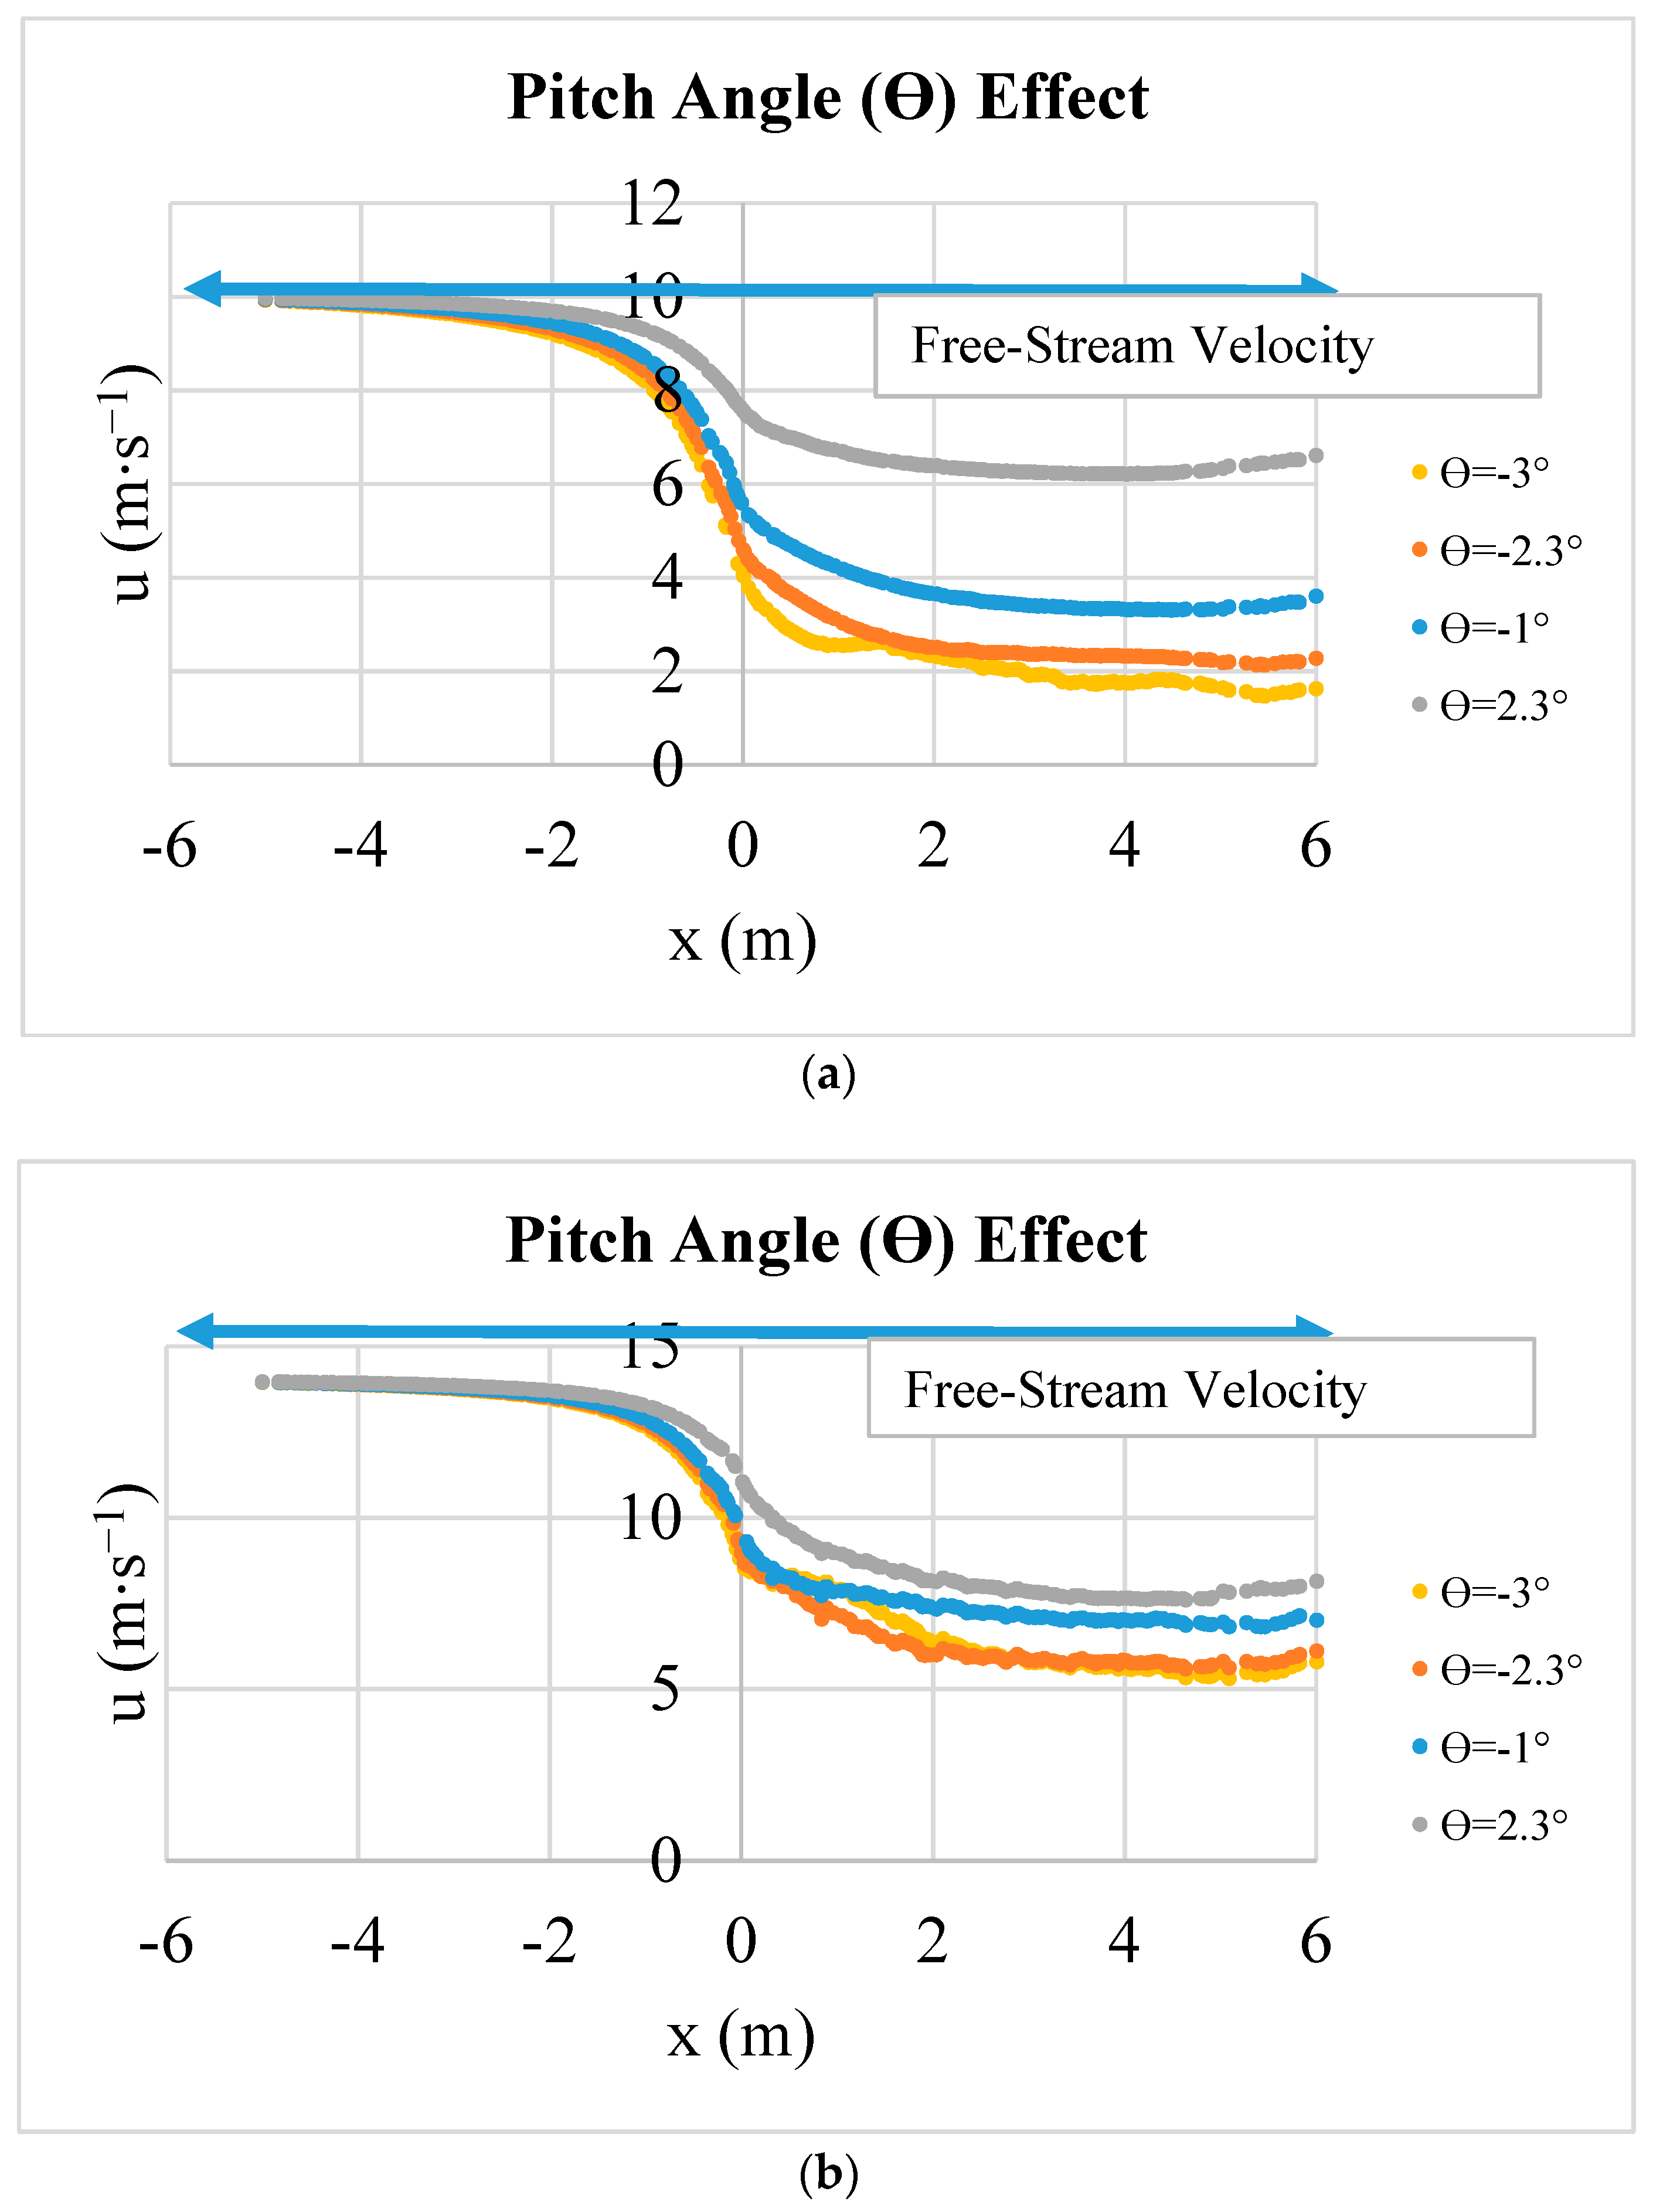
The pitch angle is proven to have impact on wind farms and wind many researchers. Markou et al. [
51] showed that individual-pitch controllers allowed fatigue load reductions for offshore applications, while not significantly influencing the far wake behavior. Tests for a wake compensator resulted in a minimal reduction in average output power of 0.05% for 10D downstream distance. Kanev et al. [
52] showed the benefits of using a pitch-based system for wind farms with turbine distances from 6D to 7D, in which 1% to 4% of the wake losses were regained yearly. Additionally, a lifetime extension of 1% was achieved by reducing fatigue loads. In the referred study, the wake loss reduction was found to be insensitive to a particular farm layout. Even higher benefits could be achieved by combining pitch-based and yaw-based wind direction wise systems, in which a pitch-based system would be operated for wind directions well-aligned with the rows of turbines, while yaw system would act as the wind comes at an angle in respect to the rows. Symmetrical layouts combining both systems could achieve almost the sum of the power production benefits of the two separate strategies.
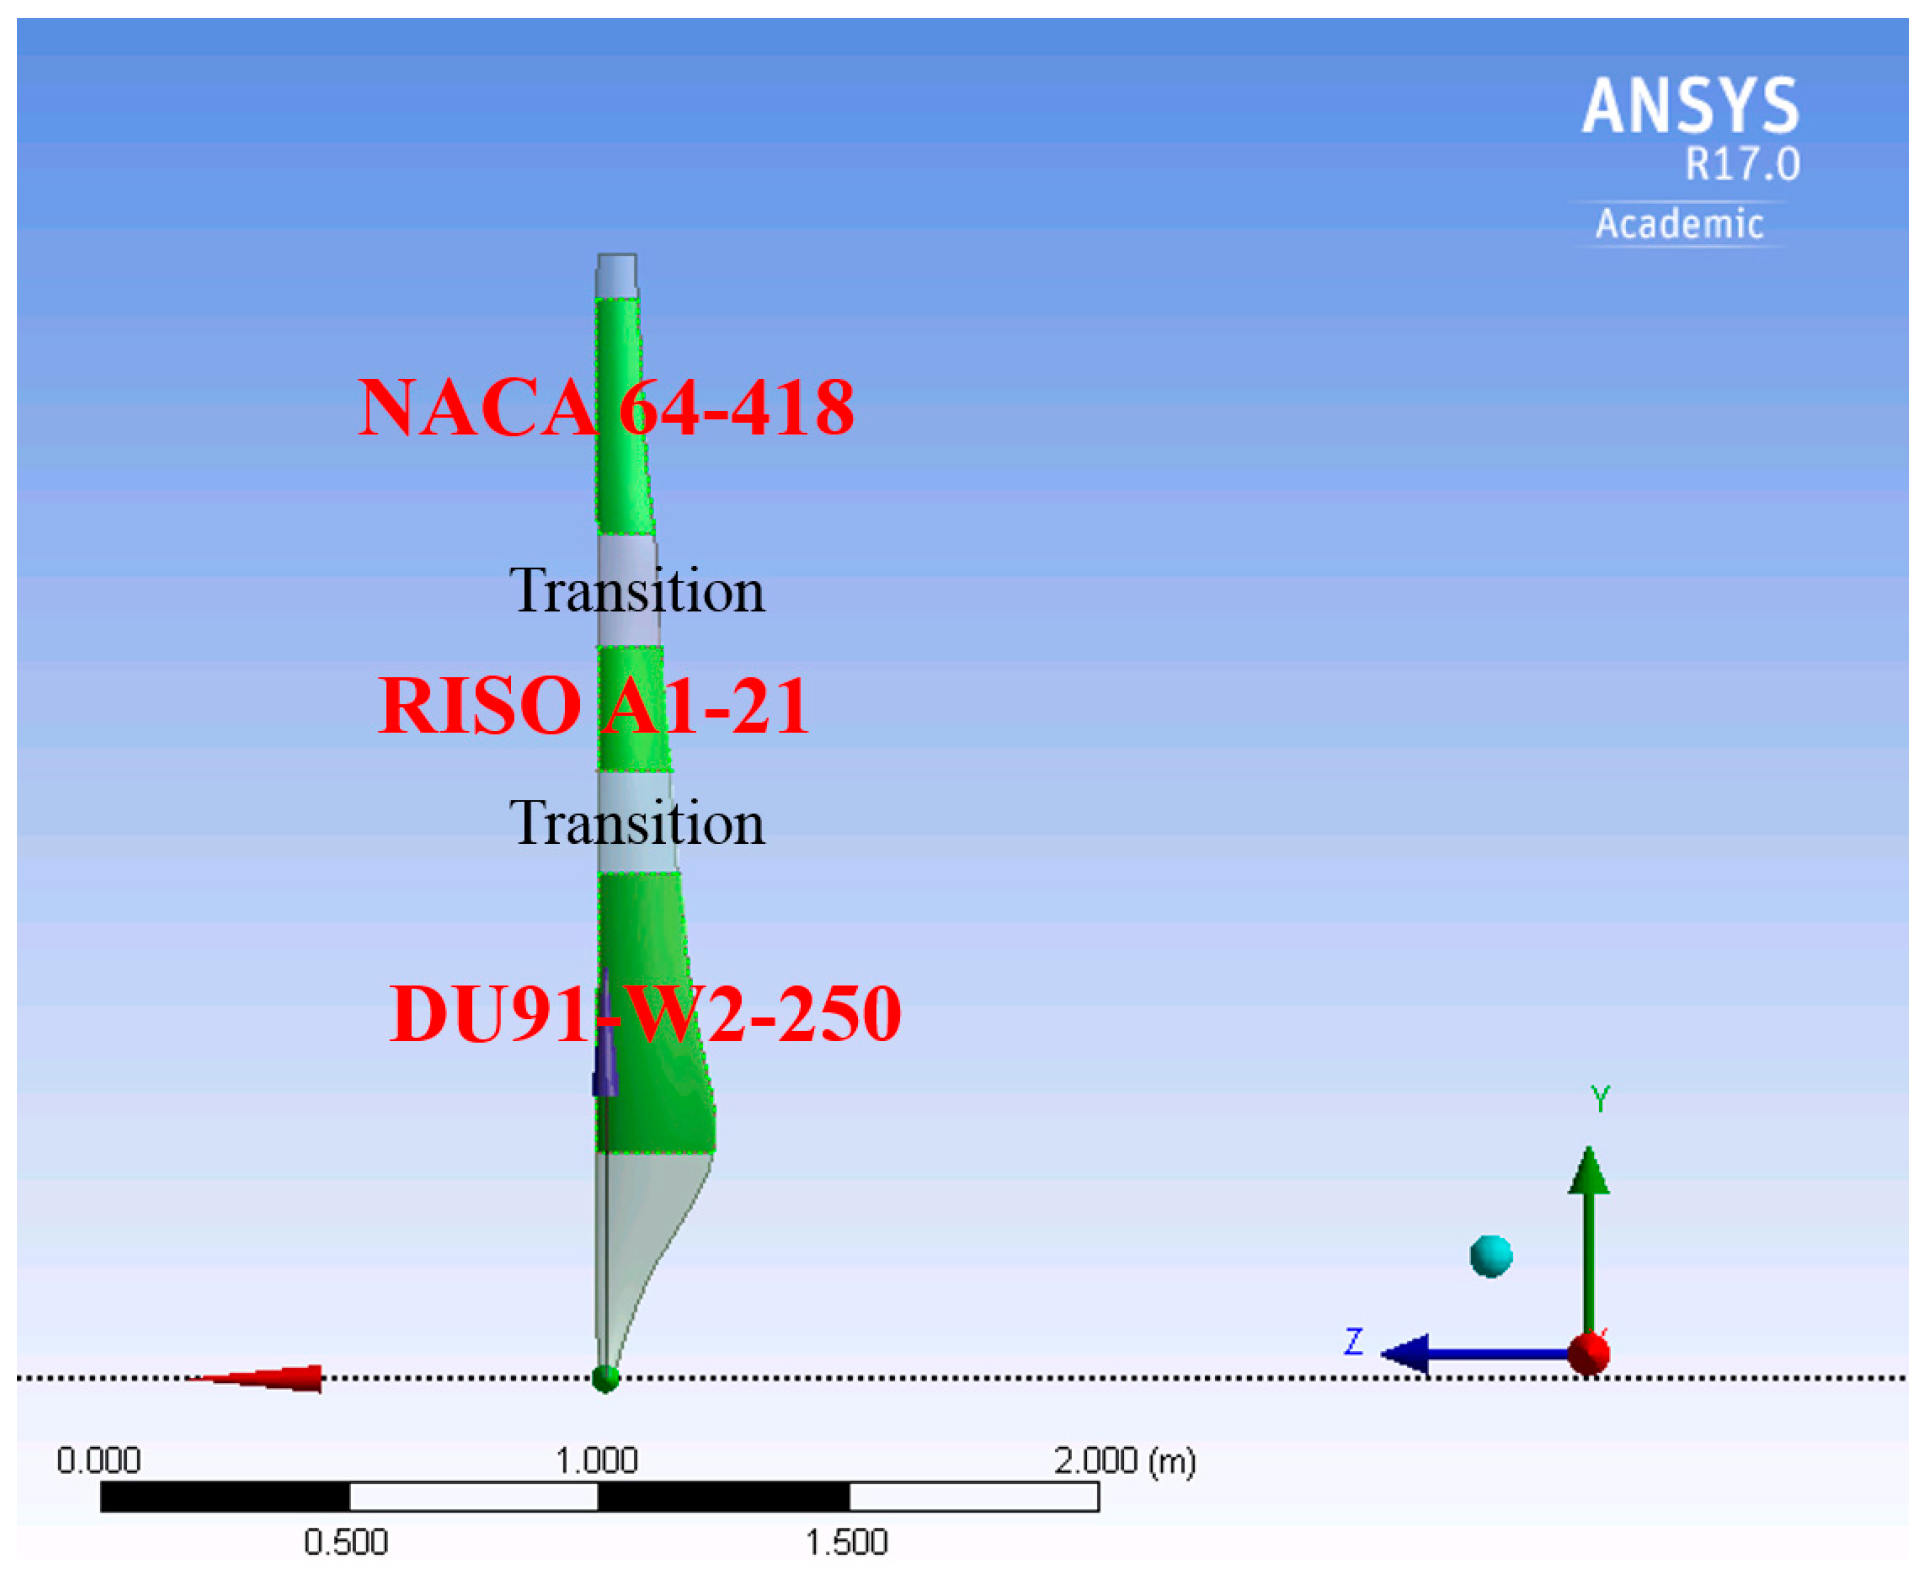
Wake characteristics are closely related to the aerodynamic behavior of the blades. In this research, a numerical CFD model was developed based on MRF approach, which is a CFD technique where a reference frame rotates instead of the body itself. The MRF technique models the blade loading effect by applying an axial induction through the central disc. As a consequence of the axial induction exerted on the central disc, the velocity in the wake has a deficit in comparison with the free-stream velocity. Essentially, this is the same effect that blade loading induces on the wake, producing a velocity-deficit by extracting kinetic energy from the free-stream wind. The order of magnitude of the loading on the blades is a function of the thickness of the moving reference frame (rotational central disc), meaning that a thicker frame will have higher axial induction.
There are many different CFD modelling techniques suitable to mimic experiments. In this work, the main objective is to implement a steady-state CFD model for a quick evaluation of wake effects, aiming to create a computational tool to propose further improvements on the design of wind farm layout. It is important to emphasize that a Fluid-Solid Interaction (FSI) model of the MEXICO rotor is out of the scope of this work. A FSI model would elevate the computational expenses to the point of preventing the applicability of the model to evaluate multiple operational conditions in a reduced time. As we previously stated, the main objective of this research is to develop a computational tool capable of simulating wind turbine operation under variable operating conditions. The MRF technique is capable of representing the axial induction of the wake, allowing the simulation of variable wind operating conditions in a faster way. However, an accurate computation of the torque (consequently mechanical power) would require a FSI model. In these cases when steady state models using MRF approach are implemented, it is recommended to use a hybrid approach: the validated CFD results are utilized to evaluate the wake in terms of velocity deficit and turbulence flow field, and a computational model based on a BEM code could be used to compute the output power.
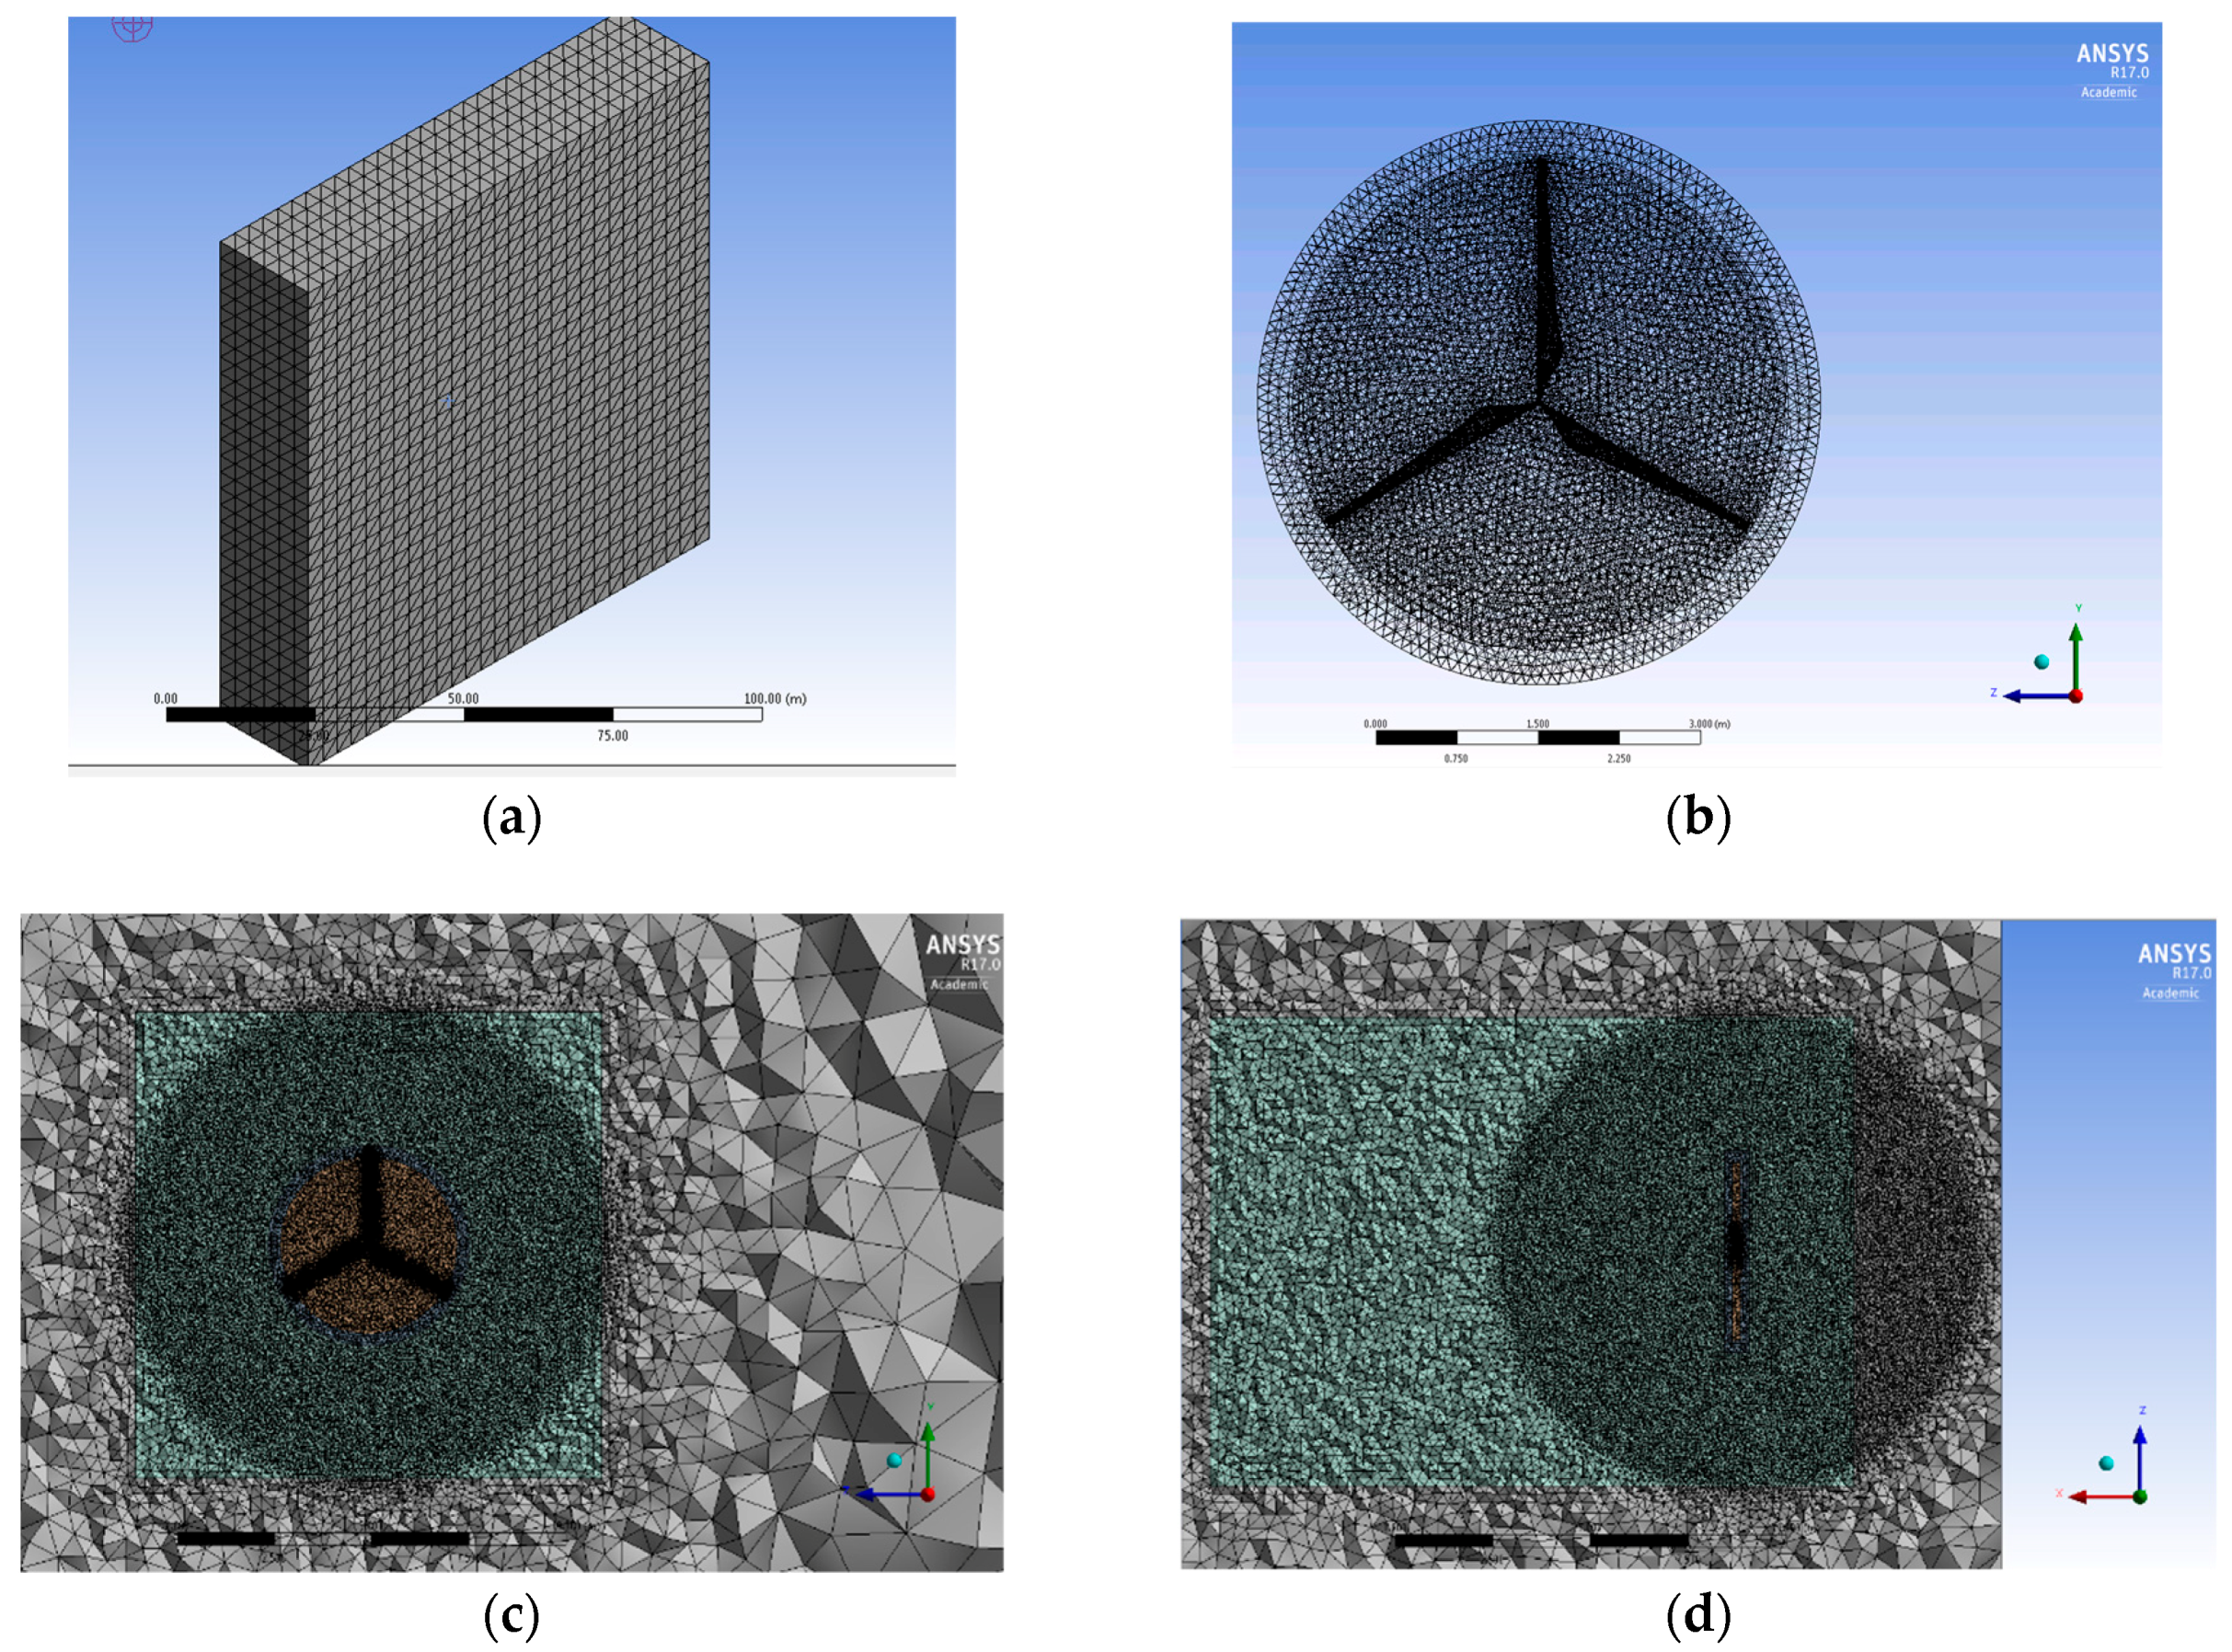
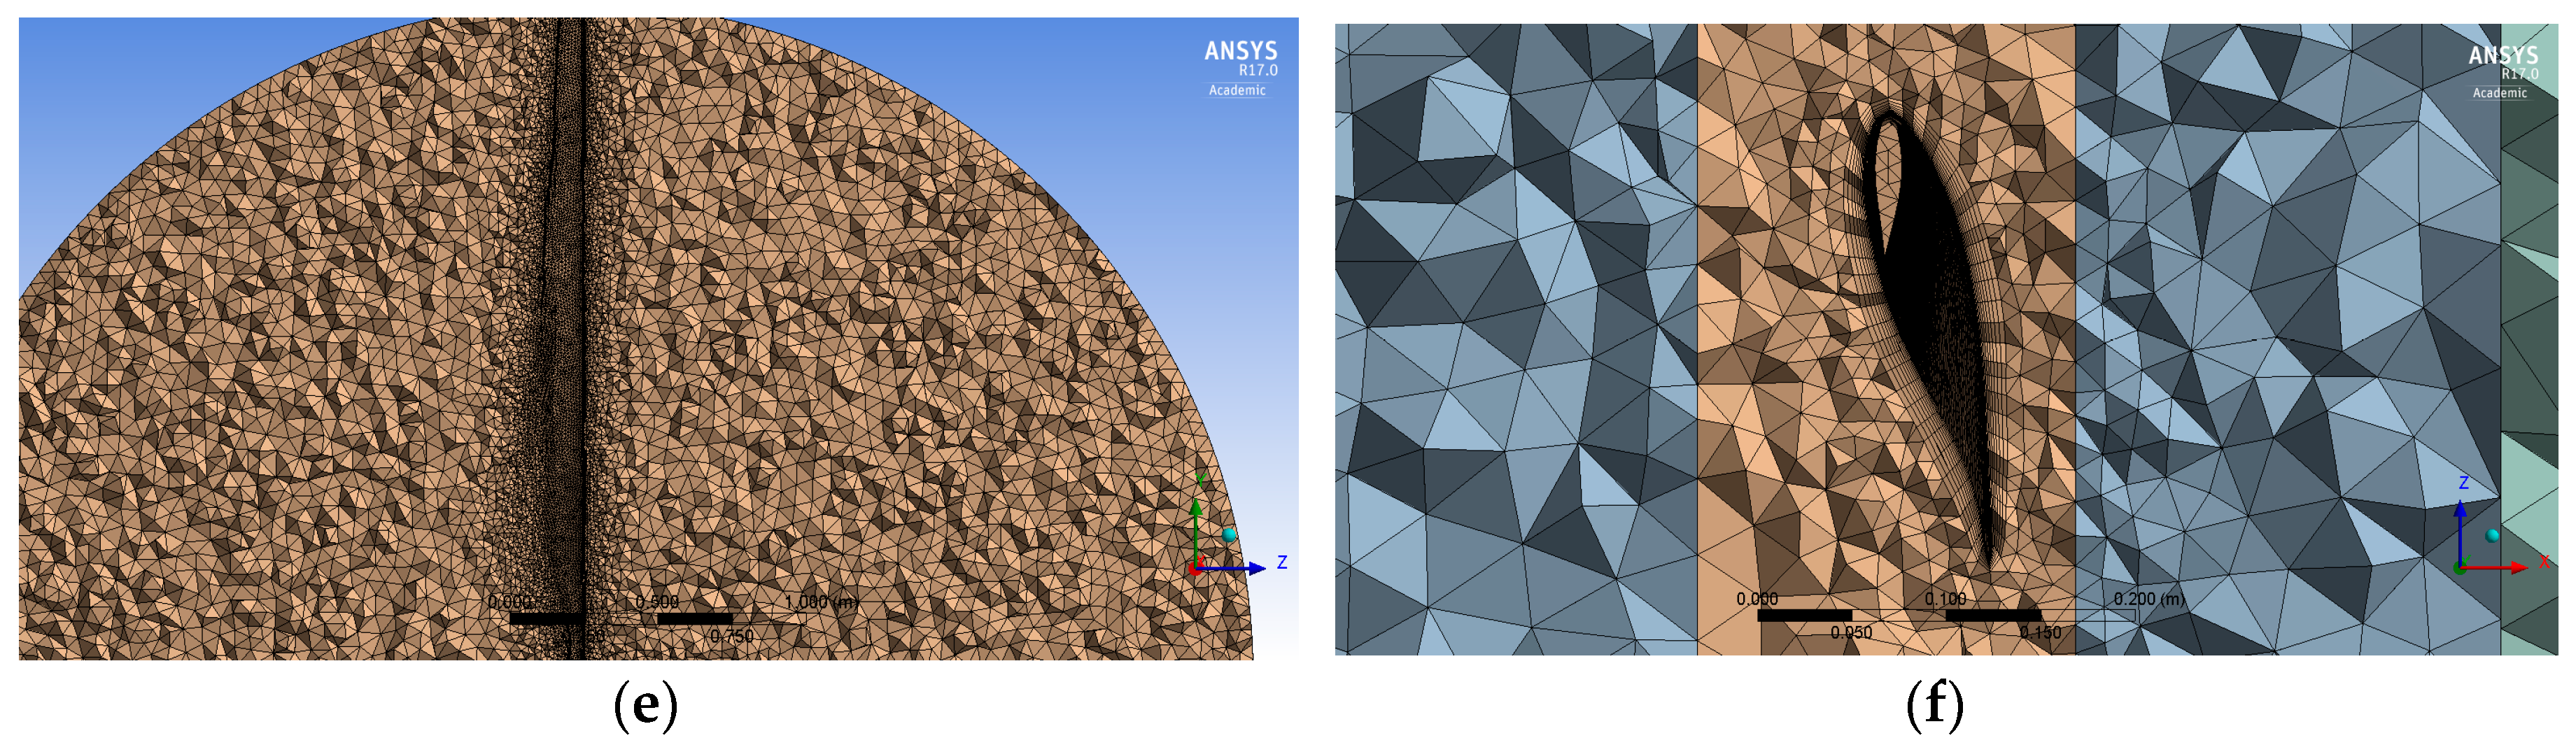
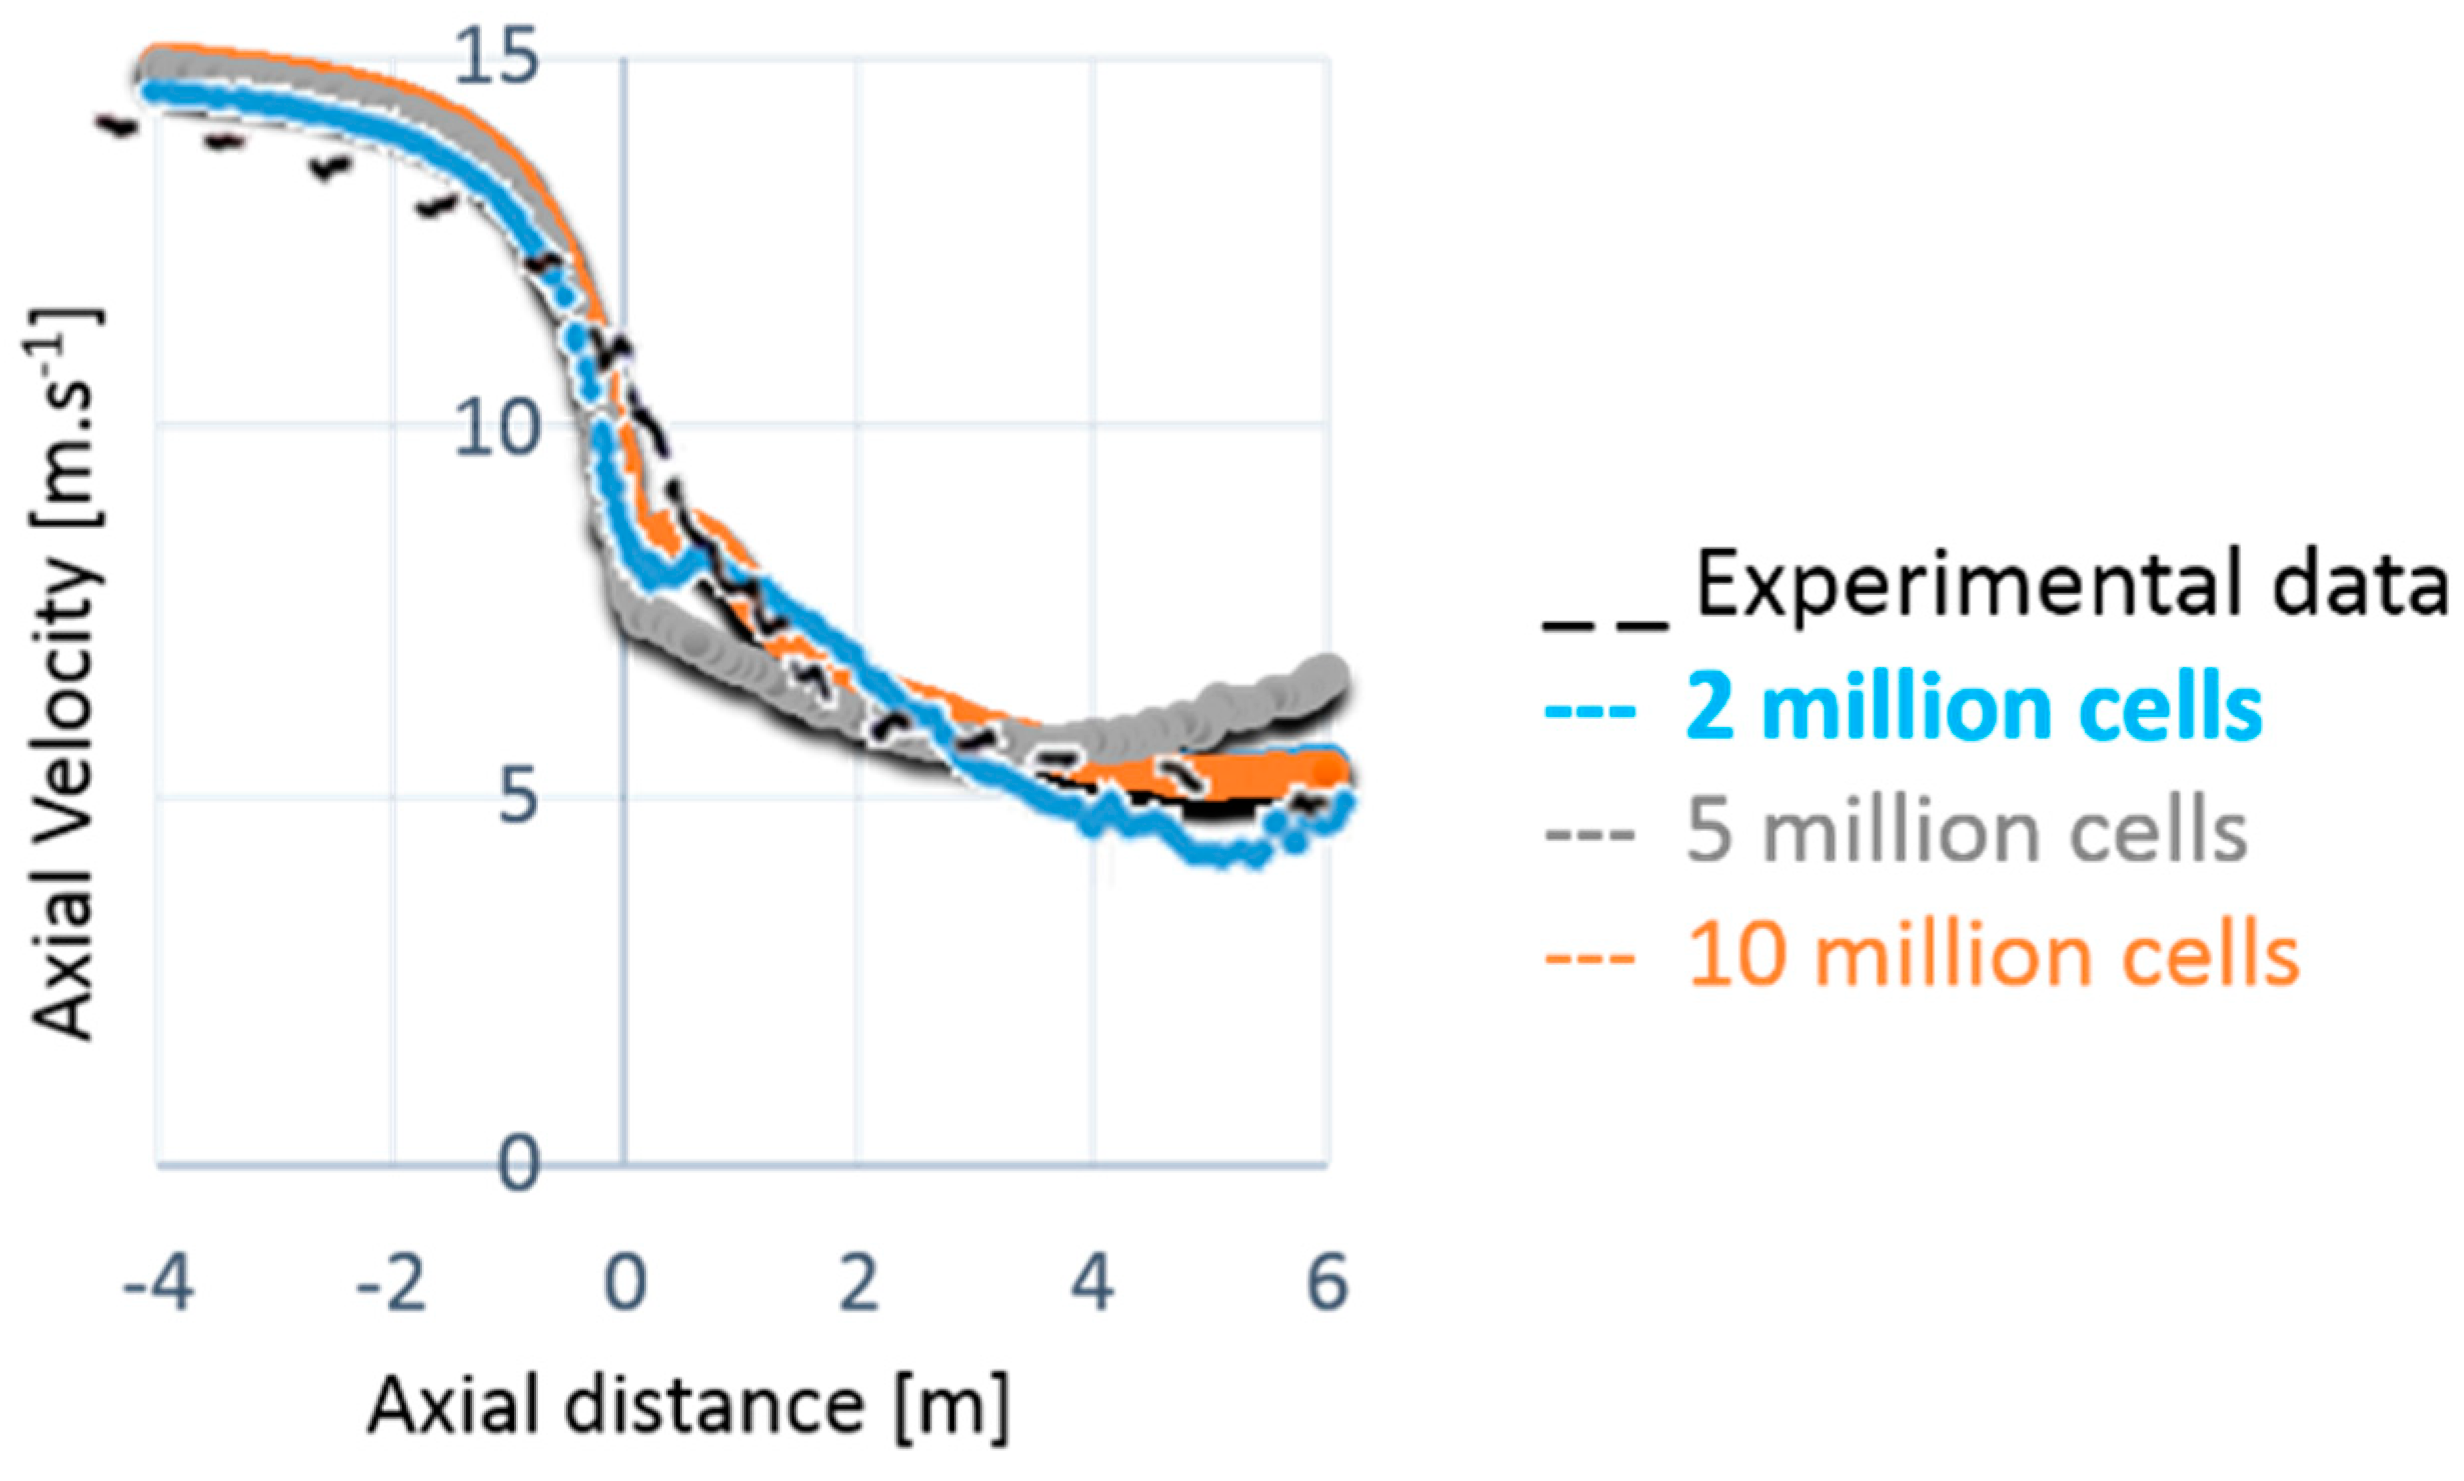
The modelling technique implemented in this study is the MRF. The model itself is an adaptation of the actuator-surface method: even though the full blade geometry was resolved using the CFD model, the solid blade geometry was suppressed from the rotating disc centrally located at the physical domain. The remaining model has the blade surface geometry represented as solid walls located in the central actuator disc, but the interior part of the blade (solid) was suppressed. A high number of cells (10 million) is necessary to achieve a validation within 5% agreement (see
Appendix A) between computational and experimental data for the mesh layout designed for this simulation. Other studies in literature confirmed the necessity for a high number of cells to achieve validation within reasonable agreement [
31,
33,
35,
38,
41,
45]. When solving the full rotor blade geometry, the most efficient way of reducing computational expenses while still keeping a good level of agreement between computational and experimental data is to improve the layout of the mesh. For part I of this study, we focused on developing and validating a wind turbine CFD model, evaluating near wake characteristics under variable operating conditions other than the ones analyzed in the MEXICO experiment. In the second part of this research (Rodrigues and Lengsfeld [
53] in review), the model from this study was adapted to analyze an extended wake region while still keeping a similar number of cells. The objective of part II is to develop a CFD model to analyze wind turbines interaction in wind farms. In order to do that, we broke the physical domain into smaller parts to locally design the mesh. This by itself represents an improvement of the mesh layout because there is a reduction in the number of cells relatively to the area analyzed. Further work could achieve an even better mesh layout design. Considering the extension of our analysis to a wind farm, a CFD technique was introduced in the second part of this research ([
53], in review) in which a profile is created for the outlet of a first simulation (representing the first row of turbines), and then plugged into a new simulation (as an inlet) to model a hypothetical downstream row of turbines. Even though there is a need for running multiple simulations to analyze interaction effects, we eliminated the need for simulating two turbines rows at once. This could potentially allow users to simulate multiple rows of turbines while still using reduced resources in terms of computational capabilities. Therefore, to study wind farm layout, it would not be required an exorbitant number of cells, reducing the computational cost of these types of simulations.
Even though RANS model using k-ω SST is suitable for complex boundary layer flows under adverse pressure gradient and separation such as turbomachinery and external aerodynamics, separation is typically predicted to be excessive and early. This can reduce the suitability of the model for free shear flows, such as wakes. According to Sanderse et al. [
22], RANS is more prevalent to engineering for modeling turbulence in the wake because of the computational expenses, even though eddy viscosity-based models are proved to be diffusive. A Reynolds-stress model based on LES would capture the rotational behavior of the wake, however a LES has to be run for a sufficiently long flow-time to obtain stable statistics of the flow being modeled. LES requires substantially finer meshes than those typically used for RANS models [
54]. The computational cost with LES is typically orders of magnitude higher than the costs for steady RANS calculations in terms memory RAM and CPU time. Usually, high-performance computing (for instance, parallel computing) is necessary for LES applications. The main shortcomings of LES is the high resolution requirements for wall boundary layers, where the large eddies become relatively small, limiting LES for wall bounded flows to very ow Reynolds number (Re~10
4–10
5) ([
54]).
The CFD technique implemented in this work considers k-ω SST to numerically model wake effects of the MEXICO rotor. The model does not take into consideration transient effects such as the LES model. Another distinctive capability of LES models is the possibility of introducing wind fluctuations for the inlet by using Reynolds Stress components. In despite of that, according to Rodrigo et al. [
55] the application of CFD in wind resource assessment is still largely based on RANS models since LES or Detached Eddy Simulation (DES) models are still computationally expensive. According to Rodrigo et al. [
55], the compromise between fidelity and cost for wind resource assessment is found with CFD models based on RANS simulations. Moriarty et al. [
56] presented a comparison between several LES and RANS models in terms of accuracy on predicting wake deficit, considering the Sixberium and the Horns Rev and Lillgrund wind farms. The comparison showed that there is no apparent winner, as sometimes LES or RANS models have lower normalized average error than lower fidelity models, but often their error is higher. They concluded that more detailed insight into individual models and more experimental observations are required to provide better information about model accuracy. Delineated observations of wind farms under different operating and atmospheric conditions are required for providing better validation data instead of using averaged data over long periods of time. Such information will give the best practices regarding wake modelling and wind farm design, helping to quantify uncertainty bounds for different modelling tools and to determine useful quantities for validation in order to guide future measurement campaigns.
Reducing computational requirements for wake simulations is a tremendously demanding topic for wind energy research applicable for wind farms. The physical modeling implemented in this work essentially represents the forces using a rotating central disc, but careful work has been taken to correctly represent these forces. The model validation process is described throughout
Section 3.1, including blade loading and near wake flow field. The full blade surface geometry was modeled, including twist angle, pitch angle and variable chord. This approach is similar to the actuator surface method. According to Sanderse et al. [
22], the actuator surface approach is more accurate than the actuator disc and actuator line models. Still according to the same reference, even though the actuator disc method still remains the most widely used method for multiple wake simulation because of its reduced computational requirements, current research approaching the use of actuator surface technique has been evolved because of its relatively higher accuracy on wake modeling.
Extremely valuable work has already been carried out in literature to solve validation of near wake flow field using the MEXICO experimental dataset. In this current research, an extensive numerical effort has been performed to provide new insights related to near wake aerodynamics, which are crucial to understand wake characteristics and consequently to propose improvements to wind farm layout. The influence of some important design parameters on near wake aerodynamics has been determined, providing numerical estimates of wake profile. Such an extensive numerical effort specifically on near wake modeling had not been addressed in literature yet. The simulation of a range of pitch angle values provided a numerical estimate on the influence of this design parameter on the velocity deficit in the near wake. Additionally, a detailed study provided numerical estimates on the impact of TSR on velocity deficit and turbulence intensity/turbulent kinetic energy on the near wake. Furthermore, the near wake analysis in this work considered an extended near wake region: the original MEXICO experiment covered a near wake region up to 1.33 rotor diameters behind the rotor, while in this work the near wake analysis considers a length up to three rotor diameters. A previous work carried out by Bechmann et al. [
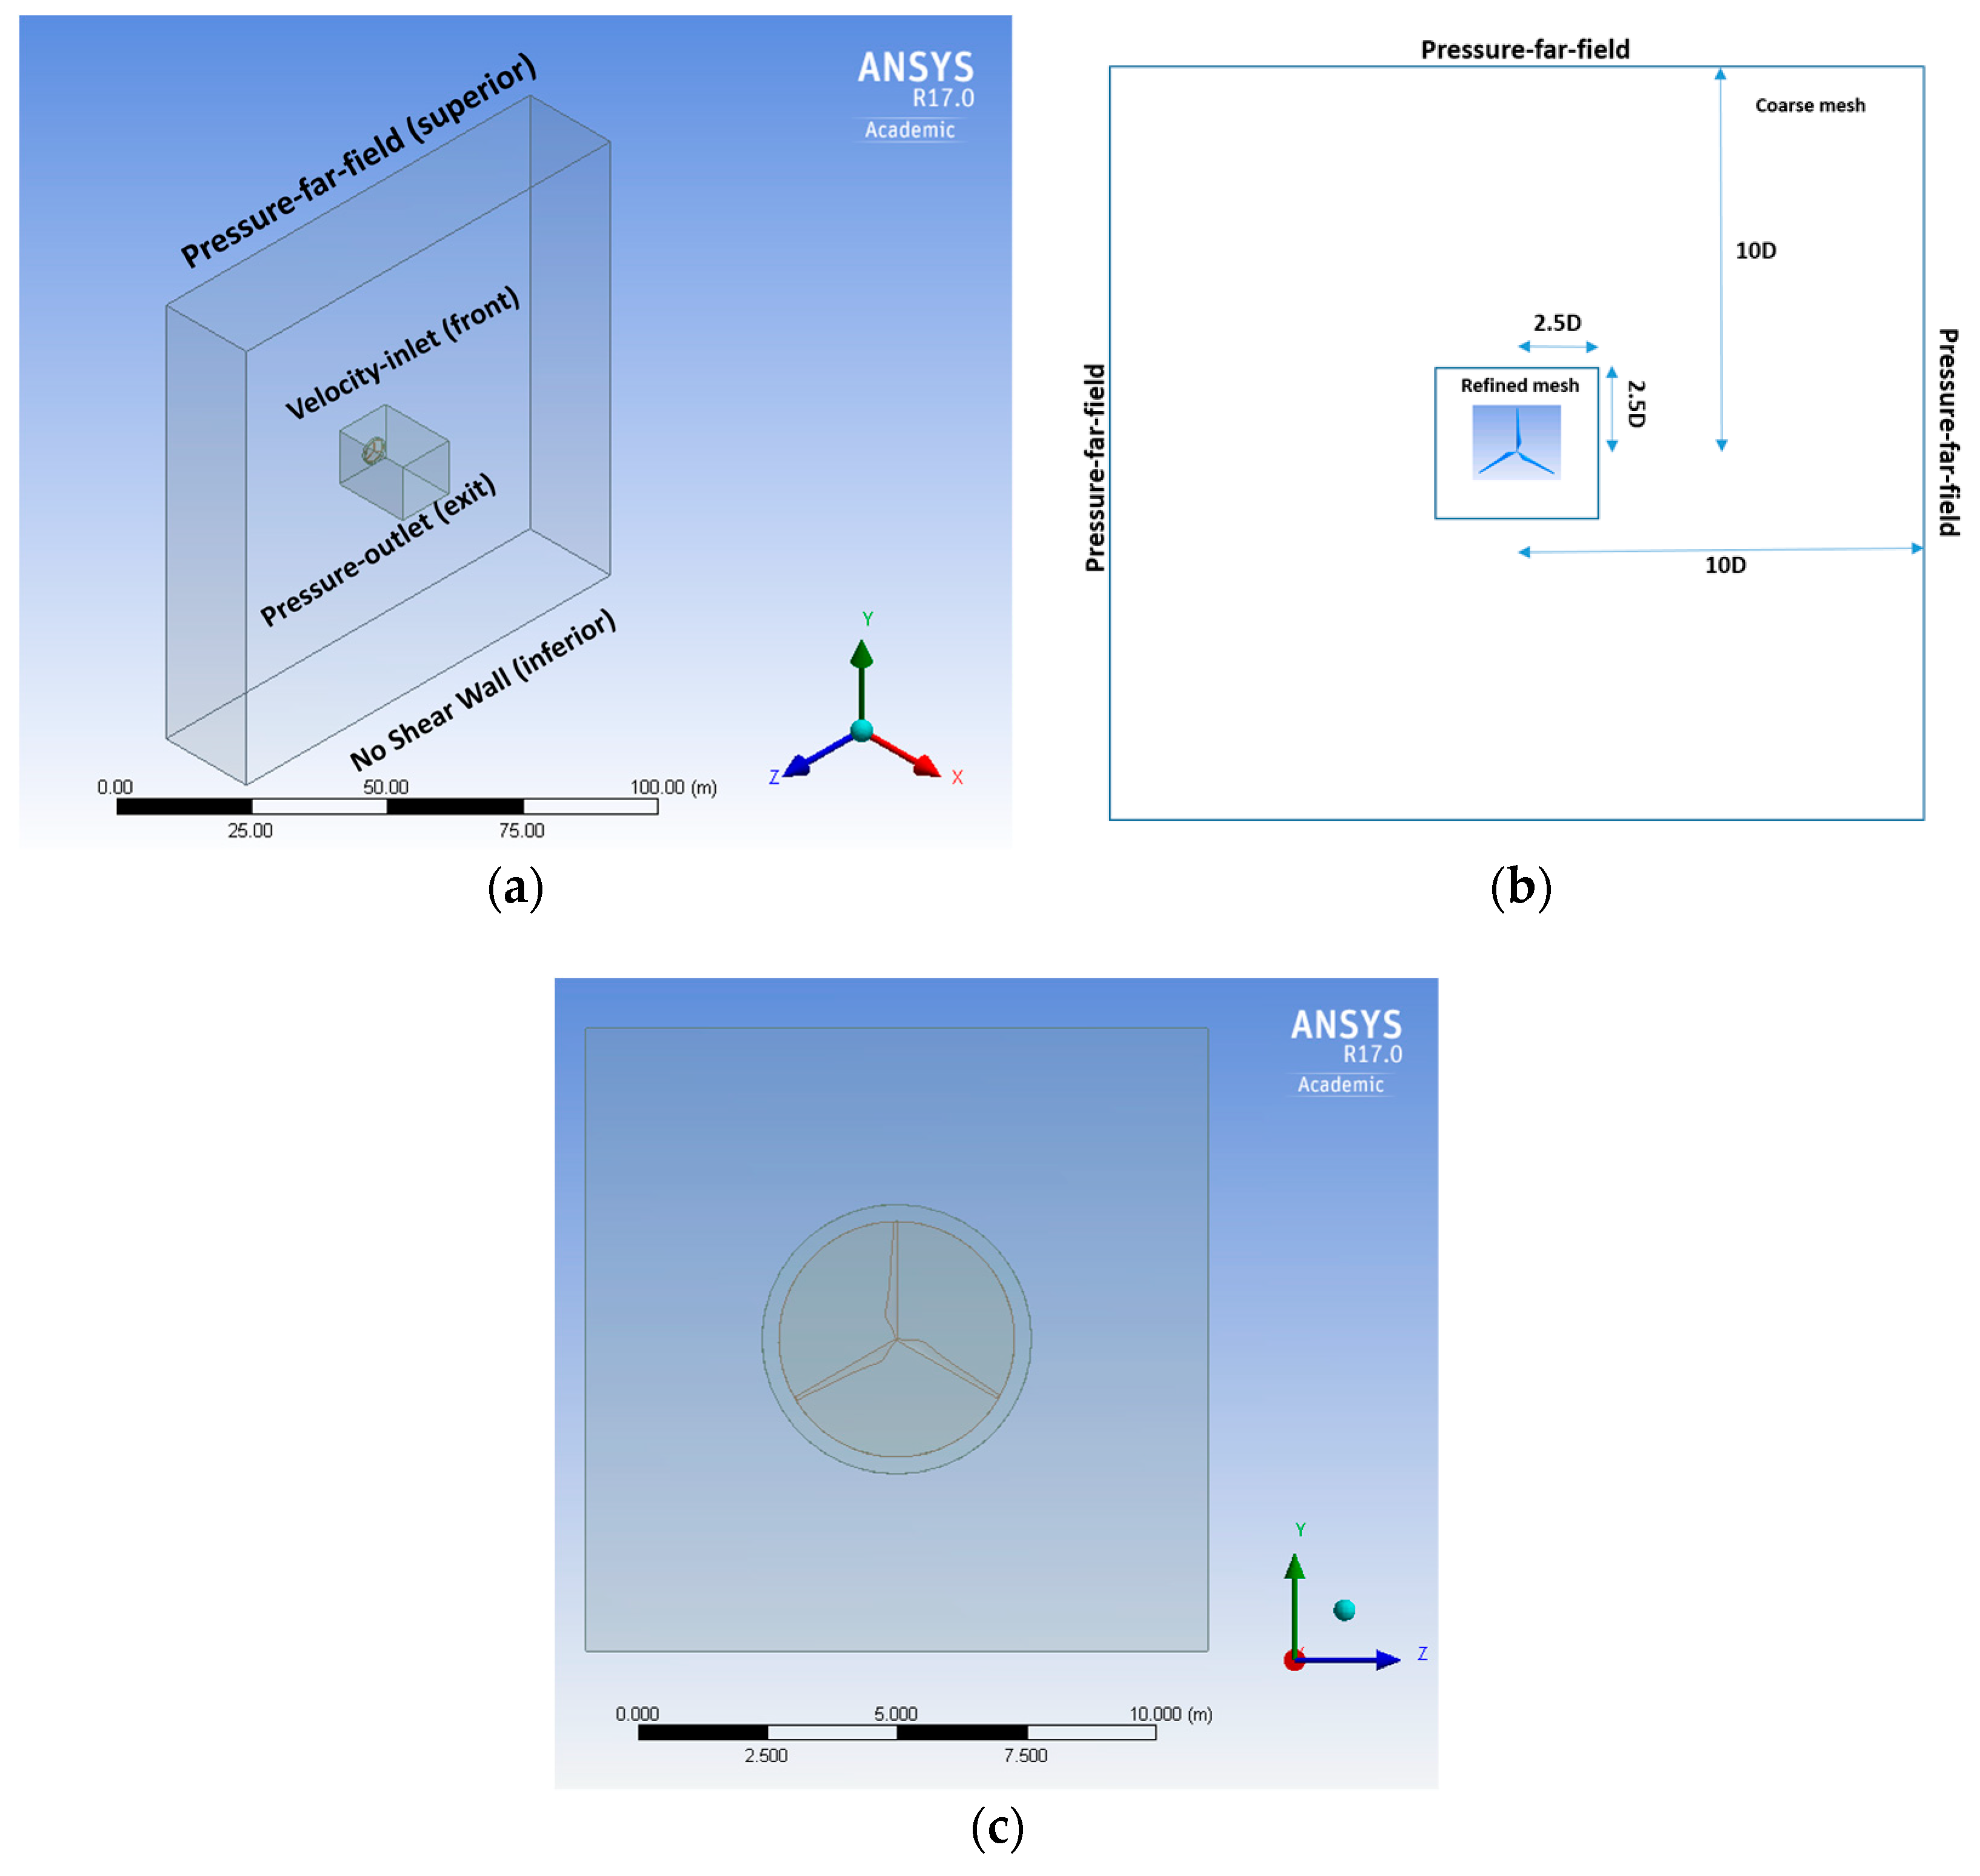
31] considered an extended near wake region up to three diameters downstream of the MEXICO rotor, simulating the same operating conditions of the original experiment (one TSR value for each of the three velocities tested). Here in this work, the analysis considered different loading and pitch angle conditions, not only analyzing velocity flow field but additionally evaluating turbulent characteristics of the wake. Furthermore, the validation in this work implemented a particular type of lateral boundary condition never before applied for wind turbine CFD analysis: pressure-far-field. The implementation of pressure-far-field boundaries prevent the need for modeling tunnel lateral wall effects, allowing for coarse mesh at lateral boundaries, which are not meaningful for modeling experiments such as the MEXICO rotor (performed in open jet wind tunnel) or even to model turbines in natural field.
In part II of this work [
53], an adaptation of CFD model validated in part I was carried out by extending the wake region to numerically model far wake effects. One of the novel aspects of part II is the application of a validated wind turbine CFD model to propose improvements for wind farm layout. The majority of previous works in this topic (wind farm layout optimization) rely on analytical models or non-validated CFD models. As pointed out by Rodrigo et al. [
55], “Wind turbine wake aerodynamics is a topic of study that has attracted many researchers, which are divided into the ones studying rotor aerodynamics (near wake) and wind farm array efficiency (far wake). It is common sense that a more realistic description of the wake generation mechanisms in the near wake allows to understand and improve far wake models.” In part II, a CFD technique that has never been applied before to solve wind turbine wakes interaction is introduced: we separately implement each wind farm row, creating a profile from each outlet. This profile is implemented as the inlet of a new simulation, allowing to simulate wake interaction effects. The technique allows to simulate multiple wind turbine rows with relatively reduced computational resources in terms of processers, since there is no need to simulate multiple turbines at once. Researchers may take benefit by using this technique to model wind farm rows while still considering wake interaction effects.


