Article

Liquid Water Transport in Porous Metal Foam Flow-Field Fuel Cells: A Two-Phase Numerical Modelling and Ex-Situ Experimental Study

1
Department of Aeronautical and Automotive Engineering, Loughborough University, Loughborough LE11 3TU, UK
2
Department of Mechanical Engineering, Hanbat National University, Daejeon 34158, South Korea
*
Author to whom correspondence should be addressed.
Energies 2019, 12(7), 1186; https://doi.org/10.3390/en12071186
Submission received: 27 February 2019 / Revised: 23 March 2019 / Accepted: 26 March 2019 / Published: 27 March 2019

Abstract

:
Proton exchange membrane fuel cells (PEMFCs) using porous metallic foam flow-field plates have been demonstrated as an alternative to conventional rib and channel designs, showing high performance at high currents. However, the transport of liquid product water through metal foam flow-field plates in PEMFC conditions is not well understood, especially at the individual pore level. In this work, ex-situ experiments are conducted to visualise liquid water movement within a metal foam flow-field plate, considering hydrophobicity, foam pore size and air flow rate. A two-phase numerical model is then developed to further investigate the fundamental water transport behaviour in porous metal foam flow-field plates. Both the experimental and numerical work demonstrate that unlike conventional PEMFC channels, air flow rate does not have a strong influence on water removal due to the high surface tensions between the water and foam pore ligaments. A hydrophobic foam was seen to transport liquid water away from the initial injection point faster than a hydrophilic foam. In ex-situ tests, liquid water forms and maintains a random preferential pathway until the flow-field edge is reached. These results suggest that controlled foam hydrophobicity and pore size is the best way of managing water distribution in PEMFCs with porous flow-field plates.

Graphical Abstract

1. Introduction

The flow-field plate in a proton exchange membrane fuel cell (PEMFC), often referred to as the flow-field, must effectively serve multiple functions simultaneously to achieve good cell performance. The ideal flow-field plate should have a high electrical and thermal conductivity for electron and heat transport, have good mechanical and chemical stability, provide even reactant distribution across the cell active area and maintain membrane humidity whilst facilitating the removal of product water [1]. The most commonly used flow-field plate for PEMFCs is the rib and channel design, consisting of flow channels pressed, machined or etched into a conductive plate, as shown in Figure 1a. The channel area allows for reactant gas distribution and product water removal, whereas the rib area is in contact with the gas diffusion layer (GDL) to provide mechanical strength and electron transport to the external circuit. The design of traditional flow channels has received significant attention in the literature, with many numerical and experimental studies focusing on flow channel layout [2], shape [3] and wall hydrophobicity [4].
Numerical modelling shows that to minimise excess water saturation, a hydrophobic GDL should be combined with a hydrophilic straight flow channel to transport water from the GDL to the flow channel where it can be more easily removed [5,6]. However, at the bends in serpentine flow channels Song et al. [4] demonstrated that a hydrophobic channel wall is best for minimising liquid saturation of the GDL.
A disadvantage of the rib and channel design is that the area under the rib experiences a higher flow resistance than the channel, leading to localised reduced reactant concentrations and product water build up. This behaviour was observed experimentally through neutron beam imaging by Meyer et al. [7]. Interdigitated flow channels, where flow is forced through the GDL underneath the ribs, can be used to improve water removal, but at the expense of increased pressure drop caused by the lower permeability of the GDL [3]. Several alternative flow-field plates for PEMFCs have been proposed in the literature, including: bio inspired [8], sintered metal [9], 3D metal mesh [10] and porous metal foams [11,12,13,14,15,16]. Of these, porous metal foam flow-field plates (Figure 1b) have seen the greatest interest due to both low cost and high productions volumes due to extensive use as battery electrodes [17].
Murphy et al. [11] was the first to use porous metal foam as the flow-field plate in a PEMFC, testing an eight cell stack and conducting single phase flow distribution tests using dyed liquid water. Kumar and Reddy [12] then conducted a direct comparison between multi-parallel channels and a Ni–Cr foam flow-field plate, showing improved mass transport behaviour in the foam flow-field at high currents. Similar behaviour was also observed by Tseng et al. [13], Tsai et al. [14], Shin et al. [15] and Kim et al. [18], with the improvement performance believed to be due to improved reactant distribution of the metal foam flow-field, as demonstrated during single phase flow visualisation by Fly et al. [19]. Fly et al. [20] investigated how foam compression affects fuel cell performance through electrochemical tests and X-ray computed tomography, demonstrating improved performance up to 70% thickness compression, primarily due to improved contact between the foam and bi-polar plate.
Whilst there have been several studies on the electrochemical performance of metal foam flow-fields in fuel cells, the two-phase gas and water interaction within the foam flow-field is not as well understood. Tabe et al. [16] conducted the first in-situ visualisation of liquid water behaviour in a PEMFC with foam flow-fields using a transparent endplate. The study found that hydrophilic coated foam provided both higher and more stable voltage than a hydrophobic coated foam because of the foam’s ability to draw liquid away from the GDL.
Outside of the fuel cell literature, two-phase flow in metal foam has been studied with application to packed columns in the chemical processing industry [21,22]. Both Calvo et al. [21] and Wallenstein et al. [22] performed X-ray tomography on metal/ceramic foam columns subjected to gas and liquid in counter flow. Both authors observed static hold up; the volume fraction of liquid remaining after gas and liquid flows were stopped in the region of 5–10%. However, both the foam geometry and flow conditions differed from those seen in fuel cell flow-fields.
In the present work, liquid water transport in metal foams subject to two-phase PEMFC flow conditions is investigated through a combination of ex-situ visualisation experiments and computational fluid dynamics numerical modelling. Different foam geometry, hydrophobicity and flow rates are considered and methods for minimising liquid water saturation on the GDL surface are investigated.

2. Experimental Methodology
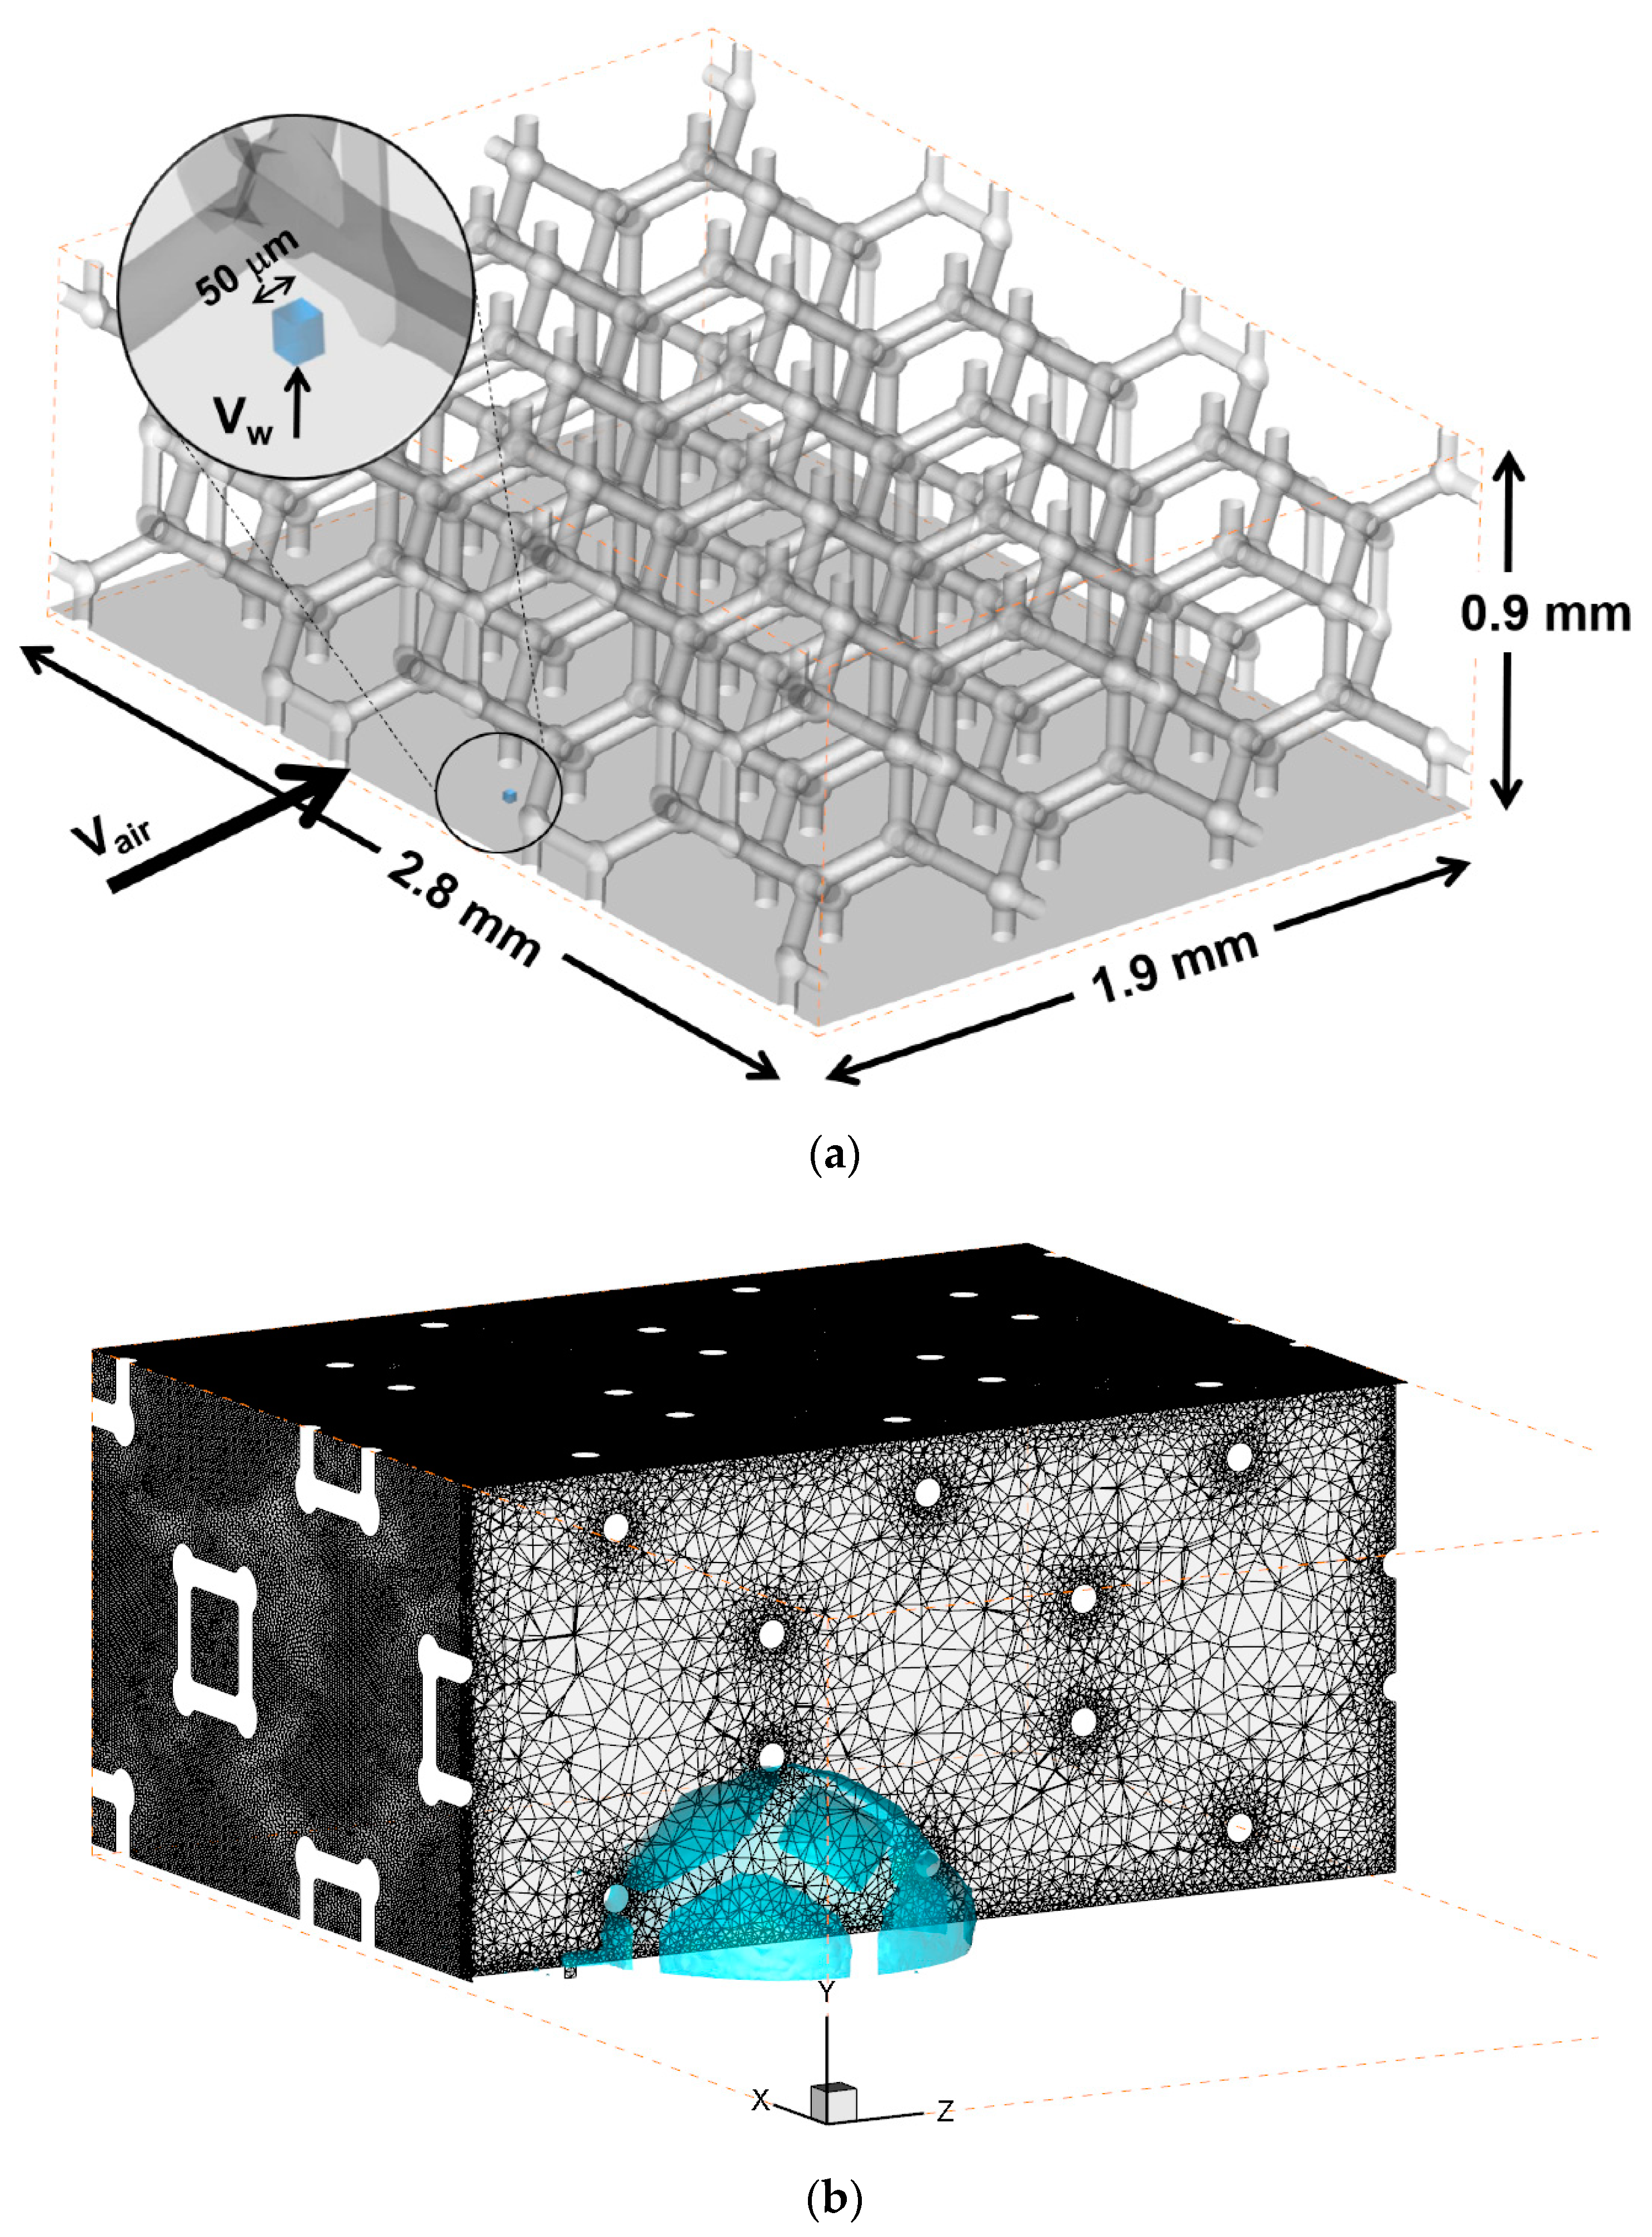
An ex-situ representation of a section of metal foam flow-field was designed to visualise liquid water transport through the foam in a controlled environment independent of the electrochemical reaction. The test section consisted of a 40 mm × 10 mm sample of metal foam surrounded by a silicone gasket and sandwiched between a set of 6.0 mm thick clear acrylic plates. A 1.0 mm diameter hole was laser cut into the 1.0 mm thick acrylic sheet on the bottom surface of the foam, through which liquid water was delivered to represent product water entering the flow-field from the GDL. Liquid water was delivered to the hole through a channel cut into a 1.5 mm thick acrylic plate. Dry air flow was supplied in plane with the foam sheet, perpendicular to the liquid flow. The two-phase mixing point was located at least 10 foam pore lengths from the foam inlet to eliminate entrance effects; Figure 2 illustrates the test apparatus used.
Liquid water was supplied to the sample at a flow rate of 3.0 gh−1, controlled using a high-resolution needle valve and liquid mass flow meter (Bronkhorst, Netherlands). To better optically separate the water from the air, blue dye was added to the water at a water to dye ratio of 286:1. The low concentration of dye was not deemed to influence the properties of the water. Air flow rates of 0.5 and 2.0 Lmin−1 were used, regulated using a mass flow controller (Bronkhorst, Netherlands). This corresponded to air velocities ranging from 0.42 to 3.32 ms−1 at the foam inlet, depending on the foam thickness used. A hydrophobic coating (Electrolube Fluorocoat) was applied to the acrylic plate with the hole to better represent the surface of the GDL and numerical model conditions.
Two different foams were tested: a 1.6 mm thick nickel foam (Foam A, Corun New Energy, China) and a 3.0 mm thick nickel foam (Foam B, Sumitomo, Japan). Table 1 shows the manufacturer properties of the foams tested where pore size is the effective diameter of an average pore. The foams were paired with 1.0 mm and 3.0 mm thick Shore 60 A silicone gaskets, respectively, and the fixture was compressed using 12 bolts tightened to 3 Nm. Water transport through the foam was captured using a Cannon EOS 100D SLR camera with frame rate of 60 frames per second and resolution 1280 × 720. The camera was attached to an Infinity K2 distamax long-distance optic microscope. All tests were performed at room temperature (22–25 °C).

3. Numerical Model

The flow in the metal foam was assumed to be unsteady, isothermal and laminar three-dimensional flow. In this study, the volume of fluid (VOF) model was employed for the two-phase flow simulation in the gas channel. The governing equations for the two-phase flow are the continuity equation and the Navier-Stokes equation:
ρ t + ( ρ V ) = 0
ρ V t + ( ρ VV ) = p + ( μ ( V + V T ) ) + ρ g + F
where p is pressure, ρ and µ are volume-averaged density and viscosity, respectively, V is fluid velocity and g is gravitational acceleration. F represents the momentum source term associated with the surface tension and is expressed according to the continuum surface force (CSF) model [23] as follows:
F = σ κ i ρ α i < ρ >
where σ is the surface tension coefficient, 〈 ρ 〉 is the average density of the two fluids and the curvature at the interface κ i is calculated from the local gradient of the surface normal vector n = α i / | α i | :
κ i = · n .
The volume fraction of fluid i, α i , was calculated in every computational cell over the entire domain:
α i t + V α i = 0 .
The wall adhesion was taken into account by imposing the unit normal vector of the interface at the wall as:
n = n w c o s θ + t w s i n θ
where n w and t w are unit vectors normal and tangential to the solid wall, respectively and θ is the contact angle.
Figure 3a shows the computational domain used in this study. The domain size was 1.9 mm × 2.8 mm × 0.9 mm in the streamwise, spanwise length and height, respectively. The tetrakaidecahedron (or Kelvin cell) was used to model the pore geometry in the metal foam, which had 14 faces (6 quadrilateral and 8 hexagonal) and 24 vertices. The pore size was 0.345 mm and the ligament diameter was set as 0.054 mm to make the porosity of 0.95. These values are representative of commercial foam geometry utilised in the literature for metal foam flow-fields [15,18]. To model emerging droplets on the GDL surface, liquid water was injected through a hydrophobic bottom wall. The size of the pores through which the liquid droplets emerged was 50 μm × 50 μm. The bottom surface of the channel and the surface of the metal foam were assumed to be hydrophobic and the contact angle of 110° was imposed on those surfaces.
In the air inlet and water inlet, a constant velocity was applied, and the outflow condition was used for the outlet. The boundary conditions except the inlet and outlet were set to no-slip condition. Vair denotes the airflow velocity into the flow channel at a constant speed of 2.0, 3.0 and 4.0 ms−1 and Vw is the liquid water velocity supplied through the pores at a constant speed of 1.66 ms−1 to represent the product water exiting the GDL of a PEMFC. The governing equations were solved by the interface tracking between the pressure–velocity coupling method through the PISO scheme and the gas-liquid through the geo-reconstruct scheme. In the geometric reconstruction scheme, the interface between air and water was determined by a piecewise linear interface calculation method. The time-advancement was made with the time step of 1.0 × 10⁻⁶ s by the first-order implicit scheme. The residual of each governing equation was 0.001. The simulations have been carried out using the commercial CFD code ANSYS Fluent software in conjunction with the built-in CSF model [24]. The number of grid cells used in the calculation was about 5,500,000. Figure 3b shows the computational mesh at a plane through the water inlet. Although the simulations were performed on 128-core Linux clusters, the wall clock CPU time was required about one month for time marching of 1 s, which limited the time extent of the present analysis to the very early phase.

4. Analysis and Discussion

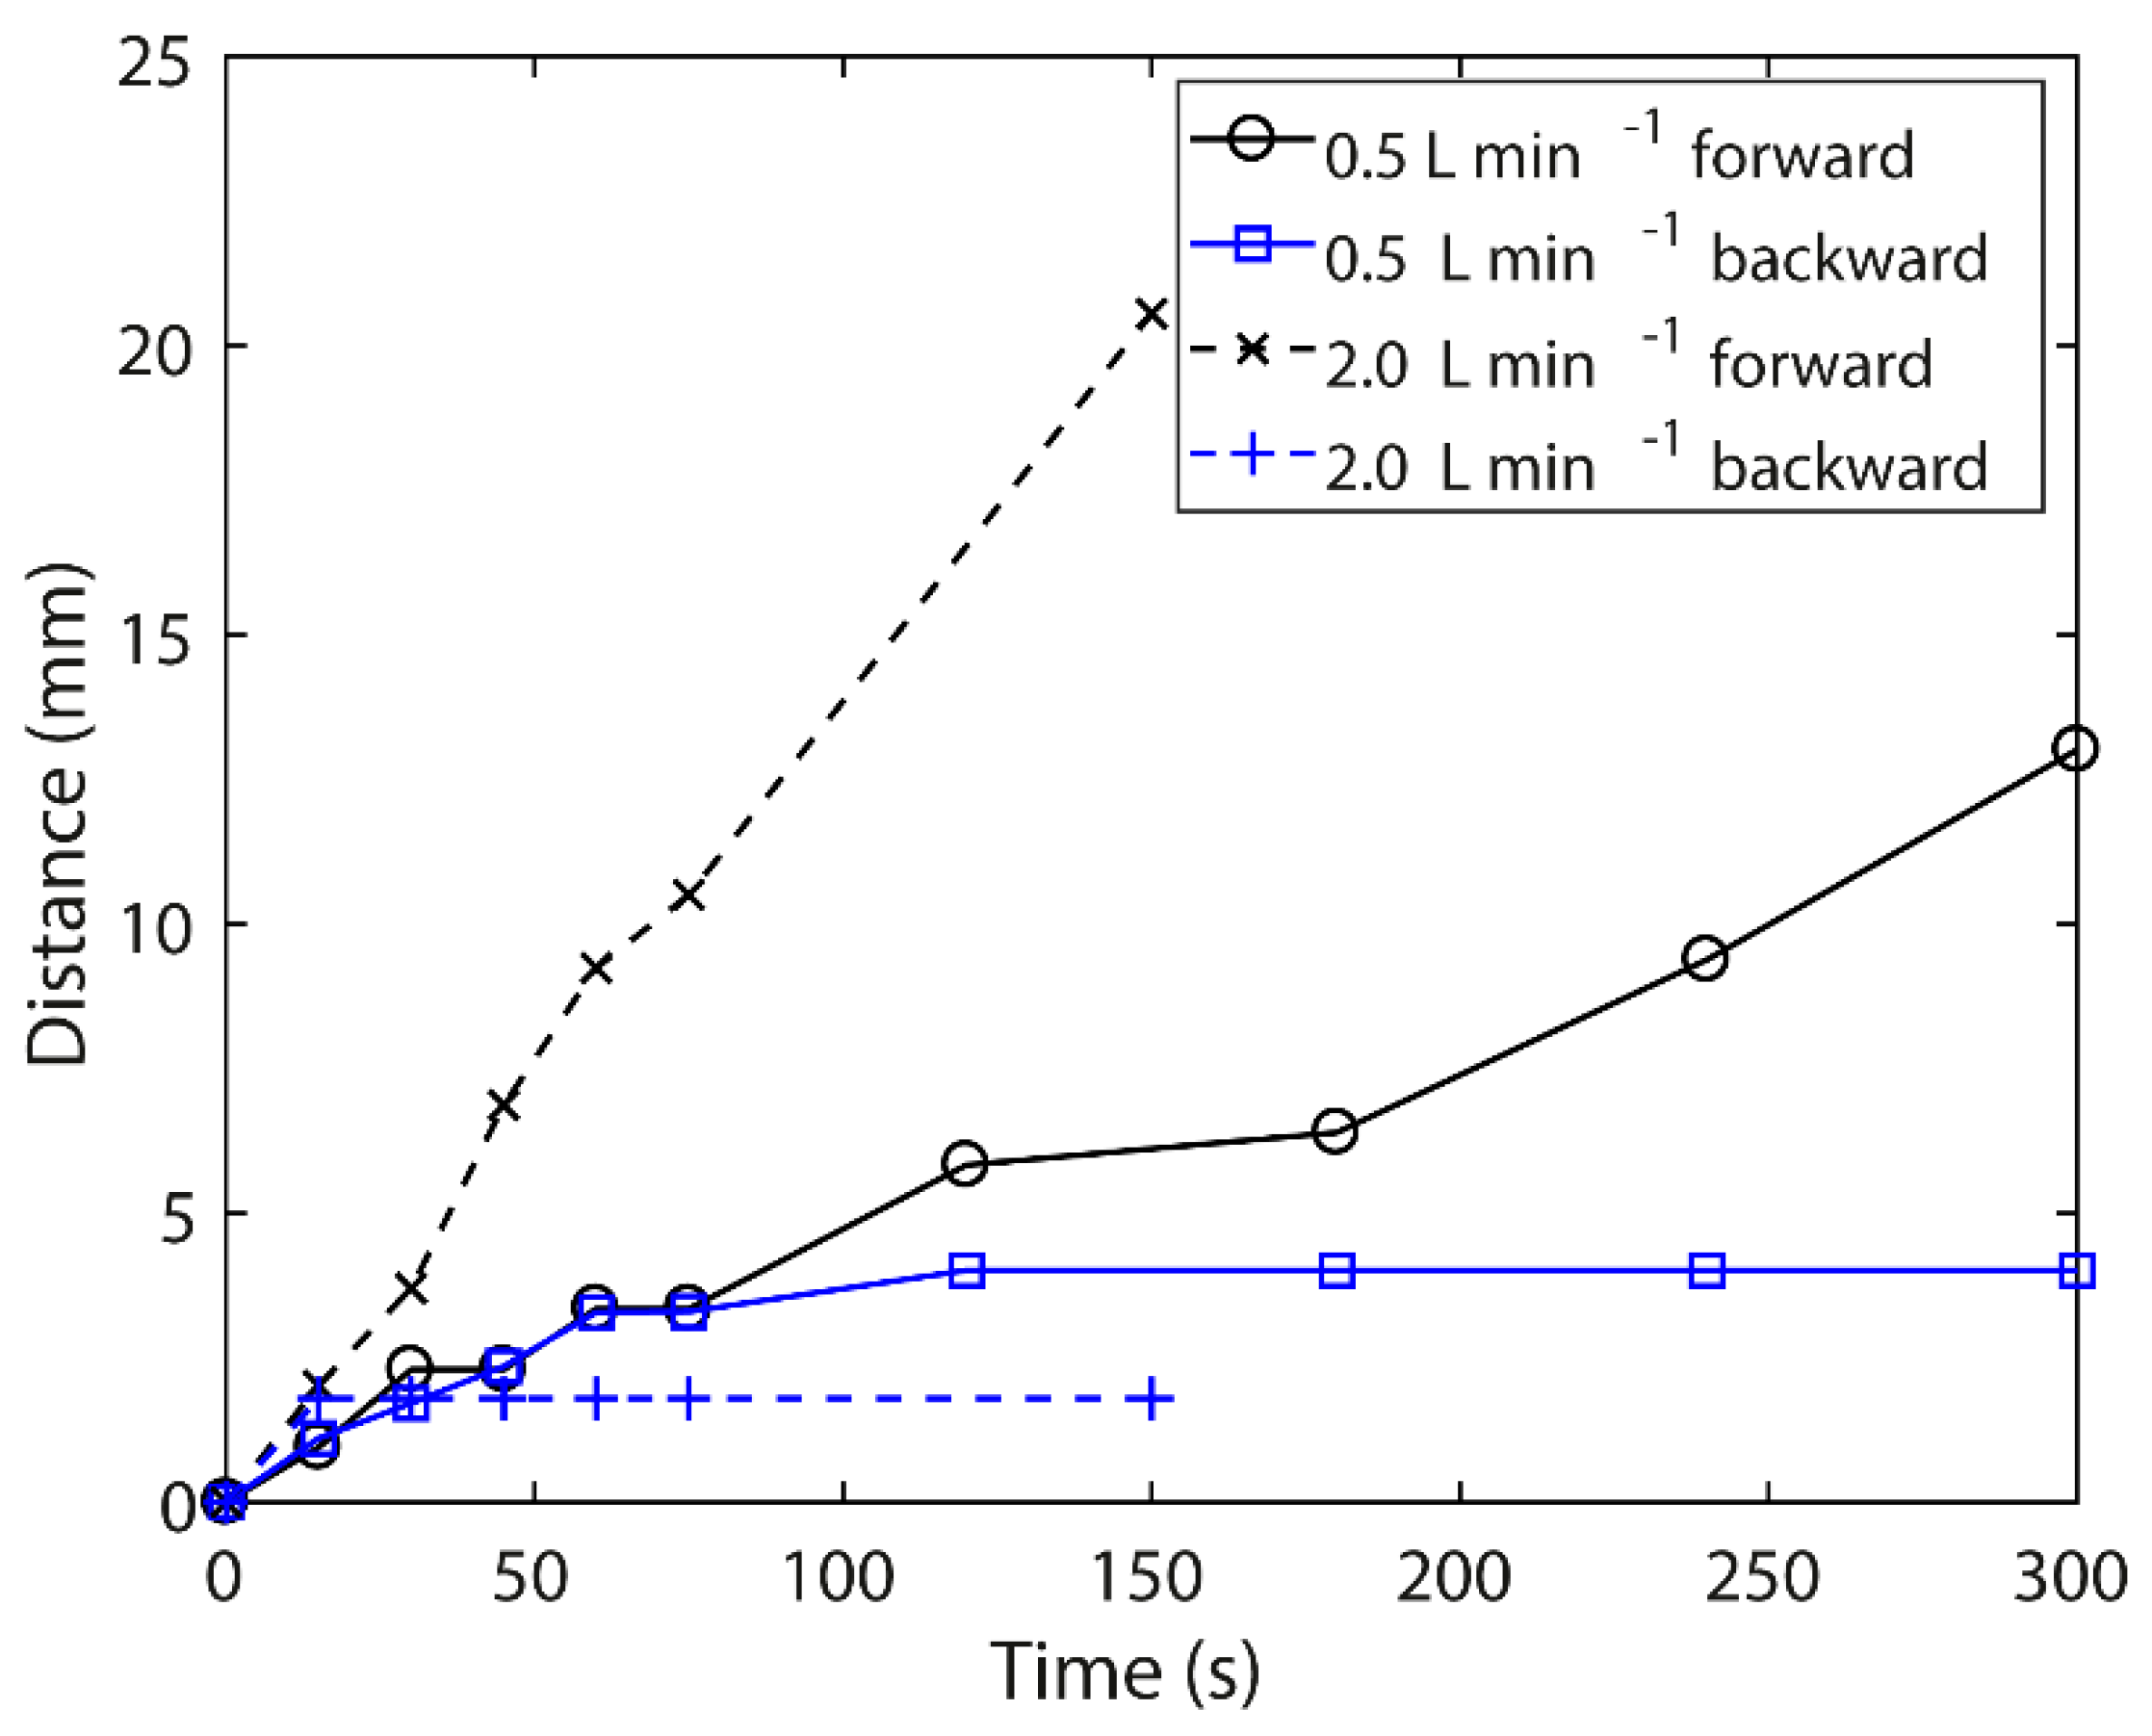
4.1. Experimental Results

Ex-situ visualisation of water transport in the metal foam flow-field was conducted using the test setup described in Section 2. Figure 4 shows how the liquid water moved through foam A during the first 120 s from initial liquid injection at the mixing point for both the 0.5 Lmin−1 and 2.0 Lmin−1 air flow rate. Air flow was from left to right, gravity was acting in the direction out of the page, and liquid flow rate was 3.0 gh−1. Increasing the air flow rate increased the rate at which the water front moved through the foam flow-field in the streamwise direction, reducing the time taken to remove product water from the flow-field in a working fuel cell.
For both flow rates, the liquid water front was seen to travel upstream of the airflow (left of initial mixing point) a short distance before spreading out and moving downstream in the flow direction. This was more pronounced in the 0.5 Lmin−1 case and can be clearly seen in Figure 4b. The fluid behaviour relating to the upstream movement after initial liquid injection was investigated further using the numerical modelling results in Section 4.2.
After initial upstream movement, the water front spread more evenly away from the mixing point until the width of saturated foam (top to bottom of image) was sufficient enough that the force of the airflow overcame the water surface tension in the foam pores and the water front moved in the airflow direction. At higher air flow rates, the width of the water front required before upstream movement dominated was reduced as surface tension forces were more readily overcome by the increased air momentum, as seen by comparing Figure 4c,f.
Throughout both tests, the water was seen to establish and maintain a preferential pathway in the airflow direction, with all additional water then travelling along the same pathway to reach the edge of the foam sample. This contrasted with the transport mechanism in a conventional fuel cell flow channel where droplets are formed and then detached from the pore, travelling along the flow channel in a periodic manner [4]. An established water pathway within the fuel cell flow-field was beneficial in removing product water quickly; however, a wide water channel, such as that seen in Figure 4c, could prevent reactant gases reaching the active area, causing localised fuel starvation.
Each test condition in Figure 4 was repeated three times and the foam removed and dried between tests. In each case the same behaviour was observed but a different water pathway was established due to the non-homogenous construction of the foam. The initial movement of water upstream of the airflow also occurred when the air flow direction was reversed (right to left), negating effects of the fixture design and orientation, and was not seen to occur when the tests were repeated with the foam sample removed. The flow penetration length was calculated and presented in Figure 5.
The water propagation in foam B was presented in Figure 6 for the same conditions and field of view as Figure 4. Water transport was seen to occur much faster in foam A, which had a 0.23 mm pore size, compared to foam B, which had a 0.95 mm pore size. The difference between water transport in the two foams was partially due to the increased thickness of foam B increasing the filling volume and reducing air velocity, but also due to the foam pore size. A smaller pore size, such as in foam A, increased the capillary effect of the porous media, making the movement of water from one foam pore to the next more likely to occur.
In both foams it was observed that the water front only filled one foam pore at a time and not multiple pores simultaneously. Once a single foam pore was filled then the next pore would begin to fill. One potential mechanism is that the location of the next foam pore to be filled with water is based on the probability of the water overcoming the surface tension and air momentum effects in each individual pore. The non-homogeneous nature of the foam means that each foam pore had a different probability of filling. Increasing air flow rate increased the probability of the downstream foam pores filling as air momentum effects increased, as seen in Figure 4 and Figure 6.
The distance of the water front both upstream and downstream of the mixing point over time is shown in Figure 5 and Figure 7 for foams A and B, respectively. In foam B, backwards (upstream) propagation of the water front was seen to dominate for the first 200 s from initial mixing before forwards (downstream) movement occurred. In both foams the backwards water front remained stationary once forwards movement began to dominate. This means that unlike a conventional flow channel where water was effectively removed by the airflow, in a foam flow-field the water remained within the foam pore. In a functioning PEMFC, this behaviour could have the benefit of improved internal humidification and better proton conductivity, although excess water accumulation would cause localised fuel starvation events and increased air flow pressure drop. Furthermore, liquid trapped in foam pores would expand in sub-zero conditions, potentially damaging the fuel cell and effecting cold start behaviour.
To avoid stagnation of liquid water, the surface of foam B was given a hydrophobic coating by dipping the foam in a PTFE solution (25 wt %) then dried on a wire mesh for 2.5 hours at 100 °C, resulting in 18.8 wt % PTFE. The ex-situ experiments were then repeated with the PTFE coating; this hydrophobic treatment was not possible with foam A due to PTFE blocking the smaller pores. With the hydrophobic coating present on foam B, initial water transport moved away from the mixing point to the side edges of the flow channel, from where it travelled along the transition between the foam and gasket in the flow direction to the end of the sample. At 0.5 Lmin−1 the water reached the edge and end of the sample after 30 s and 550 s, respectively. For the 2.0 Lmin−1 air flow rate test, the water took 60 s to reach the edge and 260 s to reach the end of the foam sample. This compared to 1480 s and 1890 s to reach the end of the foam sample in the non-PTFE treated foam B sample at 0.5 Lmin−1 and 2.0 Lmin−1, respectively. Time to liquid water breakthrough (reaching the end of the sample) for all test cases is shown in Table 2. This demonstrates that the addition of a hydrophobic coating to the foam significantly reduced the residence time for water transport, and hence the volume of water stored in the foam. Across a larger foam flow-field, as seen in a PEMFC, movement of water towards the flow-field edge caused by hydrophobic treated foams could be utilised as an effective water management strategy, for example, by having periodic separators in the foam, or utilising a wicking material around the edge of the flow-field. However, improper management could lead to areas of high water saturation on the extremities of the active area, leading to uneven current density distribution. Whilst every effort was made to ensure an even distribution of PTFE coating on foam B, inhomogeneous coating could occur due to fluid wicking, pore blocking or gravitational effects. Additional work is required in this area to ensure even PTFE coating across the surface of the metal foam ligaments.

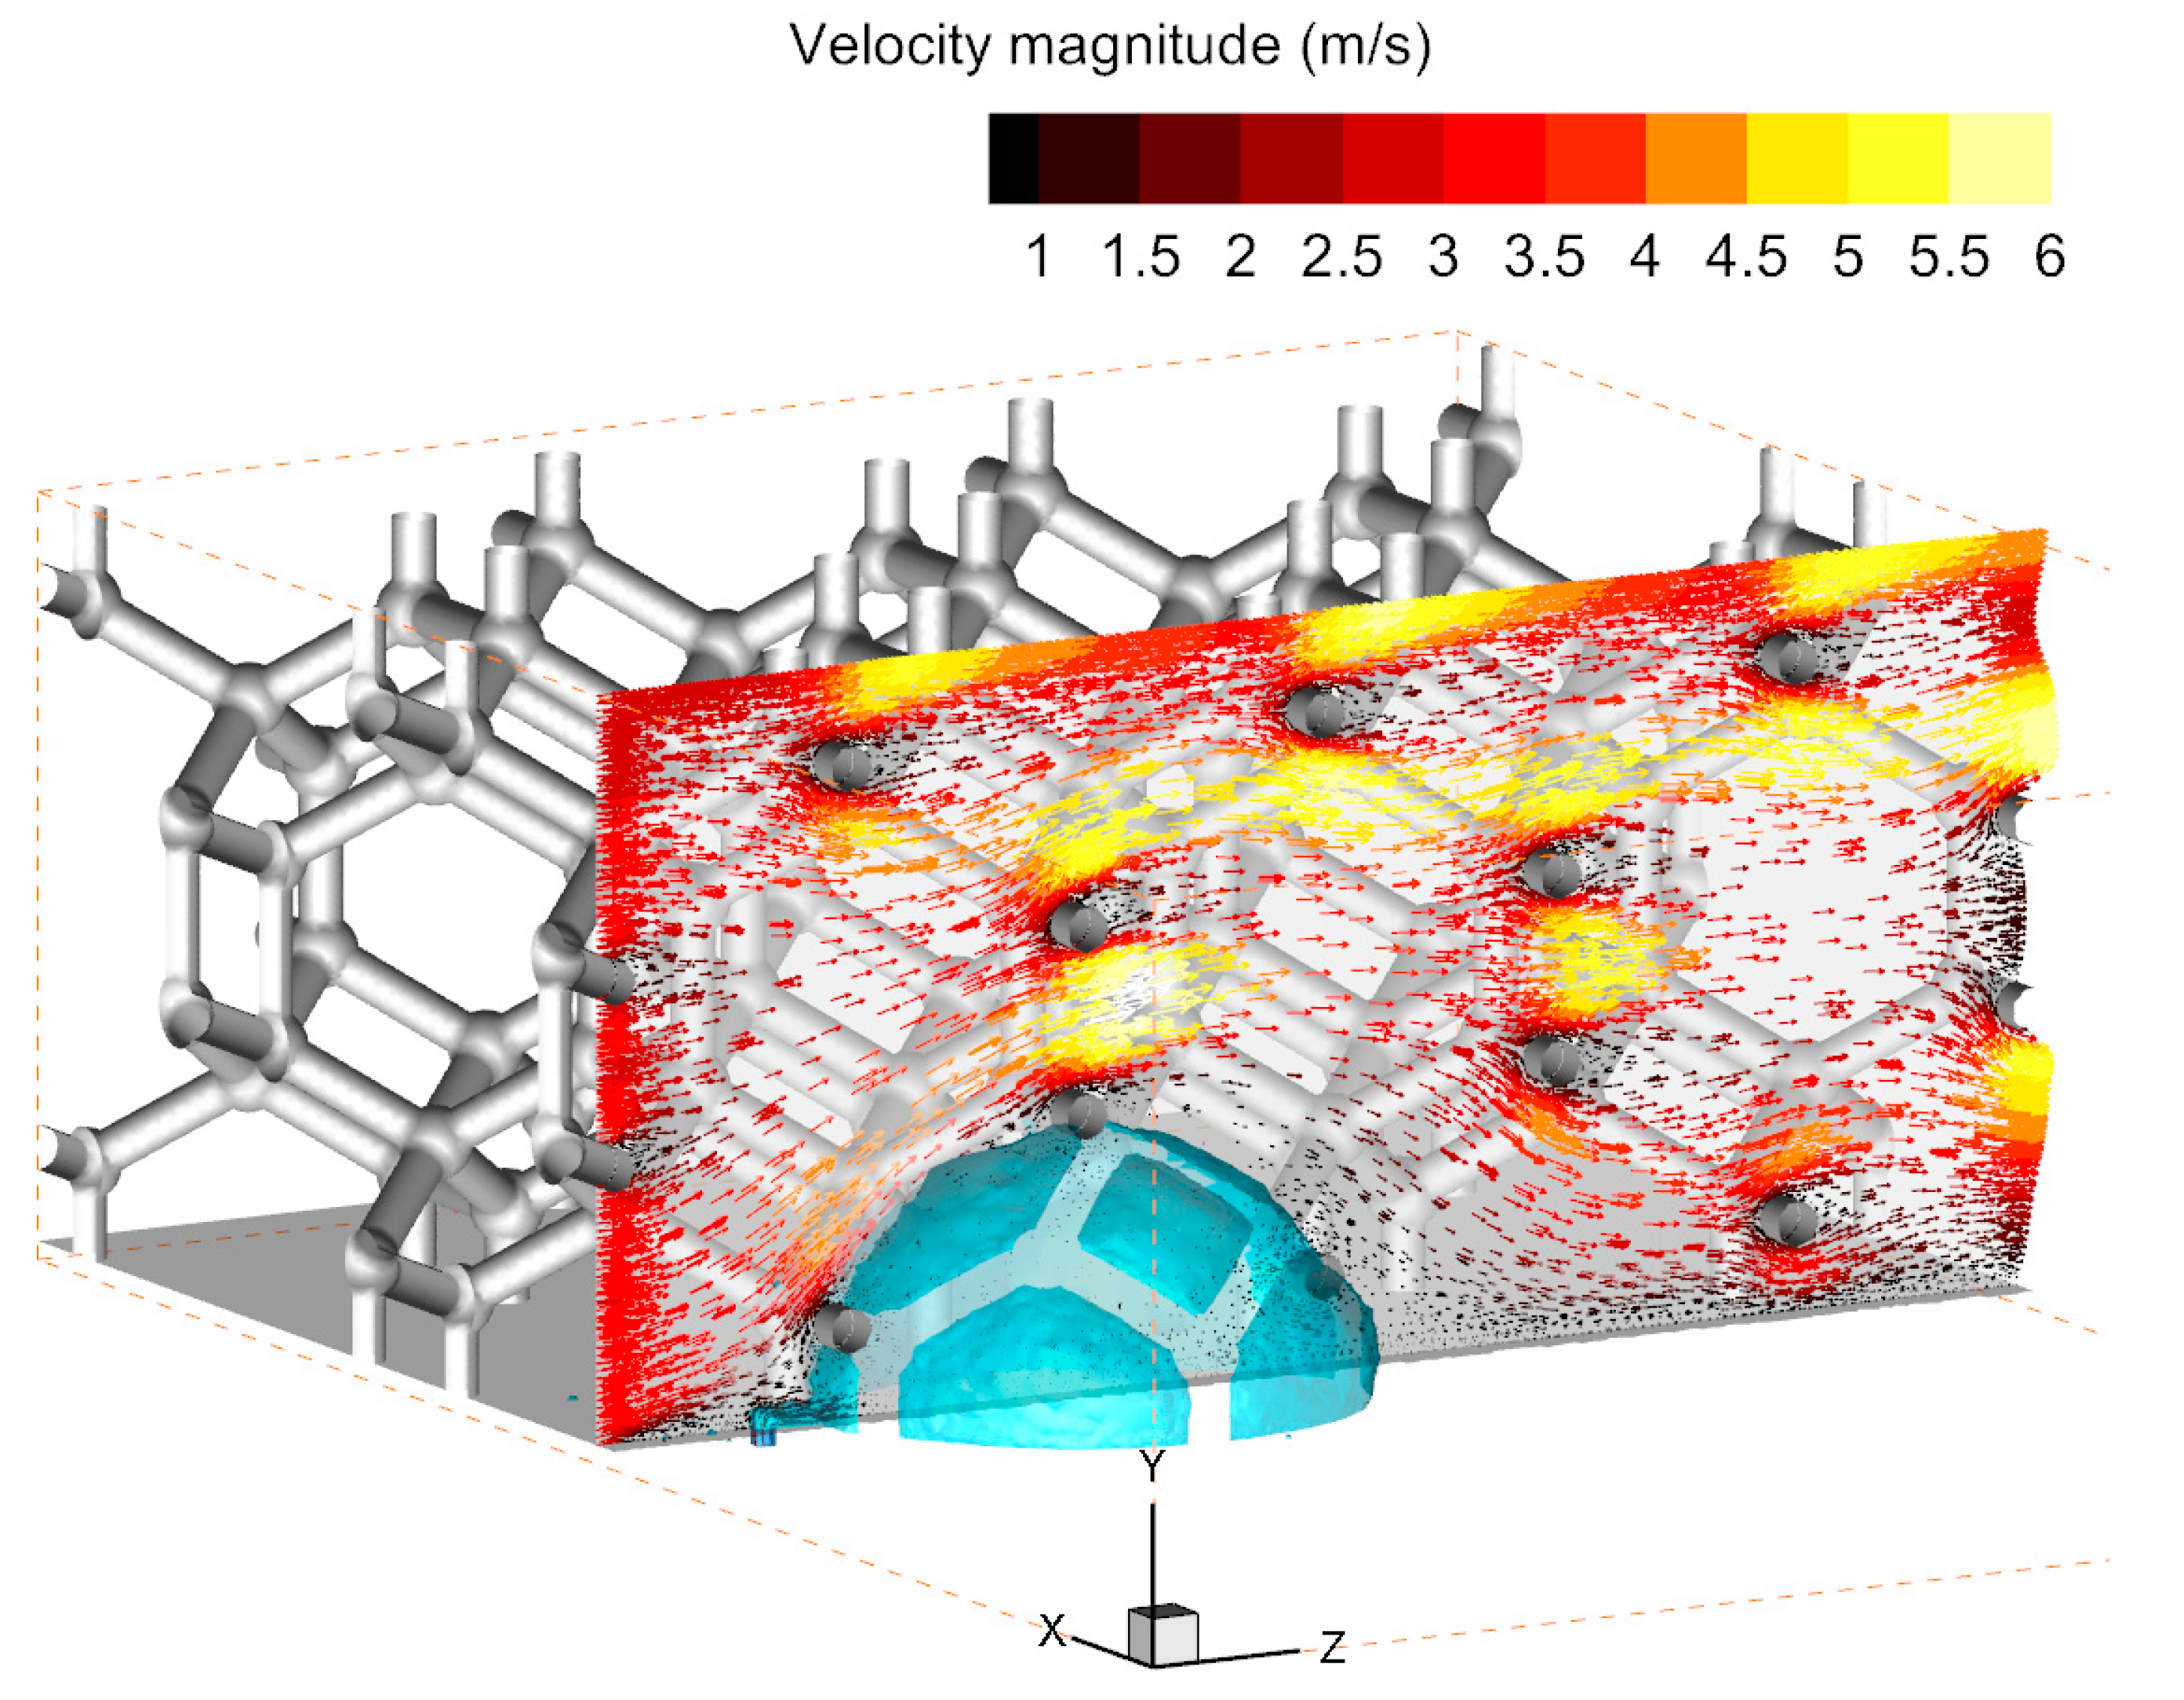
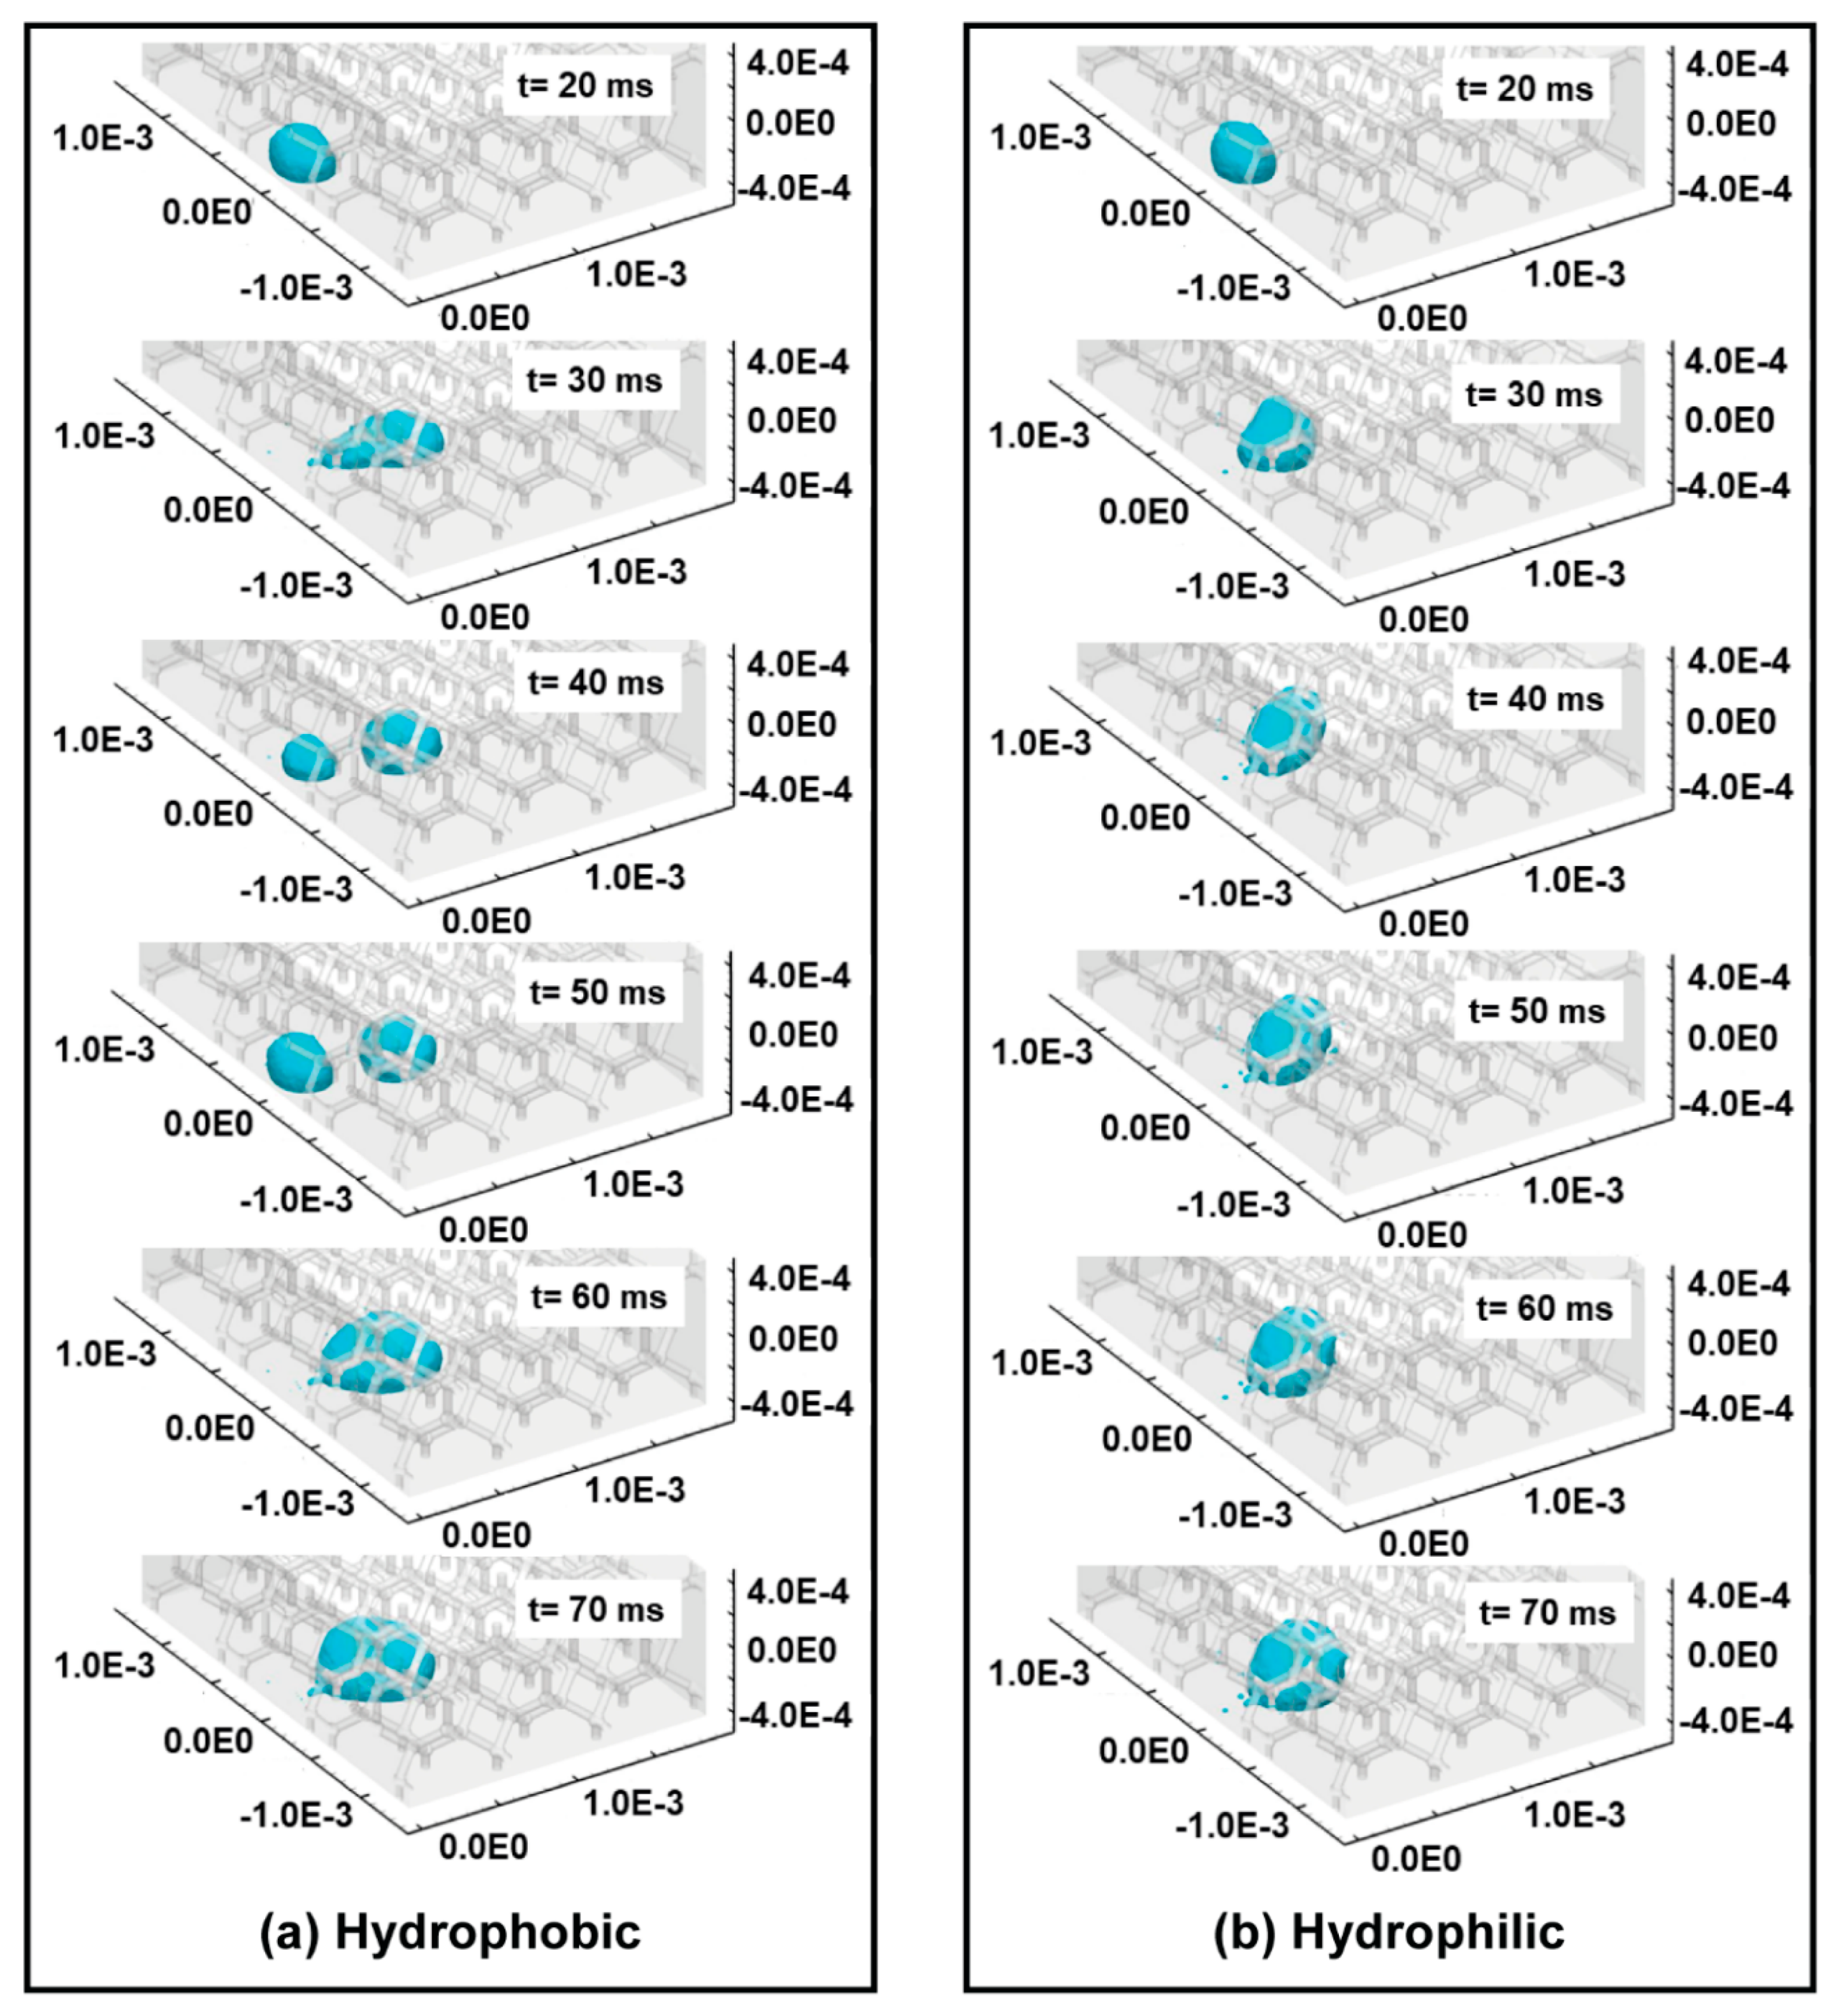
4.2. Numerical Study Results

The numerical model described in Section 3 was used to facilitate better understanding of the fundamental flow behaviour occurring when liquid water entered the foam flow-field from the GDL, and to investigate the upstream flow behaviour seen in the experimental work.
The movement of the initial droplet after liquid injection with Vair = 3 ms−1 is shown in Figure 8. The liquid water droplets are visualised using the isosurface of α w = 0.5 . Initially, the liquid water moved in the direction of the airflow (a), before suddenly decreasing in velocity (b), moving to the opposite direction of flow (c), and then adhering to adjacent metal foam (d), before the droplet size increased (e). The initial backward (upstream) movement of the droplet was consistently observed in simulations of different incoming flow velocity, as shown in Figure 9, confirming the same flow behaviour observed during the ex-situ experiments.
Figure 10 shows the velocity vector distribution around the droplet inside the metal foam. Surface tension caused droplets to attach to the ligaments and trap them inside the pores. It can be seen that most of the aerodynamic forces resulting from the inlet flow acted on the ligaments of the metal foam, so that the momentum of the inlet air flow could not be transferred to the droplet effectively and the droplet did not move well. This suggests that the surface tension was dominant compared with aerodynamic forces and thus the droplet dynamics in the metal foam having small pore size was mainly influenced by surface tension rather than the incoming air flow, as shown by the difference between Foam A and B in the experimental work and through Figure 9 in the numerical work. The backward propagation of liquid droplets observed in both the experimental and numerical work can be explained by greater adhesion force of adjacent upstream ligaments than aerodynamic drag exerted on the droplet. As the amount of water injected continued to increase over time, the droplet size increased.
The increased cross-sectional area made the aerodynamic drag acting on the droplet larger than the contact force, which led the droplet to be detached from the pore and to move in the flow direction. A new droplet was then attached to the different location of metal foam and coalesced with the second droplet that had been detached after it had grown up in the pore, forming a large droplet (Figure 11a). In a PEMFC environment this meant that once liquid water established a presence in the flow-field it was likely to be maintained until the droplet reached a critical volume where aerodynamic forces overcame surface tension adhesion force. Accumulation of liquid water on the GDL surface blocked reactant gas pathways and could lead to localised reactant gas starvation. However, despite this behaviour, many authors have observed improved performance from metal foam flow-fields compared to conventional rib and channel flow-fields during high current density operation. This is likely due to the area of the GDL being blocked by the flow-field rib in conventional designs (around 50%) being significantly greater than the area blocked by liquid water droplets in the metal foam.
The effect of modifying the metal foam hydrophobicity on water transport over multiple pores in the period several minutes after initial liquid addition was studied using the ex-situ experiments. To investigate the effect of the metal foam hydrophobicity on the droplet behaviour at the point of initial injection, VOF simulation was also performed for hydrophilic cases, in which the contact angle of the ligament was given as 70°. The initial droplet behaviour in the hydrophilic case Figure 11b was almost identical to the hydrophobic case Figure 11a. The hydrophilic case showed, however, that even if the size of the droplet increased as the water continued to be injected, the droplet was not separated, due to the hydrophilic ligament, and remained attached to the ligament. For both hydrophobic and hydrophilic cases, compared with the conventional flow channel, the liquid water droplet was not discharged efficiently, which was attributed to significant contact force of the metal foam due to the surface tension.

5. Conclusions

Liquid water transport in a porous metal foam flow-field has been investigated through ex-situ visualisation and two-phase numerical modelling with application to PEMFCs. Both experimental and numerical results show that the transport of liquid water in a porous metal foam flow-field is more complex than a conventional rib and channel flow-field. Whilst investigating different length and time scales, the experimental and numerical results both demonstrate that adhesion forces though surface tension are larger than aerodynamic drag forces under PEMFC conditions. This causes upstream propagation of liquid water after initial injection and liquid water to accumulate in the foam pores until droplet size is sufficient to occupy an adjacent pore, or for aerodynamic drag to overcome surface tension.
A smaller foam pore size was seen to reduce the time taken for liquid water to propagate along the flow-field. Likewise, increasing the hydrophobicity of the foam was also seen to reduce the transport time of liquid water by promoting transport pathways along the edge of the flow-field. Both pore size and hydrophobicity had a greater influence on water transport than air flow rate.
The information obtained from this study can be used to inform future designs, materials and coating of porous flow-fields for improved water management and PEMFC performance.

Supplementary Materials

The underlying research used in this publication can be found at 10.17028/rd.lboro.7775843.

Author Contributions

Conceptualisation, R.C., K.K. and A.F.; methodology, K.K., A.F., J.G. and D.B.; software, K.K.; validation, A.F., J.G. and D.B.; writing—original draft preparation, A.F. and K.K.; writing—review and editing, A.F., K.K, J.G, D.B. and R.C; funding acquisition, R.C. and K.K.

Funding

This research was funded by the Engineering and Physical Sciences Research Council (EPSRC) under grant number EP/M023508/1 and EP/L015749/1, supported by the International Collaborative Energy Technology R&D Program of the Korea Institute of Energy Technology Evaluation and Planning (KETEP) and granted financial resources from the Ministry of Trade, Industry and Energy, Republic of Korea (No. 20148520120160).

Conflicts of Interest

The authors declare no conflict of interest. The funders had no role in the design of the study; in the collection, analyses, or interpretation of data; in the writing of the manuscript; or in the decision to publish the results.

References

  1. Larminie, J.; Dicks, A. Fuel Cell Systems Explained; Wiley Online Library: Hoboken, NJ, USA, 2003; ISBN 047084857X. [Google Scholar]
  2. Sasmito, A.P.; Kurnia, J.C.; Mujumdar, A.S. Numerical evaluation of various gas and coolant channel designs for high performance liquid-cooled proton exchange membrane fuel cell stacks. Energy 2012, 44, 278–291. [Google Scholar] [CrossRef]
  3. Wang, C.; Zhang, Q.; Shen, S.; Xiaohui, Y.; Zhu, F.; Cheng, X. The respective effect of under-rib convection and pressure drop of flow fields on the performance of PEM fuel cells. Nature 2017, 7, 1–9. [Google Scholar] [CrossRef]
  4. Song, M.; Kim, H.Y.; Kim, K. Effects of hydrophilic/hydrophobic properties of gas flow channels on liquid water transport in a serpentine polymer electrolyte membrane fuel cell. Int. J. Hydrogen Energy 2014, 39, 19714–19721. [Google Scholar] [CrossRef]
  5. Kim, H.Y.; Jeon, S.; Song, M.; Kim, K. Numerical simulations of water droplet dynamics in hydrogen fuel cell gas channel. J. Power Sources 2014, 246, 679–695. [Google Scholar] [CrossRef]
  6. Alrahmani, M.; Chen, R.; Ibrahim, S.; Patel, S. A Numerical Study on the Effects of Gas Channel Wettability in PEM Fuel Cells. ECS Trans. 2014, 48, 81–92. [Google Scholar] [CrossRef] [Green Version]
  7. Meyer, Q.; Ashton, S.; Jervis, R.; Finegan, D.P.; Boillat, P.; Cochet, M.; Curnick, O.; Reisch, T.; Adcock, P.; Shearing, P.R.; et al. The Hydro-electro-thermal Performance of Air-cooled, Open-cathode Polymer Electrolyte Fuel Cells: Combined Localised Current Density, Temperature and Water Mapping. Electrochim. Acta 2015, 180, 307–315. [Google Scholar] [CrossRef] [Green Version]
  8. Trogadas, P.; Cho, J.I.S.; Neville, T.P.; Marquis, J.; Wu, B.; Brett, D.J.L.; Coppens, M.-O. A lung-inspired approach to scalable and robust fuel cell design. Energy Environ. Sci. 2018, 11, 136–143. [Google Scholar] [CrossRef] [Green Version]
  9. Kariya, T.; Hirono, T.; Funakubo, H.; Shudo, T. Effects of the porous structures in the porous flow field type separators on fuel cell performances. Int. J. Hydrogen Energy 2014, 39, 15072–15080. [Google Scholar] [CrossRef]
  10. Yoshida, T.; Kojima, K. Toyota MIRAI Fuel Cell Vehicle and Progress Toward a Future Hydrogen Society. Interface Mag. 2015, 24, 45–49. [Google Scholar] [CrossRef] [Green Version]
  11. Murphy, O.J.; Cisar, A.; Clarke, E. Low-cost light weight high power density PEM fuel cell stack. Electrochim. Acta 1998, 43, 3829–3840. [Google Scholar] [CrossRef]
  12. Kumar, A.; Reddy, R.G. Materials and design development for bipolar/end plates in fuel cells. J. Power Sources 2004, 129, 62–67. [Google Scholar] [CrossRef]
  13. Tseng, C.-J.; Tsai, B.T.; Liu, Z.-S.; Cheng, T.-C.; Chang, W.-C.; Lo, S.-K. A PEM fuel cell with metal foam as flow distributor. Energy Convers. Manag. 2012, 62, 14–21. [Google Scholar] [CrossRef]
  14. Tsai, B.-T.; Tseng, C.-J.; Liu, Z.-S.; Wang, C.-H.; Lee, C.-I.; Yang, C.-C.; Lo, S.-K. Effects of flow field design on the performance of a PEM fuel cell with metal foam as the flow distributor. Int. J. Hydrogen Energy 2012, 37, 13060–13066. [Google Scholar] [CrossRef]
  15. Shin, D.K.; Yoo, J.H.; Kang, D.G.; Kim, M.S. Effect of Cell Size in Metal Foam Inserted to the Air Channel of Polymer Electrolyte Membrane Fuel Cell for High Performance. Renew. Energy 2017, 115, 663–675. [Google Scholar] [CrossRef]
  16. Tabe, Y.; Nasu, T.; Morioka, S.; Chikahisa, T. Performance characteristics and internal phenomena of polymer electrolyte membrane fuel cell with porous flow field. J. Power Sources 2013, 238, 21–28. [Google Scholar] [CrossRef] [Green Version]
  17. Lefebvre, L.-P.; Banhart, J.; Dunand, D.C. Porous metals and metallic foams: Current status and recent developments. Adv. Eng. Mater. 2008, 10, 775–787. [Google Scholar] [CrossRef]
  18. Kim, M.; Kim, C.; Sohn, Y. Application of Metal Foam as a Flow Field for PEM Fuel Cell Stack. Fuel Cells 2018, 18, 123–128. [Google Scholar] [CrossRef]
  19. Fly, A.; Butcher, D.; Meyer, Q.; Whiteley, M.; Spencer, A.; Kim, C.; Shearing, P.R.; Brett, D.J.L.; Chen, R. Characterisation of the diffusion properties of metal foam hybrid flow- fields for fuel cells using optical flow visualisation and X-ray computed tomography. J. Power Sources 2018, 395, 171–178. [Google Scholar] [CrossRef]
  20. Fly, A.; Meyer, Q.; Whiteley, M.; Iacoviello, F.; Neville, T.; Shearing, P.R.; Brett, D.J.L.; Kim, C.; Chen, R. X-ray tomography and modelling study on the mechanical behaviour and performance of metal foam flow-fields for polymer electrolyte fuel cells. Int. J. Hydrogen Energy 2019, 44, 7583–7595. [Google Scholar] [CrossRef]
  21. Calvo, S.; Beugre, D.; Crine, M.; Léonard, A.; Marchot, P.; Toye, D. Phase distribution measurements in metallic foam packing using X-ray radiography and micro-tomography. Chem. Eng. Process. Process Intensif. 2009, 48, 1030–1039. [Google Scholar] [CrossRef]
  22. Wallenstein, M.; Hafen, N.; Heinzmann, H.; Schug, S.; Arlt, W.; Kind, M.; Dietrich, B. Qualitative and quantitative insights into multiphase flow in ceramic sponges using X-ray computed tomography. Chem. Eng. Sci. 2015, 138, 118–127. [Google Scholar] [CrossRef]
  23. Brackbill, J.U.; Kothe, D.B.; Zemach, C. A continuum method for modeling surface tension. J. Comput. Phys. 1992, 100, 335–354. [Google Scholar] [CrossRef]
  24. ANSYS FLUENT 12.0 Theory Guide; ANSYS Inc.: Canonsburg, PA, USA, 2009.
Figure 1. Cross section illustration of (a) conventional rib and channel flow-field and (b) porous metal foam flow-field.
Energies 12 01186 g001
Figure 2. Ex-situ test fixture design (a) Top view, (b) Side section view through mixing point.
Energies 12 01186 g002
Figure 3. Numerical model (a) Computational domain, (b) Mesh.
Energies 12 01186 g003
Figure 4. Propagation of liquid water in foam A (1.6 mm thick) air flow (left to right), 7.7 mm × 5.0 mm field of view. After (a) 15 s, (b) 60 s and (c) 120 s at 0.5 L min−1 air flow and (d) 15 s, (e) 60 s and (f) 120 s at 2.0 L min−1 air flow.
Energies 12 01186 g004
Figure 5. Liquid water penetration length for foam A.
Energies 12 01186 g005
Figure 6. Propagation of liquid water in foam B (3.0 mm thick), air flow (left to left), 7.7 mm × 5.0 mm field of view. After (a) 60 s, (b) 240 s and (c) 600 s at 0.5 L min−1 air flow and (d) 60 s, (e) 240 s and (f) 600 s at 2.0 L min−1 air flow
Energies 12 01186 g006
Figure 7. Liquid water penetration length for foam B.
Energies 12 01186 g007
Figure 8. Initial behaviour of water droplet at 3 ms−1 air flow rate; (a) 0.5 ms, (b) 1.5 ms, (c) 3.0 ms, (d) 6.0 ms and (e) 15 ms after liquid water injection.
Energies 12 01186 g008
Figure 9. Comparison of water droplet propagation 20 ms after liquid injection for (a) 2 ms−1, (b) 3 ms−1 and (c) 4 ms−1 air flow condition.
Energies 12 01186 g009
Figure 10. Distribution of velocity around the attached water droplet at t = 60 ms, air flow rate 3 ms−1 in hydrophobic foam.
Energies 12 01186 g010
Figure 11. Effects of hydrophobicity on the droplet movement for airflow rate 3 ms−1 (a) hydrophobic and (b) hydrophilic.
Energies 12 01186 g011
Table 1. Metal foam properties.
ParameterFoam AFoam B
Thickness1.6 mm3.0 mm
MaterialNickelNickel
Pore size0.23 mm0.95 mm
Porosity97%95%
Table 2. Time for liquid water to reach the end of the foam sample after initially entering at 3.0 gh−1.
FoamAir Flow Rate (Lmin−1)Time for Liquid to Reach End of Sample (s)
Foam A0.5630
Foam A2.0195
Foam B0.51480
Foam B2.01890
Foam B (18.8 wt % PTFE)0.5550
Foam B (18.8 wt % PTFE)2.0260

