Article

NOx Reduction in Diesel-Hydrogen Engines Using Different Strategies of Ammonia Injection

1
Nautical Sciences and Marine Engineering Department, Universidade da Coruña, 15403 Ferrol, Spain
2
Norplan Engineering S.L., 15570 Naron, Spain
*
Author to whom correspondence should be addressed.
Energies 2019, 12(7), 1255; https://doi.org/10.3390/en12071255
Submission received: 19 February 2019 / Revised: 27 March 2019 / Accepted: 28 March 2019 / Published: 1 April 2019

Abstract

:
In order to reduce NOx emissions in internal combustion engines, the present work analyzes a measurement which consists of injecting ammonia directly into the combustion chamber. A commercial compression ignition engine fueled with a hydrogen-diesel blend was studied numerically. It was verified that the flow rate shape in which the ammonia was injected, particularly rectangular, triangular, or parabolic, as well as the injection duration had an important influence on NOx reduction. A 11.4% improvement in NOx reduction, corresponding to an overall reduction of 78.2% in NOx, was found for parabolic injection shape and 1º injection duration. The effect on carbon dioxide, carbon monoxide, and hydrocarbon emissions, as well as brake-specific consumption, was negligible.
Keywords:
CFD; NOx; hydrogen; ammonia; engine

1. Introduction

Nowadays, it is very important to reduce emissions in internal combustion engines as well as the dependency on fossil fuels. The current concerns about the limitation of fossil fuels and pollution are strong incentives for finding alternative sources. In this regard, both hydrogen and ammonia constitute promising fuels because these may be produced from alternative sources [1]. Since ammonia and hydrogen are carbon-free, they do not produce carbon dioxide (CO2), carbon monoxide (CO), unburned hydrocarbons (HC), nor particulates. Ammonia and hydrogen are also sulphur-free, and consequently, the emissions of sulphur oxides (SOx) are also negligible, since these depend on the sulphur content in the fuel [2,3,4,5]. In internal combustion engines, ammonia-hydrogen blends complement their properties since ammonia is characterized by a narrow flammability range, high ignition energy, low combustion velocity, and high auto-ignition temperature. On the other hand, hydrogen presents a wide flammability range, low ignition energy, high combustion velocity, and lower auto-ignition temperature [6,7]. Besides, hydrogen can be obtained directly from ammonia [8,9,10,11]. Some investigations [12,13,14,15] proposed hydrogen as a promoter to speed up diesel-ammonia combustion. Technologically, the most employed option is to inject ammonia into the intake air. Boretti [16] analyzed several injection procedures in a dual fuel ammonia-hydrogen engine and concluded that the most adequate option is to inject ammonia into the intake air. Sahin et al. [17] analyzed ammonia injection into the intake air of a small engine and obtained advantages regarding efficiency and CO2 emissions, but at expenses of increments in NOx, HC, and CO. Reiter et al. [18] also employed injection of ammonia into the intake air of an engine and obtained a noticeable reduction in soot emissions but at the expense of increments in NOx, HC, CO, and consumption. The authors indicated that the increment in NOx emissions is mainly produced by ammonia oxidation. Nevertheless, they obtained that when less than 40% of the fuel energy is provided by ammonia, NOx emissions are lower than for a diesel engine because the substitution by ammonia lowers the combustion temperature and thus reduces the thermal NOx formation mechanism. Another ammonia fumigation study was developed by Gill et al. [19], who injected ammonia and hydrogen into the intake air of a diesel engine and obtained reductions in consumption and CO2 emissions as well as increments in HC and NOx emissions.
Hydrogen usually increases NOx emissions, especially at high loads, due to the high temperatures reached in the combustion chamber [20,21,22]. This constitutes an important problem, since the transport sector, especially internal combustion engines, is considered the major source of NOx formation worldwide [23,24]. The production of NOx from oxygen and nitrogen in the air is a problem associated to the combustion of fuels, and its reduction has been investigated for a long time. As a possible solution to reduce NOx, hydrogen allows internal combustion engines to operate under ultra-lean combustion and thus under low-temperature combustion and lower NOx emissions, but at the expense of reducing efficiency noticeably [25,26,27]. Other procedures to reduce NOx emissions in internal combustion engines can be briefly summarized in primary and secondary measures. The latter consist of removing NOx from the exhaust gases by downstream cleaning techniques, while the former consist of reducing NOx produced during combustion by reducing the concentrations of oxygen and nitrogen as well as controlling the temperatures reached in the combustion process. The high price of after-treatment systems has promoted primary measures. In hydrogen engines, several techniques have been documented in the literature, such as modification of the injection parameters, reduction of the compression ratio, exhaust gas recirculation (EGR), water injection, etc.
As another measure to reduce NOx emissions in hydrogen-ammonia engines, several authors proposed to inject ammonia directly into the cylinder during the expansion stroke. As this is a novelty and recent technology, the literature about direct ammonia injection is still scarce. One can refer to Miyamoto et al. [28], who analyzed a diesel engine and showed that NOx emissions can be reduced by up to 60% by optimizing the injection timings. Larbi and Bessrorur [29] also found a substantial reduction in NOx emissions by injecting ammonia directly into the combustion chamber. Lamas et al. [30] verified that ammonia injection is much more efficient than water injection to reduce NOx.
Against this background, it can be concluded that an extended amount of literature has been developed on the applications of ammonia and hydrogen as fuels. Nevertheless, the research about direct ammonia injection into the combustion chamber as a NOx reduction measure is still scarce. The present paper proposes a CFD (Computational Fluid Dynamics) model to analyze NOx reduction in an internal combustion engine fueled with a hydrogen-diesel blend. Particularly, this work analyzes the commercial compression ignition engine MAN D2840LE V10. The process of NOx reduction from ammonia injection directly into the combustion chamber was analyzed. Since ammonia is toxic, it is important to avoid un-reacted ammonia to slip into the atmosphere. For this reason, several injection shapes and durations were analyzed in order to optimize NOx reduction and thus reduce ammonia slip.

2. Materials and Methods

The MAN D2840LE V10 analyzed, Figure 1, is a four-stroke, turbocharged, and direct injection engine. Table 1 summarizes the main technical specifications.
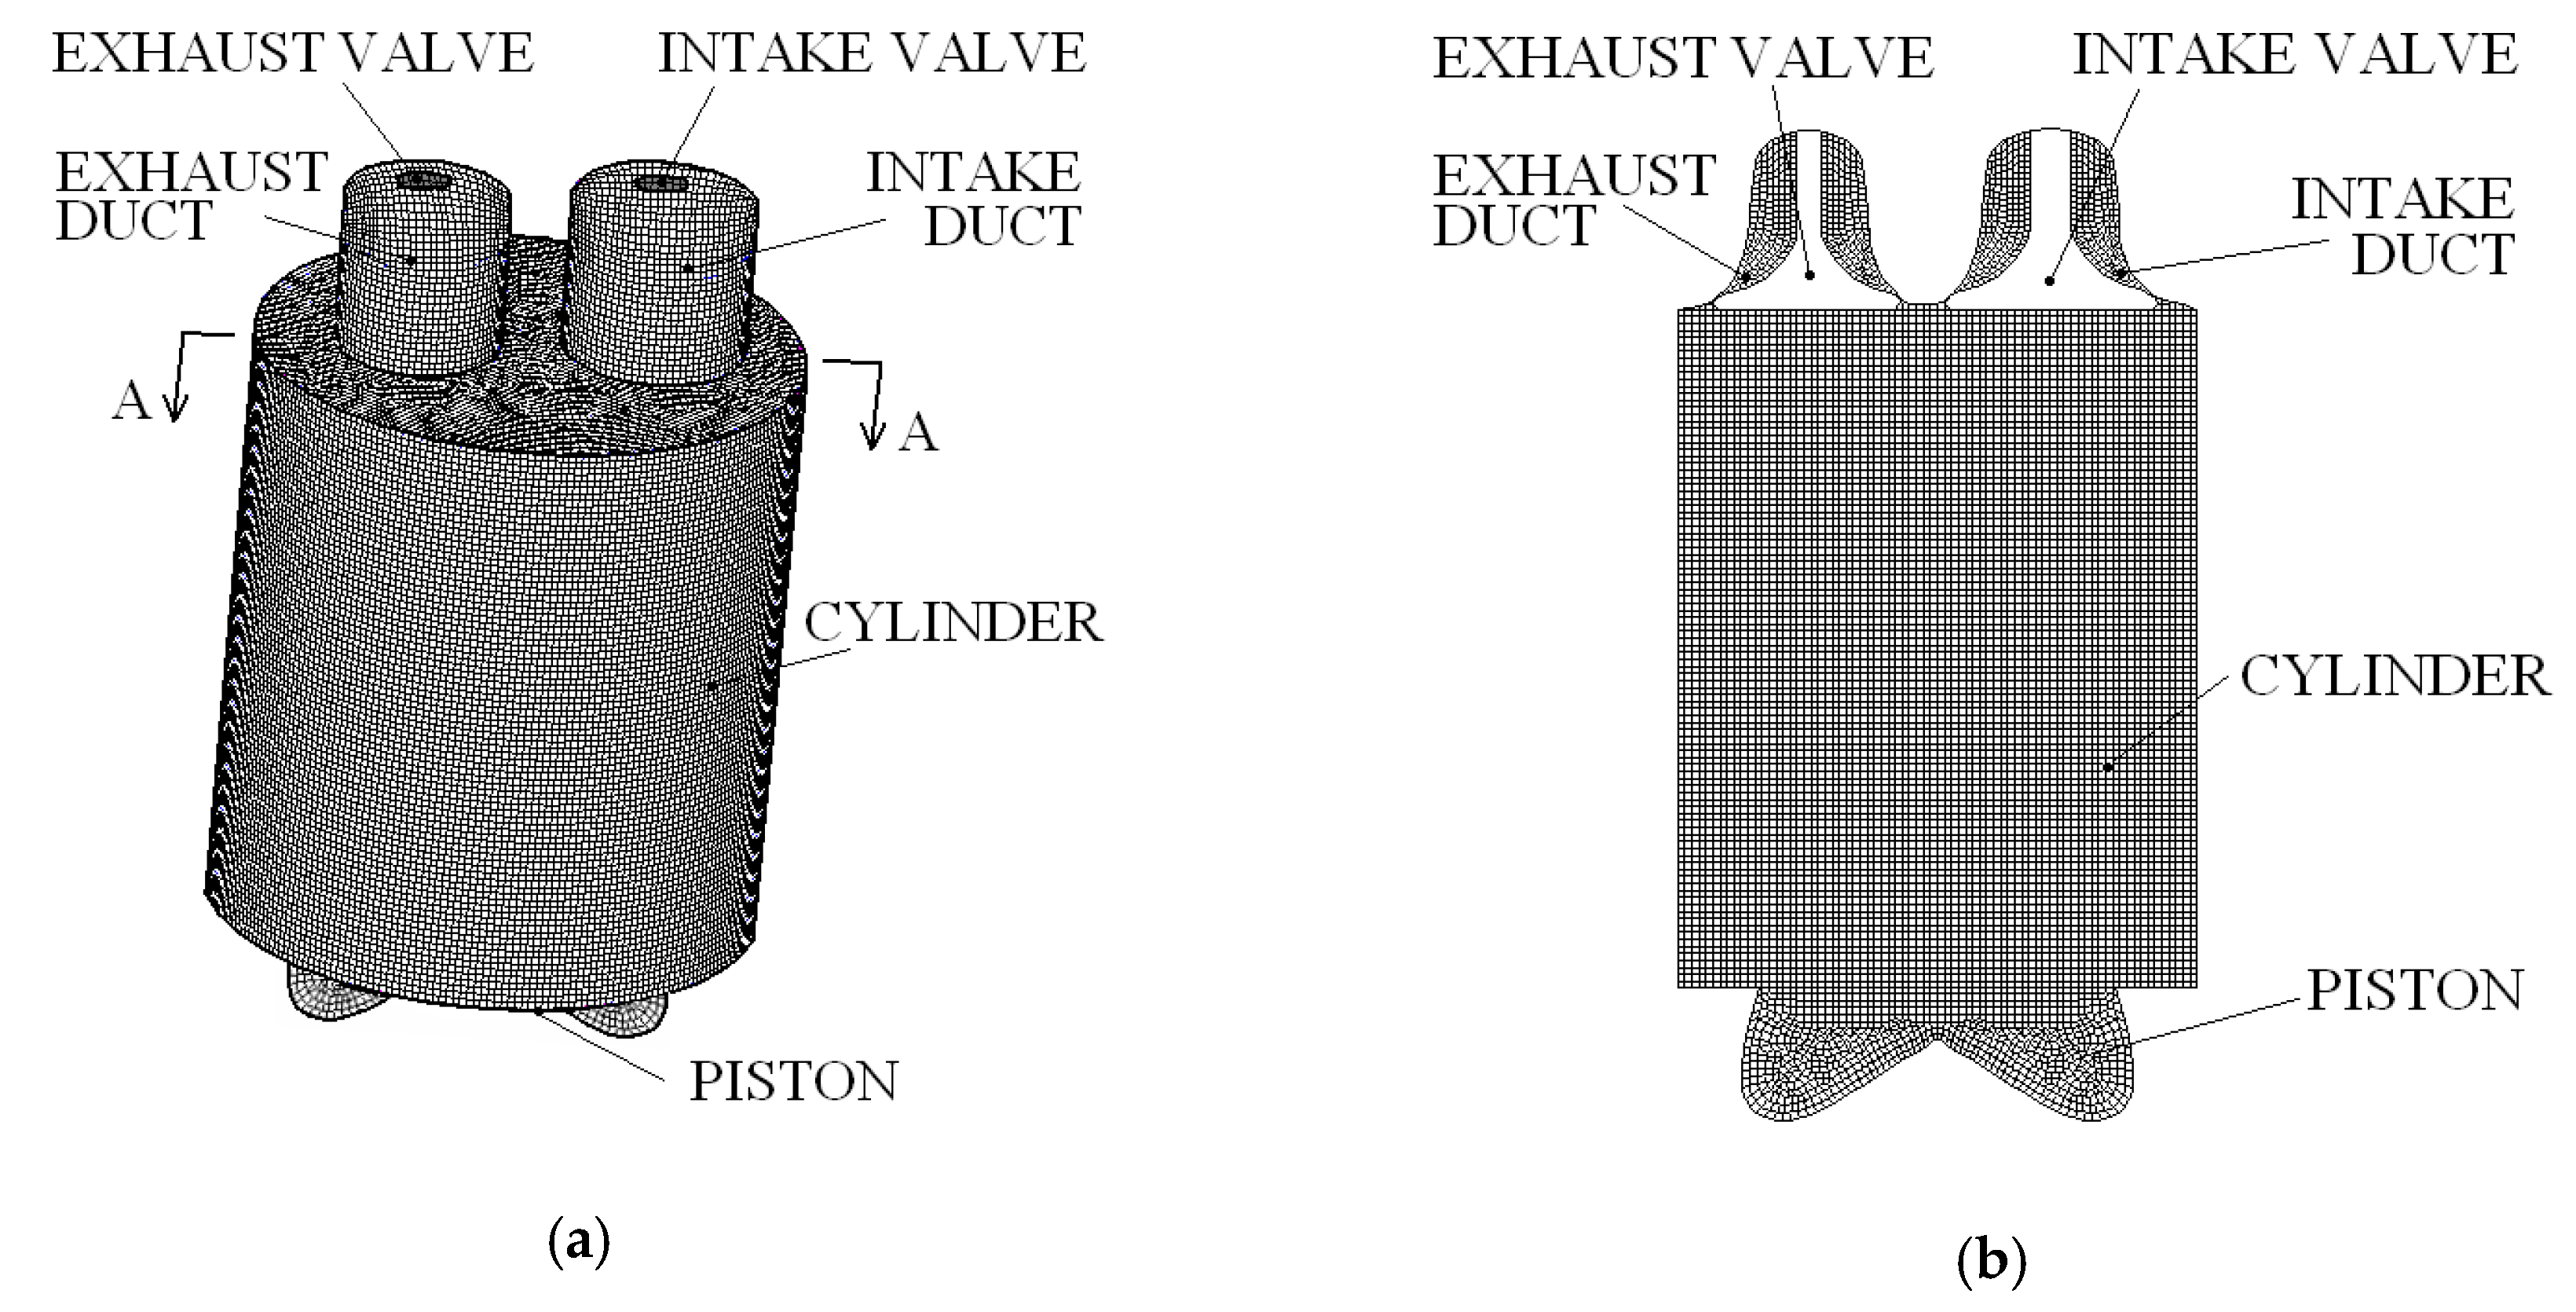
The photograph in Figure 2 illustrates the combustion chamber at the piston head. The computational grid is shown in Figure 3. A deforming mesh was employed in order to implement the movement to the piston and valves. Figure 3a represents the tri-dimensional grid at the bottom dead center and Figure 3b represents the AA cross section. All elements are hexahedral, and the mesh size was refined around the valves in order to adapt properly to their opening and closing. Several meshes with different elements and sizes were tested to verify the adequacy of the mesh.
The open software OpenFOAM was employed for the simulations. A new in-house solver based on C++ language was programmed. The solver is based on the RANS (Reynolds-averaged Navier–Stokes) equations of conservation of mass, momentum, and energy, Equations (1)–(3).
ρ t + x i ( ρ u i ) = 0
t ( ρ u i ) + x j ( ρ u i u j ) = p x i + τ i j x j + x j ( ρ u i u j ¯ )
t ( ρ H ) + x i ( ρ u i H ) = x i ( μ t σ t H x i ) + S r a d
In the equations above, ρ is the density, τij is the viscous stress tensor, σt is the turbulent Prandtl number, μt is the turbulent viscosity, and H is the total enthalpy, computed by the sum of the enthalpy of all species. The enthalpy of each species was computed by
h k = T r e f T c p , k d T + h k 0 ( T r e f , k )
where cp,k is the specific heat of species k, and h k 0 is the formation enthalpy at the reference temperature Tref,k.
The term Srad in Equation (3) is a source to include radiation heat transfer. The P1 radiation model was employed, according to which the radiative source term for the enthalpy equation is:
S r a d = a G 4 a σ T 4
where a is the absorption coefficient, 0.2 [31], and G is the incident radiation, obtained by the following transport equation:
( 1 3 a G ) a G + 4 a σ T 4 = 0
A common procedure to model the Reynolds stresses, ρ u i u j ¯ , is the Boussinesq hypothesis to relate the Reynolds stresses to the mean velocity gradients, Equation (7).
ρ u i u j ¯ = μ t ( u i x j + u j x i ) 2 3 ρ k δ i j
where δij is the Kronecker delta (δi = 1 if i = j and δi =0 if ij), which is included to make the formula applicable to the normal Reynolds stresses for which i = j, Lamas and Rodriguez [32]. The turbulent viscosity was modeled by the k-ε turbulence model, according to which μt = ρCµk2. The k-ε turbulence model implements two additional transport equations, one for the turbulence kinetic energy, k, Equation (8) and a further one for its dissipation rate, ε, Equation (9).
t ( ρ k ) + x i ( ρ k u i ) = x j ( μ t σ k k x j ) + 2 μ t S i j S i j ρ ε
t ( ρ ε ) + x i ( ρ ε u i ) = x j ( μ t σ ε ε x j ) + C 1 ε ε k 2 μ t S i j S i j C 2 ε ρ ε 2 k
In the equations above Sij is the rate of deformation tensor, C1ε and C2ε are constants and the terms σk and σε represent the turbulent Prandtl numbers for k and ε, respectively. The default values were assumed for the model constants, Cµ = 0.09, σk = 1.00, σε = 1.30, C1ε = 1.44, and C2ε = 1.92.
Regarding the simulation of fuel droplet breakup, the Kelvin-Helmholtz and Rayleigh-Taylor breakup models [33] were employed, and the heat-up and evaporation of the droplets was modeled by the Dukowicz model [34].
In order to solve the chemical kinetics, several additional equations must be added to the model. Given a set of N species and m reactions, Equation (10), the local mass fraction of each species, fk, can be expressed by Equation (11).
k = 1 N v k j M k k j k = 1 N v k j M k j = 1 , 2 ,   ,   m
t ( ρ f k ) + x i ( ρ u i f k ) = x i ( μ t S c t f k x i ) + S k
In the equations above, v k j are the stoichiometric coefficients of the reactant species Mk in the reaction j, v k j is the stoichiometric coefficients of the product species Mk in the reaction j, Sct is the turbulent Smidth number, and Sk is the net rate of production of the species Mk by chemical reaction, given by the molecular weight multiplied by the production rate of the species, Equation (12),
S k = M W k d [ M k ] d t
where MWk is the molecular weight of the species Mk and [Mk] its concentration. The net progress rate is given by the production of the species Mk minus the destruction of the species Mk along the m reactions
d [ M k ] d t = j = 1 m { ( v k j v k j ) [ k f j k = 1 N [ M k ] v k j k b j k = 1 N [ M k ] v k j ] }
where kfj and kfb are the forward and backward reaction rate constants for each reaction j.
A reaction mechanism was programmed in the solver by integrating three kinetic schemes: combustion, NOx formation, and NOx reduction. Regarding NOx reduction, the model of Miller and Glarborg [35], based on 24 species and 134 reactions, was employed. This model was validated with experimental results elsewhere [36], verifying that it reproduces the experimental trends with a reasonable accuracy. Regarding NOx formation, the so-called extended Zeldovich mechanism is usually employed in CFD to characterize NOx formation. This model is based on seven species and three reactions [37,38], listed in Appendix A.
Since the goal of the present work was to study NOx, several NOx formation mechanisms were developed and validated with experimental results using 100% diesel fuel. Gasboard-3000 (Wuhan Cubic) series gas analyzers were employed to characterize the composition of the exhaust gas, particularly Gasboard-3030 for HC and Gasboard-3000 for NO, CO, and CO2. This gas analyzer provides NO instead of NOx, but the numerical model and numerous experimental analyses [39] indicated that NOx is primarily NO. The extended Zeldovich model was compared to those of Mellor et al. [40], based on six reactions and eight species; Zabetta and Kilpinen [41], based on 10 reactions and 11 species; and Yang et al. [42], based on 20 species and 43 reactions, listed in Appendix B. The results obtained by these kinetic models at several loads and 1500 rpm are shown in Figure 4. This figure indicates that these models provide a satisfactory correspondence between numerical and experimental NOx trends. Particularly, the extended Zeldovich model provides a 13.9% average error, while Mellor et al. [40] achieve 9.2%, Zabetta and Kilpinen [41] 8.1%, and Yang et al. [42] 5.8%. The R2 resulted in 0.955, 0.958, 0.959, and 0.962 for the extended Zeldovich, Mellor et al. [40], Zabetta and Kilpinen [41], and Yang et al. [42] models, respectively. According to this, the model of Yang et al. [42] was used for the computations in the remainder of the present paper.
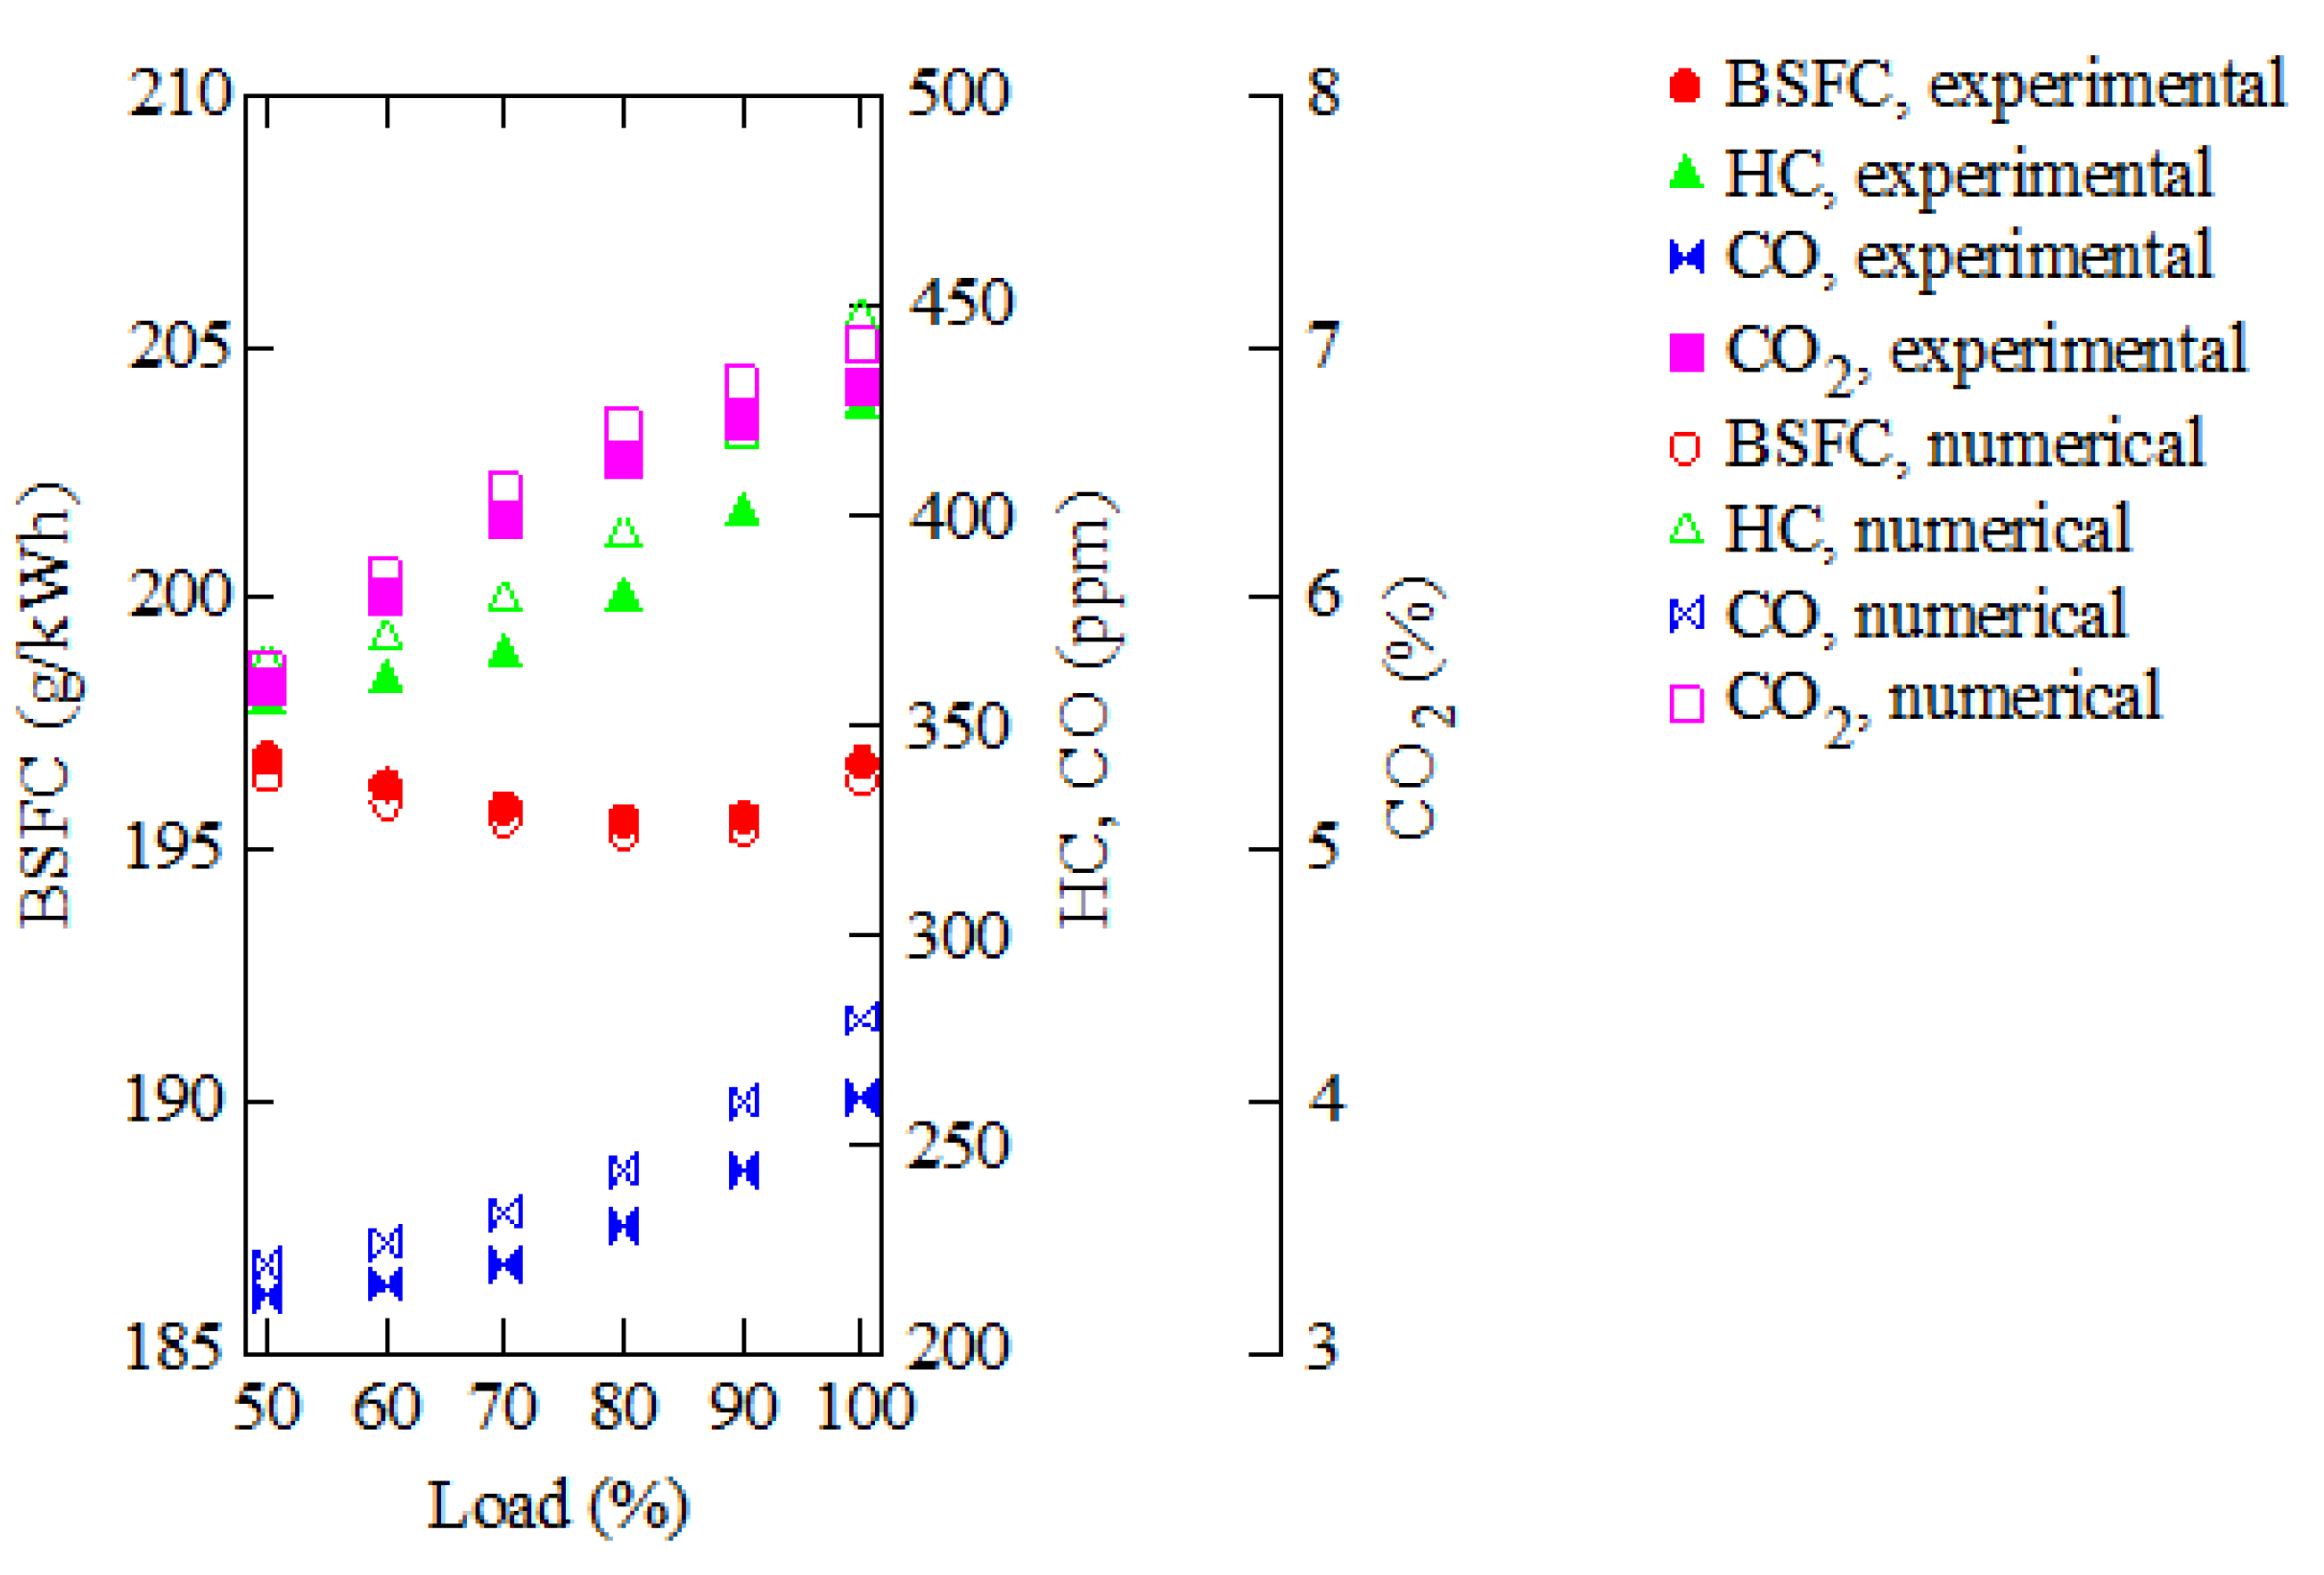
Regarding the combustion mechanism, the simplest procedure is to assume that the kinetics are so fast that chemical species remain at equilibrium [30,36,43]. This hypothesis is commonly used in CFD taking into account the high temperatures reached during combustion, which promote fast kinetics. Nevertheless, a kinetic scheme is more accurate than the equilibrium hypothesis since the warming in the expansion process of an engine and dilution with the excess air elongate the time needed to achieve equilibrium. For instance, in the case of CO and HC, one of the sources of formation are warm regions that are not able to burn properly. In this case, the chemical equilibrium hypothesis leads to overestimating the levels of these species. For this reason, a chemical kinetic model was employed in the present work. Particularly, Ra and Reitz’s [44] model, based on 131 reactions and 41 species, was chosen. HC, CO, and CO2 emissions as well as brake-specific fuel consumption at different loads and 1500 rpm are represented in Figure 5. This figure shows that a reasonable agreement was obtained, since the average error was 6.2%, 6.9%, 4.1%, and 3.8% for HC, CO, CO2, and brake-specific fuel consumption (BSFC), respectively. Several reasons are responsible for the discrepancies between the numerical and experimental results obtained in Figure 4 and Figure 5. Numerical techniques introduce inevitable errors due to the hypotheses assumed and the discretization on both the domain and governing equations. The RANS equations are time-averaged equations and the k-ε is a turbulence model that reproduces, as accurately as possible, the fluid flow. The P1 model for radiation, Kelvin-Helmholtz and Rayleigh-Taylor models for breakup, and Dukowicz model for heat-up and evaporation of the droplets are also models which reproduce, as accurately as possible, the physical mechanisms. Besides, the kinetic models employed are simplifications of the tens of species and hundreds of reactions involved in the chemistry of combustion. More accurate turbulence models such as LES (Large Eddy Simulation) or DNS (Direct Numerical Simulation) are too computationally expensive, as is the simulation of the hundreds of reactions involved. With the advancement of computational resources, it is expected that in the near future it will be possible to employ more accurate turbulence models and more chemical reactions within a reasonable computational time.
Regarding the simulation of fuel droplet breakup, the Kelvin-Helmholtz and Rayleigh-Taylor breakup models [33] were employed, and the heat-up and evaporation of the droplets were modeled by the Dukowicz model [34].

3. Results and Discussion

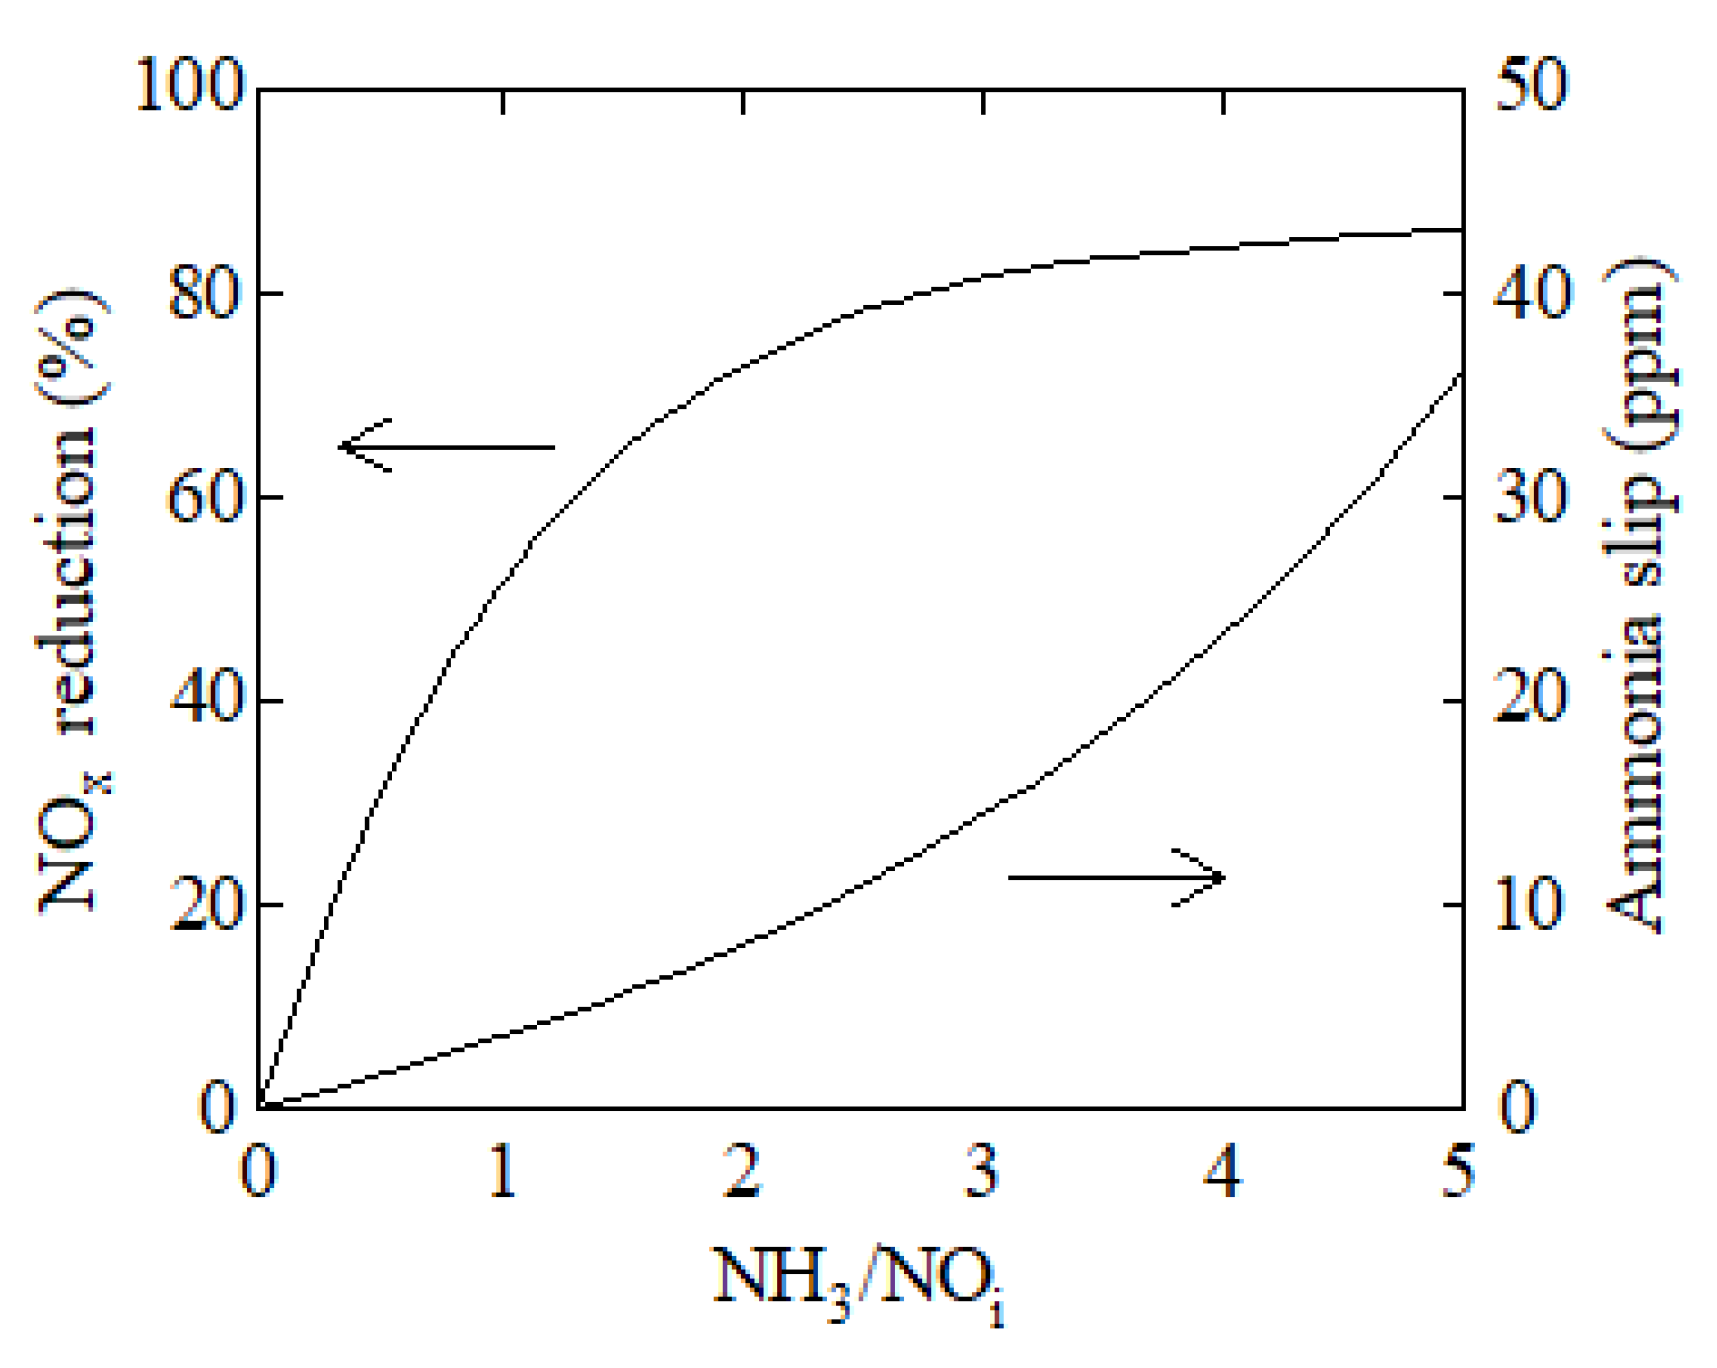
Once the numerical model was validated, it offered an efficient, cheap, and fast method to analyze the performance and emissions of the engine. In the present work, the model was employed to analyze several injection rate shapes, particularly rectangular, triangular, and parabolic. Before that, it was necessary to determine a proper NH3/NOi volumetric ratio, where NOi is the NO concentration in the exhaust gas without ammonia injection. Figure 6 represents the NOx reduction as well as the ammonia slip in the exhaust gas against the NH3/NOi ratio using a rectangular ammonia injection shape, start of ammonia injection 43.2º after top dead center at the end of compression stroke, and 10º injection duration. This figure shows that more NOx reduction is obtained as NH3 is increased. Due to the toxicity of ammonia, it is important to maintain low values of un-reacted ammonia slip to the exhaust. For this reason, a value of 2 was employed as a threshold for NH3/NOi in the remaining discussion of the present paper. Values between 2 and 3 are considered appropriate as well, since NOx reduction levels off around 3. A value greater than 3 provides few improvements in NOx reduction but a considerably higher amount of un-reacted ammonia slips into the atmosphere, since ammonia slip analyses showed a noticeable increment with an increasing NH3/NOi ratio.
Once the quantity of ammonia was determined, another important parameter to study was the shape of ammonia injection. The injection shapes indicated in Figure 7 were analyzed. These are rectangular, triangular, and parabolic. These three injection profiles refered to NH3/NOi = 2 and 10º injection duration. At 1500 rpm, 10º injection duration corresponded to 0.0011 s.
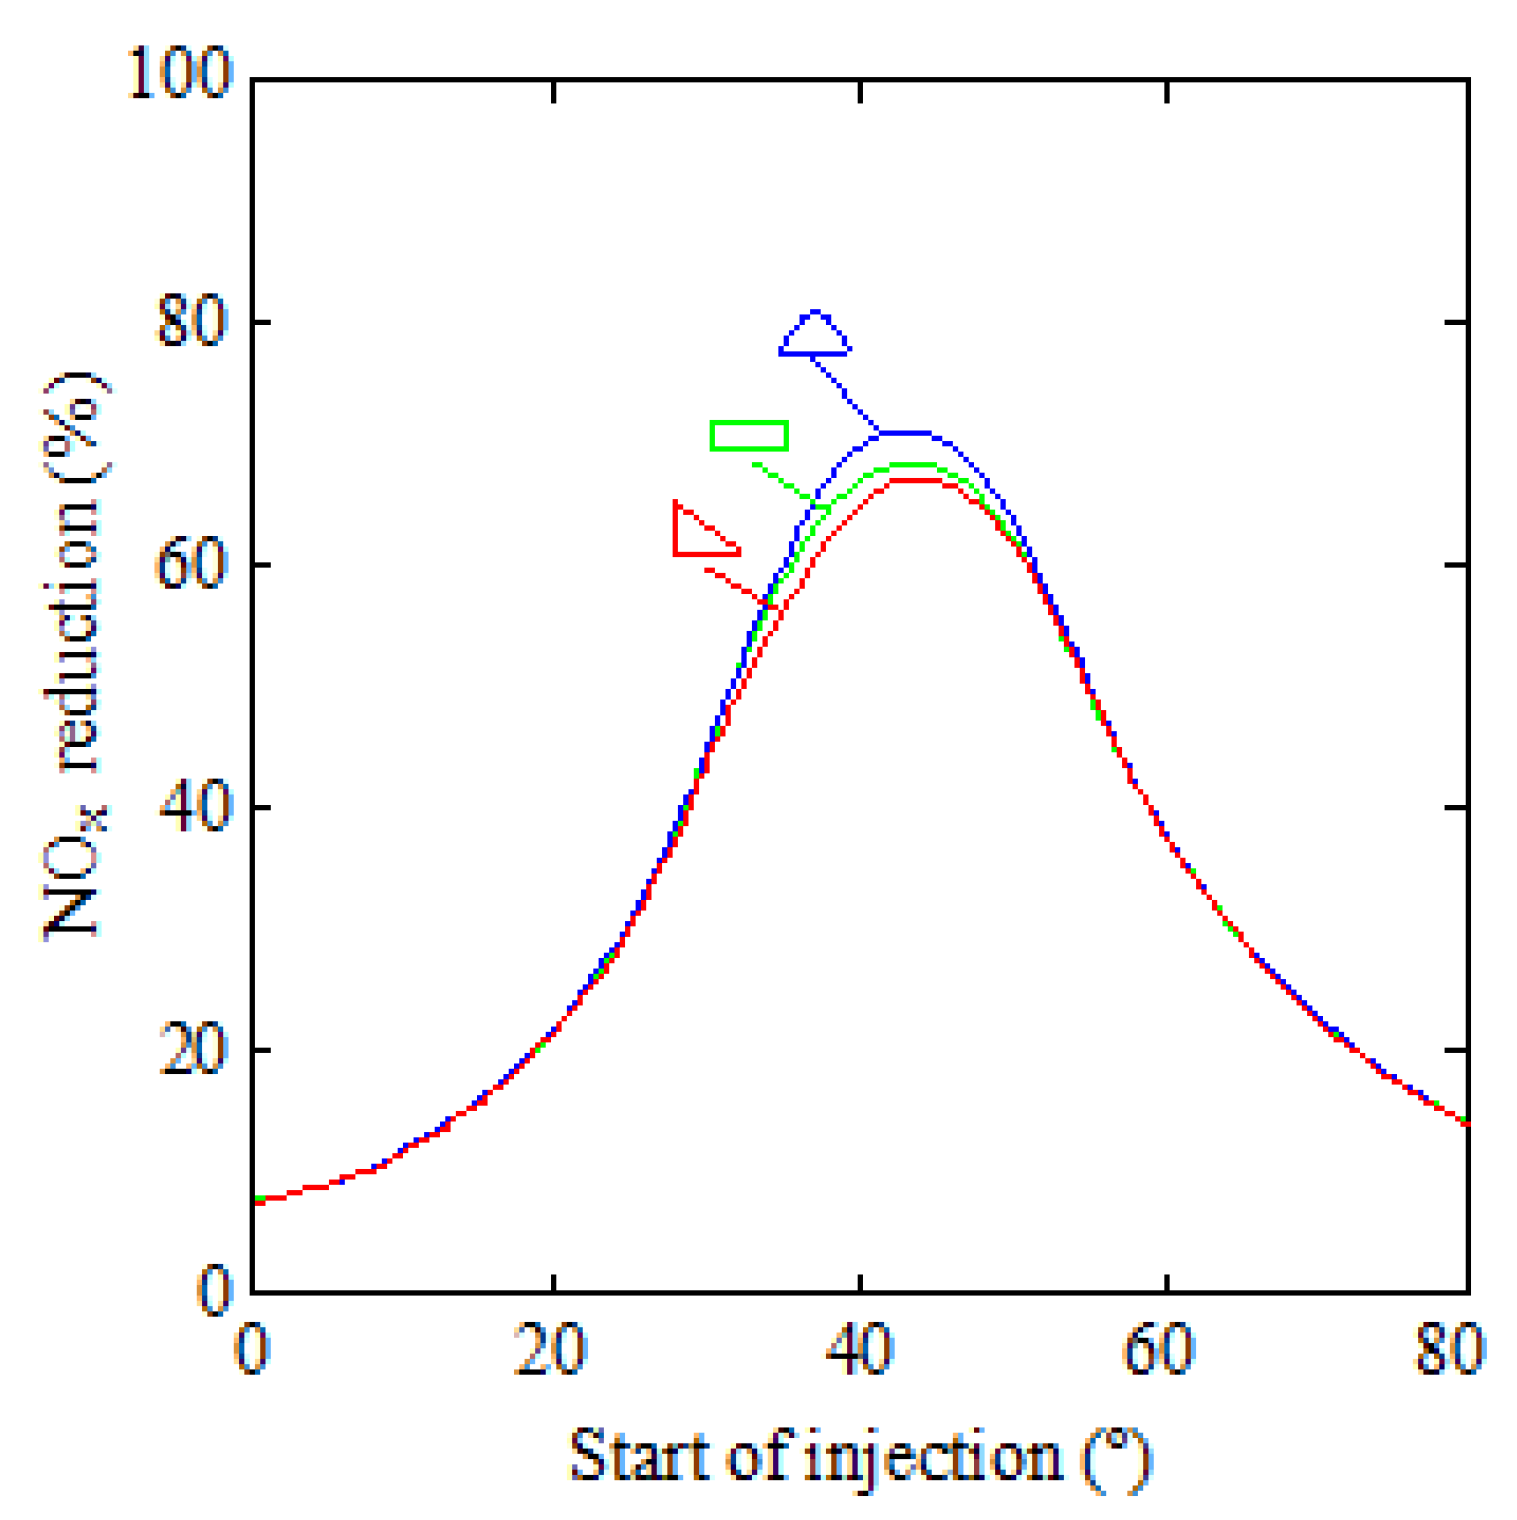
The results for these three shapes are indicated in Figure 8, which illustrates the NOx reduction against the start of ammonia injection using a 10º injection duration. This figure indicates that the instant start of ammonia injection has a noticeable effect on the NOx reduction. The reason is that the process of NOx reduction using ammonia is only efficient in a narrow temperature range. Consequently, in an internal combustion engine, it is too critical to determine the start of ammonia injection due to the variation of the in-cylinder temperature with the crankshaft angle. For the parameters analyzed in Figure 8, the maximum NOx reduction was obtained at start of ammonia injections 43.2º, 45.8º, and 42.9º after top dead center at the end of compression stroke for rectangular, triangular, and parabolic injection shapes, respectively. The corresponding NOx reductions were 68.3%, 66.8, and 71.1% for rectangular, triangular, and parabolic injection shapes, respectively. The reason which explains these differences is that high temperatures promote ammonia to oxidize to NO instead of reacting with NO, while at lower temperatures, the reduction reactions become slow and un-reacted ammonia can be emitted. According to this, the ammonia must be injected progressively from 0 to a maximum value and then decrease to 0 again. The parabolic shape is the shape that adapts more properly to this tendency while the triangular shape is the most different. Regarding brake-specific consumption and other emissions, such as CO, HC, and CO2, it was verified that the effect was negligible.
Another interesting parameter to analyze is the injection duration. Figure 9 shows the NOx reduction against the duration of ammonia injection. In order to obtain these data, the ammonia injection was equally shortened at start and end, using the same quantity of ammonia injected. The maximum NOx reduction obtained was 78.2%, corresponding to the parabolic shape at 1º injection duration. As can be seen in Figure 9, as the duration of ammonia injection was shortened, the NOx reduction increased. The reason is that lower injection durations facilitate the supply of ammonia at the optimum crankshaft angle and thus at the optimum in-cylinder temperature. On the other hand, longer injections deviate more from the optimum crankshaft angle and thus from the optimum in-cylinder temperature to reduce NOx. Particularly, from the data obtained from Figure 9, the NOx reduction improved from 66.8% for the triangular shape with 10º injection duration to 78.2% for the parabolic shape with 1º injection duration; i.e., a 11.4% NOx improvement was obtained. Another conclusion that can be obtained from Figure 9 is that the differences between rectangular, triangular, and parabolic shapes become smaller as the injection duration is reduced. The reason is that at shorter injection rates the ammonia is only injected at the optimum crankshaft angle and the injection duration is so short that the shape has a negligible influence. In practical applications, the injection rate can be shortened to the technically feasible level. Regarding brake-specific consumption and other emissions, such CO, HC, and CO2, it was verified that the effect was negligible.

4. Conclusions

This paper analyzes the capability of ammonia to reduce NOx in a hydrogen-diesel engine. The motivation comes from the importance of the reduction of NOx emissions which are usually produced when hydrogen is added to internal combustion engines, and the increasingly stringent NOx restrictions. A CFD model was developed to analyze the commercial engine MAN D2840LE V10.
Since ammonia is toxic, it is important to optimize NOx reduction, minimizing the un-reacted ammonia slipping into the atmosphere. According to this, a NH3/NOi proportion around 2 was considered adequate. It was verified that the NOx reduction process using ammonia is highly dependent on the in-cylinder temperature. According to this, several ammonia injection shapes (rectangular, triangular, and parabolic) and durations (from 1º to 10º) were analyzed. The most appropriate case provided a 78.2% NOx reduction using a parabolic injection shape and 1º injection duration. On the other hand, the worst case analyzed provided a 66.8% NOx reduction using a triangular shape and 10º injection duration. As the injection duration is reduced, the differences between rectangular, triangular, and parabolic shapes become practically negligible. In practical applications, the injection rate can be shortened to the level that is technically feasible. For instance, in the present engine, which runs at 1500 rpm, 1º crankshaft angle corresponds to 0.00011 s. Current electromagnetic or solenoid injectors have longer response times but some piezo-injectors are able to switch on an off in tens of microseconds. These short injections provide practically identical results for rectangular, triangular, and parabolic injection shapes.
The main contribution of the present paper is that it provides a cheap and fast tool for studying NOx reduction in internal combustion engines. This tool constitutes an alternative to expensive and laborious experimental tests. It can be employed to study the influence of parameters such as the exhaust and intake pressures, number and position of injectors, nozzles, injection pressure, cam profile design, compression ratio, etc.
In future works, the goal is to employ this numerical model to study other engine operation conditions and other emission reduction procedures, such as water addition, common rail, exhaust gas recirculation, etc. Furthermore, further important work is needed to develop more tests in this and other engines in order to obtain a more complete validation of the numerical model.

Author Contributions

Conceptualization, M.I. Lamas and C.G. Rodriguez; methodology, M.I. Lamas and C.G. Rodriguez; software, M.I. Lamas and C.G. Rodriguez; validation, M.I. Lamas and C.G. Rodriguez; formal analysis, M.I. Lamas and C.G. Rodriguez; investigation, M.I. Lamas and C.G. Rodriguez; resources, M.I. Lamas and C.G. Rodriguez; writing—original draft preparation, M.I. Lamas; writing—review and editing, M.I. Lamas.

Funding

This research received no external funding.

Acknowledgments

The authors would like to express their gratitude to Talleres Pineiro S.L., sale and repair of marine engines, as well as to Norplan Engineering S.L., and recommend the courses on CFD with OpenFOAM and C++ applied to OpenFOAM available at www.technicalcourses.net.

Conflicts of Interest

The authors declare no conflict of interest.

Appendix A

Reaction equations of the Zeldovich mechanism. The rate coefficients are in the form k f = A T b e E 0 / T (Table A1).
Table A1. Zeldovich mechanism.
ReactionA (cm3/mol s)bE0 (K)
1N2 + O ↔ NO + N1.800∙1014038370
2N + O2 ↔ NO + O1.800∙101014680
3N + OH ↔ NO + H7.100∙10130450

Appendix B

Reaction equations of the Yang et al. [42] mechanism. The rate coefficients are in the form k f = A T b e E 0 / T (Table A2).
Table A2. Yang et al. [42] mechanism.
ReactionA (cm3/mol s)bE0 (K)
1N2 + O ↔ NO + N1.800∙10140.038370
2N + O2 ↔ NO + O1.800∙10101.04680
3N + OH ↔ NO + H7.100∙10130.0450
4N2O + O ↔ 2NO6.900∙10130.013400
5N2O + O ↔ N2 + O21.000∙10140.014200
6N2O + H ↔ N2 + OH7.587∙10130.07600
7N2O + N2 ↔ 2N2 + O6.918∙1023–2.532170
8N2O + N ↔ NO + N2 1.000∙10130.010000
9N2O + NO ↔ NO2 + N21.000∙10140.025000
10N2O + O2 ↔ NO + NO26.000∙1014–1.54985
11NO2 + O ↔ NO + O21.000∙10130.0300
12NO2 + H ↔ NO + OH3.467∙10140.00740
13NO2 + NO2 ↔ 2NO + O21.995∙10120.0013500
14NO2 + N ↔ O + N2O5.012∙10120.00
15NO + HO2 ↔ NO2 + OH2.089∙10120.0–240
16NO + N2 + O2 ↔ N2O + NO22.300∙10140.018000
17N2 + O2 ↔ 2NO2.730∙10130.053800
18NO + O2 ↔ N + O32.700∙1014–1.063140
19NO2 + O ↔ N + O33.700∙1014–0.540280
20NO + O3 ↔ O + NO36.000∙1014–1.58000
21N2 + HO2 ↔ NO + HNO5.925∙10100.521550
22N + OH ↔ NH + O1.290∙10140.02165
23N + H2 ↔ NH + H1.320∙10150.011230
24N + H2O ↔ NH + OH3.590∙10150.018430
25NH + OH ↔ NO + H21.600∙10120.56755
26NH + O ↔ NO + H5.000∙10110.50.0
27NH + OH ↔ HNO + H6.440∙10110.01460
28NH + O2 ↔ HNO + O4.380∙10120.06546
29HNO ↔ H + NO 1.900∙10160.025179
30HNO + OH ↔ NO + H2O2.100∙10120.50
31HNO + H ↔ NO + H21.400∙10130.01510
32HNO + O ↔ NO + OH5.000∙10110.50
33NH + NO ↔ N2O + H2.240∙10130.010600
34N2O + NH ↔ N2 + HNO1.995∙10120.03000
35NO2 + NH ↔ HNO + NO1.000∙10110.52000
36N + H2O ↔ NH + OH1.000∙10130.01000
37N + HO2 ↔ NH + O21.000∙10130.01000
38NO + HO2 ↔ HNO + O1.900∙10110.01000
39HNO + NO ↔ N2O + OH6.140∙10120.017100
40HNO + N ↔ NO + NH1.000∙10130.01000
41HNO + HNO ↔ 2NO + H22.000∙10100.52230
42NH + N ↔ N2 + H6.310∙10110.50
43NH + N2 ↔ N + H + N23.160∙1021–2.042000

References

  1. Seddiek, I.S.; Elgohary, M.M.; Ammar, N.R. The hydrogen-fuelled internal combustion engines for marine applications with a case study. Brodogradnja 2015, 66, 23–38. [Google Scholar]
  2. Lamas, M.I.; Rodríguez, C.G.; Rodríguez, J.D.; Telmo, J. Internal modifications to reduce pollutant emissions from marine engines. A numerical approach. J. Nav. Archit. Mar. Eng. 2013, 5, 493–501. [Google Scholar] [CrossRef]
  3. Seddiek, I.S.; Elgohary, M.M. Eco-friendly selection of ship emissions reduction strategies with emphasis on SOx and NOx emissions. Int. J. Nav. Arch. Ocean Eng. 2014, 6, 737–748. [Google Scholar] [CrossRef]
  4. Ovaska, T.; Niemi, S.; Sirvio, K.; Nilson, O.; Portin, K.; Asplund, T. Effects of alternative marine diesel fuels on the exhaust particle size distributions of an off-road diesel engine. Appl. Therm. Eng. 2019, 150, 1168–1176. [Google Scholar] [CrossRef]
  5. Abdulwahid, A.A.; Sigu, R.; Brown, R.J. Underground diesel exhaust wet scrubbers: Current status and future prospects. Energies 2018, 11, 3006. [Google Scholar] [CrossRef]
  6. Frigo, S.; Gentili, R. Analysis of the behavior of a 4-stroke SI engine fuelled with ammonia and hydrogen. Int. J. Hydrogen Energy 2013, 38, 1607–1615. [Google Scholar] [CrossRef]
  7. Reyes-Ramírez, I.; Martínez-Boggio, S.D.; Curto-Risso, P.L.; Medina, A.; Calvo Hernández, A.; Guzmán-Vargas, L. Symbolic analysis of the cycle-to-cycle variability of a gasoline–hydrogen fueled spark engine model. Energies 2018, 11, 968. [Google Scholar] [CrossRef]
  8. Barrios, C.C.; Domínguez-Sáez, A.; Hormigo, D. Influence of hydrogen addition on combustion characteristics and particle number and size distribution emissions of a TDI diesel engine. Fuel 2017, 199, 162–168. [Google Scholar] [CrossRef]
  9. Li, Y.; Chen, H.; Zhang, X.; Tan, C.; Ding, Y. Renewable energy carriers: Hydrogen or liquid air/nitrogen? Appl. Therm. Eng. 2010, 30, 1985–1990. [Google Scholar] [CrossRef]
  10. Wang, W.; Herreros, J.M.; Tsolakis, A.; York, A.P.E. Ammonia as hydrogen carrier for transportation; investigation of the ammonia exhaust gas fuel reforming. Int. J. Hydrogen Energy 2013, 38, 9907–9917. [Google Scholar] [CrossRef]
  11. Cervantes-Bobadilla, M.; Escobar-Jiménez, R.F.; Gómez-Aguilar, J.F.; García-Morales, J.; Olivares-Peregrino, V.H. Experimental study on the performance of controllers for the hydrogen gas production demanded by an internal combustion engine. Energies 2018, 11, 2157. [Google Scholar] [CrossRef]
  12. Boretti, A. Novel dual fuel diesel-ammonia combustion system in advanced TDI engines. Int. J. Hydrogen Energy 2017, 42, 7071–7076. [Google Scholar] [CrossRef]
  13. Comotti, M.; Frigo, S. Hydrogen generation system for ammonia-hydrogen fuelled internal combustion engines. Int. J. Hydrogen Energy 2015, 40, 10673–10686. [Google Scholar] [CrossRef]
  14. Lee, J.H.; Kim, J.H.; Park, J.H.; Kwon, O.C. Studies on properties of laminar premixed hydrogen-added ammonia/air flames for hydrogen production. Int. J. Hydrogen Energy 2010, 35, 1054–1064. [Google Scholar] [CrossRef]
  15. Ryu, K.; Zacharakis-Jutz, G.E.; Kong, S.C. Performance enhancement of ammonia-fueled engine by using dissociation catalyst for hydrogen generation. Int. J. Hydrogen Energy 2014, 39, 2390–2398. [Google Scholar] [CrossRef]
  16. Boretti, A.A. Novel heavy duty engine concept for operation dual fuel H2-NH3. Int. J. Hydrogen Energy 2012, 37, 7869–7876. [Google Scholar] [CrossRef]
  17. Sahin, Z.; Akcanca, I.Z.; Durgun, O. Experimental investigation of the effects of ammonia solution (NH3OH) on engine performance and exhaust emissions of a small diesel engine. Fuel 2018, 214, 330–341. [Google Scholar] [CrossRef]
  18. Reiter, A.J.; Kong, S.C. Combustion and emissions characteristics of compression-ignition engine using dual ammonia-diesel fuel. Fuel 2011, 90, 87–97. [Google Scholar] [CrossRef]
  19. Gill, S.S.; Chatha, G.S.; Tsolakis, A.; Golunski, S.E.; York, A.P.E. Assessing the effects of partially decarbonizing a diesel engine by co-fuelling with dissociated ammonia. Int. J. Hydrogen Energy 2012, 37, 6074–6083. [Google Scholar] [CrossRef]
  20. Nishi, M.; Kanehara, M.; Lida, N. Assessment for innovative combustion on HCCI engine by controlling EGR ratio and engine speed. Appl. Therm. Eng. 2016, 99, 42–60. [Google Scholar] [CrossRef]
  21. Wu, H.W.; Hsu, T.T.; He, J.Y.; Fan, C.M. optimal performance and emissions of diesel/hydrogen-rich gas engine varying intake air temperature and EGR ratio. Appl. Therm. Eng. 2017, 124, 381–392. [Google Scholar] [CrossRef]
  22. di Sarli, V. Stability and emissions of a lean pre-mixed combustor with rich catalytic/lean-burn pilot. Int. J. Chem. React. Eng. 2014, 12, 77–89. [Google Scholar] [CrossRef]
  23. Lamas, M.I.; Rodríguez, C.G.; Aas, H.P. Computational fluid dynamics analysis of NOx and other pollutants in the MAN B&W 7S50MC marine engine and effect of EGR and water addition. Int. J. Marit. Eng. 2013, 155, A81–A88. [Google Scholar]
  24. Finesso, R.; Hardy, T.; Mancarella, A.; Marello, O.; Mittica, A.; Spessa, E. Real-time simulation of torque and nitrogen oxide emissions in a 11.0 L heavy-duty diesel engine for model-based combustion control. Energies 2019, 12, 460. [Google Scholar] [CrossRef]
  25. Jasminska, N.; Brestovic, T.; Puskar, M.; Grega, R.; Rajzinger, J.; Korba, J. Evaluation of hydrogen storage capacities on individual adsorbents. Meas. J. Int. Meas. Confed. 2014, 56, 219–230. [Google Scholar] [CrossRef]
  26. Lamas, M.I.; Rodríguez, J.d.; Castro-Santos, L.; Carral, L.M. Effect of multiple injection strategies on emissions and performance in the Wartsila 6L 46 marine engine. A numerical approach. J. Clean. Prod. 2019, 206, 1–10. [Google Scholar] [CrossRef]
  27. Park, C.; Park, W.; Kim, Y.; Choi, Y.; Lim, B. Effect of valve timing and excess air ratio on torque in hydrogen-fueled internal combustion engine for UAV. Energies 2019, 12, 771. [Google Scholar] [CrossRef]
  28. Miyamoto, N.; Ogawa, H.; Wang, J.; Shudo, T. Yamazaki K. Diesel NOx reduction with ammonium deoxidizing agents directly injected into the cylinder. Int. J. Veh. Des. 1995, 16, 71–79. [Google Scholar] [CrossRef]
  29. Larbi, N.; Bessrour, J. Measurement and simulation of pollutant emissions from marine diesel combustion engine and their reduction by ammonia injection. Adv. Mech. Eng. 2010, 41, 898–906. [Google Scholar] [CrossRef]
  30. Lamas, M.I.; Rodriguez, C.G.; Rodriguez, J.D.; Telmo, J. Computational fluid dynamics of NOx reduction by ammonia injection in the MAN B&W 7S50MC marine engine. Int. J. Marit. Eng. 2014, 156, A213–A220. [Google Scholar] [CrossRef]
  31. Bosse, T.K. High Temperature Gas Dynamics, 1st ed.; Springer: Berlin/Heidelberg, Germany; New York, NY, USA, 2004. [Google Scholar]
  32. Lamas, M.I.; Rodríguez, C.G. CFD analysis of the scavenging process in the MAN B&W 7S50MC two-stroke diesel marine engine. J. Ship Res. 2012, 56, 154–161. [Google Scholar] [CrossRef]
  33. Ricart, L.M.; Xin, J.; Bower, G.R.; Reitz, R.D. In-Cylinder Measurement and Modeling of Liquid Fuel Spray Penetration in a Heavy-Duty Diesel Engine; SAE 971591; SAE International: Warrendale, PA, USA, 1997. [Google Scholar]
  34. Dukowicz, J.K. Quasi-Steady Droplet Change in the Presence of Convection; LA7997-MS; Informal Report Los Alamos Scientific Laboratory: Los Alamos, NM, USA, 1979. [Google Scholar]
  35. Miller, J.A.; Glarborg, P. Modeling the formation of N2O and NO2 in the thermal DeNOx process. Springer Ser. Chem. Phys. 1996, 61, 318–333. [Google Scholar]
  36. Lamas, M.; Rodriguez, C.G. Numerical model to analyze NOx reduction by ammonia injection in diesel-hydrogen engines. Int. J. Hydrogen Energy 2017, 42, 26132–26141. [Google Scholar] [CrossRef]
  37. Zeldovich, Y.B.; Sadovnikov, D.A.; Kamenetskii, F. Oxidation of Nitrogen in Combustion; Institute of Chemical Physics: Moscow-Leningrad, Russia, 1947. [Google Scholar]
  38. Lavoie, G.A.; Heywood, J.B.; Keck, J.C. Experimental and theoretical investigation of nitric oxide formation in internal combustion engines. Combust. Sci. Technol. 1970, 1, 313–326. [Google Scholar] [CrossRef]
  39. Woodyard, D. Pounder’s Marine Diesel Engines and Gas Turbines, 8th ed.; Elsevier: Oxford, UK, 2004; ISBN 9780080943619. [Google Scholar]
  40. Mellor, A.M. Skeletal Mechanism for NOx Chemistry in Diesel Engines; SAE Tech Pap 981450; SAE International: Warrendale, PA, USA, 1998. [Google Scholar]
  41. Zabetta, E.C.; Kilpinen, P.; Hupa, M.; Stähl, K.; Leppälahti, J.; Cannon, M.; Nieminen, J. Kinetic modeling study on the potential of staged combustion in gas turbines for the reduction of nitrogen oxide emissions from biomass IGCC plants. Energy Fuels 2000, 14, 751–761. [Google Scholar] [CrossRef]
  42. Yang, H.; Krishnan, S.R.; Srinivasan, K.K.; Midkiff, K.C. Modeling of NOx emissions using a super-extended Zeldovich mechanism. In Proceedings of the ICEF03 2003 Fall Technical Conference of the ASME Internal Combustion Engine Division, Erie, PA, USA, 7–10 September 2003. [Google Scholar]
  43. Lamas, M.I.; Rodríguez, C.G. Numerical model to study the combustion process and emissions in the Wärtsilä 6L 46 four-stroke marine engine. Pol. Marit. Res. 2013, 20, 61–66. [Google Scholar] [CrossRef]
  44. Ra, Y.; Reitz, R. A reduced chemical kinetic model for IC engine combustion simulations with primary reference fuels. Combust. Flame 2008, 155, 713–738. [Google Scholar] [CrossRef]
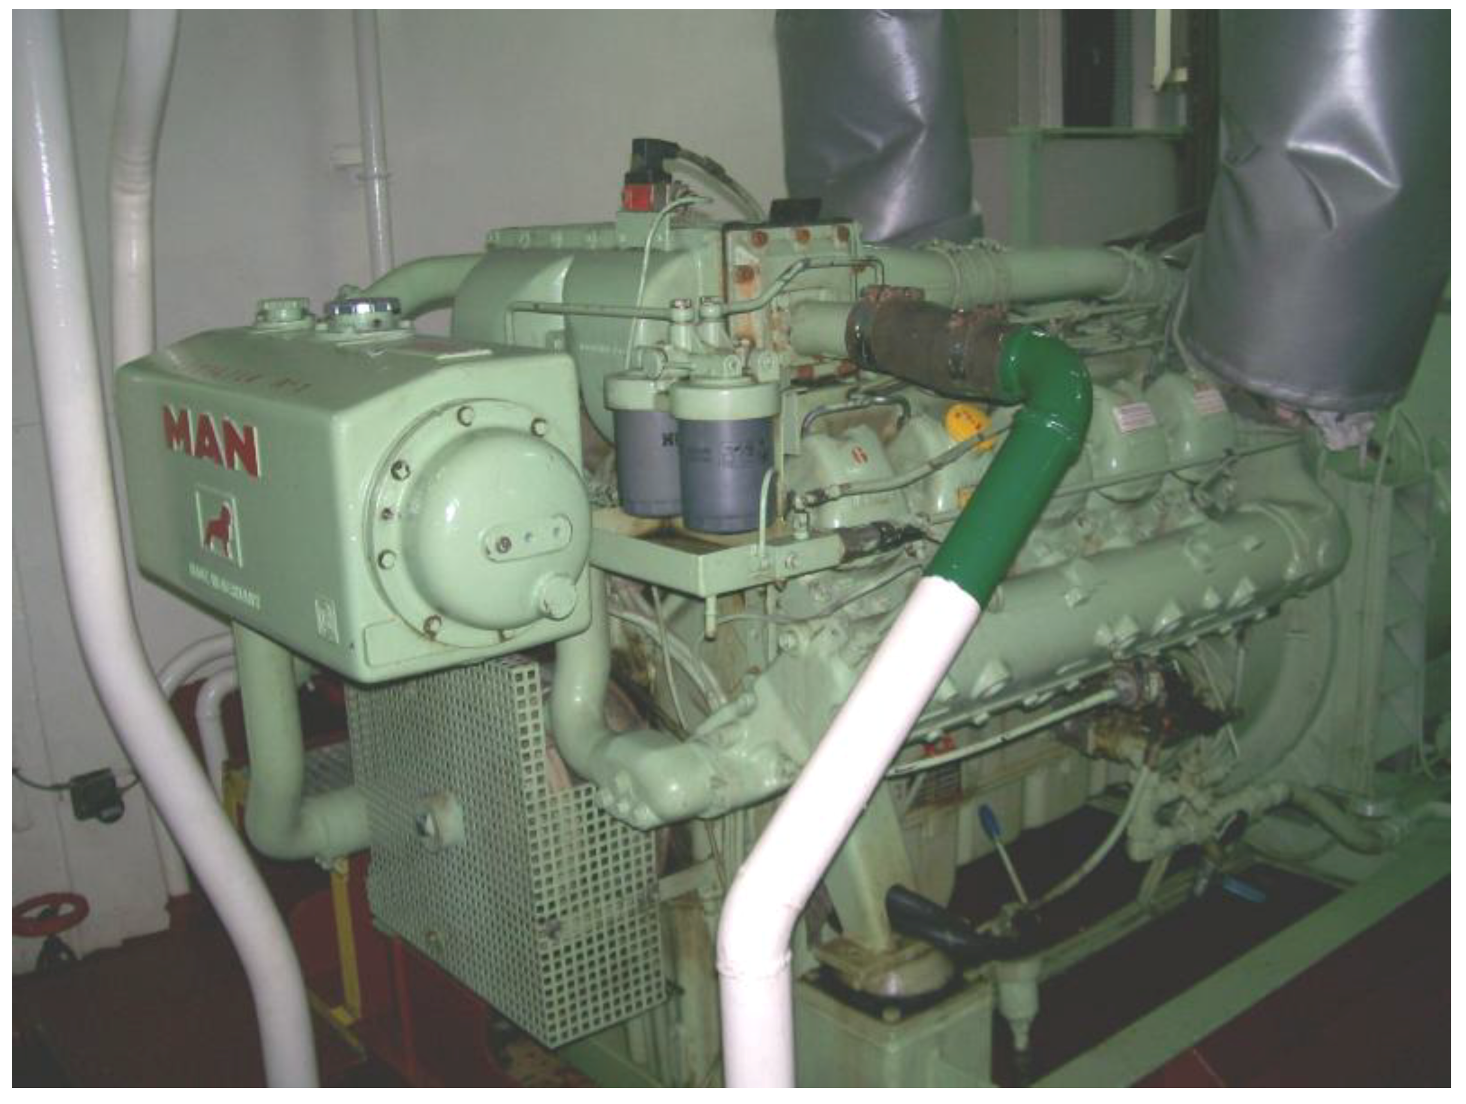
Figure 1. Engine analyzed in the present work.
Energies 12 01255 g001
Figure 2. Piston head of the engine studied in the present work.
Energies 12 01255 g002
Figure 3. Computational mesh at bottom dead center. (a) Tri-dimensional view; (b) AA section.
Energies 12 01255 g003
Figure 4. NOx emissions experimentally and numerically obtained.
Energies 12 01255 g004
Figure 5. HC, CO, and CO2 emissions as well as brake-specific fuel consumption (BSFC) experimentally and numerically obtained.
Energies 12 01255 g005
Figure 6. NOx reduction against the NH3/NOi ratio. Start of ammonia injection 43.2º, 10º injection duration, rectangular injection shape.
Energies 12 01255 g006
Figure 7. Ammonia injection rates analyzed.
Energies 12 01255 g007
Figure 8. NOx reduction against the start of ammonia injection for rectangular (green color), triangular (red color), and parabolic (blue color) injection shapes using 10º injection duration.
Energies 12 01255 g008
Figure 9. NOx reduction against the duration of injection for rectangular (green color), triangular (red color), and parabolic (blue color) injection shapes.
Energies 12 01255 g009
Table 1. Technical specifications at 100% load.
ParameterValue
Power (kW)320
Speed (rpm)1500
Number of cylinders10
Cylinder displacement volume (cm3)18,270
Bore (mm)128
Stroke (mm)142