Article

Comparing Performance Metrics of Partial Aisle Containments in Hard Floor and Raised Floor Data Centers Using CFD

Division of Fluid and Experimental Mechanics, Luleå University of Technology, SE-971 87 Luleå, Sweden
*
Author to whom correspondence should be addressed.
Energies 2019, 12(8), 1473; https://doi.org/10.3390/en12081473
Submission received: 13 February 2019 / Revised: 5 April 2019 / Accepted: 8 April 2019 / Published: 18 April 2019

Abstract

:
In data centers, efficient cooling systems are required to both keep the energy consumption as low as possible and to fulfill the temperature requirements. The aim of this work is to numerically investigate the effects of using partial aisle containment between the server racks for hard and raised floor configurations. The computational fluid dynamics (CFD) software ANSYS CFX was used together with the Reynolds stress turbulence model to perform the simulations. Velocity measurements in a server room were used for validation. Boundary conditions and the load of each rack were also retrieved from the experimental facility, implying an uneven load between the racks. A combination of the performance metrics Rack Cooling Index (RCI), Return Temperature Index (RTI) and Capture Index (CI) were used to evaluate the performance of the cooling systems for two supply flow rates at a 100% and 50% of operating condition. Based on the combination of performance metrics, the airflow management was improved in the raised floor configurations. With the supply flow rate set to operating conditions, the RCI was 100% for both raised floor and hard floor setups. The top- or side-cover fully prevented recirculation for the raised floor configuration, while it reduced the recirculation for the hard floor configuration. However, the RTI was low, close to 40% in the hard floor case, indicating poor energy efficiency. With the supply flow rate decreasing with 50%, the RTI increased to above 80%. Recirculation of hot air was indicated for all the containments when the supply rate was 50%, but the values of RCI still indicated an acceptable performance of the cooling system.

1. Introduction

The worldwide demand for storage and processing of data has increased rapidly during the last several years and as a result, the quantity and the size of data centers are increasing [1]. The development of sustainable facilities is at the same time very important since their energy consumption is extremely large. In 2012, 1.4% of the total energy consumption in the world originated from data centers [2].
Uninterrupted operation is the most crucial requirement for data centers [3]. Adequate cooling of the servers is therefore very important, while over cooling is a waste of energy. In average 40% of the total energy consumption in data centers is related to the cooling process [4]. Energy efficient cooling systems are required in order to both keep the energy consumption as low as possible and to satisfy the temperature requirements in data centers. The general guidelines that specify allowable and recommended rack intake temperatures are at present 15–32 °C and 18–27 °C, respectively [5].
Two alternative setups are commonly used in air cooled data centers; hard floor and raised floor configurations. Cold air is supplied directly to the room from the Computer Room Air Conditioner (CRAC) units if a hard floor configuration is used. In a raised floor setup, the CRAC units deliver cold air into an under-floor space instead, whereas the air then enters the data center through perforated floor tiles. It is common practice to place the perforated tiles right beneath the rack intakes in order to make it more likely that the cold air finds its way to the servers. Cold air bypass is one problem that may occur as a result of poor airflow management [6]. The cold air then immediately returns to the outlet of the CRAC units without cooling the servers [7], leading to loss of cooling capacity. To compensate for this, the supply flow rate must be increased to make sure that enough cold air is available at the server racks resulting in over-dimensioned cooling systems. Another example of poor air management is when the exhausted hot air from a server enters the intake side of a server rack, rather than the outlet of the CRAC unit. This phenomenon is referred to as hot air recirculation.
In order to efficiently manage the airflow, it is common to form hot and cold aisles by placing the server racks in parallel rows. When the front sides are facing each other cold aisles are formed, while back sides facing each other form hot ailses. Aisle containment is a strategy to minimize hot air recirculation and cold air bypass. Hot aisle containment prevents the hot air from mixing with cold air by using panels as a physical barrier to enclose the hot aisles. A ceiling void space can be used to isolate the hot air when moving towards the CRAC units. Cold aisle containment prevents the cold air supplied by the perforated tiles to mix with hot air by using panels to enclose the cold aisles. For an ideal cold aisle containment, the total flow rate through the perforated tiles and the total flow rate demanded by the server racks would be equal. However, there is often air leakage either from or to the cold aisles in existing data centers. The air leakage makes up for the excess or deficit in the supply flow rate, compared with the flow rate through the server racks. The aisles can also be partially contained by using panels on either side or on top of it. The potential to increase the thermal performance of a server room by the use of partial or full aisle containment has been verified in several studies, but mainly for cold aisles only. Srinarayana et al. [8] numerically compared room and ceiling return strategies in both hard and raised floor configurations. Arghode et al. [9] compared numerical and experimental results of a contained cold aisle to an open cold aisle for both the under- and over-provisioning of supply air. Sundaralingam et al. [10] experimentally investigated the performance of the cooling system in different setups with either an open, partially contained or fully contained cold aisle. Alkharabsheh et al. [11] used an experimentally validated numerical model to study both open and contained cold aisle setups. Nada et al. [12] numerically studied partial cold aisle containment and also compared different arrangements of CRAC units and server racks with respect to airflow management. Values of flow rates through the perforated tiles and rack intake temperatures were used for validation. In several of the previous studies, computational fluid dynamics (CFD) was used to provide details of the airflow [8,9,11,12]. Further studies of CFD for airflow management can be found in the reviews by Chu & Wang [13] and Lu et al. [14]. In this context, it is crucial that the simulations are trustworthy. Boundary conditions, mesh and application of turbulence models should for example be carefully addressed to ensure reliable results [11,15]. Different levels of details are furthermore needed depending on whether the component level, rack level or room level is in focus [13].
Detailed flow analysis of hard floor and raised floor setups in the SICS ICE data center in Luleå, Sweden, has previously been performed with numerical simulations [7,15,16] and measurements [17,18]. The influence of a turbulence model on the fluid flow in a hard floor server room was investigated by Wibron et al. [15], recommending the Reynolds stress model (RSM) for modeling the flow on a server room scale. Local details of the steady state and transient flow in hard floor and raised floor configurations were examined by Wibron et al. [7]. The aim of this study is to investigate the effects of using partial aisle containment for the different floor types, i.e., considering both cool aisle and hot aisle containments. The software ANSYS CFX was used to model the flow and temperature fields inside the server room. Velocity measurements were used for validation of both floor types with open aisles. Uneven load distribution between servers and the RSM turbulence model were employed in all simulations. A combination of the performance metrics Rack Cooling Index (RCI), Return Temperature Index (RTI) and Capture Index (CI) were used to evaluate the performance of the cooling system for both hard- and raised floor configurations. The setups based on the conditions in the existing data center are very well cooled since the flow rate supplied by the computer room air handler (CRAH) units or perforated tiles exceeds the flow through the server racks. Therefore, the same setups with only 50% of the original supply flow rate are also investigated to study the possibility of increasing the energy efficiency through decreased supply flow rate.

2. Method

The geometry and boundary conditions retrieved from the experimental facility is first presented. Strategies for validation of the numerical simulations are then addressed, and finally the grid, simulation settings and performance metrics are discussed.

2.1. Geometry

A server room (Module 2) at RISE SICS North in Luleå, Sweden, was chosen for the study. In this data center it is possible to choose between hard or raised floor setups, which makes it suitable for the present study. In Figure 1, the geometries for both floor types with open aisles are illustrated. The dimensions of the data center were 6.484 × 7.000 × 3.150 m3. In Figure 2, the main components and measurement locations are illustrated. The measurement locations are the same for both configurations. The locations were chosen from flow field considerations and were intended to capture the different flow conditions in the server room. The velocity was measured at the heights of 0.6, 1.0, 1.4, 1.8 and 2.2 m for each location to enable validation of the digital model with open aisles. Partial aisle containment was then imposed in the simulations by using either a side or top cover to partially enclose the aisle between the two rows of server racks. The side cover was located at the end of the rows and at the end of the perforated tiles for the hard and raised floor configurations, respectively. The top cover was located on top of the server racks and reached from the wall out to the end of the rows for both configurations.
In the hard floor configuration, the main components were 10 server racks composed of 0.8 m wide cabinets from Siemon and four computer room air handler (CRAH) units of the label SEE Cooler HDZ-2. The servers inside the racks were not limited to one manufacturer, and temperatures of the inlets and outlets of the server racks were therefore measured for input to the numerical model. The location of the inlets and outlets of the servers were furthermore retrieved from measurements in the server room. In the raised floor configuration, there were fourteen perforated tiles located in the cold aisle. Covers on the front sides of the CRAH units were used to direct the cold air under the floor. In the experiments, there were two different kinds of perforated tiles with percentage open areas of 56% and 77%, respectively. The under-floor space was not taken into account in the simulations.
An uninterruptible power supply (UPS) was also present in the data center. To include the effect of flow blockage the UPS was modeled without heat loads, while smaller obstructions, i.e., cables and pipes, were ignored.

2.2. Boundary Conditions

Flow through the servers were not resolved in this study. Boundary conditions were instead applied to the inlet and outlets of the servers and the CRAH units, i.e., the so-called black box model [19] was used. The supply temperature and the flow rates from both the CRAH units and the perforated tiles were determined from measurements. The hotwire thermo-anemometer VTlO0 from Kimo was used to measure the temperatures, while flow rates were measured with the DP-CALC Micromanometer Model 8715 and the Velocity Matrix add-on kit from TSI. The Velocity Matrix provides area-averaged multi-point face velocity measurements. It calculates the average velocity based on the difference between total and static pressures [20]. The accuracy of the velocity and temperature measurements are ±3% of reading ±0.04 m/s for the velocity range 0.25–12.5 m/s and ±0.4% of reading ±0.3 °C for temperatures from −20 °C to 80 °C. The supply temperature was measured to 18.3 °C for both configurations and hence independent of the measurement location. For the hard floor configuration, the flow rates were measured through the front sides of all the CRAH units. Each front side was divided into 15 measurement zones and the inlet conditions were determined from average velocities. The measured values for the CRAH units are presented in Table 1, showing only a small difference in velocity between the units.
For the raised floor configuration, the flow rates were measured through all the perforated tiles (Table 2). Each perforated tile was divided into five regions and the average velocities were used to calculate the inlet boundary conditions. To resolve the perforated tiles a very fine mesh is required when using CFD. A fully open tile model is however regarded to be adequate for tiles if the percentage of open area is 50% or more [21]. Therefore, the perforated tiles were modeled as open in this work. As observed in Table 2, there was a variation in velocity through the individual tiles. A possible reason for this was the different loads of the server racks presented in Table 3 and the geometrical effects of the underfloor spacing. It was furthermore assumed that the mass flow rates supplied into the room where equal to the mass flow rate out of the room. The outlets were located on top of the CRAH units.
The heat load produced by the servers results in a temperature difference across the servers which can be obtained from:
Δ T = q m ˙ c p
where q is the heat load, m is the mass flow rate and cp is the specific heat capacity. A constant value of cp = 1004.4 J/KgK was used in all simulations. The flow rates were estimated by measuring the temperature difference across each server rack with temperature sensors from Raritan called DPX2-T1H1. The sensor has an accuracy of ±1 °C for temperatures from −25 °C to 75 °C. The sensors were placed 1.08 m above the floor on both sides of all server racks. The temperature difference was used to compute the mass flow rate through each server rack. The load of each server rack as well as the corresponding mass flow rates are presented in Table 3 for the raised floor configuration, and in Table 4 for the hard floor configuration. The total heat load in the server room were thus similar for the two cases, while a distinct variation of heat load was present for the different racks. All walls were assumed adiabatic; hence, no heat losses from the server room were accounted for. A no-slip boundary condition implying zero velocity at all surfaces was furthermore applied. Leakage of air from the server room was not included.

2.3. Validation

Velocity was measured for both raised and hard floor configurations with open aisles to validate the simulations. The experimental approach was similar to the one presented in Wibron et al. [15]. The anemometer ComfortSense Mini from Dantec with the omnidirectional 54T33 Draught probe was used in the experiments. The accuracy is ±2% of reading ±0.02 m/s for the velocity range 0.05–1 m/s, and ±5% of reading for the velocity range 1–5 m/s. Velocity was measured in the locations L1-L5 presented in Figure 2, at five heights (0.6 m, 1.0 m, 1.4 m, 1.8 m and 2.2 m). The chosen duration, 60 s, and sampling frequency, 10 Hz, of the measurements was after evaluation considered sufficient for the time-averaged velocities.

2.4. Grid Study

The raised floor configuration with an open aisle was chosen for the grid study. Following the methods described in [15], Grid Convergence Index (GCI) and Richardson’s extrapolation [22] was utilized to evaluate the discretization error. The solutions of three tetrahedral grids created in ANSYS Meshing were compared in the study. The refinement factor of the grids was determined from:
r = ( N f i n e N c o a r s e ) 1 / D
The number of elements are represented by N and the number of dimensions by D. Error bars for the computed profiles was determined using the GCI with an average value of p = Pave as a measure of the global order of accuracy [23]. For a constant refinement factor, the order of p was calculated as:
p = l n | ϵ 32 / ϵ 21 | l n ( ϵ 21 )
where ε32 = ϕ3ϕ2, ε21 = ϕ2ϕ1. ϕ3, ϕ2 and ϕ1 are the solutions on the coarse, medium and fine grid, respectively. The relative error was approximated from:
e a 21 = | ϕ 1 ϕ 2 ϕ 1 |
and the convergence index of the fine grid was:
G C I f i n e 21 = 1.25 e a 21 r 21 p 1
The extrapolated values were:
ϕ e x t 21 = ( r 21 p ϕ 1 ϕ 2 ) / ( r 21 p 1 )

2.5. Simulation Settings

Time-averaged flow fields from transient simulations were used in the analysis since steady-state simulations did not converge due to fluctuations in the flow field. Values of velocity and temperature were logged at locations L1-L5 to ascertain that the simulations reached a statistically steady state. After a start up simulation period of 60 s, transient averages where recorded for 360 s to obtain time-independent results. A constant time-step equal to 0.05 s was decided on the basis of convergence. The time-step corresponded to an RSM Courant number of around 2 at operating conditions. The convergence criteria were set to 10−5 for each time-step.
A common choice of turbulence model for data center applications is the k-ε model. However, the k-ε model is less accurate in regions of low velocity and the Reynolds stress model (RSM) is therefore a better choice [15]. Therefore, the RSM was used to model turbulence in this study. The RSM does not assume isotropic turbulence. Instead, it solves additional transport equations for the six individual Reynolds stresses in order to obtain closure of the Reynolds-averaged Navier–Stokes (RANS) equations that govern the transport of the time-averaged flow quantities. A wall function approach was used in ANSYS CFX to model the boundary layer where the velocity approaches zero close to solid walls.
Buoyancy effects should also be taken into account when modeling the airflow in data centers [24]. The Archimedes number represents the ratio of natural and forced convection and is expressed by:
A r = β g L Δ T V 2
where L is a vertical length scale, ΔT is the temperature difference between hot and cold regions and V is a characteristic velocity. An Archimedes number of order 1 or larger indicates that natural convection dominates. In this study, Ar ≈ 2 and buoyancy is therefore included with the full buoyancy model in ANSYS CFX.

2.6. Performance Metrics

The Rack Cooling Index (RCI) is a measure of how well the servers are cooled and maintained within thermal guidelines [25,
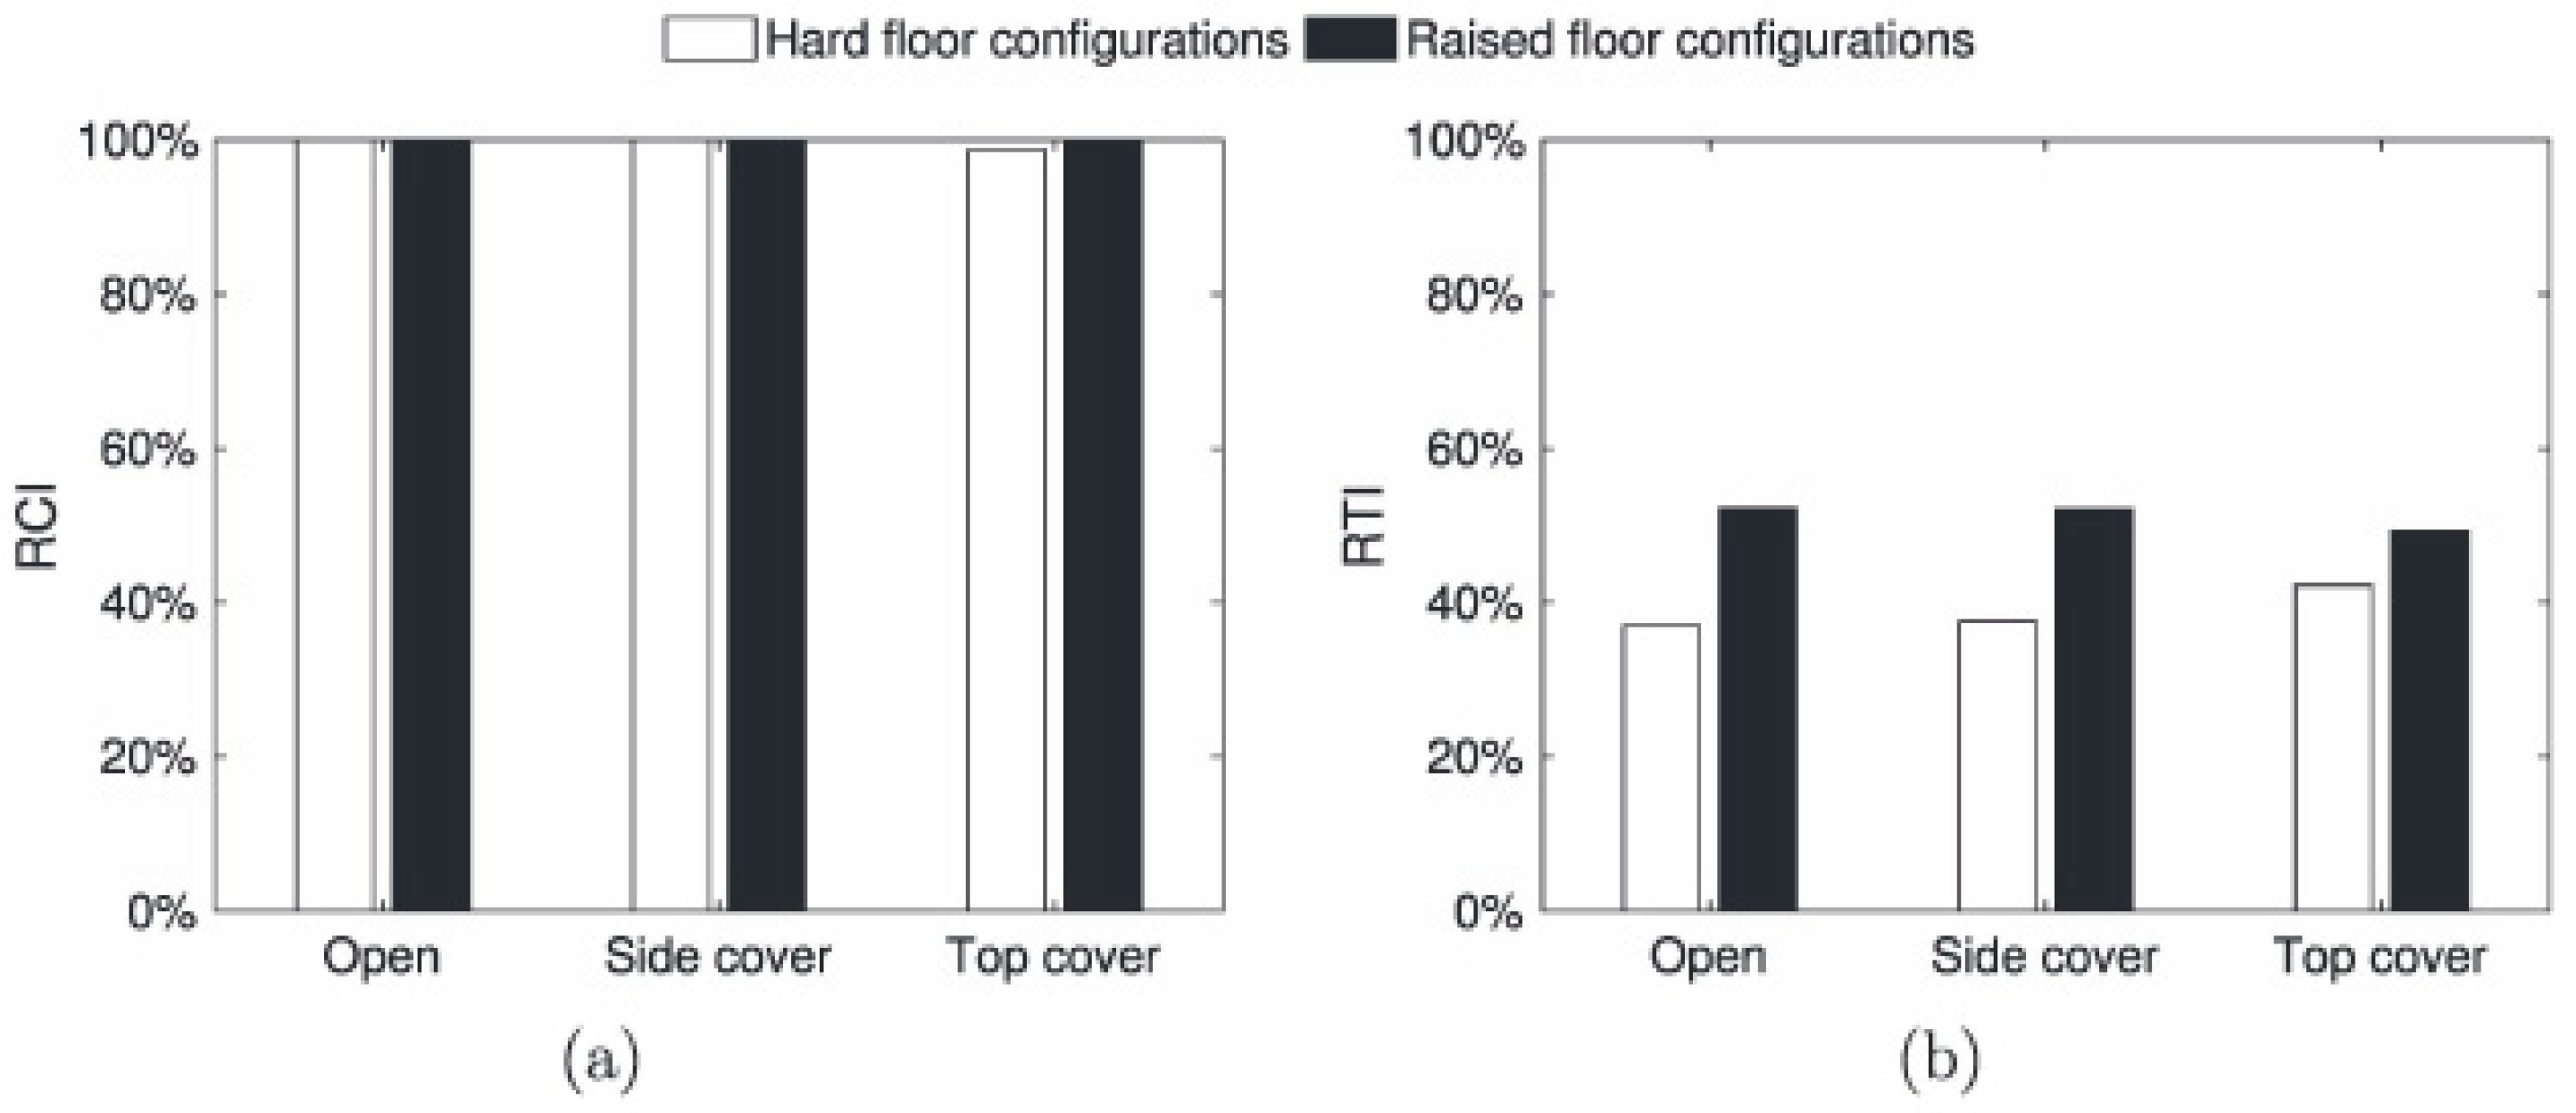
26]. Over-temperature conditions exist when the intake temperature at some server racks exceed the maximum recommended temperature. A summation of the over-temperatures of each rack gives the total over-temperature. RCI can be used to evaluate under-temperature conditions as well, but only the high side of the temperature range is analyzed here. The RCI was defined as:
R C I H I = ( 1 T o t a l   o v e r t e m p M a x . a l l o w a b l e   o v e r t e m p ) 100 %
where the maximum allowable over-temperature is a summation of the difference between the maximum allowable and maximum recommended temperature across all the server racks. The RCI reaches its ideal value of 100% if all rack intake temperatures are below the maximum recommended temperature. Values below 100% mean that the intake temperature for one or more server rack exceeds the maximum recommended temperature.
The RCI can be improved by increasing the flow rate or decreasing the temperature. However, these actions would increase the energy consumption. The Return Temperature Index (RTI) is a measure of the energy performance of the cooling system [27]. It is defined as:
R T I = [ ( T r e t u r n T s u p p l y ) / Δ T e q u i p ] 100 %
where Treturn, Tsupply and ΔTequip are weighted averages of the return temperature, supply temperature and temperature difference across the server racks, respectively. Deviations from 100% indicate declining performance. Values above 100% indicate mainly hot air recirculation and values below 100% indicate mainly cold air bypass.
The Capture Index (CI) is based on the airflow patterns associated with either the supply of cold air or the removal of hot air [28]. The CI based on the supply of cold air is considered here and it is defined as the fraction of air that originates from the CRAH units. The ideal value is 100% which means that there is no hot air recirculation. Otherwise, the value is lower.

3. Results and Discussion

Discretization and modelling errors are first addressed through grid study and comparison with experimental measurements. The performance metrics CI, RCI and RTI are then compared for different confinement strategies and supply flow rates.

3.1. Grid Study

Errors originating from discretization was assessed using the GCI and Richardson’s extrapolation for the raised floor configuration with an open aisle. The number of elements were 430,316, 932,066 and 2,025,136 for the coarse, medium and fine grid, respectively, leading to r = 1.3. The maximum cell sizes were 0.140 m, 0.106 m and 0.080 m for the respective grids. Inflation layers were used to attain a better resolution close to the walls, leading to an average y+ of around 25. The flow field in a data center is complex with large velocity gradients depending on the position. This makes it suitable for the grid convergence study and transient averages of the velocity profiles along L5—a position where the inlet supply air flow is redirected towards the servers and where experimental data also exists—to be compared. The velocity profiles of three grids are presented in Figure 3a together with an extrapolated curve based on Richardson’s extrapolation. The local order of accuracy p ranges from 0.0232 to 26.86, with a global average of 3.640. Calculated error bars for the fine grid are presented in Figure 3b. Based on the grid study, the fine grid is considered to give acceptable results and all further work was carried out with this grid size.

3.2. Validation

Both configurations with open aisles have been used for validation. For this study, where one of the main focuses is on the airflow in terms of recirculation between aisles, velocity was chosen as the means of comparison. With the velocity measurements, the validity of the correlation between server load and mass flow (Equation (1)) can also be analyzed. A comparison of transient averages of velocity profiles and experimental values is shown in Figure 4. In general, good agreement was found between simulations and experimental values even though the flow field is very complicated with large velocity gradients. For the hard floor configuration, L1 was located between the inlets of two of the CRAH units and L5 was located behind a server rack inside the hot aisle. The simplified boundary conditions managed to recreate the velocity profiles from the measurements. At L3, outside the end of the hot aisle, the velocity was under-estimated by the simulations. It indicated that the airflow was pushed upwards and stays close to the ceiling on its way back to the CRAH units to a higher extent in the simulations than in the existing data center. For the raised floor configuration, very good agreement was obtained for L2–L5, while deviations were found for L1. This measurement location was close to the cover in front of the CRAH units and large velocity gradients were found in this region. L5 was located above a perforated tile in the cold aisle, indicating that the fully open tile model gave an accurate velocity profile.

3.3. Flow Fields

Transient averages of velocity and temperature on a plane through C2 and C4 (see Figure 2) is presented in Figure 5 for the hard floor configuration with an open aisle. It is apparent that there are large velocity gradients. The CRAH units supplied cold air at a higher flow rate than required by the servers, hence parts of the cold air were immediately returned to the units without entering the servers. Low temperatures were found in front of the server racks while the highest temperatures were found close to the ceiling. Figure 6 correspondingly shows transient averages of velocity and temperature on a plane through C2 and C4 (see Figure 2) for the raised floor configuration with open aisles. As well as this, part of the cold air returned directly to the CRAH unit without entering the servers. Low temperatures were found in front of the server racks while most of the heat was retrieved at the back of the server racks. Flow and temperature fields further indicated less mixing of hot and cold air returning to the CRAH unit for the raised floor configuration (compare Figure 5 and Figure 6).

3.4. Comparison of Setups at Operating Conditions

Side- and top-covers of the aisle between the server racks were studied to investigate methods to improve the airflow management. A top cover between the server racks in the hard floor configuration was not expected to have a positive influence on the air management, but was still included for the comparison. To get quantitative measures of the differences between setups, the performance metrics RCI, RTI and CI were used for evaluation. Since the RCI is based on the rack intake temperatures, these temperatures are also further investigated. Figure 7 and Figure 8 illustrate the rack intake temperatures for the hard and raised floor configurations, respectively. The viewing direction was normal to the front sides of the server racks where outlet conditions were applied. For the hard floor configurations, there were hotspots close to the end of the rows in the setup with an open aisle. The side cover reduced the extent of the hotspots. As shown in Figure 8, the hotspots were eliminated in the raised floor configurations. The only tendency to hotspots were close to the end of the rows in the setup with an open aisle. However, the intake temperatures were kept well below the maximum recommended temperature in this setup, meaning that ideal values of the RCI were obtained (Figure 9a). This result was expected based on the rack intake temperatures and given that the flow rate supplied by the CRAH units or perforated tiles exceeded the flow rate required by the server racks. The servers were very well cooled but cold air bypass still existed. Therefore, poor values of the RTI were obtained for all setups (Figure 9b). Hence, the servers were cooled and maintained within the thermal guidelines but the energy performance was inadequate.
Hotspots in a data center can be an effect of poor airflow management. CI is based on the airflow patterns, indicating areas where hot air from the servers was circulated to the server inlets, which might explain why some server racks were more exposed to hotspots than others. The CI for all the server racks in the different setups are shown in Table 5. The values were close to ideal for all servers in all setups, except for R1 in the hard floor configurations. It was located at the end of a row, which increased the risk of hot air recirculation since it can occur not only over the server rack, but around it as well. The fact that the CI was worse for R1 than for R1O, which was located at the end of the other row, was because the airflow rates demanded by R1–R3 were so large.
It can be concluded that the temperature distributions in Figure 8 and Figure 9 were directly reflected in the values of CI, although the CI value is not based on temperature. It is also apparent that the CI value discloses local problems with the cooling that are smeared out in the RCI performance metrics.

3.5. Comparison of Setups with 50% Supply Flow Rate

The setups based on the conditions in the existing data center were cooled according to the thermal guidelines, but the energy performance was poor since the supply flow rate exceeded the flow rate demanded by the server racks. Therefore, the same setups with only 50% of the original supply flow rate were investigated. Figure 10 and Figure 11 illustrate rack intake temperatures for the hard and raised floor configurations, respectively. Reducing the supply flow rate gave more apparent hotspots, especially close to areas of high server load, but the same tendencies for recirculation appeared for the setups with 100% supply flow rate. For the hard floor configurations, hotspots were found at the end of the rows. When the side cover is used, the performance of the cooling system was improved, but hotspots were still found high up on the server racks. This indicated hot air recirculation over the rows instead of around them. The hotspots were reduced in the raised floor configurations. The side cover showed the lowest intake temperatures, while the top cover did not show any apparent improvement when compared to a fully open aisle when the supply rate was reduced.
Although there obviously were hot areas in several of these setups, ideal or close to ideal values of RCI were obtained, (Figure 12a). The values of RTI were considerably improved compared to an airflow of 100% (Figure 12b), since the extent of cold air bypass decreased when the supply flow rate was reduced.
The CI for all the server racks in the different setups with 50% supply flow rate are shown in Table 6. Lower values than for the setups with 100% supply flow rate were obtained for several server racks. A low value of CI does however not automatically imply that temperatures are above recommended values. If the temperature of the surrounding environment is sufficiently low, the server rack will still be adequately cooled. A cooling set up with low CI is however usually more complex and unpredictable, and high values of CI are therefore preferable. This is also an indication that a combination of performance metrics based on both rack intake temperatures (Figure 10, Figure 11 and Figure 12) and airflow patterns provide a more comprehensive result than a single performance metric does.

4. Conclusions

The effects of using partial aisle containment in the design of data centers were investigated in this study using an experimentally validated CFD model. In general, good agreement was found between simulations and experimental values. Hard and raised floor configurations with either open or partially contained aisles were compared with respect to airflow management. The setups based on the conditions in the existing data center were very well cooled since the supply flow rate exceeded the flow rate required by the server racks, and the values of RTI were relatively low, about 40% and 50% for the hard and raised floor configurations, respectively. Hence, the indices indicate that the servers are cooled and maintained within the thermal guidelines but the energy performance is poor. Therefore, the same setups with only 50% of the original supply flow rate were also investigated. The supply flow rate was then approximately the same as the flow rate through the server racks. Reducing the supply flow rate gave more apparent hotspots and the values of RTI were raised to over 80% in all setups, but the same tendencies as in the setups with 100% supply flow rate were found.
Based on the combination of performance metrics where both rack intake temperatures and airflow patterns were taken into account, the airflow management was significantly improved in the raised floor configurations. For the hard floor configurations, there were hotspots close to the end of the rows. The side cover reduced the extent of these. However, using the top cover reinforced the hot air recirculation around the rows which declined the performance of the cooling system. For the raised floor configurations, partially contained aisles were preferred compared with open aisles, and the side cover performed better than the top cover, especially in the case of decreased flow rate.
In addition to hot spots at the end of the rows, potential hot spots were observed especially in the vicinity of the areas of high server load, hence individual supply flow rates between computer room air handling (CRAH) units should be further investigated.

Author Contributions

Conceptualization, E.W., A.-L.L. and T.S.L.; methodology, E.W.; software, E.W.; validation, E.W., A.-L.L.; formal analysis, E.W., A.-L.L., T.S.L.; data curation, E.W.; writing—original draft preparation, E.W.; writing—review and editing, A.-L.L., T.S.L.; visualization, E.W.; supervision, T.S.L., A.-L.L.; project administration, A.-L.L.

Funding

The research was funded by the Celtic-Plus project SENDATE-EXTEND and the Swedish Energy Agency.

Acknowledgments

The authors would like to acknowledge RISE SICS North for providing data and facilities for the experiments.

Conflicts of Interest

The authors declare no conflict of interest.

References

  1. Ni, J.; Bai, X. A review of air conditioning energy performance in data centers. Renew. Sustain. Energy Rev. 2017, 67, 625–640. [Google Scholar] [CrossRef]
  2. Van Heddeghem, W.; Lambert, S.; Lannoo, B.; Colle, D.; Pickavet, M.; Demeester, P. Trends in worldwide ICT electricity consumption from 2007 to 2012. Comput. Commun. 2014, 50, 64–76. [Google Scholar] [CrossRef] [Green Version]
  3. Patankar, S.V. Airflow and Cooling in a Data Center. J. Heat Transf. 2010, 132, 073001. [Google Scholar] [CrossRef] [Green Version]
  4. Song, Z.; Zhang, X.; Eriksson, C. Data Center Energy and Cost Saving Evaluation. Energy Procedia 2015, 75, 1255–1260. [Google Scholar] [CrossRef] [Green Version]
  5. ASHRAE. Thermal Guidelines for Data Processing Environments—Expanded Data Center Classes and Usage Guidance; American Society of Heating, Refrigerating and Air-Conditioning Engineers, Inc.: Atlanda, GA, USA, 2011. [Google Scholar]
  6. Tatchell-Evans, M.; Kapur, N.; Summers, J.; Thompson, H.; Oldham, D. An experimental and theoretical investigation of the extent of bypass air within data centres employing aisle containment, and its impact on power consumption. Appl. Energy 2017, 186, 457–469. [Google Scholar] [CrossRef]
  7. Wibron, E.; Ljung, A.-L.; Lundstrom, T.S. Comparison of hard floor and raised floor cooling of servers with regards to local effects. In Proceedings of the 44th Annual Conference of the IEEE Industrial Electronics Society (IECON 2018), Washington, DC, USA, 21–23 October 2018. [Google Scholar]
  8. Srinarayana, N.; Fakhim, B.; Behnia, M.; Armfield, S.W. Thermal Performance of an Air-Cooled Data Center with Raised-Floor and Non-Raised-Floor Configuration. Heat Transf. Eng. 2013, 35, 384–397. [Google Scholar] [CrossRef]
  9. Arghode, V.K.; Sundaralingam, V.; Joshi, Y.; Phelps, W. Thermal Characteristics of Open and Contained Data Center Cold Aisle. J. Heat Transf. 2013, 135. [Google Scholar] [CrossRef]
  10. Sundaralingam, V.; Arghode, V.K.; Joshi, Y.; Phelps, W. Experimental Characterization of Various Cold Aisle Containment Configurations for Data Centers. J. Electron. Packag. 2015, 137, 011007. [Google Scholar] [CrossRef]
  11. Alkharabsheh, S.A.; Sammakia, B.G.; Skrivastava, S.K. Experimentally Validated Computational Fluid Dynamics Model for a Data Center with Cold Aisle Containment. J. Electron. Packag. 2015, 137, 021010. [Google Scholar] [CrossRef]
  12. Nada, S.A.; Said, M.A.; Rady, M.A. CFD investigations of data centers’ thermal performance for different configurations of CRACs units and aisles separation. Alex. Eng. J. 2016, 55, 959–971. [Google Scholar] [CrossRef]
  13. Chu, W.-X.; Wang, C.-C. A review on airflow management in data centers. Appl. Energy 2019, 240, 84–119. [Google Scholar] [CrossRef]
  14. Lu, H.; Zhang, Z.; Yang, L. A review on airflow distribution and management in data center. Energy Build. 2018, 179, 264–277. [Google Scholar] [CrossRef]
  15. Wibron, E.; Ljung, A.-L.; Lundstrom, T.S. Computational Fluid Dynamics Modeling and Validating Experiments of Airflow in a Data Center. Energies 2018, 11, 644. [Google Scholar] [CrossRef]
  16. Sjölund, J.; Vesterlund, M.; Delbosc, N.; Khan, A.; Summers, J. Validated Thermal Air Management Simulations of Data Centers Using Remote Graphics Processing Units. In Proceedings of the IECON 2018—44th Annual Conference of the IEEE Industrial Electronics Society, Washington, DC, USA, 21–23 October 2018. [Google Scholar]
  17. Simonazzi, E.; Ramos Galrinho, M.; Varagnolo, D.; Gustafsson, J.; Garcia-Gabin, W. Detecting and Modelling Air Flow Overprovisioning/Underprovisioning in Air-Cooled Datacenters. In Proceedings of the IECON 2018—44th Annual Conference of the IEEE Industrial Electronics Society, Washington, DC, USA, 21–23 October 2018. [Google Scholar]
  18. Gustafsson, J.; Fredriksson, S.; Nilsson-Mäki, M.; Olsson, D.; Summers, J. A demonstration of monitoring and measuring data centers for energy efficiency using opensource tools. In Proceedings of the IECON 2018—44th Annual Conference of the IEEE Industrial Electronics Society, Washington, DC, USA, 21–23 October 2018. [Google Scholar]
  19. Zhai, J.Z.; Hermansen, K.A.; Al-Saadi, A. The Development of Simplified Boundary Conditions for Numerical Data Center Models. Ashrae Trans. 2012, 118, 436–449. [Google Scholar]
  20. Arghode, V.K.; Kang, T.; Joshi, Y.; Phelps, W.; Michaels, M. Measurement of Air Flow Rate through Perforated Floor Tiles in a Raised Floor Data Center. J. Electron. Packag. 2017, 139, 011007. [Google Scholar] [CrossRef]
  21. Abdelmaksoud, W.A.; Khalifa, H.E.; Dang, T.Q.; Elhadidi, B.; Schmidt, R.R.; Iyengar, M. Experimental and Computational Study of Perforated Floor Tile in Data Centers. In Proceedings of the 12th Lntersociety Conference on Thermal and Thermomechanical Phenomena in Electronic Systems (THERM), Las Vegas, NV, USA, 2–5 June 2010; pp. 1–10. [Google Scholar]
  22. Roache, P.J. Perspective: A Method for Uniform Reporting of Grid Refinement Studies. J. Fluids Eng. 1994, 116, 405–413. [Google Scholar] [CrossRef]
  23. Celik, I.B.; Ghia, U.; Roache, P.J.; Freitas, C.J.; Coleman, H.; Raad, P.E. Procedure for Estimation and Reporting of Uncertainty Due to Discretization in CFD Applications. J. Fluids Eng. 2008, 130. [Google Scholar] [CrossRef]
  24. Abdelmaksoud, W.A.; Khalifa, H.E.; Dang, T.Q. Improved CFD modeling of a small data center test cell. In Proceedings of the 12th Intersociety Conference on Thermal and Thermomechanical Phenomena in Electronic Systems (THERM), Las Vegas, NV, USA, 2–5 June 2010; pp. 1–9. [Google Scholar]
  25. Herrlin, M.K. Rack Cooling Effectiveness in Data Centers and Telecom Central Offices: The Rack Cooling Index (RCI). Ashrae Trans. 2005, 111, 725–731. [Google Scholar]
  26. Chu, W.-H.; Hsu, C.-S.; Tsui, Y.-Y.; Wang, C.-C. Experimental investigation on thermal management for small container data center. J. Build. Eng. 2019, 21, 317–327. [Google Scholar] [CrossRef]
  27. Herrlin, M.K. Airflow and Cooling Performance of Data Centers: Two Performance Metrics. Ashrae Trans. 2008, 114, 182–187. [Google Scholar]
  28. VanGlider, J.W.; Shrivastava, S.K. Capture Index: An Airflow-Based Rack Cooling Performance Metric. Ashrae Trans. 2007, 113, 126–136. [Google Scholar]
Figure 1. Computational domain for (left) the hard floor configuration and (right) the raised floor configuration with open aisles.
Energies 12 01473 g001
Figure 2. Labeled main components and measurement locations for (left) the hard floor configuration and (right) the raised floor configuration with open aisles.
Energies 12 01473 g002
Figure 3. Velocity profiles along L5 for (a) all the different grids and (b) the fine grid with error bands.
Energies 12 01473 g003
Figure 4. Velocity profiles for (a) the hard floor configuration and (b) the raised floor configuration with open aisles.
Energies 12 01473 g004
Figure 5. Velocity and temperature on a plane through the center of computer room air handler (CRAH) 2 and 4 (see Figure 2) in the hard floor configuration with an open aisle.
Energies 12 01473 g005
Figure 6. Velocity and temperature on a plane through the center of the CRAH 2 and 4 (see Figure 2) in the raised floor configuration with an open aisle.
Energies 12 01473 g006
Figure 7. Rack intake temperatures for the hard floor configurations.
Energies 12 01473 g007
Figure 8. Rack intake temperatures for the raised floor configurations.
Energies 12 01473 g008
Figure 9. (a) Rack Cooling Index (RCI) and (b) Return Temperature Index (RTI) for all setups.
Energies 12 01473 g009
Figure 10. Rack intake temperatures for the hard floor configurations with 50% supply flow rate.
Energies 12 01473 g010
Figure 11. Rack intake temperatures for the raised floor configurations with 50% supply flow rate.
Energies 12 01473 g011
Figure 12. (a) RCI and (b) RTI for all setups with 50% supply flow rate.
Energies 12 01473 g012
Table 1. Inlet velocity from the CRAH units for the hard floor setup at a supply temperature of 18.3 °C.
CRAH UnitVelocity (m/s)
C11.150
C21.137
C31.173
C41.136
Table 2. Inlet velocities from the perforated tiles for the raised floor setup at a supply temperature of 18.3 °C.
Perforated TileVelocity (m/s)
T11.197
T21.358
T31.540
T41.228
T51.220
T61.593
T71.594
T81.309
T91.377
T101.512
T111.529
T121.188
T131.206
T141.455
Table 3. Boundary conditions for the server racks—raised floor configuration.
Mass Flow Rate (kg/s)Heat Load (W)
R10.9177177
R20.5273879
R30.8046600
R40.3724800
R50.2994167
R60.3544864
R70.3854800
R80.2312423
R90.1972479
R100.2002495
Table 4. Boundary conditions for the server racks—hard floor configuration.
Mass Flow Rate (kg/s)Heat Load (W)
R11.1907481
R20.6053933
R30.8266578
R40.4384800
R50.3104174
R60.3534864
R70.4534799
R80.2402428
R90.2232479
R100.2432625
Table 5. Capture Index (CI) for the server racks in all setups with 100% supply flow rate.
Hard FloorRaised Floor
Open (%)Side Cover (%)Top Cover (%)Open (%)Side Cover (%)Top Cover (%)
R161.6884.2969.7093.1599.9999.92
R299.9399.9999.0899.9899.9999.98
R310010010099.9999.9999.99
R410010010099.9999.9999.99
R510099.9499.5599.9999.9999.99
R610099.9499.9999.9999.9999.99
R710010010099.9999.9999.99
R810010010099.9999.9999.99
R910010099.9899.9999.9999.99
R1099.9399.9792.9898.3199.9999.99
Table 6. CI for the server racks in all setups with 50% supply flow rate.
Hard FloorRaised Floor
Open (%)Side Cover (%)Top Cover (%)Open (%)Side Cover (%)Top Cover (%]
R144.6669.5047.648696.8882.46
R280.0986.2160.3287.6190.6393.10
R385.7491.2690.8996.1696.8197.40
R499.2899.7097.1499.9199.8999.70
R596.5186.6584.3798.0497.8599.25
R699.7991.9099.8099.6899.4899.07
R710010010099.249999.80
R810099.9999.9599.2599.6199.84
R910010090.1799.8999.9599.22
R1095.7999.9839.1794.1199.3293.51

