Article

Controllability Evaluation of EV Charging Infrastructure Transformed from Gas Stations in Distribution Networks with Renewables

1
School of Electrical and Information Engineering, Tianjin University, Tianjin 300072, China
2
School of Engineering, Cardiff University, Cardiff CF24 3AA, UK
3
State Grid Anhui Electric Power Science Research Institute, Hefei 230061, China
*
Authors to whom correspondence should be addressed.
Energies 2019, 12(8), 1577; https://doi.org/10.3390/en12081577
Submission received: 13 March 2019 / Revised: 19 April 2019 / Accepted: 22 April 2019 / Published: 25 April 2019
(This article belongs to the Special Issue Automation, Control and Energy Efficiency in Complex Systems)

Abstract

:
A considerable market share of electric vehicles (EVs) is expected in the near future, which leads to a transformation from gas stations to EV charging infrastructure for automobiles. EV charging stations will be integrated with the power grid to replace the fuel consumption at the gas stations for the same mobile needs. In order to evaluate the impact on distribution networks and the controllability of the charging load, the temporal and spatial distribution of the charging power is calculated by establishing mapping the relation between gas stations and charging facilities. Firstly, the arrival and parking period is quantified by applying queuing theory and defining membership function between EVs to parking lots. Secondly, the operational model of charging stations connected to the power distribution network is formulated, and the control variables and their boundaries are identified. Thirdly, an optimal control algorithm is proposed, which combines the configuration of charging stations and charging power regulation during the parking period of each individual EV. A two-stage hybrid optimization algorithm is developed to solve the reliability constrained optimal dispatch problem for EVs, with an EV aggregator installed at each charging station. Simulation results validate the proposed method in evaluating the controllability of EV charging infrastructure and the synergy effects between EV and renewable integration.

1. Introduction

The high penetration of electric vehicles and renewable energy sources in the electric power networks provides a promising solution to the energy crisis and environmental stress. If properly controlled, EVs can act as mobile energy storage to facilitate the integration of intermittent renewable power generation, further alleviating the dependency on fossil fuels [1]. The feasibility of an electrified transportation system for zero or low carbon emission in the near future has been studied [2,3]. China Energy Administration announced the goal to have 120 thousand EV charging stations and 4.8 million charging piles in the power network by 2020. With increasing market share of electric vehicles (EVs), the gas stations are expected to be replaced with EV charging facilities supplied by electric power systems. However, as the EV charging introduces additional load demand, new challenges will be placed on the power system, consisting of reliability and power quality issues [4]. The charging load distribution transformed from the fuel consumption at the gas stations needs to be precisely quantified to evaluate the impact on the power system. Then the possible solutions can be suggested, such as upgrading the existing power system or applying appropriate control techniques in order to maintain the reliable and economic operation of the power system.
As the fuel consumption at the gas stations is transformed to electric energy consumption at various charging facilities, the temporal and spatial distribution of energy demand in the electric power network needs to be quantified. The economic benefits have been studied by using a lifetime cycle model for oil-to-electricity transformation in the transportation sector across the city [5,6]. However, the mapping relation between gas station and charging station for computing the distribution of charging load in the power network, based on the accessible service data of the facilities, has not been studied so for in the literature. Unlike gas stations, where the service time is usually within several minutes, the charging period of EV takes several hours, which means that the charging usually occurs at the parking lots. The real-time information of parking lots and gas stations are accessible from the internet in the E-map (e.g., google map) or the online service website of the refueling and parking facilities. Taking the advantage of real-time data from the internet, a practical computation of energy distribution of EV charging load is developed and; therefore, the impact on the power network and the controllability of this additional charging load can be estimated. Load computation of EV charging stations has been reported extensively in the literature. Monte Carlo simulation is used to model the stochastic process of EV charging considering the driving habits and trip distances, etc., and hence to formulate the daily charging power profile of a charging station by summing up the energy consumption of EVs [7,8]. Queuing theory has also been adopted to model the operation of parking lots [9,10] and EV charging demand in [11,12], where the charging processes are represented by an M / M / queuing system and the arrival rates of EVs are generated as a Poisson process. Vehicle mobility statistics extracted from the 2009 (US) National Highway Travel Survey (NHTS) data is used in [11,12] to define the parameters of the queuing model for the output profiles, for the number of EVs charged and the times EVs arrive and depart from the charging station. However, the stochastic process of EV travel patterns in various countries receives the same input from fixed statistics of a certain area, such as the NHTS dataset. Moreover, the Poisson process in the queuing model assumes EVs have several constant arrival rates and the charging time is typically modeled by Gaussian distribution with given upper and lower limits, which are randomly assigned to each EV. In the proposed queuing theory-based modeling of EV charging stations, the stochastic process of EV arrival and parking can be expressed as a probability function and the parameters can be calculated according to the statistical data accessible from E-map and the service website of facilities.
The modeling and management of EV charging stations are integrated in to the power system analysis and optimal dispatch problem. In the state of art control framework for high-penetration EVs in the power system (i.e., vehicle-to-grid (V2G) technology), the EV aggregator (EVA) is usually introduced as the intermediate control entity between EVs and the distribution system operator (DSO) [13,14]. Since a group of EVs are aggregated at the charging stations, an aggregator is assigned to monitor and control the chargers. The interactive control among EV aggregators and the autonomous control within each aggregator are performed in the typical V2G control framework to relieve the computation load of DSO for the regional distribution network. If properly controlled, the negative impact of the additional charging load can be mitigated and ancillary services can be provided, such as cost minimization, peak shaving, and power quality improvement [12,15]. However, EV parking behavior and energy demand are usually modeled by typical distribution function with the fixed parameters or historical statistics. But the random distribution function and historical statistics of a certain region cannot reflect the diverse characteristics of service facilities for automobiles in other places and; therefore, the results may be very different from the actual condition of the power network with massive EVs.
The control method is the key technique to explore the controllability of charging load for functioning as a virtual energy storage and coordinating with renewable energy sources. There has been a lot of existing research on the optimal dispatching of EV charging power in the power system [16]. From the perspective of an EV aggregator, the location and size of charging aggregations need to be found, the differential evolution and particle swarm optimization (PSO) algorithms are used to solve the optimization problem with the objective of total cost minimization [17]. The location of the charging stations and the optimal number of charging spots were given in the optimal solution [18]. However, the power network has not been taken into account in the model [19]. Other objective functions were investigated for the optimal placement and sizing of an EV aggregator, particularly the profit maximization of an EV aggregator, but some practical issues from the side of users were not described, such as the satisfaction of mobile needs and power quality deterioration caused by recharging massive EVs at peak hours [20]. The optimal dispatch by using EVs as mobile energy storage in the power grid is also studied in the recent literature [21]. In the optimal control problem of EV charging stations modeled in this paper, both EV aggregator configuration at available parking lots and EV charging power regulation should be solved. Therefore, a combined optimization of EV aggregation configuration and operation should be derived based on the modeling of EV charging stations in the optimal dispatch problem.
The main objectives of this paper are to propose a quantitative evaluation of EV charging load and the controllability in the power network, based on the assumption that the fuel consumption at the gas stations is transformed to EV charging facilities covering the same region. The main contributions of the work presented in this paper are as follows:
  • The mapping relation between gas stations and EV charging stations is proposed to estimate the distribution of EV charging load in the power network, by using the online accessible data from E-map and service website of the facilities. These features render the proposed charging station model more realistic and accurate than the existing models, in which mobility statistics for vehicles in a certain area is adopted in the charging load computation.
  • A novel operational model of EV charging stations is formulated by using membership function between EVs and parking places and queuing theory. The arrival and parking behavior of EVs are captured from the online data and used for estimating the 24-hour electric power demand. So far, there is no reported work that examines how the operation of an EV charging station can be modeled as a function of input parameters and control variables integrated into the optimal dispatch of the power system. In the proposed modeling of EV charging stations, the parameters and boundaries of control variables are calculated for the reliability constrained optimal dispatch of the distribution network.
  • The optimal control of EV charging stations is devised under the typical V2G control framework, where the EV aggregator performs as the intermediate controller for EVs at each charging station. The optimal dispatch problem is composed of both EV charging station configuration and EV charging power regulation. The optimal setting of the EV charging station and the optimal charging plan of each individual EV are given by the optimal dispatch. A two-stage hybrid algorithm is developed to reduce the complexity of the optimization that evaluates the controllability of the charging stations in the oil-to-electricity transformation.
The operational model of EV charging stations changed from gas stations is presented in Section 2. The optimal configuration and control of charging stations integrated into the optimal dispatch of the power system are explained in detail in Section 3. Section 4 describes the two-stage hybrid optimization algorithm devised for the optimal charging strategy in Section 3. Section 5 presents the analysis and discussion of controllability evaluation for charging facilities in the test 123-bus test network. Section 6 outlines the conclusion drawn based on the numerical results.

2. Modeling of EV Charging Stations Transformed from Gas Stations

As vehicles served by the gas stations will be replaced by EVs in the future, EV charging facilities will be built to meet this energy demand. The EV charging stations are established with both fast charging and slow charging devices installed at the parking lots. EV charging load changed from gas stations was calculated based on the data extracted from accessible E-map or the online service website of the facilities. For instance, the location and real-time occupancy rate of gas stations and parking lots across the certain area of the town, as shown in Figure 1. The key parameters of the modeling were extracted from the online graphic data to characterize the parking of EVs at different places. The mathematical model of the charging process was formulated considering the energy consumption at gas stations and the EV parking period at parking lots. The weekly occupancy rate of the parking lot, as laid out on the map of Figure 1, shows that each day of the week had a different service pattern. Therefore, a daily occupancy rate was extracted for modeling the operation of EV charging stations, as shown in the right side of the figure. The EV-to-carpark membership function and the queuing theory were also adopted to calculate the parking time and charging service pattern. The temporal and spatial distribution of the EV charging can be calculated according to the online data and the control strategies can be developed based on the adjustable variables, with boundaries defined by modeling the operation of EV charging stations. The workflow of the proposed modeling of the EV charging station and the integrated optimal charging algorithm in the power network is illustrated in Figure 2.

2.1. Oil-To-Electricity Transformation with Membership Function between EVs and Parking Lots

It was assumed that the fuel consumption at the gas station was transformed to the electricity supplied by EV charging stations during the electrification of transportation system. The energy consumption taken over by the regional EV charging stations can be expressed by:
F e = t = 1 T j = 1 G C f j ( t ) = t = 1 T k = 1 M C e k ( t )
C e k ( t ) = i = 1 N k ( t ) P i k ( t ) · Δ t
where M is the number of parking lots, G is the number gas of stations covering the same region, t denotes tth hour, and T represents the planned time period, which is a typical day in the simulation, as shown in Figure 1. j denotes jth gas station, k denotes the kth parking lot, and i is the ith EV. Cf represents the fuel consumption at the gas station, which is measured by heat based on the quantity (mL) and density (kg/mL) of oil traded at the gas station and fuel heating value (42 MJ/kg), and then converted into the unit of kWh. Ce is the equivalent electricity consumption in the unit of kWh. P(t) is the charging power at each time step, and Nk(t) is the number of EVs at kth parking lot. Because, at each time step, EVs can be at any parking lots in the region, the membership function is defined to represent the possibility and the duration of each EV at the kth parking lot. The membership function between EVs to parking lots can be expressed by:
α m = [ α 1 α k α M ]
α k = [ α 1 k α i k α N k ] T
where N p is the number of all parked vehicles, αm is the matrix of membership degree, and α i k is the membership degree of ith EV at kth parking lot. αm subjects to the following conditions:
k = 1 M α i k = 1 i N
k = 1 M N k ( t ) = N t T
k = 1 N α i k · T = t = 1 T N k ( t )
These conditions included that the summation of membership degrees for each EV to all the parking lots should be 1. Based on the same assumption that all the vehicles served by the gas stations were changed to parking lots in the same region, the summation of EVs at the M parking lots should be equal to the total number of EVs. Furthermore, the total service time of the parking lots can be calculated by the summation of membership degree. It can also be derived from occupancy and capacity of parking lots which can be read from online graphic data as shown in Figure 1. The temporal and spatial distribution of energy consumed at gas stations to the parking lots was calculated by the membership functions in the following section.

2.2. Operation of EV Charging Stations Based on Queuing Theory and Accessible E-Map Database

The arrival and departure times of EVs at parking lots, which are essential for daily profile of EV load, were derived by the parking data analysis, whereby queuing theory applies. The condition of a typical queuing theory model is that the arrival intensity is constant over the time. But the arrival of EVs for commuting can be concentrated on several hours. Moreover, the service time of parking, which usually takes several hours, is much longer than that of gas station on the time scale of minutes. The steady state of a queuing system cannot be reached in a short time, which is consistent with the real data shown in Figure 1. Thus, in the proposed model, the number of EV was composed of two portions, the steady state and the dynamic state. The steady state was defined as basic EV flow, where the arrival intensity was constant over the time. The dynamic state was defined as categorized EV flow, where EVs were used for a certain purpose and show a fixed pattern, such as household charging for EVs that started charging once coming back from work.
The operation of parking lots was modeled based on queuing theory and the online data. The variation of the parked vehicles can be expressed by:
N k ( t ) = L s k ( t ) = L b k + N c k ( t ) k M
N c ( t ) ¯ = L s ( t ) ¯ L b ¯
where L b k is the expected number of basic EV fleet, which is also the queuing length in the steady state; and N c k is the number of categorized EV fleet, which is varying over the time according to the arrival intensity. These numbers can be read from online service data for each parking lots, as shown in Figure 1. The accessible data is described as N c ( t ) ¯ , L s ( t ) ¯ , and L b ¯ in Equation (9) for the varying number of EVs parked at each time slot.
According to queuing theory, the arrival of EVs at parking lots is Poisson distribution, denoted by λb and λc for steady and categorized EV fleets, respectively. The queuing length (Lb) in the steady state can be calculated by applying the result of queuing theory, where the parking lots can be modeled as a M/M/Z/Z queuing system [7,8].
λ z = λ b ,   z = 1 , 2 , ,   Z k
μ z = z μ ,   z = 1 , 2 , ,   Z k
where Zk is the capacity of kth parking lot, and z is the number of EVs at a parking lot. The service time in this case is the parking period, which complies with negative exponent distribution 1/μ in the queuing model. The service intensity of the parking lot is defined by the queuing theory, and the number of EVs at the parking lot can be written as a function of ρ:
ρ = λ b Z k μ
L b k = z = 0 z k z P z = z k ρ ( 1 P z )
The complete modeling of parking lots is described in Appendix A. The arrival rate of a basic EV fleet can be derived if the queuing length is given:
λ b = Z k μ ρ ( L b k ¯ )
where L b k ¯ is the average number of basic EVs at a parking that can be collected from online data.
Similarly, the categorized EV fleet in the queuing model can be quantified by assuming that the arrival rate at each time step is Poisson distribution. The arrival of categorized EVs is concentrated on several hours, which can be easily identified from the occupancy variation of the parking lots. As shown in Figure 1, the rising zone is assumed to be arrival period of categorized EVs as explained in Appendix A. Therefore, the number of arrival EVs N i n c k can be calculated from N c k ( 0 ) and N c k ( t ) , as shown in Appendix A, and can also be calculated by:
E ( N i n c k ( t ) ) = y = 0 y · ( λ t ) k k ! e λ t = λ c k ( t ) · Δ t
λ c k ( t ) = N i n c k ( t ) ¯ Δ t = Δ N c k ( t ) ¯ Δ t
where Δ N c k ( t ) ¯ is the difference of categorized EV number at tth hour, which can be read from the online data shown in Figure 1. The arrival rate at each time slot can be calculated by Equations (14) and (16), and used to determine the parking time period of EVs at parking lots.
The membership degree of each individual EV to parking lot is correlated with the parking period in the queuing theory:
α i k · T = τ i ~ 1 μ ,   1 μ = τ i ¯
where τi is the parking period of tth EV at one parking lot. The service time complies with negative exponential distribution [7,8]. τ i ¯ is the average EV parking period that can be collected from online data. As all the other parameters are calculated, the arrival and the time duration of EVs at the parking lot can be completely quantified.

2.3. Parameter Configuration of EV Charging Facilities

In order to analyze the temporal and spatial distribution of EV charging energy at parking lots covering the same region of gas stations, the number of EVs charged at the parking lot and the energy consumption were calculated according to the fuel consumption at gas stations. Based on the formulation of EV charging facilities installed at parking lots by using membership function, the total number of served EVs can be calculated by:
k = 1 M i = 1 N i n k α i k · T = i = 1 N k = 1 M α i k · T = i = 1 N · T = N · T
k = 1 M α a k · N i n k = N P
α i k = { α a k α i k 0 0 α i k = 0
where N P is the number of served EVs at all parking lots during T hours. The membership degree of EVs at the same parking lot was assumed to be the same in Equation (20), since the customers of a parking lot usually had the same purpose for working in an office building or for staying at home in the residential area. The number of EVs charged at the parking lot can be calculated according to the energy consumption of gas stations:
F e = k = 1 M t = 1 T i = 1 N k ( t ) P i k ( t ) · Δ t = k = 1 M i = 1 N k ( t ) · t = 1 T P i k ( t ) · Δ t = k = 1 M i = 1 N i n k E C i ( S O C o u t k S O C i n k )
where E C i is the battery energy capacity of ith EV. S O C o u t k is the SOC of EV battery at departure and S O C i n k is the SOC of EV battery at arrival, respectively. The initial SOC and the target SOC (defined as above 90%) are also random variables that are defined as normal distribution:
S O C i n k , S O C o u t k ~ N ( μ , σ 2 )
The parameters of normal distribution are given for estimating the EV charging load, and the variety of different types of EVs was taken into account:
E C i ¯ = r = 1 R E C r · η r
E C i ¯ is the average battery capacity. E C r is the battery capacity of r type EV, and η r is the ratio of r type EVs to all EVs served at the regional charging stations.
F e = k = 1 M i = 1 N i n k E C i ¯ · ( S O C o u t k ¯ S O C i n k ¯ )
N ¯ = F e E C i ¯ · ( S O C o u t k ¯ S O C i n k ¯ )
η E C = N ¯ N P
where N ¯ is the average number of charged EVs, and η E C is the ratio of charged EVs to parked EVs.

2.4. Mathematical Formulation of EV Charging Load and Controllable EV Charging Variables

In order to analyze the impact of EV charging transferred from gas stations and to develop the control strategy for the EV charging process, the calculation of EV charging load and the control variables were derived from the operational model of aforementioned charging facilities incorporated with parking lots.
F e u n = k = 1 M t = 1 T C e k ( t ) = k = 1 M i = 1 N α m · P r · T
P r = [ P r 1 , , P r k , , P r M ] T
F e u n denotes the energy consumption calculated in an uncontrolled case, and P r k is the rated power of EV charger at kth parking lot. The matrix of membership degree of EV to parking lots can also be expressed as α i = [ α i 1 , α i 2 , , α i k , , α i M ] T .
α i k · P = r k { α i k · P r k α i k T i k r T P r k · T r k r T α i k > T i k r T
T i k r = E C i · ( s o c o u t k s o c i n k ) P r k
T i k r is the charging period of EV to reach target SOC at the departure time with rated power.
P var k ( t ) = [ P 1 k ( t ) , , P i k ( t ) , , P N k ( t ) ]
F e c o n = k = 1 M t = 1 T C e k ( t ) = k = 1 M i = 1 N t = 1 T α i P i k ( t ) · Δ t = k = 1 M i = 1 N t = 1 T α i P var k ( t ) · Δ t
T α i = α i k · T
F e c o n denotes the energy consumption calculated in controlled case, and P var k is the vector of variables (charging power) in a controlled case.
t = 1 T α i P i k ( t ) · Δ t = E C i · ( S O C o u t k S O C i n k )
T α i is the time period of ith EV parked at kth parking lot.

3. Coordinated Integration of EV Charging Stations into the Electric Distribution Grid

As temporal and spatial distribution of EV charging demand and controllable variables are given from the above quantitative analysis of oil-to-electricity transformation for regional automobiles, the charging facilities can be integrated into the electric distribution network. The impact of EV charging load on the power system operation is quantified and the control strategy is developed by adjusting the control variables within the boundaries that are given in the above section. In the vehicle-to-grid operation framework, an EV aggregator is usually defined as the control entity between power grid and EVs, which offers services to aggregate EV charging power (or discharging defined as V2G) from a group of EVs, and acts towards the grid to provide considerable power regulation capacity. In this context, each parking lot is correlated with one EV aggregator, which can perform real-time monitoring and regulation on the charging behavior of each individual EV as long as it is plugged into the power grid. Since the power feedback from EV to grid results in serious battery degradation, which may prevent EV owners from participating in the vehicle-to-grid interaction, only the charging adjustment is taken into account in this paper to provide the optimal charging plan for EVs.
In the impact analysis of EV charging load, EVs were assumed to start charging as soon as they are parked, which is the direct charging used as the uncontrolled case in the simulation. In this case, EVs are charged at rated power of the charging facility or on-board battery charger. The daily charging profile in the impact analysis was defined as the reference to be compared with the controlled case in the simulation. A two-stage optimization was formulated for managing the charging load based on the control variables and the boundaries defined in the above section.

3.1. Objective Function of the Optimal Control Strategy

The multi-period optimal dispatch with EV charging infrastructure, formulated in considering network constraints, is a mixed integer nonlinear programming (MINLP) problem [20,21,22]. A two-stage optimization algorithm was derived from the basic formulation of the MINLP optimal charging problem. The optimal configuration of the EV aggregator and the operation of the EV charging infrastructure for regulating the charging rate of individual EVs were modelled in the optimal dispatch problem. The overall objective in this work is to minimize the operating cost. In the objective function, the expenditure on supplying electricity to the load, including charging EVs and the total power loss, were calculated in Equation (35):
min t = 0 T i = 1 n ρ ( t ) ( P L d ( t ) + P E V A i ( t ) + P L s ( t ) ) Δ t
where ρ(t) is the electricity price at time t; P L d ( t ) is the net power load of the original distribution system; P E V A i ( t ) is the accumulated EV charging power at bus i; P L s ( t ) is the total power loss at time t; and Δ t is the time interval, which was defined as one hour in the proposed day-ahead optimal dispatch of EV charging infrastructure, and it was also consistent with the above charging station model. The load of the EV charging station was calculated by:
P E V A i ( t ) = m = 1 M i P E V A i m ( t )
P E V A i m ( t ) is the charging rate of individual EVs in the control realm of the EV aggregator installed at bus i.
P L S ( t ) = ( i , j ) B R i j P i j 2 + Q i j 2 | V i | 2
P i j and Q i j are the active and reactive power, respectively, transmitted on the branch between bus i and j; | V i | is the voltage magnitude at bus i, and R i j is the resistance of branch ij.

3.2. Constraints of EV Charging Optimization

The mathematical model was subject to constraints from each participant in the EV charging optimization, including limits on the reliable operation of power system, EV charging station, and the requirements of EV users. The power flow balance was expressed by:
I i j ( t ) 2 = ( G i j 2 + B i j 2 ) [ U i 2 ( t ) + U j 2 ( t ) 2 U i ( t ) . U j ( t ) cos θ i j ( t ) ] I i j max 2
I i j ( t ) is the branch current; G i j and B i j denote the admittance matrix of the power network; U i and U j are the bus voltage; and I i j max is the maximum current of the transmission line.
( V i min ) 2 V i r ( t ) 2 + V i i m ( t ) 2 ( V i max ) 2
V i min and V i max are the lower and upper limits of bus voltage, respectively; V i r ( t ) and V i i m ( t ) are the real and imaginary parts of the bus voltage, respectively.
The adjustable EV charging power was limited within the capacity of the charging facility:
P E V A i , min P E V A i m ( t ) min { P m , max , P E V A i , max }
P E V A i , min and P E V A i , max are the lower and upper power boundaries of charging facilities, respectively; P m , max is the rated power specified by the EV on-board charger.
The target SOC set by EV users must be achieved till the departure of the parking lots:
S O C t a r m t = 1 T P E V A i m ( t ) · η c h r / C b a t m + S O C i n i m 1
where C b a t m is the battery capacity of the m t h EV; S O C i n i m and S O C t a r m are the initial and target SOC, respectively; and η c h r denotes the efficiency of battery charging.

4. Two-Stage Hybrid Optimization Algorithm

In the proposed EV charging optimization model, the decision variables included the setting of a charging station associated with its EV aggregator and the multi-period charging power control under the given configuration parameters. For the time-series simulation, the increased number of variables made it even harder to solve the MINLP problem. Thus, a two-stage algorithm was formulated to separate the variables into two categories, which were EV aggregator configuration and optimal charging plan for individual EVs. The original problem was converted to a master problem of optimal configuration and a sub-problem of optimal charging strategy, so as to reduce the complexity of the nonlinear constrained optimization modelled in the above section.

4.1. Solution Procedure for Optimal Integration of EV Charging Stations into the Power Grid

A two-stage hybrid optimization algorithm based on PSO and sequential quadratic programming (SQP) was derived to accelerate the calculation speed, as depicted in Figure 2. As shown in the flowchart, the problem solution of the hybrid optimization algorithm required an iterative process between the master problem of optimal configuration and the sub-problem of optimal charging strategy. In the master problem, the optimal locations of EV charging stations with the power level limits were found by applying PSO algorithm, and the charging plans for each individual EV were embedded as a sub-problem solved in the lower stage. In this way, the aggregated power of EVs connected to the bus of the distribution network was provided so that the PSO algorithm was implemented on mid-voltage level with a limited number of variables. The optimal charging stations were chosen from the candidate locations that were all the parking lots in the region of oil-to-electricity transformation. The capacity of the charging station must be lower than the parking lots:
L C E V A i { L P V 1 , L P V j , , L P V m }
C P E V A i ( N i n c k + L b k ) P E V r i
L C E V A i denotes the location of charging station at bus i, which is selected from the candidate locations of all parking lots, and the bus number is denoted by L P V j . C P E V A i denotes the capacity of the charging station at bus i, and P E V r i is the rated charging power of charging facility at this charging station.
The capacity of the installed charging facilities was also subject to the operation limits of the power grid considering each EV charging station connected to a bus of the network, as described in the above constraints Equations (38) and (39). All served EVs calculated in Equation (25) were distributed proportionally to each charging station based on its capacity, as expressed by:
N E V A i = N ¯ · C P E V A i / i = 1 n C P E V A i
P i , min P L D i ( t ) + m = 1 N E V A i P E V A i m ( t ) P i , max
N E V A i is the number of EVs distributed to a charging station according to the proportion of capacities of all charging stations. P L D i ( t ) is the base load at bus i, P i , min and P i , max are the minimum and maximum power allowed to be connected to bus i by the power system, respectively.
The optimal solution of the master problem was provided to the sub-problem as input parameters, including the bus where the EV charging station connected to the network and the charging power limits. The sub-problem without any integer variables can be solved by SQP within the feasible region given in the master problem. The constraints from the power network operation and EV mobile needs were also checked to ensure that the charging plan of each individual EV can fulfill the overall objective.

4.2. Two-Stage Hybrid Optimization Algorithm

The objective function of the master problem is described in Equation (35), with the location and power capacity of EV charging station in the power network as decision variables and subject to:
0 P E V A i ( t ) P E V A i max ( t )
where P E V A i max ( t ) is the upper limit of the overall charging power, that is the power capacity of each EV aggregator.
P E V A i max ( t ) = m = 1 M i P C E V A i m ( t )
P C E V A i m ( t ) is the power capacity of individual EV at bus i.
L C E V A i { 0 , 1 }
L C E V A i is the location of EV aggregation in the charging station, and in this algorithm is defined as a binary variable.
N A min i = 1 n L C E V A i N A max
N A min and N A max are the minimum and maximum number of EV aggregators planned to be installed in the power system depending on the construction budget of the EV charging infrastructure.
The sub-problem implemented the optimal dispatch of EV charging power under the configuration parameters of the EV aggregator given in the master problem. Accordingly, the sub-problem was formulated as:
min S P ( P E V A i m ( t ) | P E V A i max ( t ) , L C E V A i ) = t = 0 T i = 1 n P ( t ) ( P L d ( t ) + P E V A i m ( t ) + P L s ( t ) ) Δ t
where P E V A i m ( t ) | P E V A i max ( t ) , L C E V A i represents the charging rate of individual EV, which is the decision variable of the sub-problem that is to be optimized under the parameters given in the master problem.
f m ( L ) = 1 2 π σ m L exp ( ( ln L μ m ) 2 2 σ m 2 )
f m ( L ) is the probability distribution function of the distance L travelled by each EV; σm and μm are the parameters of exponential distribution that is used to simulate the stochastic travelled distance of EV. In this paper, it can be set to ln L ~ N ( 3.46 , 0.95 2 ) .
On the basis of travel distance, the required power recharged of each EV was calculated by:
S O C i n i m = S O C t a r m λ L C b a t m
where λ is the energy consumption per unit of distance.
The other commonly used constraints that describe the limits on the charging rate and EV battery SOC boundaries during the charging process under the control of EV aggregator can be found in existing research work [20,21,22,23].

5. Simulation Results of the EV Charging Station in Oil-To-Electricity Transformation

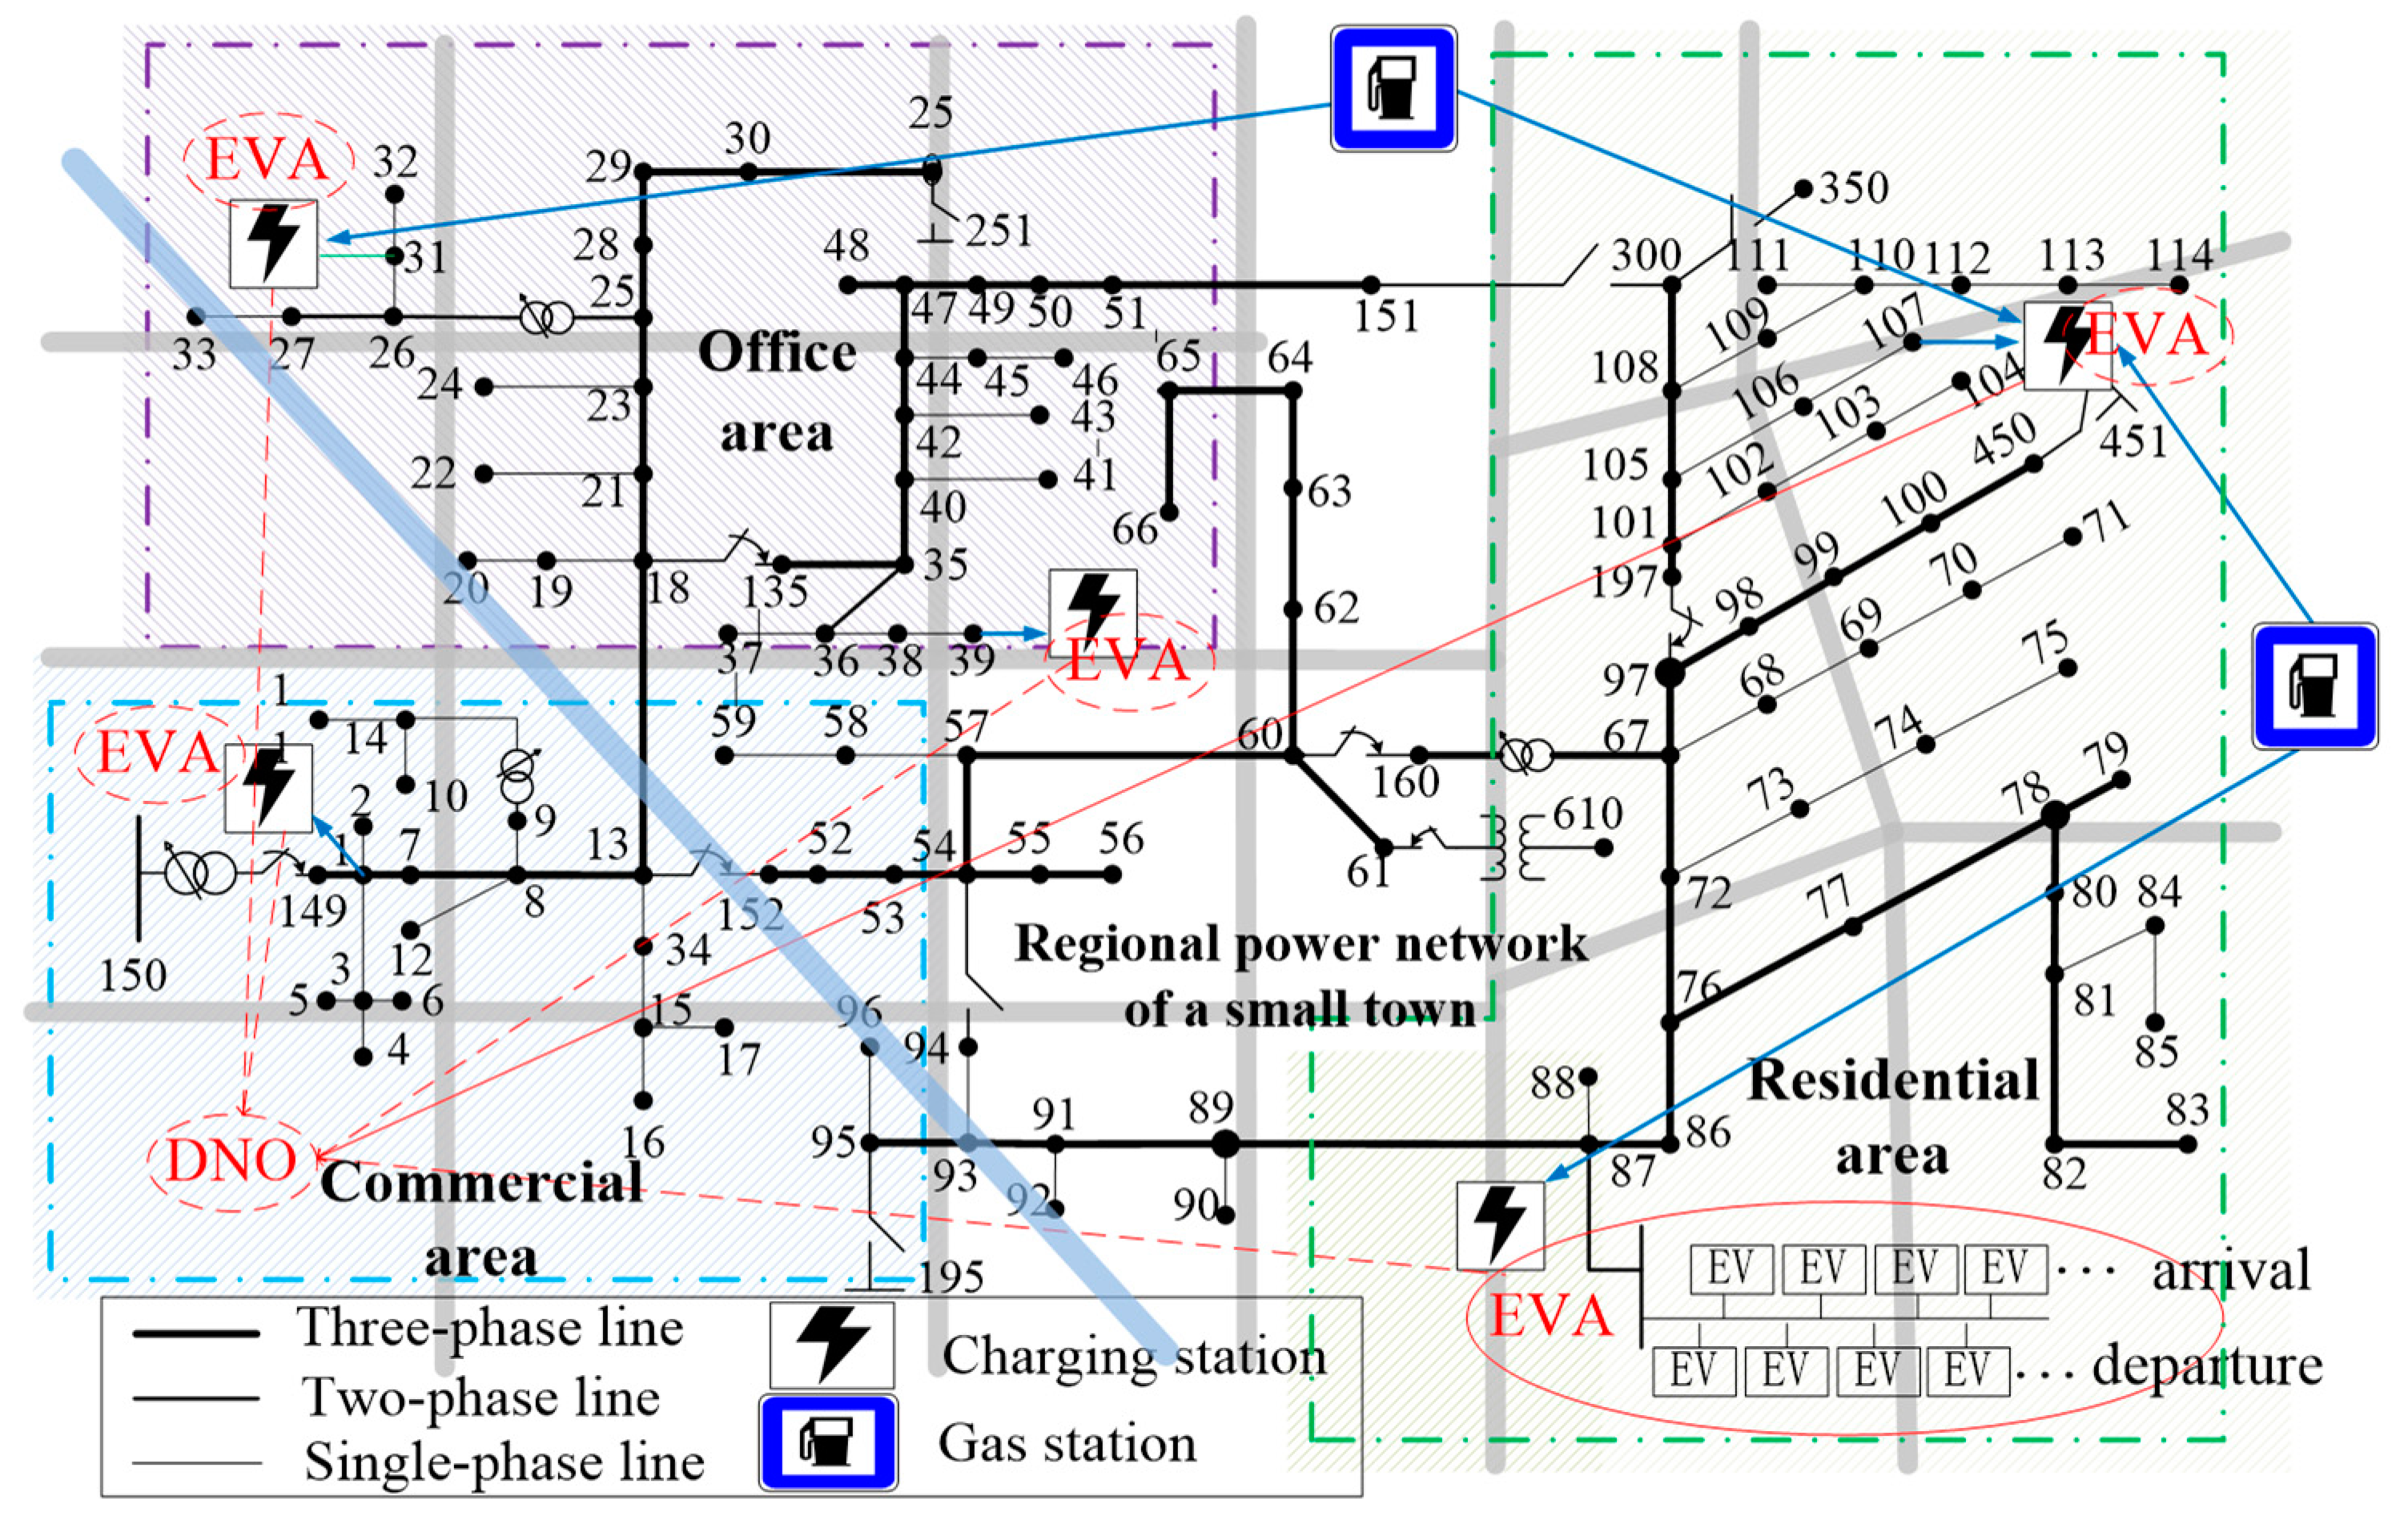
The simulation model built for oil-to-electricity transformation for regional automobiles was mainly composed of EV charging facilities changed from gas stations and the regional distribution network across a small town, as shown in Figure 1 and Figure 3.

5.1. Case Study

The IEEE 123-bus distribution network with three-phase unbalanced load was used for simulation studies [24], as depicted in Figure 3. For time-series simulation, active and reactive loads were calculated by multiplying the coefficient that reflected the daily load curve, as shown in Figure 4a. The net load profile of the power network was calculated based on the wind power and solar power generation and average daily load of South Australia in [25]. The original load of the test power network was equivalent to the load level indicated by coefficient 0.8. The two-tariff pricing was adopted for daily electric energy price including two main periods. The electricity prices applied to charging stations during the peak hours and the off-peak hours were set to 1.01 and 0.25 CNY/kWh, according to the trial operation of EV charging stations in Shenzhen, Guangdong province of China. It can be seen in Figure 4a that the integration of solar and wind power generation exacerbated the load variation. EV charging load can be controlled for load leveling as shown in Figure 4b, thus ensuring the reliability of the power network. The minimal number and the maximal number of EV charging stations planned to be installed in the test network were set to 5 and 8, considering existing parking lots in the region where automobiles were served by gas stations. The operating cost of the EV aggregator was assumed to be zero in the objective function.
Charging stations transferred from two gas stations, as shown in Figure 1, were integrated into the regional distribution network represented by the test 123-node systems shown in Figure 3. Two of the charging stations were assumed to be the parking lots located in the residential area. The characteristics of EV arrival and parking period were identified as the home charging scenario. Two of the charging stations were assumed to be located among office buildings where most of the customers came to work. The last charging station was assumed to be in the commercial area, and composed of EVs parked for shopping and EVs parked overnight. By integrating charging stations into the regional distribution network, the two home charging stations were connected to bus 87 and bus 107 in the 123-node power system. The two office charging stations were connected to bus 31 and bus 39, and the complex charging station was connected to bus 1. The capacity of charging stations, which also means the charging load distribution among the five stations, will be calculated in the proposed EV charging optimization algorithm. In this paper, the acceptable range of bus voltage was set from 0.95 to 1.05 p.u. as the constraints of optimal configuration for EV charging stations. Four different types of EVs were adopted in the case study. As shown in Table 1, the battery capacity and charging rate varied among different EV models. The power electronic interfaced chargers were installed to meet the fast and slow charging needs of EVs, which ranged from 2.2 to 44 kW, and the efficiency of energy conversion process was set to 0.9 in the simulation. As type I and II were designed to be capable of fast charging, these two types of EVs were assigned to office and commercial charging stations. Type III and IV were designed for slow charging and can be connected to standard household outlets. Therefore, these two types of EVs were assigned to home and also the complex charging station where both fast and slow charging facilities were installed. The parameters of EV charging scenario for computing battery energy and charging load are given in Table 1 and Table 2.

5.2. Results and Discussion

In the formulation of EV charging stations in oil-to-electricity transformation, charging load distributed at certain charging stations was equivalent to energy consumption for the automobiles served at the gas stations. The optimal configuration of charging stations is given in Table 2. The averages of normal distribution for initial SOC and target SOC at minimum were set to 0.5 and 0.9. The total number of EVs served by the charging stations was calculated to be 420 vehicles, with the assumption that the proportion of different types of EVs at each charging station was the same. For the office charging station at bus 31, the total number of EVs for type I and II was 20. Similarly, 150 EVs of type III and IV were served by the home charging station at bus 107. Four types of EV were served by the complex charging station at bus 1: 40 EVs of type I and II and 100 EVs of type III and IV. The number of EVs at each station were calculated according to the ratio of the capacities given by the proposed optimization algorithm for all EV charging stations. As shown in Table 2 and Figure 3, five optimal locations were selected from the parking lots in the regional power network and the capacities were set to minimize the impact of the additional EV charging load.
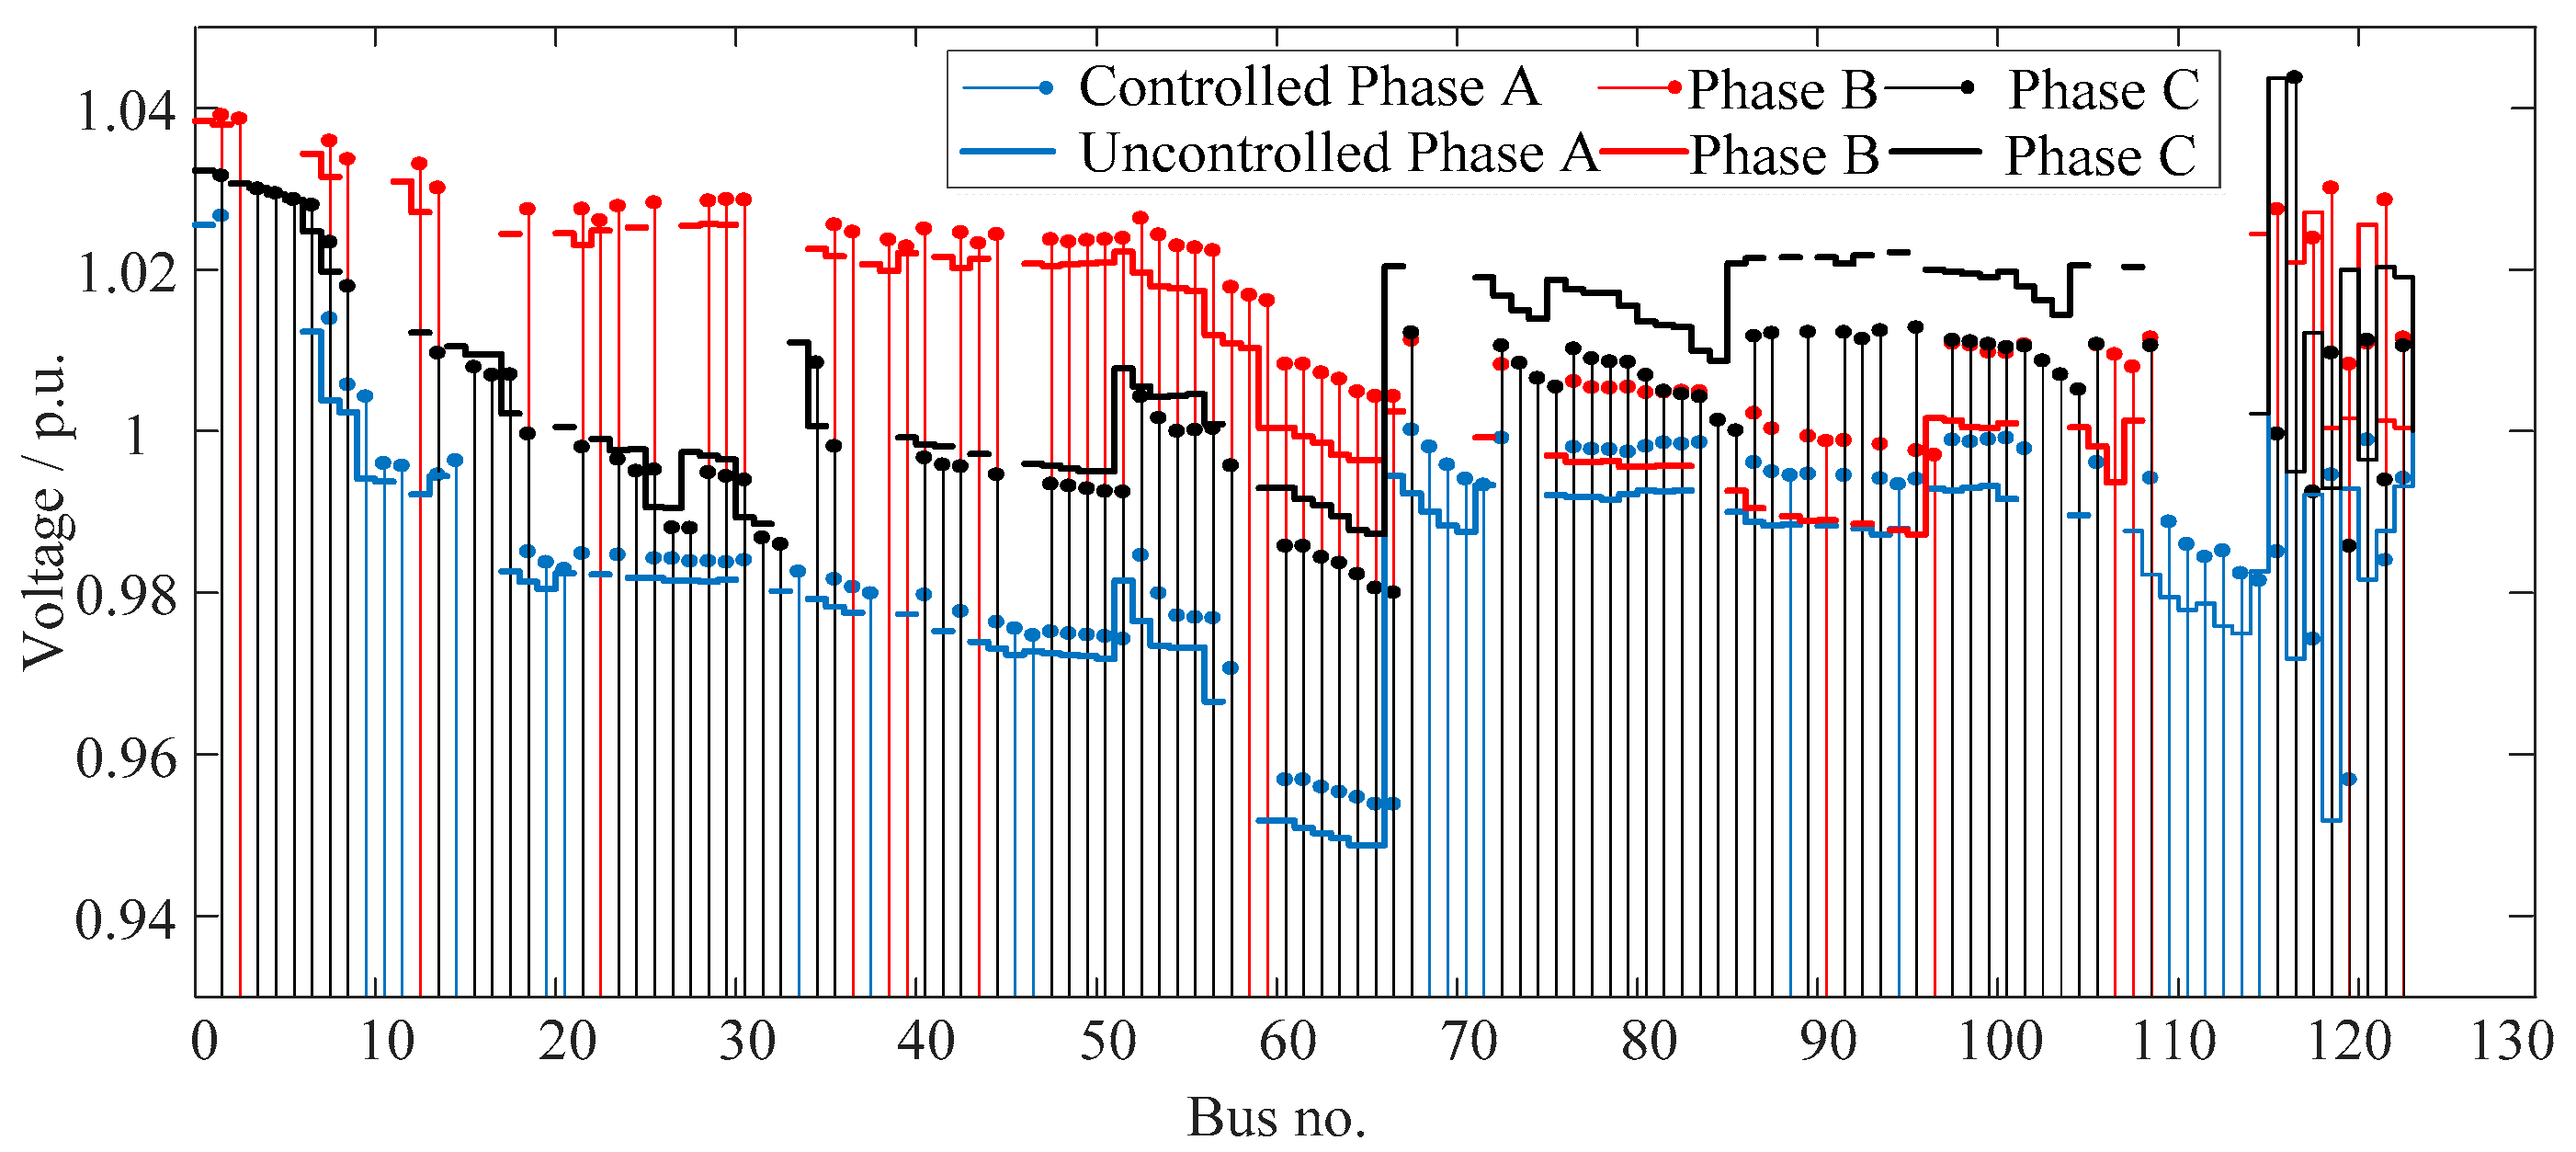
The load pattern and voltage deviation of the network with EVs in the uncontrolled condition and charging optimization were compared to evaluate the efficiency of the proposed method, as shown in Figure 4b and Figure 5a. In both cases, the configuration of EV charging stations adopted the results of the optimization algorithm, thus upgrading the performance of the uncontrolled case. Consequently, the uncontrolled charging with the best configuration was picked up from other randomly configured charging stations to analyze the advantage of optimally controlled EV charging load. The charging behavior of EV aggregations was regulated to achieve the valley filling and peak shaving, as seen in Figure 4b. The total power loss was reduced since the power losses at the peak hours were significantly curtailed, as shown in Figure 5b, in which ten lines with largest power flow were selected. The median, minimum, and maximum values of line losses can be seen in the box plot for the ten lines. The bus voltage of the test three-phase unbalanced power network is given in Figure 6, showing the reduction in voltage deviation. For the home charging stations at bus 87 and 107, most EVs were parked overnight and charged for commuting. The comparison of load and voltage profiles indicated that EV charging load is switched to the off-peak period during 24:00 to 6:00 the next day as shown in Figure 7a. Similar results can be found in Figure 7b for the office charging stations at bus 31 and 39, where the two types of EVs were charged to match the network load profile as long as the constraints on the target SOC and the parking time can be satisfied. Noted that the two-tariff pricing directed the EV charging load to off-peak hours with a lower electricity price to cut down the cost, and the reduced power loss further minimized the objective function.
To calculate the charging plan for each EV, the capacity of the charging station fixed by the optimal configuration restricted the maximal charging power at each bus. The overall charging power during the parking period was allocated to each individual EV by the EV aggregator at a charging station. The charging plans for EV type I in uncontrolled and controlled cases are compared in Figure 8a, and the corresponding SOC curves for all EVs of type I are depicted in Figure 8b. The charging plans of EVs connected at different buses are shown in Figure 9, in which the charging profiles of two types of EVs served at the charging station connected to node-31 phase-C and node-107 phase-B are illustrated. The slow charging of type III and IV needed several hours to reach the target SOC, while the fast charging for type I and II can be finished within an hour if the parking period of the vehicle was limited. The charging rate of each individual EV at both fast charging and slow charging facilities was coordinated to enhance the economic and reliable operation of power system, without breaking the boundaries on service capacity of facilities and EV mobile needs described in Section 2 and Section 3. It can be seen that EVs of different types reached the desired SOC before departure even though the charging power profile varied according to the solution given by optimal charging algorithm.

6. Conclusions

To evaluate the impact of charging stations changed from gas stations in the oil-to-electricity transformation for automobiles, a mapping relation model between gas stations and charging stations serving vehicles in the same region was established by using membership degree function of EV and queuing model-based charging stations. A novel feature of the proposed EV charging stations was that the real-time data of gas stations and parking lots serving the regional automobiles was used to determine the stochastic EV charging time and charging demand distribution in the power network. Therefore, the controllability of EV charging load can be quantified by integrating the EV charging process with parameters and control variables in the optimal dispatch of the distribution network. With the defined boundaries and power system constraints, a combined optimization of configuration and operation of EV charging stations was developed for reducing the operating cost and risks of power system. A two-stage hybrid optimization algorithm composed of master problem and sub-problem was proposed to reduce the complexity of the combined optimization problem. The optimal setting of charging stations and the optimal charging created for each EV can improve the economic and reliable operation of the power system with flexible EV charging load. The proposed method can serve as an effective tool for evaluating the increased EV charging load and the controllability of charging stations in the oil-to-electricity transformation for automobiles across the town.

Author Contributions

Methodology and writing—original draft preparation, S.G.; writing—review and editing, J.W.; project administration, B.X.

Funding

This research was partially funded by the National Key R&D Program of China (2016YFB0900400), and the National Nature Science Foundation of China (51707130).

Acknowledgments

This research was partially supported by the International Clean Energy Talent Programme (iCET). The three-month training in Sweden improved the research work in the paper and contributed to the data collection for modeling the regional gas station and parking lots from their online service websites and electronic map.

Conflicts of Interest

The authors declare no conflict of interest. The funders had no role in the design of the study; in the collection, analyses, or interpretation of data; in the writing of the manuscript, or in the decision to publish the results.

Appendix A. Detailed Modeling of Parking Lots Based on Queuing Theory

This section presents the modeling of parking lots as a M/M/Z/Z queuing system [7,8]. The variation of the parked vehicles given the data accessible online can be expressed by:
N k ( t ) = L s k ( t ) = L b k + N c k ( t ) k M
N c ( t ) ¯ = L s ( t ) ¯ L b ¯
N b k ( t + 1 ) = N b k ( t ) + Δ N b k ( t + 1 ) , Δ N b ( t + 1 ) = 0 t T
N c k ( t + 1 ) = N c k ( t ) + Δ N c k ( t + 1 ) , N c ( 0 ) = 0 t T
Δ N b k ( t ) = N i n b k ( t ) N o u t b k ( t )
Δ N c k ( t ) = N i n c k ( t ) N o u t c k ( t )
where L b k is the expected number of the basic EV fleet, which is also the queuing length in the steady state, and N c k is the number of categorized EV fleet, which is varying over the time according to the arrival intensity.
The total number of both EV fleet can be read from the online data, but the arrival number of EVs at each time needs to be calculated. According to queuing theory, the arrival of EVs at parking lots is Poisson distribution:
N i n c ( t ) ~ λ c
N i n b ( t ) ~ λ b
where λ b and λ c are the average arrival rate of the basic and categorized EVs respectively. The queuing length L b in the steady state can be calculated by applying the result of queuing theory, the parameters of a M/M/Z/Z queuing system are adopted for parking lots:
λ z = λ b ,   z = 1 , 2 , ,   Z k
μ z = z μ ,   z = 1 , 2 , ,   Z k
where Z k is the capacity of k t h parking lot, and z is the number of EVs at a parking lot. The service time in this case is the parking period, which complies with negative exponent distribution 1 μ in the queuing model.
P 0 = ( i = 0 z k ( z k e ) i i ! ) 1 z = 1 , 2 , ,   Z k
P z = ( z k ρ ) z z ! P 0
ρ = λ b Z k μ
P 0 denotes the probability of no EV at parking, and P z denotes the probability of z EVs at parking. ρ is the service intensity of the parking lot defined by the queuing theory. Consequently, the number of EVs at the parking lot can be written as a function of ρ, and the arrival rate of basic EV fleet can be derived if the queuing length is given.
L b k = z = 0 z k z P z = z k ρ ( 1 P z k )
L b k = L b k ¯
where L b k ¯ is the average number of basic EVs at parking that can be collected from online data.
Similarly, the categorized EV fleet in the queuing model can be quantified by assuming that the arrival rate at each time step is Poisson distribution. The arrival of categorized EVs is concentrated on several hours which can b easily identified from the occupancy variation of the parking lots. As shown in Figure 1, the rising zone is assumed to be arrival period of categorized EV. Therefore, the arrival EV number N i n c k can be calculated from N c k ( 0 ) and N c k ( t ) as shown in Equations (A2)–(A6), and can also be calculated by:
N i n c k ( t ) = N k ( t ) L b k
N i n c k = t = 1 T c N i n c k ( t ) , N i n c k ( t ) ~ λ c k ( t )
N i n c k ( t ) ¯ = λ c k ( t ) · Δ t t [ 0 , T c ]
where N i n c k ( t ) ¯ is the average number of categorized EVs arriving at tth hour, which can be collected from online data as shown in Figure 1. λ c k ( t ) is the Poisson distribution of categorized EVs arriving at tth hour. Tc is the time period of categorized EV arrival. Following the queuing model of each parking lot, the arrival rate of categorized EV fleet at each time step can be derived by:
P ( N i n c k ( t ) = y ) = ( λ t ) y ! e λ t λ = λ c k , y = 0 , 1 , 2 ,
N i n k ( t ) = N i n c k ( t ) + N i n b k ( t )
N i n k is total number of EVs parked at kth parking lot within T c hours, and N i n k ( t ) is the number of EVs arriving at kth parking lot during each time interval. As described above, it is composed of two portions. N i n b k ( t ) denotes the number of basic EVs arriving at kth parking lot at tth hour, and N i n c k ( t ) denotes the number of categorized EVs arriving at kth parking lot at tth hour. Based on the queuing theory, the number of EVs arriving at each time step is given by:
E ( N i n c k ( t ) ) = y = 0 y · ( λ t ) k k ! e λ t = λ c k ( t ) · Δ t
λ c k ( t ) = N i n c k ( t ) ¯ Δ t = Δ N c k ( t ) ¯ Δ t
where Δ N c k ( t ) is the difference of categorized EV number at t t h hour that can be read from the online data shown in Figure 1.
The membership degree of each individual EV to parking lot is correlated with the parking period in the queuing theory:
α i k · T = τ i , τ i ~ 1 μ
where τi is the parking period of ith EV at one parking lot. The service time complies with negative exponential distribution:
P ( τ i t ) = { 1 e μ t t 0 0 t < 0
E ( τ i ) = + 0 μ + e μ t d t = 1 μ
1 μ = α i k ¯ · T = τ i ¯
where τ i ¯ is the average EV parking period that can be collected from online data. As all the other parameters are calculated, the arrival and the duration of EVs at the parking lot can be completely quantified.

References

  1. Tang, W.; Bi, S.; Zhang, Y.J. Online charging scheduling algorithms of electric vehicles in smart grid: An overview. IEEE Commun. Mag. 2016, 54, 76–83. [Google Scholar] [CrossRef]
  2. Bloomberg New Energy Finance. Electric Vehicle Outlook 2017. July 2017. Available online: https://data.bloomberglp.com/bnef/ (accessed on 10 March 2019).
  3. Farid, A.M. A hybrid dynamic system model for multimodal transportation electrification. IEEE Trans. Control Syst. Technol. 2017, 25, 940–951. [Google Scholar] [CrossRef]
  4. Farzin, H.; Moeini-Aghtaie, M.; Fotuhi-Firuzabad, M. Reliability studies of distribution systems integrated with electric vehicles under battery-exchange mode. IEEE Trans. Power Deliv. 2016, 31, 2473–2482. [Google Scholar] [CrossRef]
  5. Ying, Z.M.; Wu, X.; Yang, W. Carbon emission benefit accounting of Hangzhou bus oil-to-electricity project. Acta Ecol. Sin. 2018, 38, 6452–6464. [Google Scholar]
  6. Krishna, K.M.; Pandey, N.K.; Thimmalapura, S. Break-even analysis and economic viability of powertrain electrification—An analytical approach. In Proceedings of the IEEE Transportation Electrification Conference, Pune, India, 13–15 December 2017. [Google Scholar]
  7. Shaaban, M.F.; Atwa, Y.M.; El-Saadany, E.F. PEVs modeling and impacts mitigation in distribution networks. IEEE Trans. Power Syst. 2013, 28, 1122–1131. [Google Scholar] [CrossRef]
  8. Shojaabadi, S.; Abapour, S.; Abapour, M. Optimal planning of plut-in hybrid electric vehicle charging station in distribution network considering demand response programs and uncertainties. IET Gener. Trans. Distrib. 2016, 10, 3330–33340. [Google Scholar] [CrossRef]
  9. Gong, Q.; Midlam-Mohler, S.; Serra, E.; Marano, V. PEV charging control for a parking lot based on queuing theory. In Proceedings of the American Control Conference, Washington, DC, USA, 17–19 June 2013; pp. 1124–1129. [Google Scholar]
  10. Chukwu, U.C.; Mahajan, S.M. V2G parking lot with PV rooftop for capacity enhancement of a distribution system. IEEE Trans. Sustain. Energy 2014, 5, 119–127. [Google Scholar] [CrossRef]
  11. Bae, S.; Kwasinski, A. Spatial and temporal model of electric vehicle charging demand. IEEE Trans. Smart Grid 2012, 3, 3394–3403. [Google Scholar]
  12. Albarbi, W.; Bhattacharya, K. Electric vehicle charging facility as a smart energy microhub. IEEE Trans. Sustain. Energy 2017, 8, 616–628. [Google Scholar]
  13. Ko, K.S.; Han, S.; Sung, D.K. Performance-Based settlement of frequency regulation for electric vehicle aggregators. IEEE Trans. Smart Grid 2018, 9, 866–875. [Google Scholar] [CrossRef]
  14. Wenzel, G.; Negrete-Pincetic, M.; Olivares, D.E. Real-Time charging strategies for an electric vehicle aggregator to provide ancillary services. IEEE Trans. Smart Grid 2018, 9, 5141–5151. [Google Scholar] [CrossRef]
  15. Vagropoulos, S.I.; Balaskas, G.A.; Bakirtzis, A.G. An investigation of plug-In electric vehicle charging impact on power systems scheduling and energy costs. IEEE Trans. Power Syst. 2017, 32, 1902–1912. [Google Scholar] [CrossRef]
  16. DeForest, N.; MacDonald, J.S.; Black, D.R. Day ahead optimization of an electric vehicle fleet providing ancillary services in the Los Angeles Air Force Base vehicle-to-grid demonstration. Appl. Energy 2018, 210, 987–1001. [Google Scholar] [CrossRef]
  17. Bessa, R.J.; Matos, M.A. Optimization models for EV aggregator participation in a manual reserve market. IEEE Trans. Power Syst. 2013, 28, 3085–3095. [Google Scholar] [CrossRef]
  18. Wei, W.; Liu, F.; Mei, S. Charging strategies of EV aggregator under renewable generation and congestion: A normalized Nash equilibrium approach. IEEE Trans. Smart Grid 2016, 7, 1630–1641. [Google Scholar] [CrossRef]
  19. Shafie-khah, M.; Heydarian-Forushani, E.; Golshan, M.E.H. Optimal trading of plug-in electric vehicle aggregation agents in a market environment for sustainability. Appl. Energy 2016, 162, 601–612. [Google Scholar] [CrossRef]
  20. Ko, K.S.; Sung, D.K. The effect of EV aggregators with time-varying delays on the stability of a load frequency control system. IEEE Trans. Power Syst. 2018, 33, 669–680. [Google Scholar] [CrossRef]
  21. Li, W.J.; Tan, X.; Sun, B. Optimal power dispatch of a centralised electric vehicle battery charging station with renewables. IET Commun. 2018, 12, 579–585. [Google Scholar]
  22. Perez-Diaz, A.; Gerding, E.; McGroarty, F. Coordination and payment mechanisms for electric vehicle aggregators. Appl. Energy 2018, 212, 185–195. [Google Scholar] [CrossRef]
  23. Floch, C.L.; Kara, E.C.; Moura, S. PDE modeling and control of electric vehicle fleets for ancillary services: A discrete charging case. IEEE Trans. Smart Grid 2018, 9, 573–581. [Google Scholar] [CrossRef]
  24. Liu, Z.; Wen, F.; Ledwich, G. Optimal planning of electric-vehicle changing stations in distribution systems. IEEE Trans. Power Deliv. 2013, 28, 102–110. [Google Scholar] [CrossRef]
  25. Mosadeghy, M.; Yan, R.; Saha, T.K. A time-dependent approach to evaluate capacity value of wind and solar PV generation. IEEE Trans. Sustain. Energy 2016, 7, 129–138. [Google Scholar] [CrossRef]
Figure 1. Modeling of the electric vehicle (EV) charging facilities changed from gas stations based on online data analysis.
Energies 12 01577 g001
Figure 2. Flowchart of the proposed optimal control algorithm for EV charging facilities.
Energies 12 01577 g002
Figure 3. EV charging facilities integrated into the 123-bus distribution network.
Energies 12 01577 g003
Figure 4. Power load profiles in the distribution network with renewable energy sources: (a) Load profiles of 123-bus power network; (b) EV charging load with and without control.
Energies 12 01577 g004
Figure 5. Power losses of distribution network with EV charging load: (a) Daily profile of total losses with and without EV charging control; (b) line losses of 123-bus power network at the peak hour.
Energies 12 01577 g005
Figure 6. Bus voltage of the 123-bus test system with and without EV charging control.
Energies 12 01577 g006
Figure 7. Load and voltage profiles at bus 31 phase-C and bus 107 phase-B: (a) Load profiles at different buses; (b) voltage profiles at different buses with and without EV charging control.
Energies 12 01577 g007
Figure 8. Charging rate and state of charge (SOC) profiles of EV type I at fast charging facilities with and without control: (a) EV charging curves (Tesla Model X); (b) SOC curves during the parking period.
Energies 12 01577 g008
Figure 9. Charging profiles of EVs connected to facilities at different buses: (a) Charging profiles of EV type-I and type-II parked at bus 31; (b) charging profiles of EV type-III and type-IV parked at bus 107.
Energies 12 01577 g009
Table 1. Simulation parameters for EV type and EV charging infrastructure.
EV TypeCharging Power (kW)Battery Capacity (kWh)Target Stage of Charge (SOC) (%)No. of EVsDistance per Charge (km)
Fast ChargingI: Tesla Model X136090–9560355
II: BMW i3442290–9560160
Slow ChargingIII: Chevrolet VOLT2.213.290–9515080
IV: Changan EADO3.753090–95150200
Table 2. Optimal configuration of EV charging stations.
Bus no./
Type of Parking
PhasePower Level of Charging StationRatio of Charging Station CapacitiesEV
Types
Ratio of EV Types (%)
1/ComplexAFast + Slow charging33%I/II/III/IV14/14/36/36
31/OfficeCFast charging13%I/II50/50
39/OfficeBFast charging38%I/II50/50
87/HomeBSlow charging6%III/IV50/50
107/HomeBSlow charging10%III/IV50/50