Article

Integration of Hydrothermal Carbonisation with Anaerobic Digestion; Opportunities for Valorisation of Digestate

Centre for Integrated Energy Research, School of Chemical and Process Engineering, University of Leeds, Leeds LS2 9JT, UK
*
Author to whom correspondence should be addressed.
Energies 2019, 12(9), 1586; https://doi.org/10.3390/en12091586
Submission received: 25 March 2019 / Revised: 19 April 2019 / Accepted: 23 April 2019 / Published: 26 April 2019

Abstract

:
Hydrothermal carbonisation (HTC) has been identified as a potential route for digestate enhancement producing a solid hydrochar and a process water rich in organic carbon. This study compares the treatment of four dissimilar digestates from anaerobic digestion (AD) of agricultural residue (AGR); sewage sludge (SS); residual municipal solid waste (MSW), and vegetable, garden, and fruit waste (VGF). HTC experiments were performed at 150, 200 and 250 °C for 1 h using 10%, 20%, and 30% solid loadings of a fixed water mass. The effect of temperature and solid loading to the properties of biocoal and biochemical methane potential (BMP) of process waters are investigated. Results show that the behaviour of digestate during HTC is feedstock dependent and the hydrochar produced is a poor-quality solid fuel. The AGR digestate produced the greatest higher heating value (HHV) of 24 MJ/kg, however its biocoal properties are poor due to slagging and fouling propensities. The SS digestate process water produced the highest amount of biogas at 200 °C and 30% solid loading. This study concludes that solely treating digestate via HTC enhances biogas production and that hydrochar be investigated for its use as a soil amender.

1. Introduction

The key to realising the potential of biomass resource lies in the integration of processes, and maximising outputs to create the sustainable production of bioenergy and bio-products. The biorefinery concept integrates two or more biomass conversion processes to provide increased system efficiency, greater yields of products, and multiple energy vectors. Integration of biological and thermochemical biomass conversion processes (i.e., a hybrid energy system), can provide improved material management, the production of different bioenergy vectors, and value-added products.
Organic waste treated by anaerobic digestion (AD) has doubled since 2009 with 145 plants in the non-sewage sludge sector, treating around 11 million wet tonnes of organic waste annually [1]. The increase in plants is largely due to financial incentives that were available for AD operators to encourage renewable electricity, heat, and transport fuel generation through the feed-in tariff (FIT), renewable heat incentive (RHI), and renewables transport fuel obligation (RTFO). However, a number of barriers are emerging with the expansion of this technology. These include operational and policy facets such as shrinking gate fees for raw materials, increased costs for digestate recycling, uncertainty about the long-term sustainability of recycling digestate to land and availability of financial incentives.
Digestate is typically used within agriculture and horticulture as a fertiliser to close nutrient cycles. The uncertainty of recycling digestate to land has resulted from the introduction of British Standards Institution (BSI) Publicly Available Specification (PAS) 110 [2], which describes a set of standards intended to ensure that digestate complies with end of waste criteria, has a minimum quality and is fit for purpose to be applied as a fertiliser. Digestate that is not able to meet this specification generates additional operational expenses (OPEX) through the costs of haulage, spreading, and disposal fees, creating material management challenges.
As a result, there is a growing need to explore alternative digestate markets and land recycling, with emphasis on digestate enhancement technologies capable of adding value to the whole digestion process. Transforming digestate into carbonaceous solid and liquid fractions using technologies such as pyrolysis [3,4,5,6,7,8,9,10] and hydrothermal carbonisation (HTC) [11,12,13] are now under investigation. The main barriers for industrial uptake of pyrolysis include the requirement for feedstocks to have low moisture content (10% or less) to reduce negative effects of stability, viscosity, pH, and corrosiveness of the pyrolysis liquids [14]; unfavourable energy balances (i.e., high OPEX due to energy consumption for initial feedstock preparation and drying, including high operating temperatures in addition to heat loss and maintenance) [15,16]; controlling the emissions from pyrolysis processes [17]; issues of treatment, upgradability and utilisation of pyrolysis liquids [18,19]. However, most of these issues arise from the source of feedstock used for processing [20]. The pyrolysis of digestate has been studied extensively, however high ash and high nitrogen contents typical of the feedstock results in high ash pyrolysis chars (pyrochar) [3,4,21] and pyrolysis liquids high in heterocyclic nitrogen [7,22,23], which are likely to be problematic in application. While some studies show that pyrochar from anaerobically digested sewage sludge contain high levels of mineral matter and plant nutrients [24,25], there is uncertainty with other digestate pyrochars as to whether they are readily or crop available (i.e., bioavailable), when added to soils [3]. There are also uncertainties regarding the eco-toxicity of digestate derived pyrolysis liquids [26], including pyrochar and hydrochar [27,28]. Pilot scale investigations of low temperature gasification of anaerobically digested materials also produce solids with high nutrient content [29,30] which have better energy recoveries. However the char is also enriched with high levels of ash [31] and potentially contain enriched levels of contaminants, including polycyclic aromatic hydrocarbons (PAH), making its application challenging, especially with feedstocks with high moisture content [32].
Hydrothermal carbonisation is an alternative approach for converting high moisture content feedstocks into hydrochar, a “coal like” bio-coal. It is gaining interest for the treatment of waste biomass and is being explored as a dewatering approach for sewage sludges [33,34,35]. HTC typically results in energy densification due to deoxygenation, resulting in a bio-coal with a higher calorific value to the starting material [36]. This can typically increase the higher heating value (HHV) on a dry basis from around 15–17 MJ/kg for the starting biomass to an energy densification up to 1.5 [37,38], and as high as 30 MJ/kg for the bio-coal [39,40,41]. Demineralisation also occurs, improving the ash chemistry of the bio-coal which reduces the propensity for slagging and fouling during combustion for greater boiler performance [38,41,42]. The bio-coal also has an increased hydrophobicity which enhances dewatering and is highly friable, therefore it can be ground more easily than the starting biomass, potentially improving its handling properties [43]. Hydrochar, the bio-coal from HTC, has been shown to have improved combustion properties compared to its pyrochar equivalent [28,44], largely due to its reduced mineral content.
HTC is therefore a potential route for digestate enhancement, although energy densification is not always observed with all feedstocks. Sewage sludge for instance generally results in a low calorific value (CV) bio-coal, whereas feedstocks containing higher lignin content generally produce a higher CV bio-coal [45]. Solubilisation of organic material into the water phase creates an opportunity for recycling of the process waters back into anaerobic digestion, potentially increasing biogas yields. The process waters from HTC are rich in dissolved organics and can facilitate nutrient and chemical recovery [36,46,47]. The key challenges include overcoming inhibition and ensuring that the levels of compounds such as volatile fatty acids (VFA) and ammonium are not exceeded. Lower temperature hydrothermal process waters typically have higher biodegradability than higher temperature process waters [48,49,50]. An assessment of experimental biochemical methane potential (BMP) has been performed by many, although the majority of studies have focused on sewage sludge [51,52,53,54,55,56,57], only limited studies are available for digestate from other feedstocks [48,58,59,60] and there is an absence of BMP studies for process waters from woody or lignocellulosic biomass. There are potential benefits for blending digestate with other feedstocks containing lignocellulosic biomass as this may increase the calorific value of the resulting hydrochar and allow more recalcitrant biomass to be treated for biogas generation.
This investigation seeks to identify the potential for the integration of HTC with AD to treat and valorise four types of digestate of variable composition from the anaerobic digestion of different types of waste. The objectives are to understand the effect of the composition of digestate and the HTC process conditions, such as solid loading and temperature, on product yields, product composition, and properties of the hydrochar and process water. Furthermore, to understand how the hydrochar composition effects its application as a solid fuel and how the process water composition effects its biochemical methane potential. Results from this study will be used to provide further recommendations toward a technical feasibility of the integration of HTC with AD.

2. Materials and Methods

2.1. Source and Preparation of Materials

Supply of dewatered digestate samples were received from Organic Waste Systems (OWS), Belgium and Yorkshire Water, UK. These samples were collected following anaerobic digestion of four different waste streams: (i) agricultural residue (AGR) comprised of mainly maize (>80%) with fractions of whole plant and grass silage together with manure, (ii) residual organic fraction of municipal solid waste (MSW) after mechanical separation, (iii) sewage sludge (SS) comprised of pre-treated primary and secondary biosolids and lastly, (iv) source separated organic household waste comprised of vegetable, garden and fruit (VGF) material.
The AGR, MSW, and VGF digestates were produced at thermophilic conditions using a laboratory scale test digestion facility simulating a full-scale dry anaerobic composting (DRANCO) processing plant, with a loading rate of 15, 8, and 7 kg VS/m3/day and a residence time of 30, 45, and 25 days, respectively. The SS digestate was collected from a waste water treatment plant with a commercial scale AD facility (Dewsbury, UK), and pre-treatment to AD was applied via thermal hydrolysis operating at 160 °C and 6 bar. The AGR and MSW digestate were air dried at 52 °C without fractionation, with the exception of VGF, which was dewatered in a screw press to increase the total solid (TS) concentration to 40%. The SS digestate was dewatered to increase the TS concentration to 15%–20%, thereafter the material was oven dried at 60 °C. Digestate samples were milled to reduce particle size to less than 2 cm in diameter.

2.2. Hydrothermal Carbonisation

Hydrothermal reactions were performed in a 600-mL stainless steel Parr 4836 bench-top reactor (Parr, Moline, IL, USA) at 150, 200, and 250 °C holding temperatures. Three masses of 20, 40, and 60 g of dry digestate material were mixed with a constant capacity of 200 mL of deionised water, to achieve 10%, 20%, and 30% of the water loading mass, referred to as solid loadings herein.
Reactions were performed in quartz silica internal vessels, allowing accurate material balance measurements. The final hold temperature was retained for 1 h, thereafter the reactor was removed from the heater and allowed to air cool within a vented fume cupboard. Once the reactor reached ambient air temperature, gasses were vented and the liquid and solid products were separated using a vacuum filter using 150 mm Grade 1 qualitative circles (1001–150, Whatman, Cambridge, UK).
The solid product was air dried and then oven dried at 60 °C for 48 h. Yield data assumes 100% dewatering capability of the hydrochar and gas yields are assumed by difference using the total input and output masses.

2.3. Feedstock and Hydrochar Analysis

Solid materials for chemical analysis were air dried and homogenised in a grinder (Jaw Crusher BB 200, Retsch, Haan, Germany). Particles were ground and sieved through 100 μm apertures until homogenous. The equipment was thoroughly cleaned between each use to avoid contamination.

2.3.1. Protein, Proximate, and Ultimate Analysis and Predictive Higher Heating Value (HHV)

The overall protein concentration of the digestate was determined using the Kjeldahl method. The proximate analysis of the solid materials was determined using a thermo-gravimetric analyser (TGA/DSC 1, Mettler Toledo GmbH, Greifensee, Switzerland). Carbon, hydrogen, nitrogen, sulphur, and oxygen content were analysed using an Elemental Analyser (Flash 2000, Thermo Scientific, Waltham, USA). The instrument was calibrated and checked using calibration standards and certified biomass reference materials (Elemental Microanalysis, Devon, UK). The oxygen content of the biomass and hydrochar was calculated by difference.
Predictive HHVs (kJ/kg) were calculated using ultimate analysis in Equation (1) according to an approximation given by Friedl et al. [61] for biomass fuels with an estimated standard error of ±337 kJ/kg. Values are presented as dry basis (db) with hydrogen corrected for moisture content.
HHV = 3.55 C 2 232 C 2230 H + 51.2 C × H + 131 N + 20,600

2.3.2. Metal and Inorganics Analysis

Solid materials were ashed and then formed into fused glass discs before analysis by X-ray fluorescence (XRF) spectroscopy. Ashing was performed in an electric furnace at a temperature of 550 °C for 2 h, then removed and mixed to allow homogeneity. The samples were then further heated to 850 °C and sustained for a further 2 h to reduce potassium devolatilisation, as described in [62]. The resulting ashes were placed into a desiccator, ground by pestle and mortar, and subsequently sieved using a 106 μm aperture.
The fused glass discs consisted of 0.7 g of ash sample and 6.3 g of flux, which were mixed and fused at a temperature of 1100 °C using an electric fluxer (Katana K1 Prime, Quebec, Canada). The samples were then analysed using an X-ray florescence spectrometer (ARL PERFORM’X, Thermo Scientific, Waltham, USA).

2.3.3. Predictive Slagging and Fouling Indices

To predict the likelihood of slagging and fouling behaviour during combustion, various indices have been derived based on the chemical composition of the fuels. The predictive slagging and fouling indices, equations, and interpretation for the alkali index (AI), bed agglomeration index (BAI), acid base ratio (Rba), slagging index (SI), fouling index (FI), and slag viscosity index (SVI) are listed in Table 1, as described by Smith et al. [42].

2.4. Process Water Analysis

The carbon content of the process water was analysed using a total organic carbon (TOC) analyser (IL 550, Hach Lange GmbH, Düsseldorf, Germany). Chemical oxygen demand (COD), phenols, and total nitrogen (TN) were determined by cuvette test kits (LCK014, LCK338, and LCK345), in combination with a visible spectrophotometer that averages 10-fold absorbance readings (DR3900, Hach Lange GmbH, Düsseldorf, Germany). Total volatile fatty acids (VFA) were determined in the process water directly after filtration using a 0.2 µm syringe filter by a gas chromatograph (GC) (5890 Series II, Hewlett Packard, CA, USA) fitted with a flame ionisation detector (FID) and a wall coated open tubular (WCOT) capillary fused silica column (25 m × 0.32 mm × 0.44 mm; Nordion, Helsinki, FL). Helium was used as a carrier gas, with a flow of 60 mL/min.

2.5. Experimental Biochemical Methane Potential (BMPexp)

Experimental BMP tests were conducted using a multichannel analyser comprised of reactors, flow cells, and a data acquisition system (AMPTS II, Bioprocess Control, Lund, Sweden). This system consists of 15 glass bottles with stirrers, a carbon dioxide (CO2) capturing unit with pH indicator containing 3 M sodium hydroxide solution and 0.4% thymolphthalein, and a gas flow meter which automatically converts to standard temperature and pressure (0 °C and 100 kPa).
Bottles were loaded with process water samples at 2 g COD in 200 mL of distilled water to give a concentration of 10 g COD/L and 200 mL of inoculum at a volatile solids (VS) concentration of 10 g VS/L, achieving a volumetric ratio of 1:1 of inoculum to substrate, according to guidelines for the standardisation of biomethane potential tests [63]. Inoculum was obtained one month prior to use from the outlet of an anaerobic reactor for sludge digestion at Yorkshire Water’s Esholt WWTW in Bradford, UK and stored refrigerated at 4 °C to allow for exhausting any endogenous methane production. All tests were carried out under mesophilic conditions (37 ± 1 °C) for 15 days and stirred for 60 s every 600 s at 60 rpm. Prior to incubation all bottles were flushed with nitrogen for 20 s. Data was recorded by the AMPTS II software and transferred onto Microsoft Excel for data analysis.

2.6. Assessment of Error and Statistical Analysis

Hydrothermal carbonisation experiments were performed in duplicate and the repeatability in solid yields was typically ±3 wt. %. All analyses of product streams were performed in duplicate. Average values are reported together with standard error in tables and figures. In addition, analysis using TOC was based on multiple sample injections until a maximum standard deviation of ±2% was achieved. Experimental BMP tests were also performed in duplicate with positive and inoculum controls.

3. Results

3.1. Feedstock Characterisation

Table 2 lists the calorific value, proximate, protein, inorganic, and ultimate analysis of the dewatered digestate samples. The digestate samples contain high levels of ash, ranging from 40–55 wt. %. The exception was the AGR digestate which had a lower ash content of 16 wt. % and a corresponding higher carbon content. The calorific value of the dewatered digestates range from 15 to 17 MJ/kg, with the lower ash content AGR having the higher calorific value. The protein content was highest in the SS digestate (24.3 wt. %) followed by the AGR digestate (17.7 wt. %), then VGR (9.8 wt. %), and MSW (6.8 wt. %).
Differential thermogravimetric (DTG) curves obtained from TGA data highlights the biochemical composition of the digestates (Supplementary Figure S1). The DTG curves show that the AGR digestate had the highest lignin content which was reflected in its comparatively high calorific value. The SS digestate was generated from a digester incorporating thermal hydrolysis. Therefore, the carbon content was slightly lower and the ash content was higher than a digestate not incorporating pre-treatment [52]. The metal analysis by XRF shows that the digestate mineral matter is mainly comprised of calcium, iron, and silica. The phosphorus content of the SS and VGF digestate are similar (2.6–2.7 wt. %) whereas the AGR and MSW are lower (1.2 and 0.7 wt. %, respectively).

3.2. Hydrothermal Carbonisation of Digestate

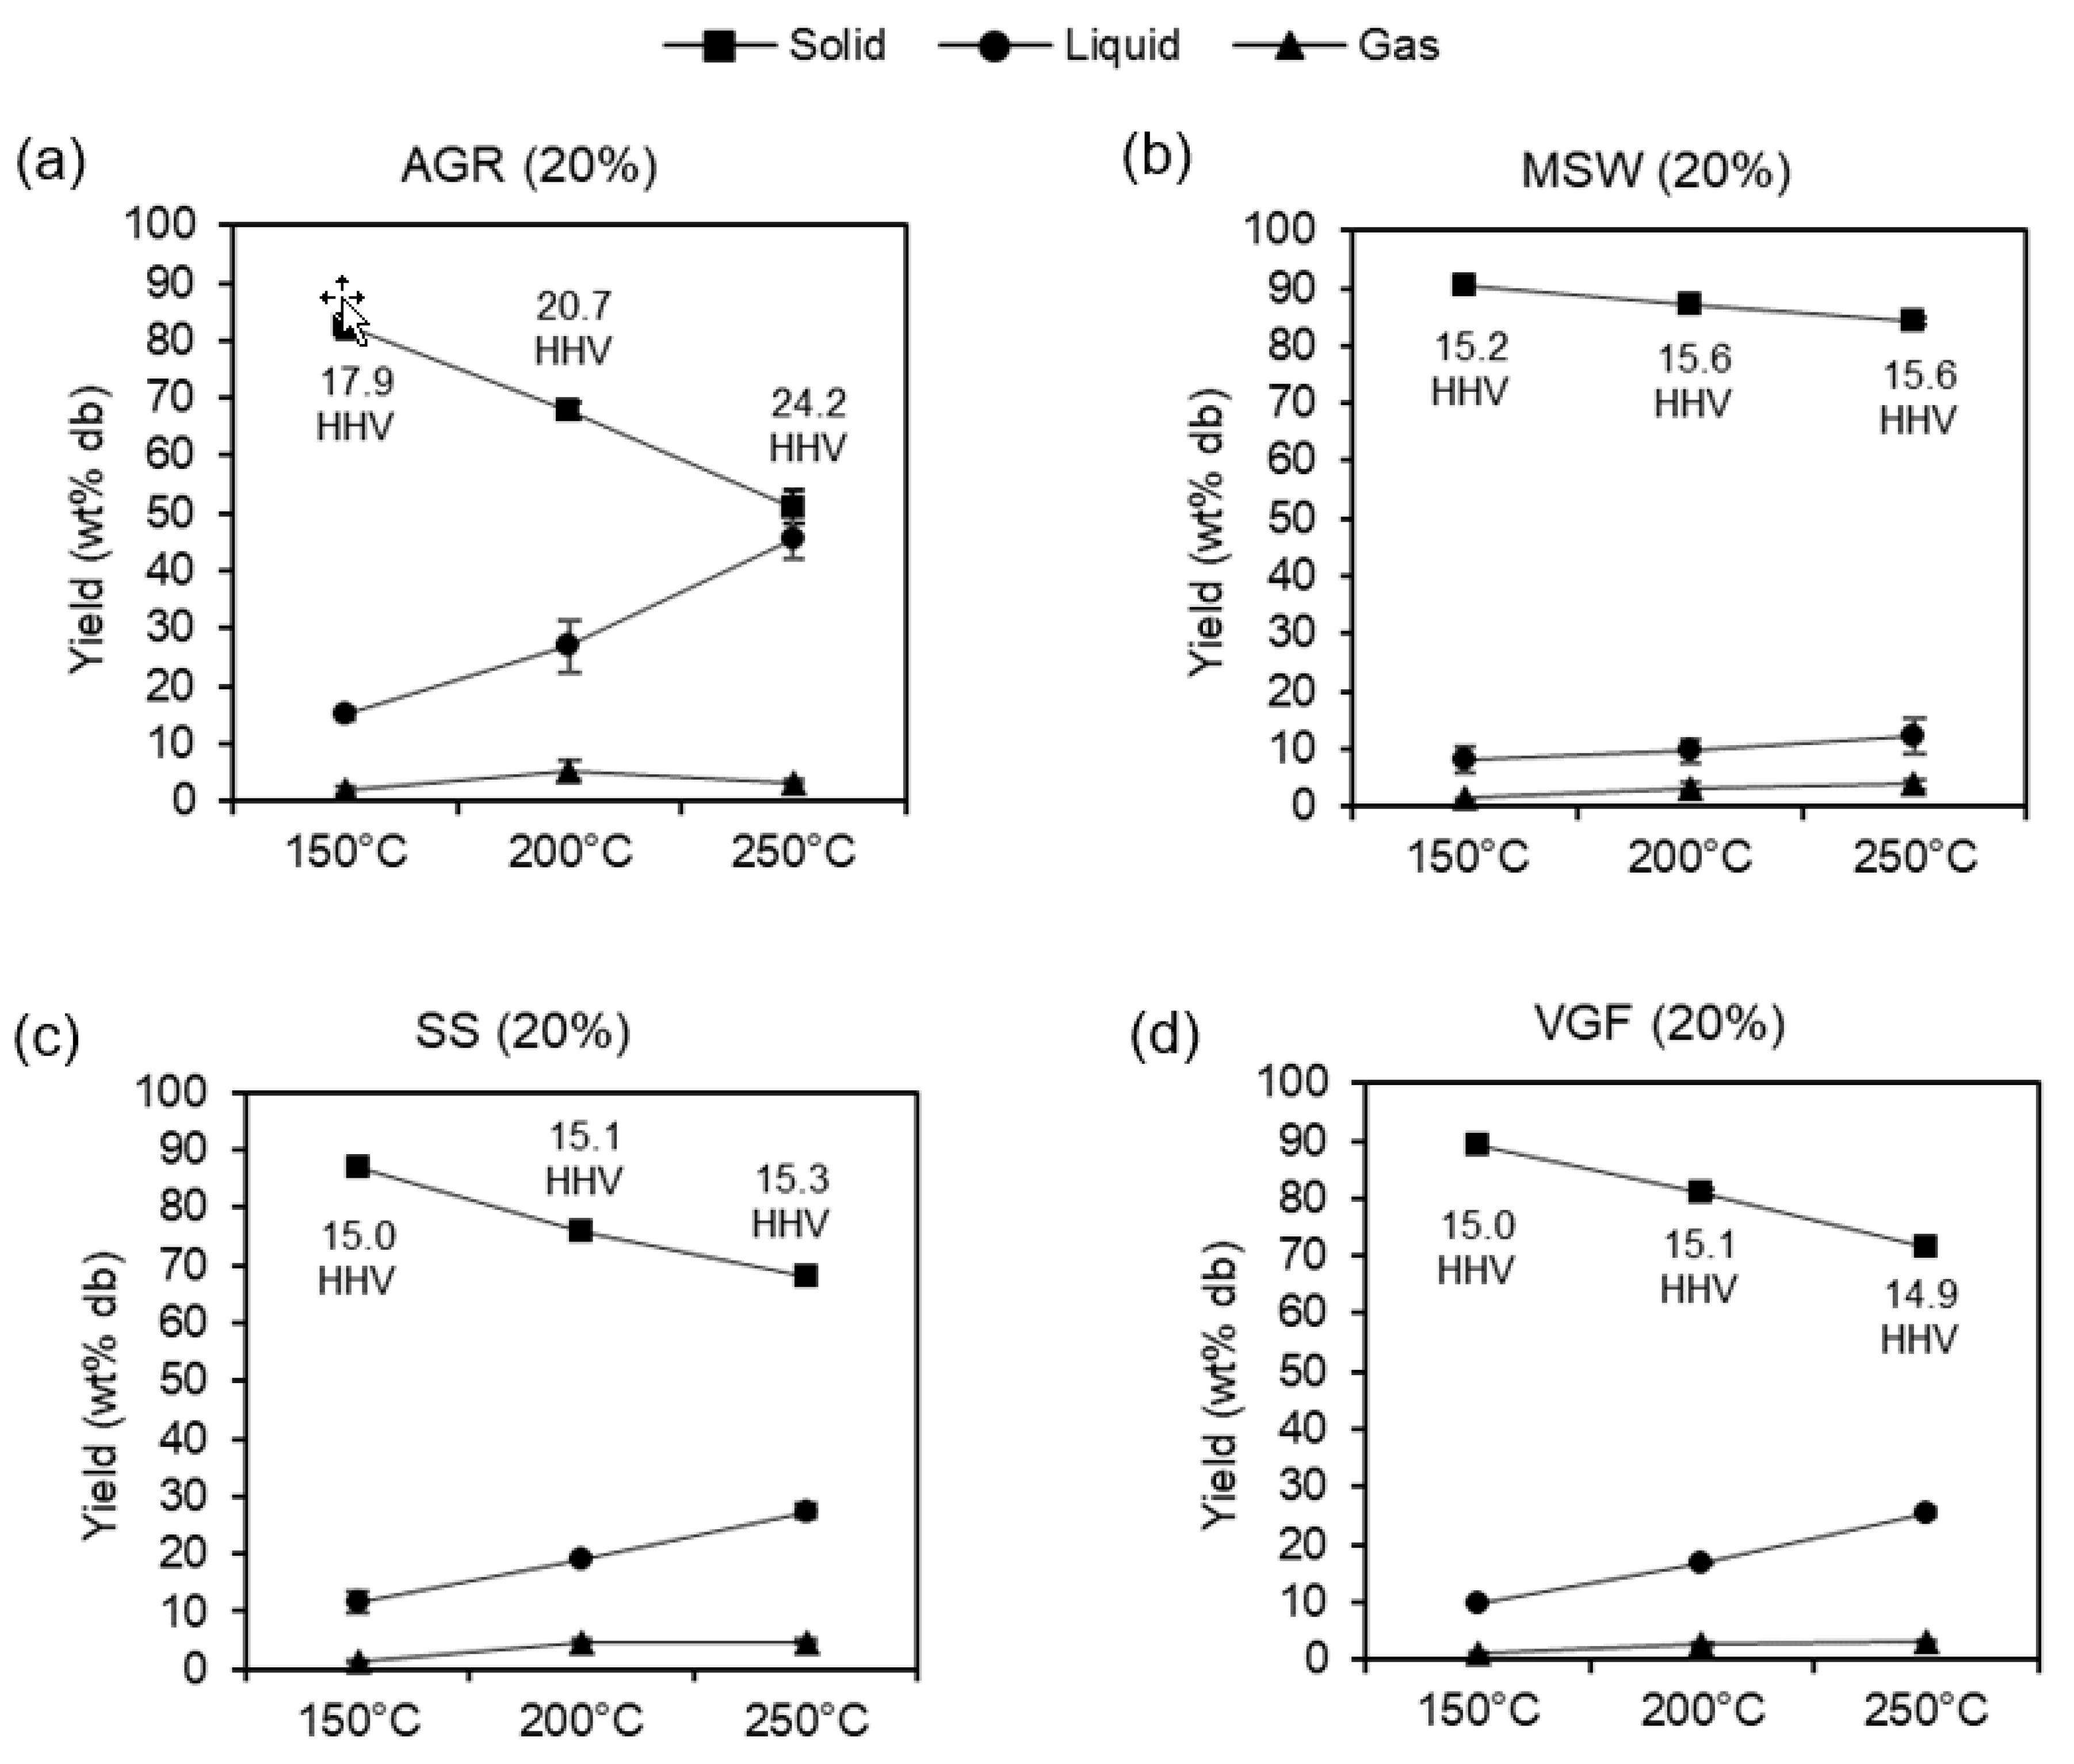
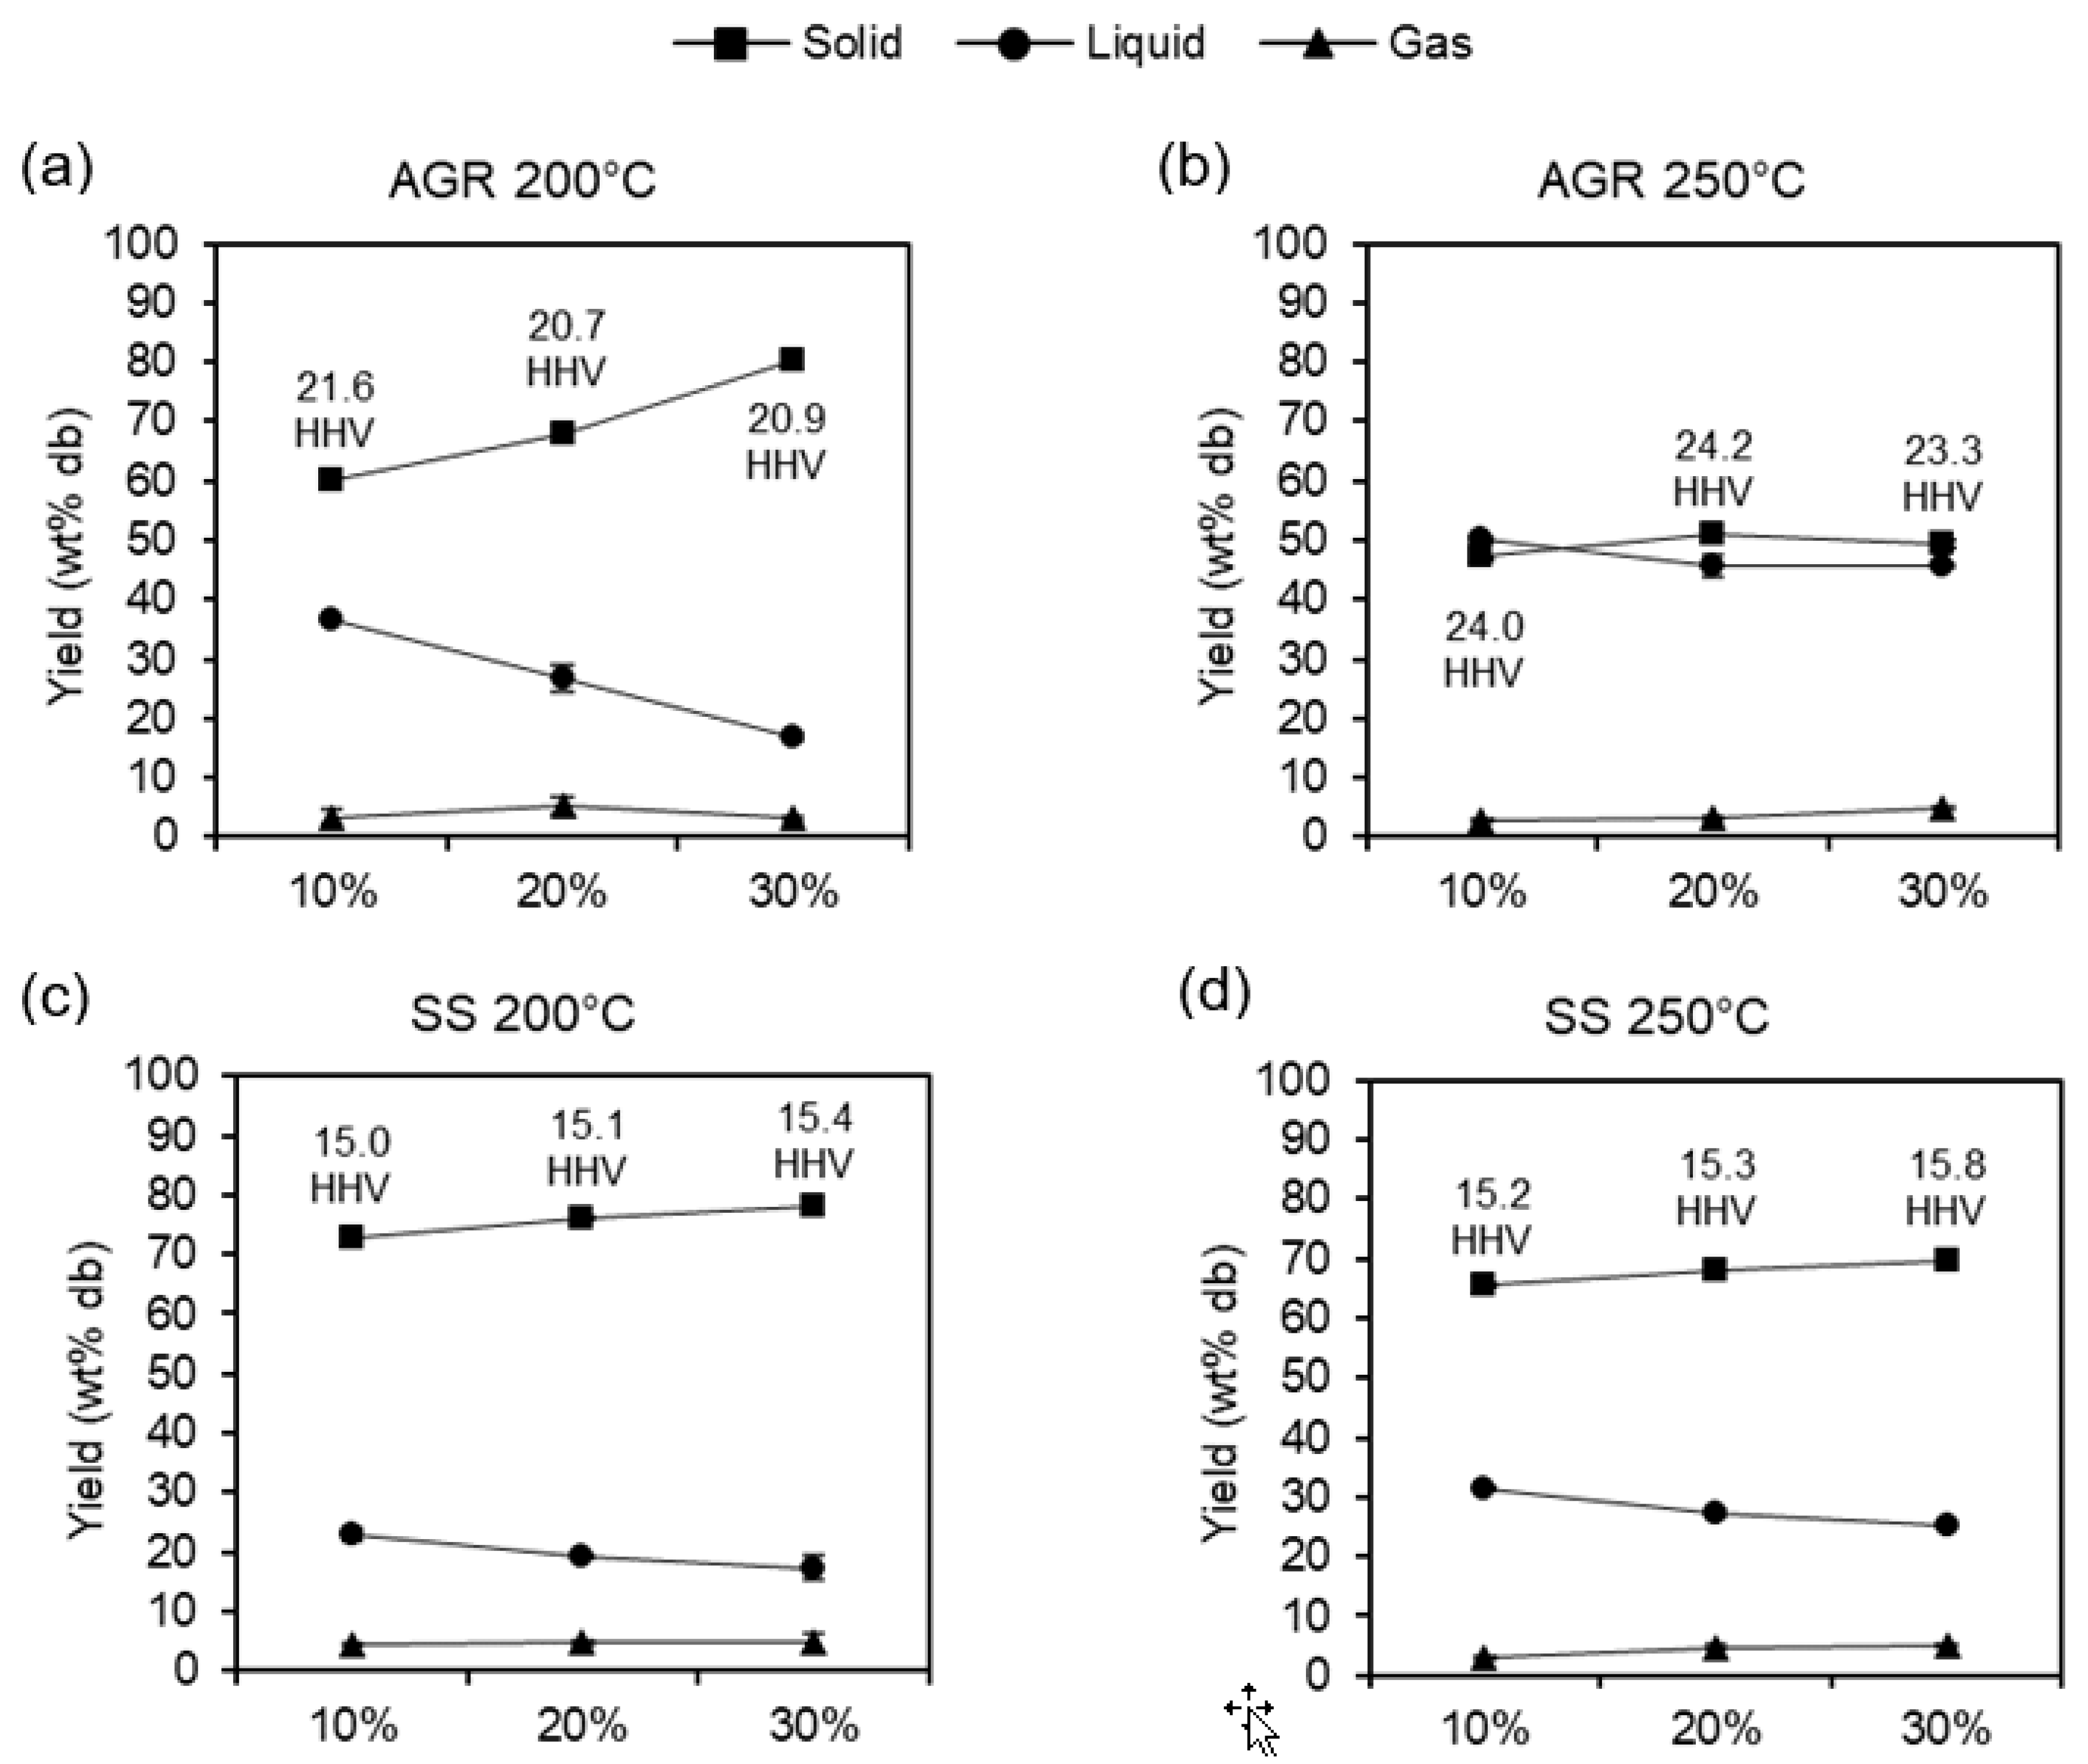
3.2.1. Effects of Temperature and Loading

Figure 1 illustrates the effect of temperature on gaseous, liquid, and solid product yields, including the energy content of the hydrochar. The mass yields of the hydrochar, process water, and gaseous products are also listed in Table S1 in the supplementary information. As the temperature increases, the yield of hydrochar reduces for all the feedstocks, however the most dramatic decrease is seen in Figure 1a for the AGR digestate, which contains the largest lignin content and the lowest ash content. In this case, a significant energy densification is observed from the feedstock at 17.8 MJ/kg to 24.2 MJ/kg at 250 °C. Energy densification is not observed for the other digestate samples, largely due to the high ash content. However, the yields of MSW, SS, and VGF hydrochar are higher, although the carbon contents of the hydrochars are significantly lower than that of AGR (compare 44–57 wt. % for AGR to 24–34 wt. % for all other hydrochars in Table 3).
In the case of the SS digestate, there was a significant increase in water soluble products with increasing temperature, however this was not accompanied by an energy densification in the hydrochar. This agrees with previous reports of the HTC of sewage sludge derived feedstocks, which generally result in an increase in solubilisation, leading to high levels of soluble TOC [52,64,65].
Some sewage sludge products, such as primary sludge and digestate, produced without thermal pre-treatment can produce higher degrees of energy densification, but it is still generally low compared to lignocellulosic derived feedstocks. The VGF digestate produced similar hydrochar yields to the SS digestate, however the hydrochar contained a higher ash content and was more similar to the MSW digestate.
The yields of extractable material from the MSW digestate were the lowest of the four feedstocks corresponding to it starting with the highest ash. Generally, the ash content in the hydrochars increases with temperature, although this trend is less clear for the SS digestate. At a higher temperature treatment, generally the ash content increases as more organic material is solubilised into the water phase.
The increased solubilisation with higher temperature is a result of both solubilisation of the biochemical components and the solubilisation of inorganics. It has been reported that a significant degradation of cellulose occurs between 200 °C and 250 °C, and in lignin between 220 °C and 260 °C [66], which would account for the greater yields achieved at 200 °C compared to 250 °C for AGR and in another study [42]. Protein generally starts to degrade at temperatures above 200 °C [67] and produce high levels of soluble hydrocarbons which begin to polymerise to produce char and oil at 250 °C [68].
Figure 2 illustrates the effect of solid loading on product yields at 200 °C and 250 °C for AGR and SS digestate. The data for MSW and VGF are shown in the supplementary material in Tables S1 and S2. The results show that the effect of solid loading on solubilisation is feedstock dependent. Increasing solid loading lowers the solubility across all feedstock treated resulting in an increase in hydrochar yield. This is more apparent at lower temperatures than at higher temperatures. The greatest reduction in solubility is found with AGR treated at 200 °C. The increase in hydrochar yields is thought to be attributed to the saturation of the process waters and an increase in polymerization.
The increase in solid loading also corresponds to a higher carbon content in the hydrochar and a slight increase in its calorific value (Table 3). The nitrogen content of the hydrochars also increases with solid loading as does the overall ash content of the chars. Generally, increasing the solid loading reduces the volatile matter in the hydrochar with a corresponding increase in fixed carbon. There are subtle differences between the feedstocks but generally the differences in yields are more profound at the lower HTC temperature. The levels of gaseous products remain relatively stable with solid loading.

3.2.2. Hydrochar Combustion Properties

The ultimate and proximate analysis of the hydrochar at 20%, including their respective higher heating value and atomic H:C and O:C ratios are listed in Table 3, and all loading values (10%, 20%, and 30%) are shown in Supplementary Table S2. Elemental composition (CHNSO) shows an increase of carbon and decrease of oxygen content (wt% db) at 150, 200, and 250 °C compared to the raw feedstock. An increase of temperature has shown to favour an increase in carbon content and HHV, which is reflected in the Van Krevelen diagram (Figure 3). The Van Krevelen diagram shows energy densification occurring at higher temperatures and demonstrates that some hydrochars have a similar morphology to that of bituminous and lignite coals. The effect of energy densification is greater with AGR due to its larger lignin content [69]. SS hydrochars carbon content is uniform, therefore there is little benefit to hydrochar quality when processing over 150 °C. Ash content in the hydrochar increases with both higher temperatures and solid loading, resulting in a decrease of inorganic content in the process water.
Table 4 shows the slagging and fouling indices used to evaluate the influence of ash chemistry on combustion behaviour for 20% hydrochars. Major ash forming elements including slagging and fouling values for all the hydrochar can be seen in Supplementary Table S3. The major constituents of inorganic content of the hydrochar are silica and calcium followed by iron. Silica content is increased whilst iron content is decreased following treatment of the digestate material. The effect of higher temperature treatments on inorganic composition is shown to slightly increase phosphorous content within the hydrochar. Meanwhile, potassium has shown to decrease with temperature. There was no discernible effect of solid loading on the inorganic composition.
HTC has shown to be of little advantage in improving ash behaviour of already very high ash feedstocks. No significant reduction has been made to the alkali index, and values remain above 0.34, which means almost certain slagging and fouling. Bed agglomeration index of the hydrochar have reduced in some cases from the starter material, however all remain above 0.15, indicating the likelihood of bed agglomeration as low. Improvements are made to the base to acid ratio (R b/a) from the initial materials, except for MSW. R b/a values are reduced from a medium risk of slagging to a low risk of slagging for SS and VGF. No significant effect of HTC treatment is made to the fouling index (FI). An improvement in the slag viscosity index (SVI) is only seen with hydrochar derived from VGF, changing from high to medium and low slagging inclination.
In summary, hydrochars produced from digestate material have a less than ideal ash chemistry for application in combustion and therefore alternatives should be found for its use. The fuel quality of the hydrochar is low and without co-processing with other lignocellulosic feedstock, it is unlikely to be of use as a solid fuel. The ash chemistry is not improved by HTC, unlike other feedstocks [38,42], possibly due to the high levels of ash present. As such there is little point trying to optimise for production of a solid fuel and it is more sensible optimising for recovery of energy from recycling process waters back into the digester. An assessment of the behaviour of the process waters using biochemical methane potential tests has been performed, together with characterisation of the process water composition to understand the influence of process conditions on biogas yields.

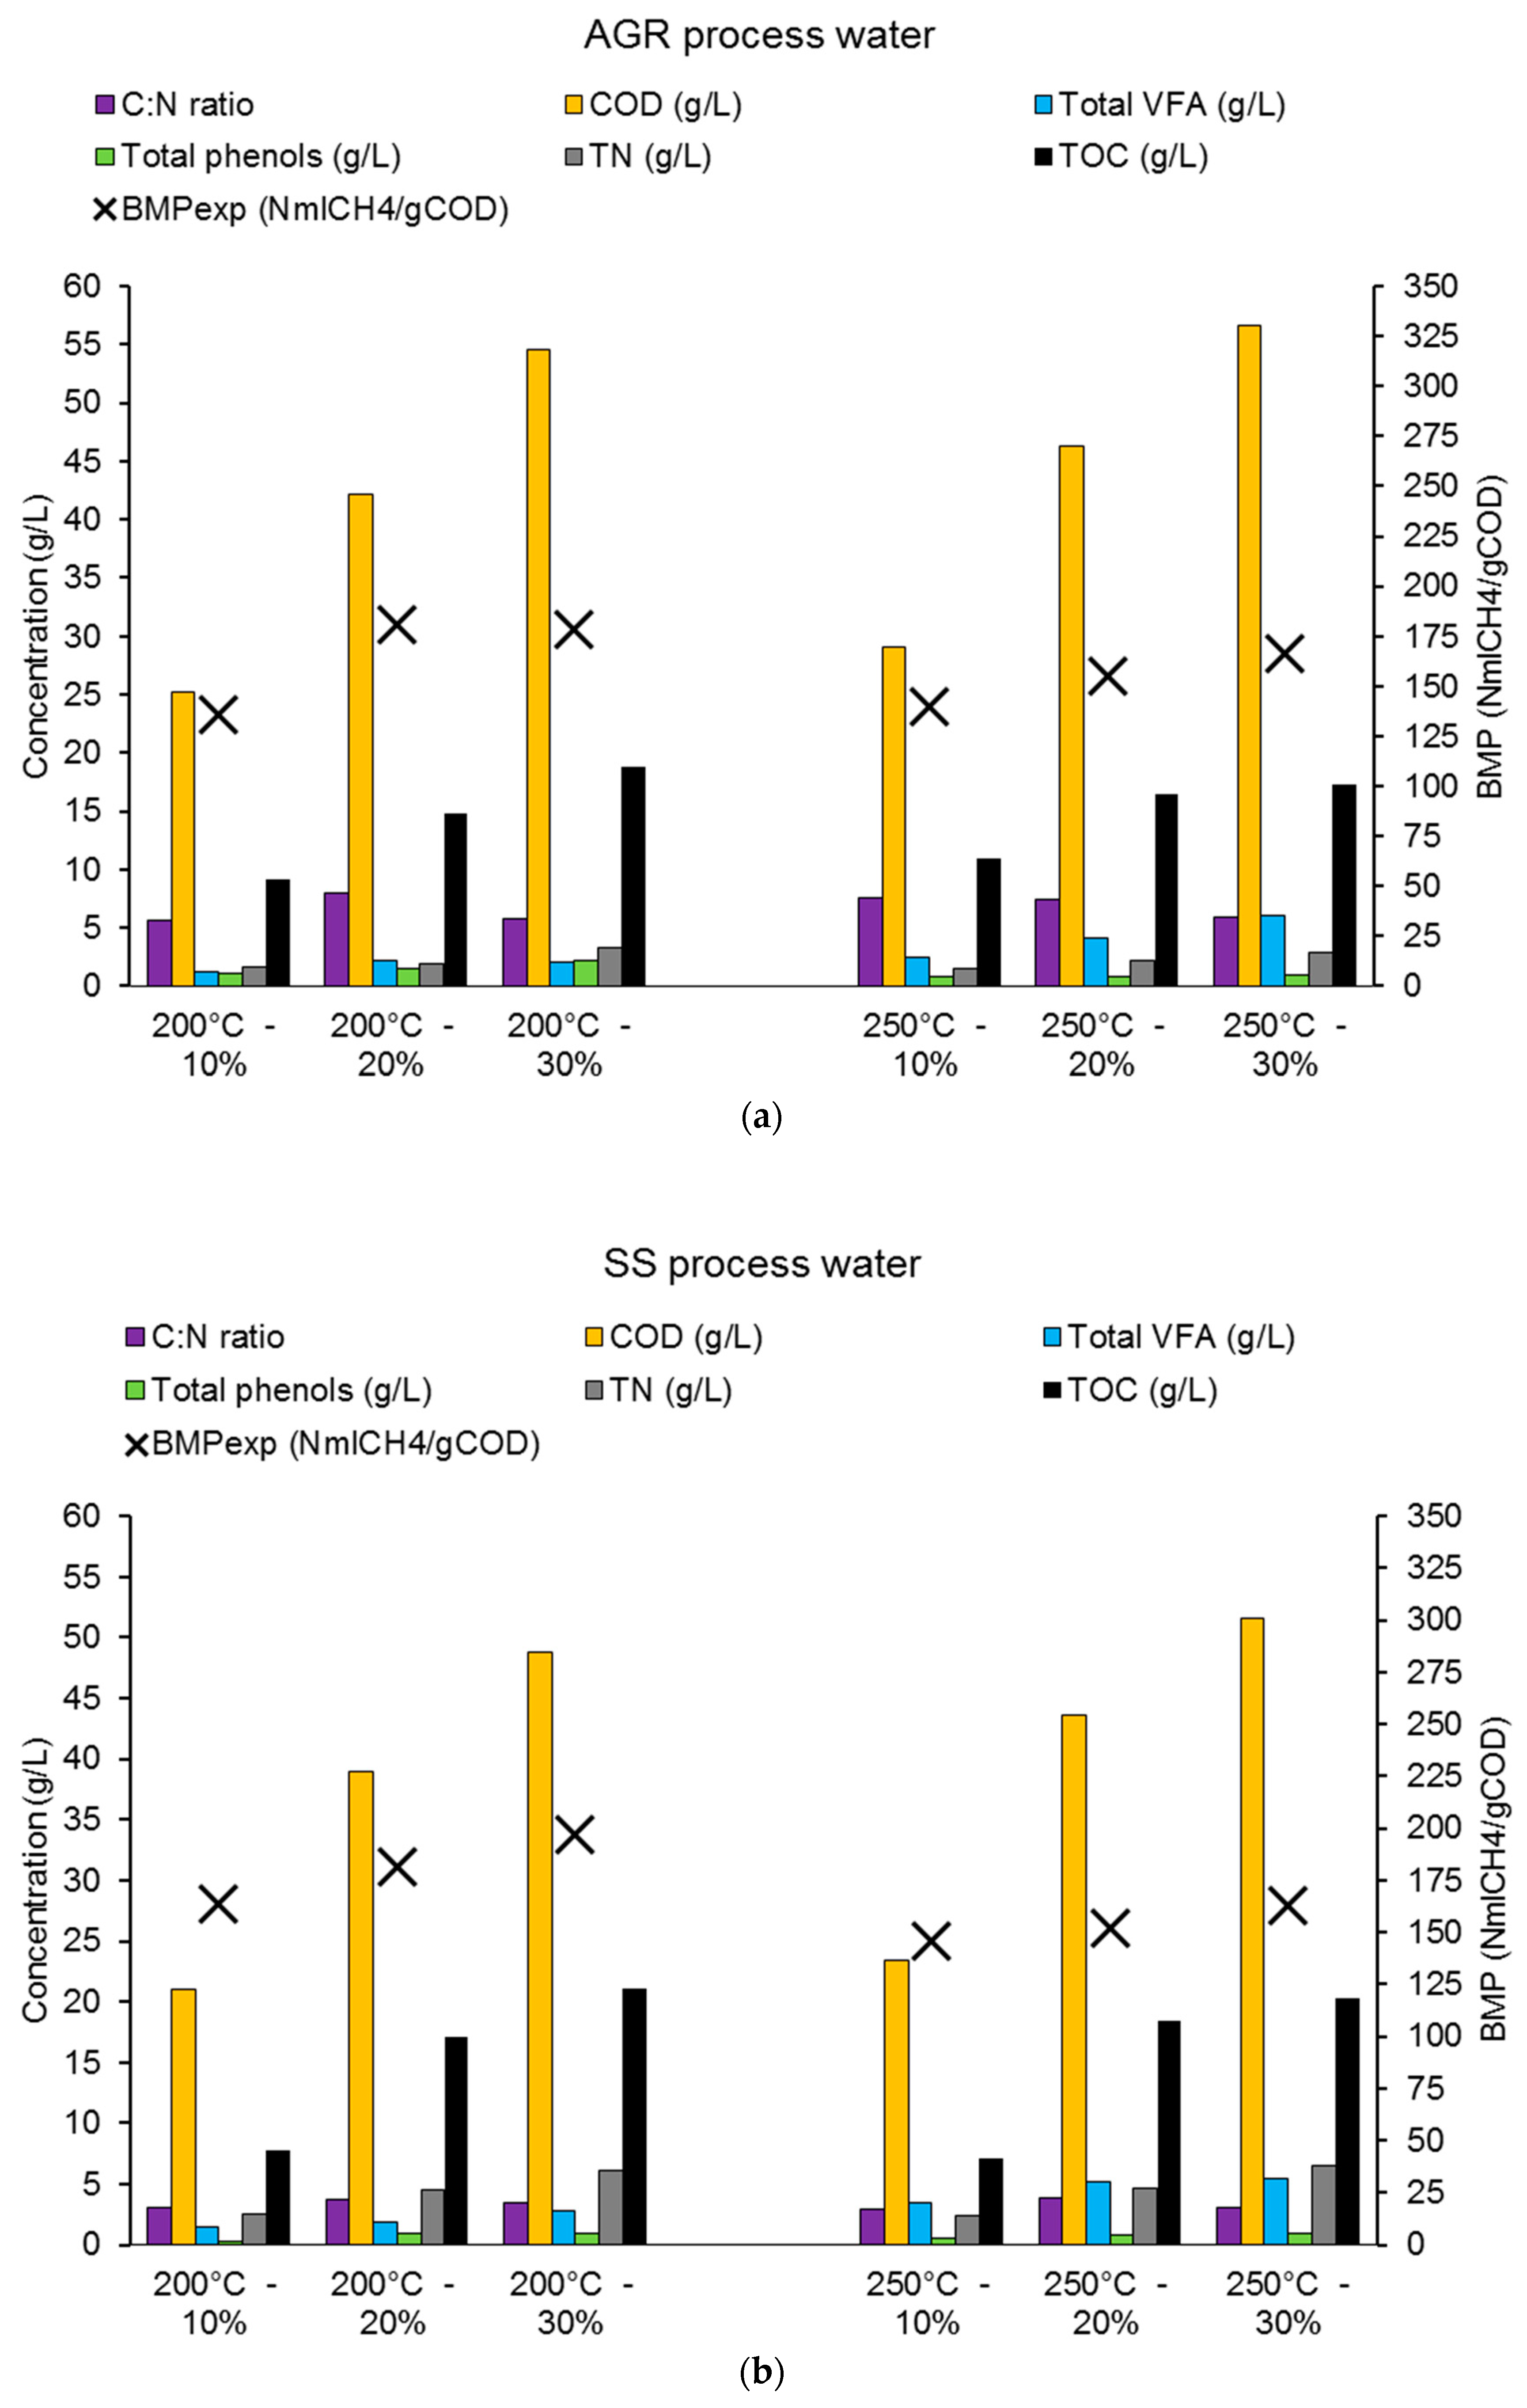
3.3. Process Water Composition and Biomethane Yeild

Analysis of the process waters generated at 20% solid loading are shown in Table 5. All loading values (10%, 20%, and 30%) are shown in Supplementary Table S4. For all process waters the TOC content increases with temperature. The highest TOC was observed for the SS digestate, followed by the AGR, VGF, and then the MSW. Generally, the phenol content of the process waters rises with increasing temperature and as expected is highest for the AGR digestate, which has the highest level of lignin content. pH of the process waters is feedstock dependent and linked to the inorganic content and N content of the process waters.
Generally, pH falls between 6–7 with some of the high ash and high nitrogen feedstocks producing basic process waters at a high temperature and is usually quite acidic for lignocellulosic feedstock. Thus, these pH ranges match integration with AD more easily than those from high lignin feedstocks. The levels of TN in the process waters are highest for the SS digestate as expected, reflecting the high protein content of this feedstock. The C:N ratio of the process waters are within the digestion operational parameters [70,71].
The VFA content of the process waters increase with temperature. High levels of VFA are inhibitory and are likely to reduce biogas yields at a high temperature operation [72]. The levels of methane generated for each feedstock at 20% solid loading are listed in Table 5. AGR and SS process waters are presented in Figure 4.
Actual methane yields range from 100–180 N mL CH4/gCOD loaded at a substrate to inoculum ratio of 1:1. The highest yields of methane were produced from the SS and the AGR process waters. The composition of the process water is also influenced by solid loading as shown in Supplementary Table S4. As solid loading increases, the level of COD and TOC in the process water increase, however it is not always additive.
Figure 4 shows the levels of TOC and COD for AGR and SS at 200 °C and 250 °C. Additive behaviour is observed for sewage sludge at lower solid loadings (10–20 wt. %), but then at higher solid loading (30 wt. %) the levels of COD, TOC, and BMP decrease, possibly due to saturation of the water. For AGR, the COD and TOC are non-additive and the rate of solubilisation decreases with high solid loading. This reduction in soluble organic material with increasing solid loading corresponds to a higher hydrochar yield. The AGR feedstock has the lowest ash content and highest lignin content. The higher lignin content produces an increased hydrochar yield which is thought to promote re-adsorption of volatile fragments from the process water onto the surface of the char, resulting in a hydrochar with increased volatile matter as shown in Table S2. Increasing the solid loading increases the level of VFA in the water. The AGR process waters are more acidic that those from the higher ash, and higher nitrogen containing feedstocks such as sewage digestate, which may be responsible for increasing char yields [73]. On the other hand, sewage sludge digestate has higher ash and N content and has a higher pH, reducing the level of polymerization for hydrochar.
The levels of experimental methane yield generally increase with increased solid loading but much less than the increase in TOC and COD, suggesting that the biodegradability is reducing. For the AGR process waters, the experimental methane production is similar at both 200 °C and 250 °C, whereas for the sewage digestate, the lower temperature processing at 200 °C produces significantly higher methane yields than at 250 °C. For the SS process waters, increasing the solid loading at 200 °C results in an increase in methane production whereas at the higher temperature of 250 °C, an increased solid loading results in only a minimal increase in experimental BMP. Overall, at the higher temperature, the experimental BMP is lower, despite increasing TOC and COD, suggesting the process waters are more inhibitory.
The experimental BMP data for AGR suggests the levels of methane start to reduce as the solid loading increase beyond 20 wt. %. Considering the improvements in the energetics of HTC when operating at higher solid loading, it appears that higher solid loading and lower temperatures would be most suitable for digestate feedstocks. Ultimately, the solid loading effects on process water characteristics and biogas production rely heavily on the feedstock composition.

4. Conclusions

This study set out to investigate the potential opportunities of integrating HTC with AD by characterising and processing four streams of digestate via HTC, including an understanding of product composition to their application. Product behaviour and composition varies significantly depending on the feedstock composition, including HTC process variables. Higher processing temperatures increased concentrations of TOC and liquid yields and decreased inorganic concentrations of the process waters, which is beneficial for process water treatment and biogas production. Higher solid loading reduced liquid yields and increased the TOC content in a non-additive behaviour. Solid loading had little to no effect on the biodegradability of process waters generated from SS digestate. Biogas production was not affected by the level of inhibitive compounds analysed in the process waters.
In summary, the integration of HTC is beneficial to treat digestate and enhance biogas yields via anaerobic digestion of process waters. Hydrochar produced from digestate material is not recommended as a solid fuel, as its ash chemistry and predicted slagging and fouling behaviour is less than ideal for combustion. Therefore, there is little benefit to processing digestate over 150 °C and an alternative application for the resultant hydrochar should be found, such as its use for soil amendment.

Supplementary Materials

The following are available online at https://www.mdpi.com/1996-1073/12/9/1586/s1. Table S1: Yields of products following hydrothermal carbonisation of digestate; Table S2: Ultimate, proximate, and heating analysis of feedstock and corresponding hydrochar; Table S3: Inorganic analysis and slagging and fouling indices of feedstock and corresponding hydrochar; Table S4: Liquid analysis and experimental biochemical methane potential comparison of HTC process waters.; Figure S1: Thermal decomposition behaviour of the digestate feedstocks shown by (a) thermogravimetric analysis (TGA) and (b) derivative thermogravimetric (DTG) curves.

Author Contributions

The authors contributed to this article in the following ways: conceptualization: K.R.P. and A.B.R.; formal analysis: K.R.P. and A.B.R.; investigation: K.R.P.; supervision: A.B.R.; visualisation: K.R.P. and A.B.R; writing—original draft: K.R.P. and A.B.R.; writing—review and editing: K.R.P.

Funding

This research was funded by the EPSRC Centre for Doctoral Training in Bioenergy at the University of Leeds (EP/L014912/1). The APC was funded by the University of Leeds.

Acknowledgments

The authors wish to thank Filip Velghe, Organic Waste Systems (OWS) and Yorkshire Water for the supply and description of the digestates. The authors would also like to thank Simon Lloyd, Adrian Cunliffe, Karine Alves Thorne, David Elliot, and Sheena Bennet for their technical assistance.

Conflicts of Interest

The authors declare no conflicts of interest.

References

  1. WRAP. Optimising the Value of Digestate and Digestion Systems; Waste & Resources Action Programme: Oxon, UK, 2015. [Google Scholar]
  2. WRAP. PAS 110: Specification for Whole Digestate, Separated Liquor and Separated Fibre Derived from the Anaerobic Digestion of Source-Segregated Biodegradable Materials; British Standards Institution: London, UK, 2014; p. 46. [Google Scholar]
  3. Monlau, F.; Francavilla, M.; Sambusiti, C.; Antoniou, N.; Solhy, A.; Libutti, A.; Zabaniotou, A.; Barakat, A.; Monteleone, M. Toward a functional integration of anaerobic digestion and pyrolysis for a sustainable resource management. Comparison between solid-digestate and its derived pyrochar as soil amendment. Appl. Energy 2016, 169, 652–662. [Google Scholar] [CrossRef]
  4. Opatokun, S.A.; Strezov, V.; Kan, T. Product based evaluation of pyrolysis of food waste and its digestate. Energy 2015, 92, 349–354. [Google Scholar] [CrossRef]
  5. Wiśniewski, D.; Gołaszewski, J.; Białowiec, A. The pyrolysis and gasification of digestate from agricultural biogas plant. Arch. Environ. Prot. 2015, 41, 70–75. [Google Scholar] [CrossRef]
  6. Hung, C.Y.; Tsai, W.T.; Chen, J.W.; Lin, Y.Q.; Chang, Y.M. Characterization of biochar prepared from biogas digestate. Waste Manag. 2017, 66, 53–60. [Google Scholar] [CrossRef]
  7. Monlau, F.; Sambusiti, C.; Antoniou, N.; Barakat, A.; Zabaniotou, A. A new concept for enhancing energy recovery from agricultural residues by coupling anaerobic digestion and pyrolysis process. Appl. Energy 2015, 148, 32–38. [Google Scholar] [CrossRef]
  8. Opatokun, S.A.; Yousef, L.F.; Strezov, V. Agronomic assessment of pyrolysed food waste digestate for sandy soil management. J. Environ. Manag. 2017, 187, 24–30. [Google Scholar] [CrossRef] [PubMed]
  9. Kim, Y.; Parker, W. A technical and economic evaluation of the pyrolysis of sewage sludge for the production of bio-oil. Bioresour. Technol. 2008, 99, 1409–1416. [Google Scholar] [CrossRef]
  10. Schouten, S.; van Groenigen, J.W.; Oenema, O.; Cayuela, M.L. Bioenergy from cattle manure? Implications of anaerobic digestion and subsequent pyrolysis for carbon and nitrogen dynamics in soil. GCB Bioenergy 2012, 4, 751–760. [Google Scholar]
  11. Monlau, F.; Sambusiti, C.; Ficara, E.; Aboulkas, A.; Barakat, A.; Carrère, H. New opportunities for agricultural digestate valorization: Current situation and perspectives. Energy Environ. Sci. 2015, 8, 2600–2621. [Google Scholar] [CrossRef]
  12. Rodriguez Correa, C.; Bernardo, M.; Ribeiro, R.P.P.L.; Esteves, I.A.A.C.; Kruse, A. Evaluation of hydrothermal carbonization as a preliminary step for the production of functional materials from biogas digestate. J. Anal. Appl. Pyrolysis 2017, 124, 461–474. [Google Scholar] [CrossRef]
  13. Wiedner, K.; Rumpel, C.; Steiner, C.; Pozzi, A.; Maas, R.; Glaser, B. Chemical evaluation of chars produced by thermochemical conversion (gasification, pyrolysis and hydrothermal carbonization) of agro-industrial biomass on a commercial scale. Biomass Bioenergy 2013, 59, 264–278. [Google Scholar] [CrossRef]
  14. Bridgwater, A.V.; Meier, D.; Radlein, D. An overview of fast pyrolysis of biomass. Org. Geochem. 1999, 30, 1479–1493. [Google Scholar] [CrossRef]
  15. Cottam, M.L.; Bridgwater, A.V. Techno-economic modelling of biomass flash pyrolysis and upgrading systems. Biomass Bioenergy 1994, 7, 267–273. [Google Scholar] [CrossRef]
  16. Jaroenkhasemmeesuk, C.; Tippayawong, N. Technical and Economic Analysis of A Biomass Pyrolysis Plant. Energy Procedia 2015, 79, 950–955. [Google Scholar] [CrossRef] [Green Version]
  17. Conesa, J.A.; Font, R.; Fullana, A.; Martín-Gullón, I.; Aracil, I.; Gálvez, A.; Moltó, J.; Gómez-Rico, M.F. Comparison between emissions from the pyrolysis and combustion of different wastes. J. Anal. Appl. Pyrolysis 2009, 84, 95–102. [Google Scholar] [CrossRef] [Green Version]
  18. Carpenter, D.; Westover, T.L.; Czernik, S.; Jablonski, W. Biomass feedstocks for renewable fuel production: A review of the impacts of feedstock and pretreatment on the yield and product distribution of fast pyrolysis bio-oils and vapors. Green Chem. 2014, 16, 384–406. [Google Scholar] [CrossRef]
  19. Gollakota, A.R.K.; Reddy, M.; Subramanyam, M.D.; Kishore, N. A review on the upgradation techniques of pyrolysis oil. Renew. Sustain. Energy Rev. 2016, 58, 1543–1568. [Google Scholar] [CrossRef]
  20. Williams, C.L.; Westover, T.L.; Emerson, R.M.; Tumuluru, J.S.; Li, C. Sources of Biomass Feedstock Variability and the Potential Impact on Biofuels Production. Bioenergy Res. 2016, 9, 1–14. [Google Scholar] [CrossRef]
  21. Neumann, J.; Binder, S.; Apfelbacher, A.; Gasson, J.R.; Ramírez García, P.; Hornung, A. Production and characterization of a new quality pyrolysis oil, char and syngas from digestate—Introducing the thermo-catalytic reforming process. J. Anal. Appl. Pyrolysis 2015, 113, 137–142. [Google Scholar] [CrossRef]
  22. Prado, G.H.C.; Rao, Y.; De Klerk, A. Nitrogen removal from oil: A review. Energy Fuels 2017, 31, 14–36. [Google Scholar] [CrossRef]
  23. Troy, S.M.; Nolan, T.; Leahy, J.J.; Lawlor, P.G.; Healy, M.G.; Kwapinski, W. Effect of sawdust addition and composting of feedstock on renewable energy and biochar production from pyrolysis of anaerobically digested pig manure. Biomass Bioenergy 2013, 49, 1–9. [Google Scholar] [CrossRef] [Green Version]
  24. Pedroza, M.M.; Sousa, J.F.; Vieira, G.E.G.; Bezerra, M.B.D. Characterization of the products from the pyrolysis of sewage sludge in 1 kg/h rotating cylinder reactor. J. Anal. Appl. Pyrolysis 2014, 105, 108–115. [Google Scholar] [CrossRef]
  25. Sousa, A.A.T.C.; Figueiredo, C.C. Sewage sludge biochar: Effects on soil fertility and growth of radish. Biol. Agric. Hortic. 2016, 32, 127–138. [Google Scholar] [CrossRef]
  26. Weidemann, E.; Buss, W.; Edo, M.; Mašek, O.; Jansson, S. Influence of pyrolysis temperature and production unit on formation of selected PAHs, oxy-PAHs, N-PACs, PCDDs, and PCDFs in biochar—A screening study. Environ. Sci. Pollut. Res. 2018, 25, 3933–3940. [Google Scholar] [CrossRef]
  27. Busch, D.; Stark, A.; Kammann, C.I.; Glaser, B. Genotoxic and phytotoxic risk assessment of fresh and treated hydrochar from hydrothermal carbonization compared to biochar from pyrolysis. Ecotoxicol. Environ. Saf. 2013, 97, 59–66. [Google Scholar] [CrossRef]
  28. Kambo, H.S.; Dutta, A. A comparative review of biochar and hydrochar in terms of production, physico-chemical properties and applications. Renew. Sustain. Energy Rev. 2015, 45, 359–378. [Google Scholar] [CrossRef]
  29. Judex, J.W.; Gaiffi, M.; Burgbacher, H.C. Gasification of dried sewage sludge: Status of the demonstration and the pilot plant. Waste Manag. 2012, 32, 719–723. [Google Scholar] [CrossRef]
  30. Pecchi, M.; Baratieri, M. Coupling anaerobic digestion with gasification, pyrolysis or hydrothermal carbonization: A review. Renew. Sustain. Energy Rev. 2019, 105, 462–475. [Google Scholar] [CrossRef]
  31. Antoniou, N.; Monlau, F.; Sambusiti, C.; Ficara, E.; Barakat, A.; Zabaniotou, A. Contribution to Circular Economy options of mixed agricultural wastes management: Coupling anaerobic digestion with gasification for enhanced energy and material recovery. J. Clean. Prod. 2019, 209, 505–514. [Google Scholar] [CrossRef]
  32. Rollinson, A.N. Gasification reactor engineering approach to understanding the formation of biochar properties. Proc. R. Soc. A Math. Phys. Eng. Sci. 2016, 472, 20150841. [Google Scholar] [CrossRef] [Green Version]
  33. Zhu, Y.; Han, Z.; Liu, X.; Li, J.; Liu, F.; Feng, S. Study on the effect and mechanism of hydrothermal pretreatment of dewatered sewage sludge cake for dewaterability. J. Air Waste Manag. Assoc. 2013, 63, 997–1002. [Google Scholar] [CrossRef] [Green Version]
  34. Escala, M.; Zumbühl, T.; Koller, C.; Junge, R.; Krebs, R. Hydrothermal carbonization as an energy-efficient alternative to established drying technologies for sewage sludge: A feasibility study on a laboratory scale. Energy Fuels 2013, 27, 454–460. [Google Scholar] [CrossRef]
  35. Li, C.; Wang, X.; Zhang, G.; Li, J.; Li, Z.; Yu, G.; Wang, Y. A process combining hydrothermal pretreatment, anaerobic digestion and pyrolysis for sewage sludge dewatering and co-production of biogas and biochar: Pilot-scale verification. Bioresour. Technol. 2018, 254, 187–193. [Google Scholar] [CrossRef]
  36. Reza, M.T.; Andert, J.; Wirth, B.; Busch, D.; Pielert, J.; Lynam, J.G.; Mumme, J. Hydrothermal Carbonization of Biomass for Energy and Crop Production. Appl. Bioenergy 2014, 1, 11–29. [Google Scholar] [CrossRef]
  37. Lynam, J.G.; Reza, M.T.; Yan, W.; Vásquez, V.R.; Coronella, C.J. Hydrothermal carbonization of various lignocellulosic biomass. Biomass Convers. Biorefinery 2015, 5, 173–181. [Google Scholar] [CrossRef]
  38. Reza, M.T.; Lynam, J.G.; Uddin, M.H.; Coronella, C.J. Hydrothermal carbonization: Fate of inorganics. Biomass Bioenergy 2013, 49, 86–94. [Google Scholar] [CrossRef]
  39. Berge, N.D.; Ro, K.S.; Mao, J.; Flora, J.R.V.; Chappell, M.A.; Bae, S. Hydrothermal carbonization of municipal waste streams. Environ. Sci. Technol. 2011, 45, 5696–5703. [Google Scholar] [CrossRef]
  40. Liu, Z.; Quek, A.; Kent Hoekman, S.; Balasubramanian, R. Production of solid biochar fuel from waste biomass by hydrothermal carbonization. Fuel 2013, 103, 943–949. [Google Scholar] [CrossRef]
  41. Smith, A.M.; Ross, A.B. The Influence of Residence Time during Hydrothermal Carbonisation of Miscanthus on Bio-Coal Combustion Chemistry. Energies 2019, 12, 523. [Google Scholar] [CrossRef]
  42. Smith, A.M.; Singh, S.; Ross, A.B. Fate of inorganic material during hydrothermal carbonisation of biomass: Influence of feedstock on combustion behaviour of hydrochar. Fuel 2016, 169, 135–145. [Google Scholar] [CrossRef] [Green Version]
  43. Biller, P.; Ross, A.B. Production of biofuels via hydrothermal conversion. In Handbook of Biofuels Production: Processes and Technologies, 2nd ed.; Woodhead Publishing: Duxford, UK, 2016; ISBN 9780081004562. [Google Scholar]
  44. Gai, C.; Chen, M.; Liu, T.; Peng, N.; Liu, Z. Gasification characteristics of hydrochar and pyrochar derived from sewage sludge. Energy 2016, 113, 957–965. [Google Scholar] [CrossRef] [Green Version]
  45. Wilk, M.; Magdziarz, A.; Jayaraman, K.; Szymańska-Chargot, M.; Gökalp, I. Hydrothermal carbonization characteristics of sewage sludge and lignocellulosic biomass. A comparative study. Biomass Bioenergy 2019, 120, 166–175. [Google Scholar] [CrossRef]
  46. Libra, J.A.; Ro, K.S.; Kammann, C.; Funke, A.; Berge, N.D.; Neubauer, Y.; Titirici, M.-M.; Fühner, C.; Bens, O.; Kern, J.; et al. Hydrothermal carbonization of biomass residuals: A comparative review of the chemistry, processes and applications of wet and dry pyrolysis. Biofuels 2011, 2, 71–106. [Google Scholar] [CrossRef]
  47. Yu, Y.; Lou, X.; Wu, H. Some recent advances in hydrolysis of biomass in hot-compressed water and its comparisons with other hydrolysis methods. Energy Fuels 2008, 22, 46–60. [Google Scholar] [CrossRef]
  48. Razavi, A.S.; Hosseini Koupaie, E.; Azizi, A.; Hafez, H.; Elbeshbishy, E. Hydrothermal pretreatment of source separated organics for enhanced solubilization and biomethane recovery. Bioresour. Technol. 2019, 274, 502–511. [Google Scholar] [CrossRef]
  49. Posmanik, R.; Labatut, R.A.; Kim, A.H.; Usack, J.G.; Tester, J.W.; Angenent, L.T. Coupling hydrothermal liquefaction and anaerobic digestion for energy valorization from model biomass feedstocks. Bioresour. Technol. 2017, 233, 134–143. [Google Scholar] [CrossRef]
  50. Kim, D.; Lee, K.; Park, K.Y. Enhancement of biogas production from anaerobic digestion of waste activated sludge by hydrothermal pre-treatment. Int. Biodeterior. Biodegrad. 2015, 101, 42–46. [Google Scholar] [CrossRef]
  51. Wirth, B.; Reza, T.; Mumme, J. Influence of digestion temperature and organic loading rate on the continuous anaerobic treatment of process liquor from hydrothermal carbonization of sewage sludge. Bioresour. Technol. 2015, 198, 215–222. [Google Scholar] [CrossRef]
  52. Aragón-Briceño, C.; Ross, A.B.; Camargo-Valero, M.A. Evaluation and comparison of product yields and bio-methane potential in sewage digestate following hydrothermal treatment. Appl. Energy 2017, 208, 1357–1369. [Google Scholar] [CrossRef]
  53. Fakkaew, K.; Koottatep, T.; Polprasert, C. Faecal sludge treatment and utilization by hydrothermal carbonization. J. Environ. Manag. 2018, 216, 421–426. [Google Scholar] [CrossRef]
  54. Merzari, F.; Langone, M.; Andreottola, G.; Fiori, L. Methane production from process water of sewage sludge hydrothermal carbonization. A review. Valorising sludge through hydrothermal carbonization. Crit. Rev. Environ. Sci. Technol. 2019, 49, 1–42. [Google Scholar] [CrossRef]
  55. De la Rubia, M.A.; Villamil, J.A.; Rodriguez, J.J.; Borja, R.; Mohedano, A.F. Mesophilic anaerobic co-digestion of the organic fraction of municipal solid waste with the liquid fraction from hydrothermal carbonization of sewage sludge. Waste Manag. 2018, 76, 315–322. [Google Scholar] [CrossRef]
  56. Villamil, J.A.; Mohedano, A.F.; Rodriguez, J.J.; De la Rubia, M.A. Anaerobic co-digestion of the aqueous phase from hydrothermally treated waste activated sludge with primary sewage sludge. A kinetic study. J. Environ. Manag. 2019, 231, 726–733. [Google Scholar] [CrossRef]
  57. De la Rubia, M.A.; Villamil, J.A.; Rodriguez, J.J.; Mohedano, A.F. Effect of inoculum source and initial concentration on the anaerobic digestion of the liquid fraction from hydrothermal carbonisation of sewage sludge. Renew. Energy 2018, 127, 697–704. [Google Scholar] [CrossRef]
  58. Reza, M.T.; Werner, M.; Pohl, M.; Mumme, J. Evaluation of Integrated Anaerobic Digestion and Hydrothermal Carbonization for Bioenergy Production. J. Vis. Exp. 2014, 88, e51734. [Google Scholar] [CrossRef]
  59. Zhao, K.; Li, Y.; Zhou, Y.; Guo, W.; Jiang, H.; Xu, Q. Characterization of hydrothermal carbonization products (hydrochars and spent liquor) and their biomethane production performance. Bioresour. Technol. 2018, 267, 9–16. [Google Scholar] [CrossRef]
  60. Qiao, W.; Yan, X.; Ye, J.; Sun, Y.; Wang, W.; Zhang, Z. Evaluation of biogas production from different biomass wastes with/without hydrothermal pretreatment. Renew. Energy 2011, 36, 3313–3318. [Google Scholar] [CrossRef]
  61. Friedl, A.; Padouvas, E.; Rotter, H.; Varmuza, K. Prediction of heating values of biomass fuel from elemental composition. Anal. Chim. Acta 2005, 544, 191–198. [Google Scholar] [CrossRef]
  62. Xing, P.; Mason, P.E.; Chilton, S.; Lloyd, S.; Jones, J.M.; Williams, A.; Nimmo, W.; Pourkashanian, M. A comparative assessment of biomass ash preparation methods using X-ray fluorescence and wet chemical analysis. Fuel 2016, 182, 161–165. [Google Scholar] [CrossRef] [Green Version]
  63. Holliger, C.; Alves, M.; Andrade, D.; Angelidaki, I.; Astals, S.; Baier, U.; Bougrier, C.; Buffière, P.; Carballa, M.; De Wilde, V.; et al. Towards a standardization of biomethane potential tests. Water Sci. Technol. 2016, 74, 2515–2522. [Google Scholar] [CrossRef] [Green Version]
  64. Zhang, X.P.; Zhang, C.; Li, X.; Yu, S.H.; Tan, P.; Fang, Q.Y.; Chen, G. A two-step process for sewage sludge treatment: Hydrothermal treatment of sludge and catalytic hydrothermal gasification of its derived liquid. Fuel Process. Technol. 2018, 180, 67–74. [Google Scholar] [CrossRef]
  65. Danso-Boateng, E.; Holdich, R.G.; Wheatley, A.D.; Martin, S.J.; Shama, G. Hydrothermal carbonization of primary sewage sludge and synthetic faeces: Effect of reaction temperature and time on filterability. Environ. Prog. Sustain. Energy 2015, 34, 1279–1290. [Google Scholar] [CrossRef] [Green Version]
  66. Kumar, S.; Gupta, R.; Lee, Y.Y.; Gupta, R.B. Cellulose pretreatment in subcritical water: Effect of temperature on molecular structure and enzymatic reactivity. Bioresour. Technol. 2010, 101, 1337–1347. [Google Scholar] [CrossRef]
  67. Ravber, M. Hydrothermal Degradation of Fats, Carbohydrates and Proteins in Sunflower Seeds after Treatment with Subcritical Water. Chem. Biochem. Eng. Q. 2016, 29, 351–355. [Google Scholar] [CrossRef]
  68. Funke, A.; Ziegler, F. Hydrothermal carbonization of biomass: A summary and discussion of chemical mechanisms for process engineering. Biofuels Bioprod. Biorefin. 2010, 4, 160–177. [Google Scholar] [CrossRef]
  69. Kang, S.; Li, X.; Fan, J.; Chang, J. Characterization of hydrochars produced by hydrothermal carbonization of lignin, cellulose, d-xylose, and wood meal. Ind. Eng. Chem. Res. 2012, 51, 9023–9031. [Google Scholar] [CrossRef]
  70. Hills, D.J. Effects of carbon: Nitrogen ratio on anaerobic digestion of dairy manure. Agric. Wastes 1979, 1, 267–278. [Google Scholar] [CrossRef]
  71. Stanton, W.R. Anaerobic digestion: Principles and practice for biogas systems. Biol. Wastes 2003, 1, 8–16. [Google Scholar] [CrossRef]
  72. Wang, Y.; Zhang, Y.; Wang, J.; Meng, L. Effects of volatile fatty acid concentrations on methane yield and methanogenic bacteria. Biomass Bioenergy 2009, 33, 848–853. [Google Scholar] [CrossRef]
  73. Ghanim, B.M.; Kwapinski, W.; Leahy, J.J. Hydrothermal carbonisation of poultry litter: Effects of initial pH on yields and chemical properties of hydrochars. Bioresour. Technol. 2017, 238, 78–85. [Google Scholar] [CrossRef]
Figure 1. Influence of temperature on product yields including energy content of hydrochar at 20% loading for (a) agricultural residue (AGR), (b) municipal solid waste (MSW), (c) sewage sludge (SS), and (d) vegetable, garden and fruit (VGF) on a dry basis (db), based on duplicate data and error bars represent deviation around the mean.
Energies 12 01586 g001
Figure 2. Influence of loading on product yields, including energy content of hydrochar for (a) AGR at 200 °C, (b) AGR at 250 °C, (c) SS at 200 °C, (d) SS at 250 °C on a dry basis (db), based on duplicate data and error bars represent deviation around the mean.
Energies 12 01586 g002
Figure 3. Van Krevelen diagram for feedstock and hydrochar produced at 20% loading.
Energies 12 01586 g003
Figure 4. Influence of solid loading on process water composition and biochemical methane potential (BMP) for (a) AGR at 200 and 250 °C, and (b) SS at 200 and 250 °C.
Energies 12 01586 g004
Table 1. Predictive slagging and fouling indices.
Slagging and Fouling IndicesEquationInterpretation
Alkali index AI = Kg ( K 2 O + Na 2 O ) Gj AI < 0.17 safe combustion
AI > 0.17 < 0.34 likely slagging and fouling
AI > 0.34 almost certain slagging and fouling
Bed agglomeration index BAI = % ( Fe 2 O 3 ) % ( K 2 O + Na 2 O ) BAI < 0.15 bed agglomeration likely
Acid base ratio R b a = % ( Fe 2 O 3 + CaO + MgO + K 2 O + Na 2 O ) % ( SiO 2 + TiO 2 + Al 2 O 3 ) R b a < 0.5 low slagging risk
Slagging index SI = ( % ( Fe 2 O 3 + CaO + MgO + K 2 O + Na 2 O ) % ( SiO 2 + TiO 2 + Al 2 O 3 ) ) % S ( dry basis ) SI < 0.6 low slagging inclination
SI > 0.6 < 2.0 medium slagging inclination
SI > 2.0 high slagging inclination
Fouling index FI = ( % ( Fe 2 O 3 + CaO + MgO + K 2 O + Na 2 O ) % ( SiO 2 + TiO 2 + Al 2 O 3 ) ) % ( K 2 O + Na 2 O ) FI < 0.6 low fouling
FI > 0.6 < 40.0 medium fouling
FI > 40.0 indicate high fouling
Slag viscosity index SVI = ( % SiO 2 100 ) % ( SiO 2 + MgO + CaO + Fe 2 O 3 ) SVI > 72 low slagging inclination
SVI > 63 < 72 medium slagging inclination
SVI < 65 high slagging inclination
Table 2. Digestate composition.
AGRMSWSSVGF
% C (db)44.1 ± 0.124.1 ± 0.028.6 ± 0.329.5 ± 0.1
% H (db)5.1 ± 0.01.7 ± 0.03.1 ± 0.13.0 ± 0.1
% N (db)3.2 ± 0.01.5 ± 0.03.4 ± 0.02.0 ± 0.0
% S (db)0.3 ± 0.00.2 ± 0.01.5 ± 0.00.3 ± 0.0
% O a (db)31.3 ± 0.316.9 ± 0.016.4 ± 0.321.3 ± 0.6
H/C (daf)1.380.831.31.22
O/C (daf)0.530.530.430.54
% Protein (db)17.76.824.39.8
% VM (db)70.2 ± 0.336.2 ± 0.151.0 ± 0.147.2 ± 1.1
% FC (db)13.8 ± 0.08.3 ± 0.02.1 ± 0.19.0 ± 0.2
% Ash a (db)16.0 ± 0.355.5 ± 0.146.9 ± 0.043.8 ± 0.8
HHV (MJ/kg db) b17.815.614.914.9
% Na (db)0.30.90.50.5
% Mg (db)0.71.40.90.8
% P (db)1.20.72.72.6
% K (db)1.61.60.70.7
% Ca (db)1.310.44.64.3
% Fe (db)2.33.23.33.0
% Si (db)1.810.27.67.1
db, dry basis; daf, dry ash free basis; a calculated by difference; b calculated according to Equation (1).
Table 3. Ultimate, proximate, and heating of analysis of feedstock and corresponding hydrochar.
MaterialUltimate Analysis (wt% db)Proximate Analysis (wt% db)HHV (MJ/kg, db)H/C (daf)O/C (daf)
CHNSO aVMFC Ash a
AGR digestate44.1 ± 0.15.1 ± 0.03.2 ± 0.00.3 ± 0.031.3 ± 0.370.2 ± 0.313.8 ± 0.016.0 ± 0.317.81.380.53
150 °C at 20%44.2 ± 1.94.8 ± 0.33.1 ± 0.10.0 ± 0.027.5 ± 0.562.2 ± 3.217.5 ± 0.620.4 ± 2.717.91.290.47
200 °C at 20%50.8 ± 0.86.0 ± 0.73.3 ± 0.50.1 ± 0.124.4 ± 3.367.4 ± 0.517.3 ± 1.915.3 ± 1.420.71.400.36
250 °C at 20%57.1 ± 1.46.6 ± 1.53.9 ± 0.30.2 ± 0.012.0 ± 3.158.2 ± 0.021.6 ± 0.120.2 ± 0.124.21.390.16
MSW digestate24.1 ± 0.01.7 ± 0.01.5 ± 0.00.2 ± 0.016.9 ± 0.036.2 ± 0.18.3 ± 0.055.5 ± 0.115.60.830.53
150 °C at 20%23.8 ± 1.72.1 ± 0.31.2 ± 0.10.0 ± 0.019.0 ± 4.539.4 ± 6.86.6 ± 0.554.0 ± 6.315.21.040.60
200 °C at 20%21.4 ± 0.21.6 ± 0.00.9 ± 0.00.1 ± 0.013.9 ± 0.132.3 ± 0.85.6 ± 0.762.1 ± 0.115.60.870.49
250 °C at 20%21.7 ± 1.51.6 ± 0.10.8 ± 0.00.0 ± 0.07.9 ± 0.325.7 ± 3.16.3 ± 1.268.0 ± 2.015.60.880.28
SS digestate28.6 ± 0.33.1 ± 0.13.4 ± 0.01.5 ± 0.016.4 ± 0.351.0 ± 0.12.1 ± 0.146.9 ± 0.014.91.300.43
150 °C at 20%33.4 ± 1.84.4 ± 0.63.2 ± 0.20.3 ± 0.115.0 ± 2.350.5 ± 4.75.7 ± 0.243.8 ± 4.915.01.560.34
200 °C at 20%34.0 ± 1.14.2 ± 0.22.4 ± 0.10.9 ± 0.114.0 ± 0.649.1 ± 0.96.5 ± 0.244.4 ± 0.715.11.470.31
250 °C at 20%34.7 ± 0.44.1 ± 0.02.4 ± 0.10.7 ± 0.310.6 ± 0.645.9 ± 0.56.6 ± 0.247.5 ± 0.315.31.420.23
VGF digestate29.5 ± 0.13.0 ± 0.12.0 ± 0.00.3 ± 0.021.3 ± 0.647.2 ± 1.19.0 ± 0.243.8 ± 0.814.91.220.54
150 °C at 20%29.7 ± 1.83.0 ± 0.11.9 ± 0.10.0 ± 0.012.2 ± 1.237.6 ± 0.79.3 ± 0.053.1 ± 0.715.01.220.31
200 °C at 20%32.2 ± 1.93.3 ± 0.21.5 ± 0.10.3 ± 0.013.3 ± 0.041.7 ± 1.59.0 ± 0.749.4 ± 2.315.11.230.31
250 °C at 20%27.8 ± 0.72.7 ± 0.01.4 ± 0.00.1 ± 0.19.0 ± 1.631.7 ± 1.79.2 ± 0.759.0 ± 2.414.91.140.24
a calculated by difference.
Table 4. Slagging and fouling indices of feedstock and corresponding 20% hydrochar.
MaterialSlagging and Fouling Indices
AIBAIR b/aSIFISVI
AGR digestate1.251.462.10.629.238
150 °C at 20%1.540.291.70.132.249
200 °C at 20%1.180.351.30.220.954
250 °C at 20%0.590.951.00.27.353
MSW digestate2.051.440.90.25.350
150 °C at 20%1.212.801.50.05.235
200 °C at 20%1.312.701.00.13.445
250 °C at 20%1.063.880.50.01.261
SS digestate1.043.000.61.02.156
150 °C at 20%0.902.620.40.11.365
200 °C at 20%0.753.430.40.41.164
250 °C at 20%0.952.810.50.31.463
VGF digestate1.550.850.40.12.273
150 °C at 20%1.411.130.50.02.067
200 °C at 20%0.861.730.40.11.171
250 °C at 20%0.891.960.40.10.873
Table 5. Liquid analysis and experimental biochemical methane potential of 20% process waters.
Process WaterspHTN (g/L)TOC (g/L)C:N RatioCOD (g/L)Total VFA (g/L)Total Phenols (g/L)BMPexp (NmlCH4/gCOD)
AGR digestate
150 °C at 20%6.73.113.94.545.51.81.4100.0
200 °C at 20%6.21.914.98.042.22.11.6180.7
250 °C at 20%6.12.216.57.446.34.20.8155.5
MSW digestate
150 °C at 20%6.51.13.43.122.60.70.384.6
200 °C at 20%7.12.45.72.418.10.90.4137.7
250 °C at 20%7.81.76.03.616.41.30.6134.6
SS digestate
150 °C at 20%5.62.416.66.931.01.10.2100.2
200 °C at 20%6.24.517.13.838.91.80.9181.7
250 °C at 20%7.64.718.43.943.65.30.8151.9
VGF digestate
150 °C at 20%6.51.05.75.911.90.90.3121.4
200 °C at 20%5.71.48.56.322.51.10.9158.6
250 °C at 20%6.41.59.86.527.82.21.2125.1

