Article

Sliding Mode Observer-Based Load Angle Estimation for Salient-Pole Wound Rotor Synchronous Generators

1
Faculty of Engineering, University of Rijeka, 51000 Rijeka, Croatia
2
Hydro Power Plants Department, Hydro South, HEP–Generation Ltd., PSPP Velebit, 23450 Obrovac, Croatia
*
Author to whom correspondence should be addressed.
Energies 2019, 12(9), 1609; https://doi.org/10.3390/en12091609
Submission received: 6 April 2019 / Revised: 25 April 2019 / Accepted: 26 April 2019 / Published: 27 April 2019
(This article belongs to the Section F: Electrical Engineering)

Abstract

:
Synchronous generator load angle is a fundamental quantity for power system stability assessment, with possible real-time applications in protection and excitation control systems. Commonly used methods of load angle determination require additional measuring equipment, while existing research on load angle estimation for wound rotor synchronous generator has been limited to the estimator based on the generator’s phasor diagram and estimators based on artificial neural networks. In this paper, a load angle estimator for salient-pole wound rotor synchronous generator, based on a simple sliding mode observer (SMO) which utilizes field current, stator voltages, and stator currents measurements, is proposed. The conventional SMO structure is improved with use of hyperbolic tangent sigmoid functions, implementation of the second order low-pass filters accompanied with corresponding phase delay compensation, and introduction of an adaptive observer gain proportional to the measured field current value. Several case studies conducted on a generator connected to a power system suggest that the proposed estimator provides an adequate accuracy during active and reactive power disturbances during stable generator operation, outperforming the classical phasor diagram-based estimator by reducing mean squared error by up to 14.10%, mean absolute error by up to 41.55%, and maximum absolute error by up to 8.81%.

1. Introduction

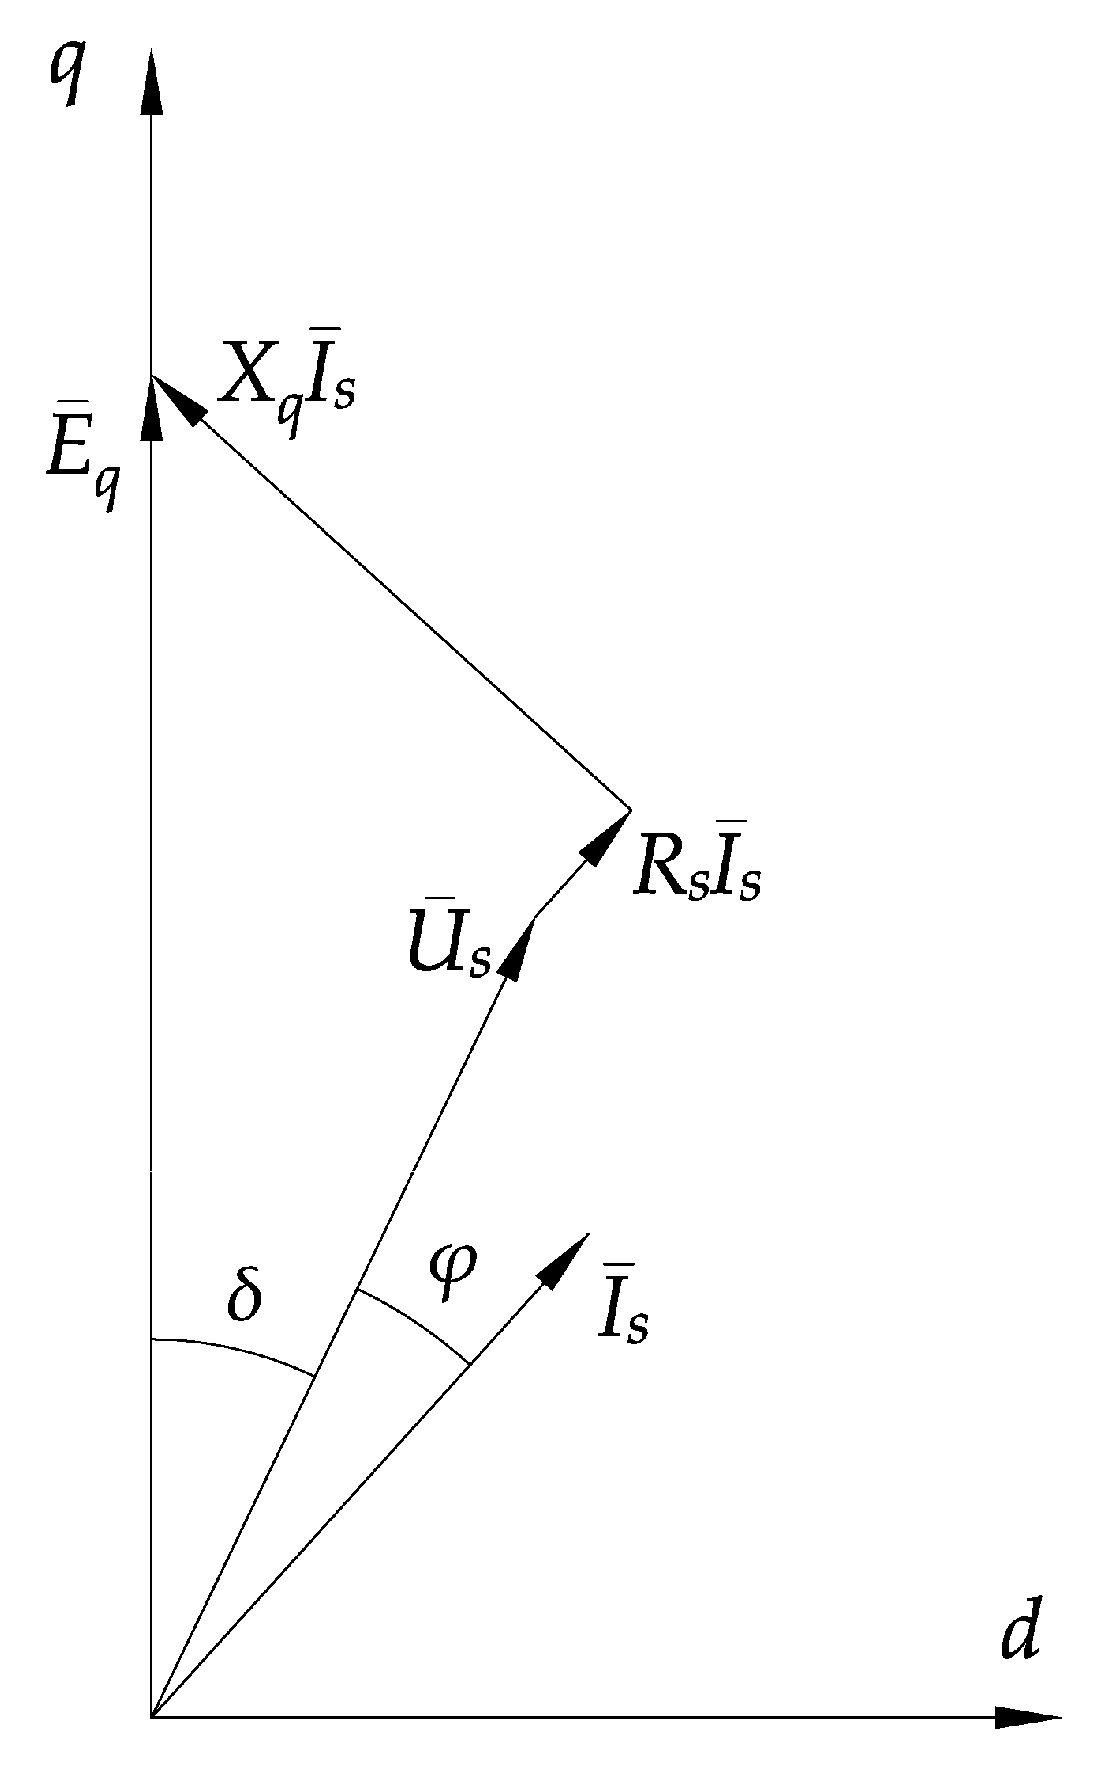
Due to increasing demands and regulatory constraints, modern power systems have been forced to operate close to their stability limits. The wound rotor synchronous generator is a basic production unit of the electrical power system, and its load angle, defined as the electrical angle by which the internal induced voltage in the quadrature (q) axis Eq leads the stator terminal voltage Us, represents a fundamental quantity for power system stability assessment [1,2]. It defines the generator operating point with respect to the stability limits. Load angle is essential in transient stability studies, and its utilization in other real-time applications, such as protection functions, or as an input to excitation control systems and power system stabilizers has been investigated [3,4]. Therefore, the accurate knowledge of load angle value is required.
The methods of determining the generator’s load angle in power plants mainly consist of physical measurements. Direct load angle measurements are rarely used, while indirect measurements, utilizing rotor position information from the corresponding sensor and the information about the first harmonic of the generator terminal voltage, such as those presented in [5,6,7], are more prevalent. These methods of load angle determination require installation of additional measuring equipment, which represents additional costs, while in some systems it is even not possible to install it due to their configuration.
The alternative approach to load angle determination is estimation based on electrical quantities (voltages and currents), whose measurements are already incorporated in generator protection systems and excitation control systems. This approach might offer an effective and economic way of load angle monitoring. However, existing research attempts on the load angle estimation of the wound rotor synchronous generator have been limited to the estimator based on the generator’s voltage-current phasor diagram and estimators based on artificial neural networks (ANNs).
The load angle estimator based on the generator’s voltage-current phasor diagram was studied in [8]. The estimator utilized measured values of stator voltages, stator currents, active and reactive power, as well as generator parameters: stator resistance and quadrature axis synchronous reactance. This estimation method was slightly extended in [7] to take into account network parameters, i.e., the equivalent reactance of a transmission line and a transformer. However, it should be noted that the estimation method based on the phasor diagram is valid for the steady-state generator operation, while during the dynamic transients the estimation performance deteriorates as each phasor has its own dynamics due to the present time constants. The study in [9] presented a technique for the approximate computation of load angle which was valid for the simplified generator model, and which used generator dynamic parameters and terminal measurements of voltage magnitude, active power, reactive power, and field current.
In [10] the simulations of the generator speed and load angle estimation based on real-time phasor measurements and two multilayered feedforward artificial neural networks were presented. The ANN for load angle estimation included 40 neurons in the hidden layer, and its inputs were values of terminal voltage and current magnitudes, as well as their phase angles, measured in the current time step and the two previous time steps. The study presented in [11] proposed an estimation method based on the post-processing of sine and cosine values of the load angle, which were obtained by two ANNs implemented in the simulation environment, both with two hidden layers of eight neurons and 20 input variables. The study conducted in [12] dealt with the load angle estimation by using dynamic ANN with the following inputs: active power, reactive power, field current, and terminal voltage at the current and the previous time instant. The performance of the ANN based load angle estimation generally depends on the training process and the quality of the obtained training data, which represents a significant drawback of this type of estimation methods, as such amount of measurements that would include all operating states of the synchronous generator is hardly feasible for practical applications.
In recent years, sliding mode observers (SMOs) [13,14,15,16,17] and sliding mode control (SMC) [18,19,20,21,22,23] have gained much research interest in the field of state estimation and control of electrical drives, including permanent magnet synchronous machines (PMSMs) and induction machines (IMs). The main reasons for increasing interest in application of SMOs in the field of electrical drives are their attractive features, such as simple implementation, strong robustness, order reduction, and disturbance rejection [24]. Moreover, SMOs are characterized by insensitivity to the effects of parameters variation under dynamic conditions of electrical drives [24]. In comparison with other commonly applied observers, such as Kalman filter and Luenberger observer, SMO has a simpler algorithm [25]. Additionally, application of the Kalman filter requires the tuning of the initial values of covariance matrices, and such a process, which can be time-consuming, is not needed when SMO is applied [25]. These reasons also motivated the application of SMO in this paper.
The study in [26] introduced an SMO based on the equivalent electromotive force (EMF) machine model for rotor position estimation of interior-permanent-magnet synchronous motor (IPMSM). An SMO based on back EMF model which utilized the obtained back EMF equivalent signal, thus eliminating a need for low-pass filter and phase compensation, was proposed in [27] for rotor position and speed estimation in order to achieve sensorless control of PMSM. In [28] a wide-speed SMO of rotor position was proposed for sensorless flux adaption-direct torque control of a flux-modulated permanent-magnet wheel motor, eliminating low-pass filter and phase compensation, improving system chattering, and enhancing estimation accuracy at low speed. Sensorless control of a salient-pole PMSM was achieved in [29] by utilizing extended flux-based machine model and an SMO with a dynamic position compensator for improvement of system dynamic performance. The study in [30] proposed sensorless control of PMSM with rotor position estimation based on tangent function-based phase-locked loop (PLL) structure and improved SMO with adaptive feedback gain related to the rotor speed. An SMO based on adaptive super-twisting algorithm was proposed in [31] for rotor position estimation of surface-mounted permanent magnet synchronous machine (SPMSM) and applied for sensorless control with compensation of voltage source inverter nonlinearity. The research conducted in [32] proposed sensorless control of IPMSM based on an SMO which utilized PLL technique and fuzzy control adjustment of sliding mode gain in order to reduce chattering and increase the observer robustness.
A detailed literature survey has shown that there are many research papers focused on the application of SMOs for the estimation of rotor position of PMSMs. However, to the best of our knowledge, there are no studies on application of SMO for estimation of load angle of grid-connected salient-pole wound rotor synchronous generator. This type of synchronous generator is dominantly used in hydro-electric power plants and, unlike PMSM, is characterized by the ability to control its field excitation, which is achieved by field current regulation.
In [33] a nonlinear SMO for the estimation of power generator damper currents was developed and applied in sliding mode control in order to achieve transient stabilization and voltage regulation. The study in [34] presented the observer-based nonlinear controller for the excitation control of synchronous generator, where SMO was used for the estimation of system states and perturbation. State estimation did not include estimation of load angle as it was treated as system output already available by measurements. In [35] a sliding mode controller of synchronous generator was developed using a nonlinear SMO for estimation of rotor fluxes and mechanical torque. Thus, in SMOs described in studies in [33,34,35] load angle was not estimated, but it was treated as observer output, i.e., its measurements were available and used for estimation of other generator state variables.
Therefore, in this paper, we propose a load angle estimator for a salient-pole wound rotor synchronous generator based on the SMO principle. Unlike the studies described above, the proposed estimator utilizes information about the phase angle of the generator terminal voltage and a concept of a simple SMO based on the equivalent EMF machine model. The estimator uses measurements of terminal voltages and currents, as well as field current measurements. Additionally, values of stator resistance and quadrature axis synchronous inductance are used as estimator parameters. This study shows that a simple SMO based on the equivalent EMF machine model may be effectively applied to the load angle estimation problem of a salient-pole wound rotor synchronous generator. Moreover, traditional SMO structure is improved in this paper with several methods. Firstly, hyperbolic tangent sigmoid (tansig) functions are used instead of the classical sign functions in order to reduce system chattering problems. Furthermore, the second order low-pass filters (LPFs) realized as cascades of two first order LPFs and accompanied with the appropriate phase delay compensation, are implemented to extract EMF values. Finally, a novel approach to observer gain calculation is presented, where an adaptive observer gain proportional to the measured field current value is introduced, in contrast to the commonly applied approach where this gain is set to constant value. Numerical simulations are done on the model of the high power salient-pole wound rotor synchronous generator connected to an infinite network through a transformer and two parallel transmission lines. Results of several case studies show that proposed estimator offers a satisfactory estimation accuracy during active and reactive power disturbances, both in the steady and the transient state, outperforming a classical estimator based on the phasor diagram.
The rest of this paper is organized as follows: in the second section, the principle of the conventionally applied estimator based on the machine phasor diagram is presented, and the SMO based load angle estimator is proposed and explained. Moreover, the structure of the simulated system is explained. The third section presents simulation results obtained for several case studies, accompanied with the evaluation of the proposed estimator’s performance during active and reactive power disturbances. Finally, the fourth section presents our conclusions.

2. Methods

2.1. Synchronous Generator Phasor Diagram

The nonlinear relationship between the generator power output and its load angle is of great importance in power system stability studies. Load angle δ of a synchronous generator represents the electrical angle between the stator terminal voltage Us and the induced voltage Eq in the q-axis of the rotating dq reference frame. The dq components of stator voltages and currents are obtained by applying the dq transformation (Clarke and Park transformations) to the three phase quantities. In the steady-state operation of a synchronous generator, the relationships between the stator voltages and currents may be expressed by a phasor diagram in the complex dq plane, as shown in Figure 1. Generator voltages and currents are expressed as phasors in the complex plane with the d and q axes as coordinates [2].
In Figure 1, Us represents the stator terminal voltage, Is represents the stator current, ϕ is the phase angle between the stator voltage and current (power factor angle), Eq is the induced voltage in the q-axis, δ is the load angle, Xq is the synchronous quadrature (q) axis reactance, and Rs is the stator resistance.
The load angle estimator based on the phasor diagram shown in Figure 1, which was studied in [8] and also, with minor modifications, in [7], is defined by the following equation:
δ = tan 1 ( X q I s cos φ R s I s sin φ U s + R s I s cos φ + X q I s sin φ )
or alternatively:
δ = tan 1 ( X q I s P R s I s Q U s S + R s I s P + X q I s Q )
where P is the active power, Q is the reactive power, and S is the apparent power.

2.2. SMO-Based Load Angle Estimator

The stationary two-axis α β reference frame of the synchronous generator, whose α -axis is aligned to the stator phase a-axis, is utilized in this study. The model of a salient-pole wound rotor synchronous generator in this reference frame is given by:
u s α = R s i s α + L q d i s α d t + e s α
u s β = R s i s β + L q d i s β d t + e s β
where u s α and u s β are the α and β stator voltage components, i s α and i s β are the actual (measured) α and β stator current components, e s α and e s β are equivalent EMF components, and Lq is the synchronous q-axis inductance. Equivalent EMF components are defined as:
e s α = ( ( L d L q ) ω i d + L a d ω i f d ) sin θ
e s β = ( ( L d L q ) ω i d + L a d ω i f d ) cos θ
where Ld is the synchronous d-axis inductance, Lad is the mutual inductance between stator and rotor windings in the d-axis, ω is the rotor electrical angular velocity, id is the d-axis stator current component, ifd is the field current, and θ is the rotor angular position.
As it can be seen from (5) and (6), the expressions for equivalent EMF components contain information about the rotor angular position θ, which may be extracted by the application of a suitable estimation method, such as SMO. The presented generator model in the stationary reference frame may be obtained from the machine equations in the rotating dq reference frame, whose d-axis coincides with the rotor, by applying Park transformation with rearrangement and grouping of variables, accompanied by the neglecting of certain derivative terms, which makes the model suitable for the application of a simple SMO for estimation purposes, but at the same time still provides a satisfactory modeling of generator behavior during the type of disturbances which are studied in this paper and which are introduced to the stable steady-state generator operation.
Based on the synchronous generator model, a simple SMO, which utilizes the functions of the difference between the estimated and the actual system outputs, may be designed as:
[ d i ^ s α d t d i ^ s β d t ] = 1 L q [ u s α u s β ] R s L q [ i ^ s α i ^ s β ] K L q [ F ( i ^ s α i s α ) F ( i ^ s β i s β ) ]
where i ^ s α and i ^ s β are the estimated (observed) α and β current components, K is the observer gain, and F is the function of the estimation error.
In this paper, the hyperbolic tangent sigmoid functions are applied to the difference between the estimated and the actual currents, instead of the classical sign functions. Therefore, the function F is implemented as:
F ( x ) = 2 1 + e 2 x 1
The estimation errors of individual current components, representing the chosen sliding surface, are defined as:
i ¯ s α = i ^ s α i s α
i ¯ s β = i ^ s β i s β
The dynamics of the estimation error along the sliding surface is obtained by subtracting the generator model Equations (3) and (4) from the SMO Equation (7):
[ d i ¯ s α d t d i ¯ s β d t ] = R s L q [ i ¯ s α i ¯ s β ] + 1 L q [ e s α e s β ] K L q [ F ( i ¯ s α ) F ( i ¯ s β ) ]
The Lyapunov function is here selected as:
V = 1 2 ( i ¯ s α 2 + i ¯ s β 2 )
According to the Lyapunov stability theorem, the system is asymptotically stable when:
d V d t < 0
Therefore, the following expressions are obtained:
d V d t = V i ¯ s α d i ¯ s α d t + V i ¯ s β d i ¯ s β d t
d V d t = i ¯ s α d i ¯ s α d t + i ¯ s β d i ¯ s β d t
By substituting (11) into (15), it follows that:
d V d t = R s L q ( i ¯ s α 2 + i ¯ s β 2 ) + 1 L q ( e s α i ¯ s α + e s β i ¯ s β ) K L q ( i ¯ s α F ( i ¯ s α ) + i ¯ s β F ( i ¯ s β ) )
According to (16), the stability condition is satisfied if:
K > max { | e s α | , | e s β | }
Instead of using the constant observer gain that satisfies a condition of being larger than maximum value of equivalent EMFs as in conventional SMOs, in this paper an adaptive observer gain definition is proposed by a simple extension of (17). In this case, the gain value depends on the measured value of the generator field current K = f ( i f d ) . This functional relationship is obtained from the definition of the equivalent EMFs in (5) and (6) by using known generator parameters and by setting the d-axis current component and the rotor angular speed to their maximum expected values, with the additional constant multiplying factor which is selected to enable the sliding mode.
When the estimated currents converge towards the actual ones, the error values become zero. By setting i ¯ s α and i ¯ s β to zero in (11), the expressions for EMFs are obtained:
e s α = K F ( i ¯ s α )
e s β = K F ( i ¯ s β )
Accurate position estimation requires additional low-pass filtering of the signals obtained by (18) and (19). In this paper, two second order LPFs, each realized as a cascade of two first order LPFs, are proposed for the extraction of the EMF values. The utilized first order LPF is defined by the following transfer function:
G L P F ( s ) = ω c s + ω c
with:
ω c = 2 π f c
where fc is the filter cut-off frequency.
Therefore, the estimated EMF components e s α and e s β are obtained by the application of the second order LPF defined as:
G 2 L P F ( s ) = ω c 2 s 2 + 2 ω c s + ω c 2
to the values obtained by (18) and (19).
Thus obtained estimated EMF values are directly used to calculate the rotor position:
θ ^ = tan 1 ( e s α e s β )
However, the application of the LPF causes phase delay, which is reflected in the estimated value of the rotor angular position θ ^ . In order to overcome this issue, the phase delay compensation is proposed. Based on (22), the phase delay may be calculated as:
Δ θ = tan 1 ( 2 ω c ω ω c 2 ω 2 )
As the synchronous generator operates in parallel with the power system whose electrical frequency is considered constant, the significant deviations of the generator electrical angular velocity from the nominal value of 100 π rad/s (for the frequency of 50 Hz) are not expected during the stable operation. Therefore, the cut-off frequency in (22) was set to 50.5 Hz, and the phase delay in (24) was calculated by setting ω to 100 π rad/s. Therefore, the phase delay value of 89.43° is obtained and added to the angle value computed by (23) in order to finally obtain the rotor position estimate:
θ ^ = θ ^ + Δ θ
After the rotor position estimate θ ^ is obtained, the electrical angle of the q-axis, i.e., the electrical angle of the equivalent EMF, is obtained by adding a 90° electrical angle. According to its definition as the electrical angle between the induced voltage in the q-axis and the stator voltage, the synchronous generator load angle estimate δ ^ is obtained by subtracting the calculated stator voltage phase angle γ from the estimated q-axis position:
δ ^ = θ ^ + 90 γ
The stator voltage phase angle is obtained by monitoring of the generator three-phase voltages, transforming them into the α β reference frame, and then calculating the phase angle as γ = tan 1 ( u s β / u s α ) . The overall structure of the proposed load angle estimator, including the above described principles, is shown in Figure 2.

2.3. Simulation Model

In order to validate the proposed load angle estimation approach, numerical simulations were conducted in MATLAB/Simulink environment. For that purpose, a simulation model of a synchronous generator connected to a power grid was built. The configuration of the simulated system is depicted in Figure 3.
The three-phase salient-pole wound rotor synchronous generator was modeled in the dq rotor reference frame, where the electrical part of the machine model was represented by the sixth-order state space model and the mechanical part was represented by rotational inertia equations of motion. Values of parameters used in the generator simulation model are given in Table A1 and Table A2, corresponding to the parameters of the real synchronous generator located in the Pumped Storage Hydro Power Plant Velebit (Croatia). Moreover, the magnetic saturation of rotor and stator iron was also modeled by a nonlinear function between field current and terminal voltage.
The inputs to the generator model were mechanical power at the machine’s shaft and field voltage. Mechanical power was generated as an output of the hydraulic turbine and governor system model. This system contained a nonlinear model of a hydraulic turbine, a model of a gate servomotor, and a model of a proportional-integral-derivative (PID) governor. Field voltage was generated as an output from a model of an IEEE type 1 excitation system containing a synchronous generator voltage regulator combined to an exciter. The input to the regulator was obtained by subtracting the actual value of the generator terminal voltage and the stabilizing derivative feedback signal from the terminal voltage reference. Furthermore, the synchronous generator was connected to the AC network through a transformer and two parallel transmission lines whose parameters are given in Table A3 and Table A4, respectively. The infinite AC network was represented by a voltage source with constant frequency and voltage magnitude.
Moreover, the proposed SMO based load angle estimator and the conventional phasor diagram based estimator were also implemented in MATLAB/Simulink simulations. Load angle values obtained by the both types of estimators were additionally filtered using moving average filter. The values of corresponding quantities generated by the previously described simulation model were utilized as measured (actual) values in the implemented real-time estimation algorithms. Finally, the load angle values generated by the detailed simulation model of the generator were used to evaluate the performance of the estimators.

3. Results and Discussion

The performance of the suggested SMO based load angle estimator was tested in MATLAB/Simulink simulations described in the previous subsection. Simulations were conducted for two types of dynamic disturbances: reactive power disturbances and active power disturbances. Both types of disturbances were applied in three different operating points of the synchronous generator connected to the power grid, defined by the values of the active power P and reactive power Q. These values expressed using per-unit (pu) notation are the following:
  • Case 1: P = 0.89, Q = 0.41 ind.
  • Case 2: P = 0.89, Q = 0
  • Case 3: P = 0.89, Q = 0.11 cap.
The following subsections provide a graphical comparison of estimated load angle values and actual load angle values obtained in simulations by the detailed mathematical model of the synchronous generator. Moreover, to quantitatively evaluate the performance of the proposed estimator, several performance indices were calculated and compared to the performance indices obtained by the conventionally applied estimator based on the machine voltage-current phasor diagram. Estimator’s performance indices used in this paper are given below along with their definitions:
  • Mean squared error (MSE):
    M S E = 1 N n = 1 N ( δ ^ ( n ) δ ( n ) ) 2
  • Mean absolute error (MAE):
    M A E = 1 N n = 1 N | δ ^ ( n ) δ ( n ) |
  • Maximum absolute error (MAXE):
    M A X E = max n = { 1 , , N } { | δ ^ ( n ) δ ( n ) | }
    where N is the number of samples, δ ( n ) is actual and δ ^ ( n ) is estimated load angle value at the n-th sample.

3.1. Reactive Power Disturbances

Dynamic disturbances of the synchronous generator reactive power were introduced by the change of terminal voltage reference value. The voltage reference was first decreased by the step of 0.05 pu at t = 2 s, and after that increased by the same value at t = 12 s. This caused the change of the synchronous generator reactive power, while the active power was kept constant at the nominal value. Three case studies were conducted to evaluate estimator’s performance during this type of disturbances in different areas of generator’s stable operation.

3.1.1. Case 1

Steady-state operation of the considered synchronous generator was achieved in the stable operating point defined by P = 0.89, Q = 0.41 ind. in the P-Q diagram. Dynamic disturbances were introduced to the system by the terminal voltage reference change, as shown in Figure 4. This led to the change of the generator active and reactive power, which is depicted in Figure 5.
Figure 6a shows actual and estimated load angle values during the disturbances, while Figure 6b depicts the estimation error, i.e., the difference between the actual and the estimated angle.
Values of performance indices calculated for the SMO based estimator are given in Table 1, together with the performance indices computed for the estimator based on the generator’s phasor diagram. Moreover, Table 2 presents relative improvement of the performance indices obtained by the SMO based estimator over the performance indices obtained by the phasor diagram based estimator, where positive percentage values denote performance improvement, while negative percentage values suggest performance deterioration.

3.1.2. Case 2

Generator steady-state operation was reached in the operating point defined by P = 0.89, Q = 0. Dynamic disturbances were introduced by the change of terminal voltage reference, which is shown in Figure 7, causing the change of the generator active and reactive power, as illustrated in Figure 8.
The comparison of actual and estimated load angle values during the disturbances is depicted in Figure 9a, while the estimation error is shown in Figure 9b.
Table 3 gives values of performance indices for the SMO based estimator and for the phasor diagram based estimator. Additionally, Table 4 presents relative improvement of the performance indices obtained by the SMO based estimator over the performance indices obtained by the estimator based on the phasor diagram.

3.1.3. Case 3

Steady-state generator operating point, defined by P = 0.89, Q = 0.11 cap., was reached before dynamic disturbances were introduced by the terminal voltage reference change depicted in Figure 10, which caused the variation of the generator active and reactive power, as shown in Figure 11.
Figure 12a depicts actual and estimated load angle values during the disturbances, while Figure 12b shows the estimation error.
Performance indices of the SMO-based estimator are given in Table 5, together with the performance indices of the estimator based on the generator’s phasor diagram. Furthermore, Table 6 presents relative improvement of the performance indices obtained by the SMO-based estimator over the performance indices obtained by the phasor diagram based estimator.
The above presented results suggest that in all three case studies the proposed SMO-based load angle estimator provides a satisfactory estimation accuracy during reactive power disturbances in the stable synchronous generator operation. Moreover, in comparison with the conventionally applied estimator based on the generator’s phasor diagram, the proposed estimator offers the estimation performance improvement by up to 8.91% with respect to the MSE, by up to 25.53% with respect to the MAE and by up to 6.61% with respect to the MAXE.

3.2. Active Power Disturbances

Dynamic disturbances of the generator active power were introduced by the change of input mechanical power. The input mechanical power was decreased from its nominal value by 0.1 pu at t = 2 s, and at t = 12 s it was increased by the same value, as shown in Figure 13. This procedure caused the corresponding change of the generator’s active power, while the reactive power was maintained at the constant value by the excitation controller. Three different operating points of the synchronous generator were considered to evaluate the estimator’s performance during this type of disturbances.

3.2.1. Case 1

Stable steady-state operating point of the generator was reached at values P = 0.89, Q = 0.41 ind., followed by the introduction of active power dynamic disturbances in the form of the input mechanical power change shown in Figure 13. This led to the change of the generator active and reactive power, which is depicted in Figure 14.
The comparison of the actual and estimated load angle values is shown in Figure 15a, while Figure 15b depicts the load angle estimation error during the disturbances.
Table 7 presents values of performance indices calculated both for the SMO based estimation, and for the estimation method based on the generator’s phasor diagram. Furthermore, percentage values of the relative performance improvement of the SMO based estimation over the phasor diagram based estimation are computed and given in Table 8.

3.2.2. Case 2

The stable generator operating point was reached at P = 0.89, Q = 0. After that, active power dynamic disturbances were introduced by the change of the input mechanical power which is depicted in Figure 13. Consequently, the change of the generator active and reactive power occurred, as shown in Figure 16.
Figure 17a shows the actual and estimated load angle values, while Figure 17b depicts the estimation error during the active power disturbances.
Values of performance indices, calculated for the SMO-based estimator and for the phasor diagram based estimator, are presented in Table 9. Additionally, values of the relative performance improvement of the SMO-based estimator over the phasor diagram-based estimator are shown in Table 10.

3.2.3. Case 3

Stable generator operation was achieved at the point defined by values P = 0.89, Q = 0.11 cap., followed by active power dynamic disturbances introduced by the change of the input mechanical power, which is shown in Figure 13. This caused the generator active and reactive power variation, as depicted in Figure 18.
The comparison of the actual and estimated load angle values is depicted in Figure 19a, while Figure 19b shows the load angle estimation error during the disturbances.
Table 11 presents values of performance indices computed both for the SMO-based estimation, and for the estimation based on the generator’s voltage-current phasor diagram. Moreover, percentage values of the relative performance improvement of the SMO-based estimation over the phasor diagram based estimation are calculated and given in Table 12.
The estimation results obtained by the proposed SMO-based load angle estimator, which are presented for the above described case studies, indicate that a good estimation accuracy is achieved during active power disturbances introduced to the grid connected synchronous generator. Furthermore, when compared to the estimator based on the generator’s phasor diagram, the proposed estimator reduces the MSE by up to 14.10%, the MAE by up to 41.55%, and the MAXE by up to 8.81%.

3.3. Parameters Sensitivity Analysis

The SMO-based estimator uses the following generator parameters: stator resistance Rs and quadrature axis synchronous inductance Lq. The actual values of the machine parameters may differ from the provided nominal values or from the values obtained by some of the parameters estimation methods. Moreover, these parameters depend on operating conditions and their values may change during the generator operation, due to temperature (Rs) or magnetic saturation (Lq).
Therefore, the analysis of the proposed estimator’s sensitivity to the parameters variation was conducted in simulations for the case of reactive power disturbances in the operating point P = 0.89, Q = 0.41 ind., which were already described earlier in this paper. The values of parameters used in the estimator were varied with the step of 10% within the range 80-120% of the actual (nominal) values of parameters used in the generator model, and performance indices (MAE and MAXE) were calculated to determine the sensitivity of the estimation method to the parameters change. Figure 20a shows mean absolute estimation error and maximum estimation error obtained by variation of the stator resistance values in the estimator, while Figure 20b represents error values obtained by using different values of the quadrature axis inductance. Rs and Lq refer to the values used in the estimator’s structure, while Rsn and Lqn refer to the nominal values which were used in the simulation model of a synchronous generator.
Results of the parameters sensitivity analysis, presented in Figure 20, suggest that the uncertainty of the stator resistance value has practically no influence on the estimation errors. On the other hand, variation of the quadrature axis inductance value in the considered range affects estimation accuracy more significantly.

4. Conclusions

In this paper, a load angle estimator is proposed for a salient-pole wound rotor synchronous generator connected to the power system. Several case studies have shown that proposed estimator offers a satisfactory estimation accuracy during active and reactive power disturbances, both in the steady and transient state of the stable generator operation. Moreover, when compared to the conventionally applied load angle estimator based on the generator’s voltage-current phasor diagram, the estimator proposed in this paper provides significant performance improvements. As the experimental measurements were not available to us, the future study should include the experimental verification of the proposed estimator on the actual system, by applying it to the real measurements of generator currents and voltages, and by comparing the obtained estimated values to the load angle signal obtained by the measuring equipment. It has also been shown that estimation accuracy depends on the accurate knowledge of the quadrature axis inductance, while stator resistance uncertainties have practically no influence on it. Therefore, the future research may include work on the improvement of the estimator’s robustness by introducing various schemes for the online estimation of the generator’s parameters to its structure. Moreover, since the proposed estimator has shown a good potential for the load angle determination in the stable operating range of the generator, the future research will focus on the application of load angle values obtained by this estimator in power system stabilizers and excitation control systems, where the estimated load angle signal may be used as an additional control input in order to improve the stability of a synchronous generator.

Author Contributions

Conceptualization, N.L. and N.B.; methodology, N.L.; software, N.L.; validation, N.L.; formal analysis, N.L. and N.B.; investigation, N.L.; resources, N.L., N.B. and N.V.; data curation, N.L., N.B. and N. V.; writing—original draft preparation, N.L.; writing—review and editing, N.L., N.B. and N.V.; visualization, N.L.; supervision, N.B. and N.V.; project administration, N.B.; funding acquisition, N.B.

Funding

This work has been fully supported by the University of Rijeka under the project number uniri-tehnic-18-74.

Conflicts of Interest

The authors declare no conflict of interest.

Appendix A

Table A1. Synchronous generator nominal data.
ParameterSymbolValueUnit
Apparent powerSn155MVA
VoltageUsn15.75kV
CurrentIsn5.682kA
Power factorcosφn0.89
Speednn600rpm
Frequencyfn50Hz
Moment of inertiaJ260 000kgm2
Table A2. Synchronous generator parameters.
ParameterSymbolValueUnit
Stator resistanceRs0.00189Ω
Stator leakage reactanceXl0.208Ω
d-axis synchronous reactance X d 1.825Ω
d-axis transient reactance X d 0.560Ω
d-axis subtransient reactance X d 0.288Ω
q-axis synchronous reactance X q 1.088Ω
q-axis subtransient reactance X q 0.304Ω
d-axis transient open-circuit time constant T d 0 9.8s
d-axis subtransient open-circuit time constant T d 0 0.073s
q-axis subtransient open-circuit time constant T q 0 0.270s
Table A3. Transformer nominal data.
ParameterSymbolValueUnit
Apparent powerStn155MVA
Frequencyftn50Hz
Primary voltageUt1n400kV
Secondary voltageUt2n15.75kV
Table A4. Transmission lines parameters.
ParameterSymbolValueUnit
ResistanceRL0.0370Ω/km
InductanceLL0.0012H/km
LengthlL20km

References

  1. Anderson, P.M.; Fouad, A.A. Power System Control and Stability, 2nd ed.; John Wiley & Sons: Hoboken, NJ, USA, 2003; ISBN 0-471-23862-7. [Google Scholar]
  2. Kundur, P. Power System Stability and Control, 3rd ed.; McGraw-Hill Education: New York, NY, USA, 1994; ISBN 0-07-035958-X. [Google Scholar]
  3. Sumina, D.; Bulić, N.; Erceg, I. Three-dimensional power system stabilizer. Electr. Power Syst. Res. 2010, 80, 886–892. [Google Scholar] [CrossRef]
  4. Sumina, D.; Bulić, N.; Vražić, M. Load Angle Control of a Synchronous Generator. Prz Elektrotechniczn 2012, 88, 225–231. [Google Scholar]
  5. Kaňuch, J.; Girovský, P. The device to measuring of the load angle for salient-pole synchronous machine in education laboratory. Measurement 2018, 116, 49–55. [Google Scholar] [CrossRef]
  6. Despalatović, M.; Jadrić, M.; Terzić, B. Real-time power angle determination of salient-pole synchronous machine based on air gap measurements. Electr. Power Syst. Res. 2008, 78, 1873–1880. [Google Scholar] [CrossRef]
  7. Sumina, D.; Šala, A.; Malarić, R. Determination of Load Angle for Salient-pole Synchronous Machine. Meas. Sci. Rev. 2010, 10, 89–96. [Google Scholar] [CrossRef]
  8. Idžotić, T.; Erceg, G.; Sumina, D. Synchronous Generator Load Angle Measurement and Estimation. Automatika 2004, 45, 179–186. [Google Scholar]
  9. Venkatasubramanian, V.; Kavasseri, R.G. Direct computation of generator internal dynamic states from terminal measurements. In Proceedings of the 37th Annual Hawaii International Conference on System Sciences, Big Island, HI, USA, 5–8 January 2004. [Google Scholar]
  10. Del Angel, A.; Glavic, M.; Wehenkel, L. Using artificial neural networks to estimate rotor angles and speeds from phasor measurements. In Proceedings of the Intelligent System Applications in Power ISAP2003, Lemnos, Greece, 2003; Available online: http://citeseerx.ist.psu.edu/viewdoc/download?doi=10.1.1.151.7413&rep=rep1&type=pdf (accessed on 27 April 2019).
  11. Del Angel, A.; Geurts, P.; Ernst, D.; Glavic, M.; Wehenkel, L. Estimation of rotor angles of synchronous machines using artificial neural networks and local PMU-based quantities. Neurocomputing 2007, 70, 2668–2678. [Google Scholar] [CrossRef]
  12. Mišković, M.; Erceg, G.; Mirošević, M. Load angle estimation of a synchronous generator using dynamical neural networks. Energija 2009, 2, 174–191. [Google Scholar]
  13. Wang, Y.; Wang, X.; Xie, W.; Dou, M. Full-Speed Range Encoderless Control for Salient-Pole PMSM with a Novel Full-Order SMO. Energies 2018, 11, 2423. [Google Scholar] [CrossRef]
  14. Wang, M.-S.; Tsai, T.-M. Sliding Mode and Neural Network Control of Sensorless PMSM Controlled System for Power Consumption and Performance Improvement. Energies 2017, 10, 1780. [Google Scholar] [CrossRef]
  15. Luo, X.; Niu, S. Maximum Power Point Tracking Sensorless Control of an Axial-Flux Permanent Magnet Vernier Wind Power Generator. Energies 2016, 9, 581. [Google Scholar] [CrossRef]
  16. Sellami, T.; Berriri, H.; Jelassi, S.; Darcherif, A.M.; Mimouni, M.F. Short-Circuit Fault Tolerant Control of a Wind Turbine Driven Induction Generator Based on Sliding Mode Observers. Energies 2017, 10, 1611. [Google Scholar] [CrossRef]
  17. Fang, H.; Derong, L.; Chengwei, L.; Zhuo, L.; Gongping, W. Cascaded Robust Fault-Tolerant Predictive Control for PMSM Drives. Energies 2018, 11, 3087. [Google Scholar]
  18. Chavira, F.; Ortega-Cisneros, S.; Rivera, J. A Novel Sliding Mode Control Scheme for a PMSG-Based Variable Speed Wind Energy Conversion System. Energies 2017, 10, 1476. [Google Scholar] [CrossRef]
  19. Merabet, A. Adaptive Sliding Mode Speed Control for Wind Energy Experimental System. Energies 2018, 11, 2238. [Google Scholar] [CrossRef]
  20. Zribi, M.; Alrifai, M.; Rayan, M. Sliding Mode Control of a Variable- Speed Wind Energy Conversion System Using a Squirrel Cage Induction Generator. Energies 2017, 10, 604. [Google Scholar] [CrossRef]
  21. Song, Q.; Li, Y.; Jia, C. A Novel Direct Torque Control Method Based on Asymmetric Boundary Layer Sliding Mode Control for PMSM. Energies 2018, 11, 657. [Google Scholar] [CrossRef]
  22. Ji, K.; Huang, S. Direct Flux Control for Stand-Alone Operation Brushless Doubly Fed Induction Generators Using a Resonant-Based Sliding-Mode Control Approach. Energies 2018, 11, 814. [Google Scholar]
  23. Zoghlami, M.; Kadri, A.; Bacha, F. Analysis and Application of the Sliding Mode Control Approach in the Variable-Wind Speed Conversion System for the Utility of Grid Connection. Energies 2018, 11, 720. [Google Scholar] [CrossRef]
  24. Utkin, V.; Guldner, J.; Shi, J. Sliding Mode Control in Electro-Mechanical Systems, 2nd ed.; CRC Press: Boca Raton, FL, USA, 2009; ISBN 978-1-4200-6560-2. [Google Scholar]
  25. Vas, P. Sensorless Vector and Direct Torque Control; Monographs in Electrical and Electronic Engineering; Oxford University Press: Oxford, UK, 1998; ISBN 978-0-19-856465-2. [Google Scholar]
  26. Liu, J.; Nondahl, T.A.; Schmidt, P.B.; Royak, S.; Harbaugh, M. Rotor Position Estimation for Synchronous Machines Based on Equivalent EMF. IEEE Trans. Ind. Appl. 2011, 47, 1310–1318. [Google Scholar]
  27. Qiao, Z.; Shi, T.; Wang, Y.; Yan, Y.; Xia, C.; He, X. New Sliding-Mode Observer for Position Sensorless Control of Permanent-Magnet Synchronous Motor. IEEE Trans. Ind. Electron. 2013, 60, 710–719. [Google Scholar] [CrossRef]
  28. Fan, Y.; Zhang, L.; Cheng, M.; Chau, K.T. Sensorless SVPWM-FADTC of a New Flux-Modulated Permanent-Magnet Wheel Motor Based on a Wide-Speed Sliding Mode Observer. IEEE Trans. Ind. Electron. 2015, 62, 3143–3151. [Google Scholar] [CrossRef]
  29. Zhao, Y.; Zhang, Z.; Qiao, W.; Wu, L. An Extended Flux Model-Based Rotor Position Estimator for Sensorless Control of Salient-Pole Permanent-Magnet Synchronous Machines. IEEE Trans. Power Electron. 2015, 30, 4412–4422. [Google Scholar] [CrossRef]
  30. Lin, S.; Zhang, W. An adaptive sliding-mode observer with a tangent function-based PLL structure for position sensorless PMSM drives. Int. J. Elec. Power. 2017, 88, 63–74. [Google Scholar] [CrossRef]
  31. Liang, D.; Li, J.; Qu, R.; Kong, W. Adaptive Second-Order Sliding-Mode Observer for PMSM Sensorless Control Considering VSI Nonlinearity. IEEE Trans. Power Electron. 2018, 33, 8994–9004. [Google Scholar] [CrossRef]
  32. Sheng, L.; Li, W.; Wang, Y.; Fan, M.; Yang, X. Sensorless Control of a Shearer Short-Range Cutting Interior Permanent Magnet Synchronous Motor Based on a New Sliding Mode Observer. IEEE Access. 2017, 5, 18439–18450. [Google Scholar] [CrossRef]
  33. Ouassaid, M.; Maaroufi, M.; Cherkaoui, M. Observer-based nonlinear control of power system using sliding mode control strategy. Electr. Power Syst. Res. 2012, 84, 135–143. [Google Scholar] [CrossRef]
  34. Jiang, L.; Wu, Q.H.; Zhang, C.; Zhou, X.X. Observer-based nonlinear control of synchronous generators with perturbation estimation. Int. J. Electr. Power Energy Syst. 2001, 23, 359–367. [Google Scholar] [CrossRef]
  35. Loukianov, A.G.; Canedo, J.M.; Utkin, V.I.; Cabrera-Vazquez, J. Discontinuous Controller for Power Systems: Sliding-Mode Block Control Approach. IEEE Trans. Ind. Electron. 2004, 51, 340–353. [Google Scholar] [CrossRef]
Figure 1. Voltage-current phasor diagram of a synchronous generator.
Energies 12 01609 g001
Figure 2. Structure of the proposed sliding mode observer (SMO) based load angle estimator.
Energies 12 01609 g002
Figure 3. Synchronous generator connected to the power system.
Energies 12 01609 g003
Figure 4. Terminal voltage reference change for generator operating point P = 0.89, Q = 0.41 ind.
Energies 12 01609 g004
Figure 5. Generator power change during dynamic disturbances of reactive power for generator operating point P = 0.89, Q = 0.41 ind.: (a) Active power; (b) Reactive power.
Energies 12 01609 g005
Figure 6. Load angle variation during dynamic disturbances of reactive power for generator operating point P = 0.89, Q = 0.41 ind.: (a) Comparison of the actual and estimated load angle values; (b) Load angle estimation error.
Energies 12 01609 g006
Figure 7. Terminal voltage reference change for generator operating point P = 0.89, Q = 0.
Energies 12 01609 g007
Figure 8. Generator power change during dynamic disturbances of reactive power for generator operating point P = 0.89, Q = 0: (a) Active power; (b) Reactive power.
Energies 12 01609 g008
Figure 9. Load angle variation during dynamic disturbances of reactive power for generator operating point P = 0.89, Q = 0: (a) Comparison of the actual and estimated load angle values; (b) Load angle estimation error.
Energies 12 01609 g009
Figure 10. Terminal voltage reference change for generator operating point P = 0.89, Q = 0.11 cap.
Energies 12 01609 g010
Figure 11. Generator power change during dynamic disturbances of reactive power for generator operating point P = 0.89, Q = 0.11 cap.: (a) Active power; (b) Reactive power.
Energies 12 01609 g011
Figure 12. Load angle variation during dynamic disturbances of reactive power for generator operating point P = 0.89, Q = 0.11 cap.: (a) Comparison of the actual and estimated load angle values; (b) Load angle estimation error.
Energies 12 01609 g012
Figure 13. Input mechanical power change.
Energies 12 01609 g013
Figure 14. Generator power change during dynamic disturbances of active power for generator operating point P = 0.89, Q = 0.41 ind.: (a) Active power; (b) Reactive power.
Energies 12 01609 g014
Figure 15. Load angle variation during dynamic disturbances of active power for generator operating point P = 0.89, Q = 0.41 ind.: (a) Comparison of the actual and estimated load angle values; (b) Load angle estimation error.
Energies 12 01609 g015
Figure 16. Generator power change during dynamic disturbances of active power for generator operating point P = 0.89, Q = 0: (a) Active power; (b) Reactive power.
Energies 12 01609 g016
Figure 17. Load angle variation during dynamic disturbances of active power for generator operating point P = 0.89, Q = 0: (a) Comparison of the actual and estimated load angle values; (b) Load angle estimation error.
Energies 12 01609 g017
Figure 18. Generator power change during dynamic disturbances of active power for generator operating point P = 0.89, Q = 0.11 cap.: (a) Active power; (b) Reactive power.
Energies 12 01609 g018
Figure 19. Load angle variation during dynamic disturbances of active power for operating point P = 0.89, Q = 0.11 cap.: (a) Comparison of the actual and estimated load angle values; (b) Load angle estimation error.
Energies 12 01609 g019
Figure 20. Mean absolute error (MAE) and Maximum absolute error (MAXE) of the SMO based load angle estimator due to the variation of the estimator’s parameter: (a) Stator resistance Rs; (b) Quadrature axis inductance Lq.
Energies 12 01609 g020
Table 1. Performance indices of the SMO (sliding mode observer)-based estimator and the phasor diagram based estimator during dynamic disturbances of reactive power for generator operating point P = 0.89, Q = 0.41 ind. MSE: Mean squared error; MAE: Mean absolute error; MAXE: Maximum absolute error.
Estimator TypeMSEMAEMAXE
SMO-based estimator0.11650.09772.1682
Phasor diagram based estimator0.12790.13122.3217
Table 2. Relative performance improvement of the SMO-based estimator over the phasor diagram based estimator during dynamic disturbances of reactive power for generator operating point P = 0.89, Q = 0.41 ind.
Performance Indices ImprovementMSEMAEMAXE
Relative improvement (%)8.9125.536.61
Table 3. Performance indices of the SMO-based estimator and the phasor diagram based estimator during dynamic disturbances of reactive power for generator operating point P = 0.89, Q = 0.
Estimator TypeMSEMAEMAXE
SMO-based estimator0.43720.21843.7164
Phasor diagram based estimator0.46880.25163.9163
Table 4. Relative performance improvement of the SMO-based estimator over the phasor diagram based estimator during dynamic disturbances of reactive power for generator operating point P = 0.89, Q = 0.
Performance Indices ImprovementMSEMAEMAXE
Relative improvement (%)6.7413.205.10
Table 5. Performance indices of the SMO-based estimator and the phasor diagram based estimator during dynamic disturbances of reactive power for generator operating point P = 0.89, Q = 0.11 cap.
Estimator TypeMSEMAEMAXE
SMO-based estimator0.65050.30134.1189
Phasor diagram based estimator0.69600.33344.3391
Table 6. Relative performance improvement of the SMO-based estimator over the phasor diagram based estimator during dynamic disturbances of reactive power for generator operating point P = 0.89, Q = 0.11 cap.
Performance Indices ImprovementMSEMAEMAXE
Relative improvement (%)6.549.635.07
Table 7. Performance indices of the SMO-based estimator and the phasor diagram based estimator during dynamic disturbances of active power for generator operating point P = 0.89, Q = 0.41 ind.
Estimator TypeMSEMAEMAXE
SMO-based estimator0.01950.04150.9185
Phasor diagram based estimator0.02270.07101.0073
Table 8. Relative performance improvement of the SMO-based estimator over the phasor diagram based estimator during dynamic disturbances of active power for generator operating point P = 0.89, Q = 0.41 ind.
Performance Indices ImprovementMSEMAEMAXE
Relative improvement (%)14.1041.558.81
Table 9. Performance indices of the SMO-based estimator and the phasor diagram based estimator during dynamic disturbances of active power for generator operating point P = 0.89, Q = 0.
Estimator TypeMSEMAEMAXE
SMO-based estimator0.03930.06261.2412
Phasor diagram based estimator0.04330.09071.3347
Table 10. Relative performance improvement of the SMO-based estimator over the phasor diagram based estimator during dynamic disturbances of active power for generator operating point P = 0.89, Q = 0.
Performance Indices ImprovementMSEMAEMAXE
Relative improvement (%)9.2430.987.01
Table 11. Performance indices of the SMO-based estimator and the phasor diagram based estimator during dynamic disturbances of active power for generator operating point P = 0.89, Q = 0.11 cap.
Estimator TypeMSEMAEMAXE
SMO-based estimator0.04810.07361.3355
Phasor diagram based estimator0.05260.10091.4263
Table 12. Relative performance improvement of the SMO-based estimator over the phasor diagram based estimator during dynamic disturbances of active power for generator operating point P = 0.89, Q = 0.11 cap.
Performance Indices ImprovementMSEMAEMAXE
Relative improvement (%)8.5527.066.37

