Abstract
The imperative to reduce emissions to counteract climate change has led to the use of renewables progressively in more areas. Looking at district heating, there is a growing interest in coupling current production systems and carbon-neutral technologies. This paper presents a methodology to support decision making about carbon-neutral technologies for district heating. The process is organized in two stages, the first one aims at optimizing the different carbon-neutral technologies according to an objective function and assess uncertainties and dependencies. In the second stage, the alternatives are evaluated using Stochastic Multicriteria Acceptability Analysis (SMAA), a simulation-based method specifically designed to consider imprecise information. The methodology was applied to a case-study in Torino, Italy, which simulates the city district heating network at a smaller scale, with the aim to explore strategies for replacing gas boiler with more sustainable technologies. According to preference information provided by decision makers, the most preferred alternative resulted in the introduction of a solar heat plant combined with an increase size of daily heat storage. Solar heat can benefit from incentives while reducing operational costs and emissions, maximizing the use of carbon-neutral heat thanks to the storage.
1. Introduction
The transition toward a sustainable society is rooted in the use of renewable and carbon-neutral technologies, which have increased their share from 11 to 18% in the last 10 years in Europe [1]. However, these efforts proved not to be sufficient to meet the ambitious emissions reduction target set by EU for 2050, i.e., reducing emissions by 80–95% compared to the 1990 levels [2]. To achieve these goals, two complementary approaches have been used: Increase energy efficiency of end-users and integrate renewables in the energy production system, as indicated in References [3,4].
Several studies analyzed the design of 100% renewable energy systems [5,6] with a major attention on the electricity production rather than on the heat production. However, as highlighted in Heat roadmap Europe [7], the role of thermal energy production is fundamental, as it represents half of the energy produced with technologies having a high carbon dioxide emission factor. This study focuses then on the heat sector, in particular on district heating (DH), seen as the backbone for energy transition [3]. In fact, various studies have already demonstrated that the emissions can be reduced through the integration of renewable energy sources in DH systems [8,9,10].
According to EU targets, the decision between different alternatives should take into account not only economic criteria, but also environmental and technical ones. Therefore, to analyze the complexity of the sustainability problem, Multicriteria Decision Support (MCDS) [11] methods are helpful in the decision-making process. MCDS is an approach that helps addressing complex problems, involving high uncertainty, conflicting objectives, multi-interests and perspectives. Such methods can provide solutions to complex energy management problems, especially considering the increasing attention for the environmental protection, as reviewed in Reference [12]. Many studies have analyzed power systems, including solar power [13,14], wind power [15,16], and mixed heat and power systems [17] by implementing MCDS.
Several MCDS methodologies for energy applications are based on deterministic analysis [18] and their applications have been focused mainly on the electricity sector. Considering the rapid change, the energy infrastructure should face for addressing the emission targets, new methodological approaches capable to properly account stochastic variables and poor information need to be developed.
The Stochastic Multicriteria Acceptability Analysis (SMAA) method, introduced by Lahdelma et al. [19], was developed for decision problems where criteria and preference information are uncertain, inaccurate or partly missing. SMAA has been applied to several different problems, including energy policy assessment [20], energy monitoring system selection [21], combined heat and power (CHP) plant selection [22], heating choices for a new residential area [23], and carbon-neutral technologies for DH [24]. In Reference [25] is presented a recent survey of SMAA methodology and applications.
This paper presents a methodology for supporting decision making of carbon-neutral technologies for DH, specifically designed to consider uncertainties and dependencies for both baseline system and energy system alternatives.
The novelty of the approach is that, differently from the most common MCDS methods, it can consider stochastic variables in the analysis, and, in contrast to earlier SMAA applications in the energy field, it uses a correlation matrix, to properly taken into account the dependencies between criteria and alternatives. Moreover, a novel aspect of the paper with respect to existing literature (e.g., Reference [24]), is that the paper does not simply assess the best alternative to cover peak demand, but it also explores the interaction of the alternatives proposed with the existing system analyzed. This task is pursued by computing a correlation matrix, so that the analysis makes it possible to shift from a qualitative to a quantitative playground for assessing the dependencies among the alternatives.
In this paper, the proposed methodology is applied to the test case of university campus of Politecnico di Torino (PoliTo), of which the thermal load is satisfied by DH. Fitting the PoliTo heating load curve, the DH system is reproduced at a smaller scale, with the aim to replace the installed heat generation system with cheaper, more flexible and more sustainable technologies according to decision makers’ preferences. Section 2 explains the conceptual framework of the methodology, while Section 3 presents in detail the different methods used. Then, Section 4 introduces the case study to which the proposed methodology is applied. Section 5 presents criteria and alternative designs, and Section 6 the results. Discussion is presented in Section 7, and concluding remarks are given in Section 8.
2. Methodology
This paper aims to analyze in terms of multiple criteria how different low-carbon technologies can interact with a DH system. The methodology aims at supporting decision making in the DH field, with attention on cases affected by several parameters with uncertainties.
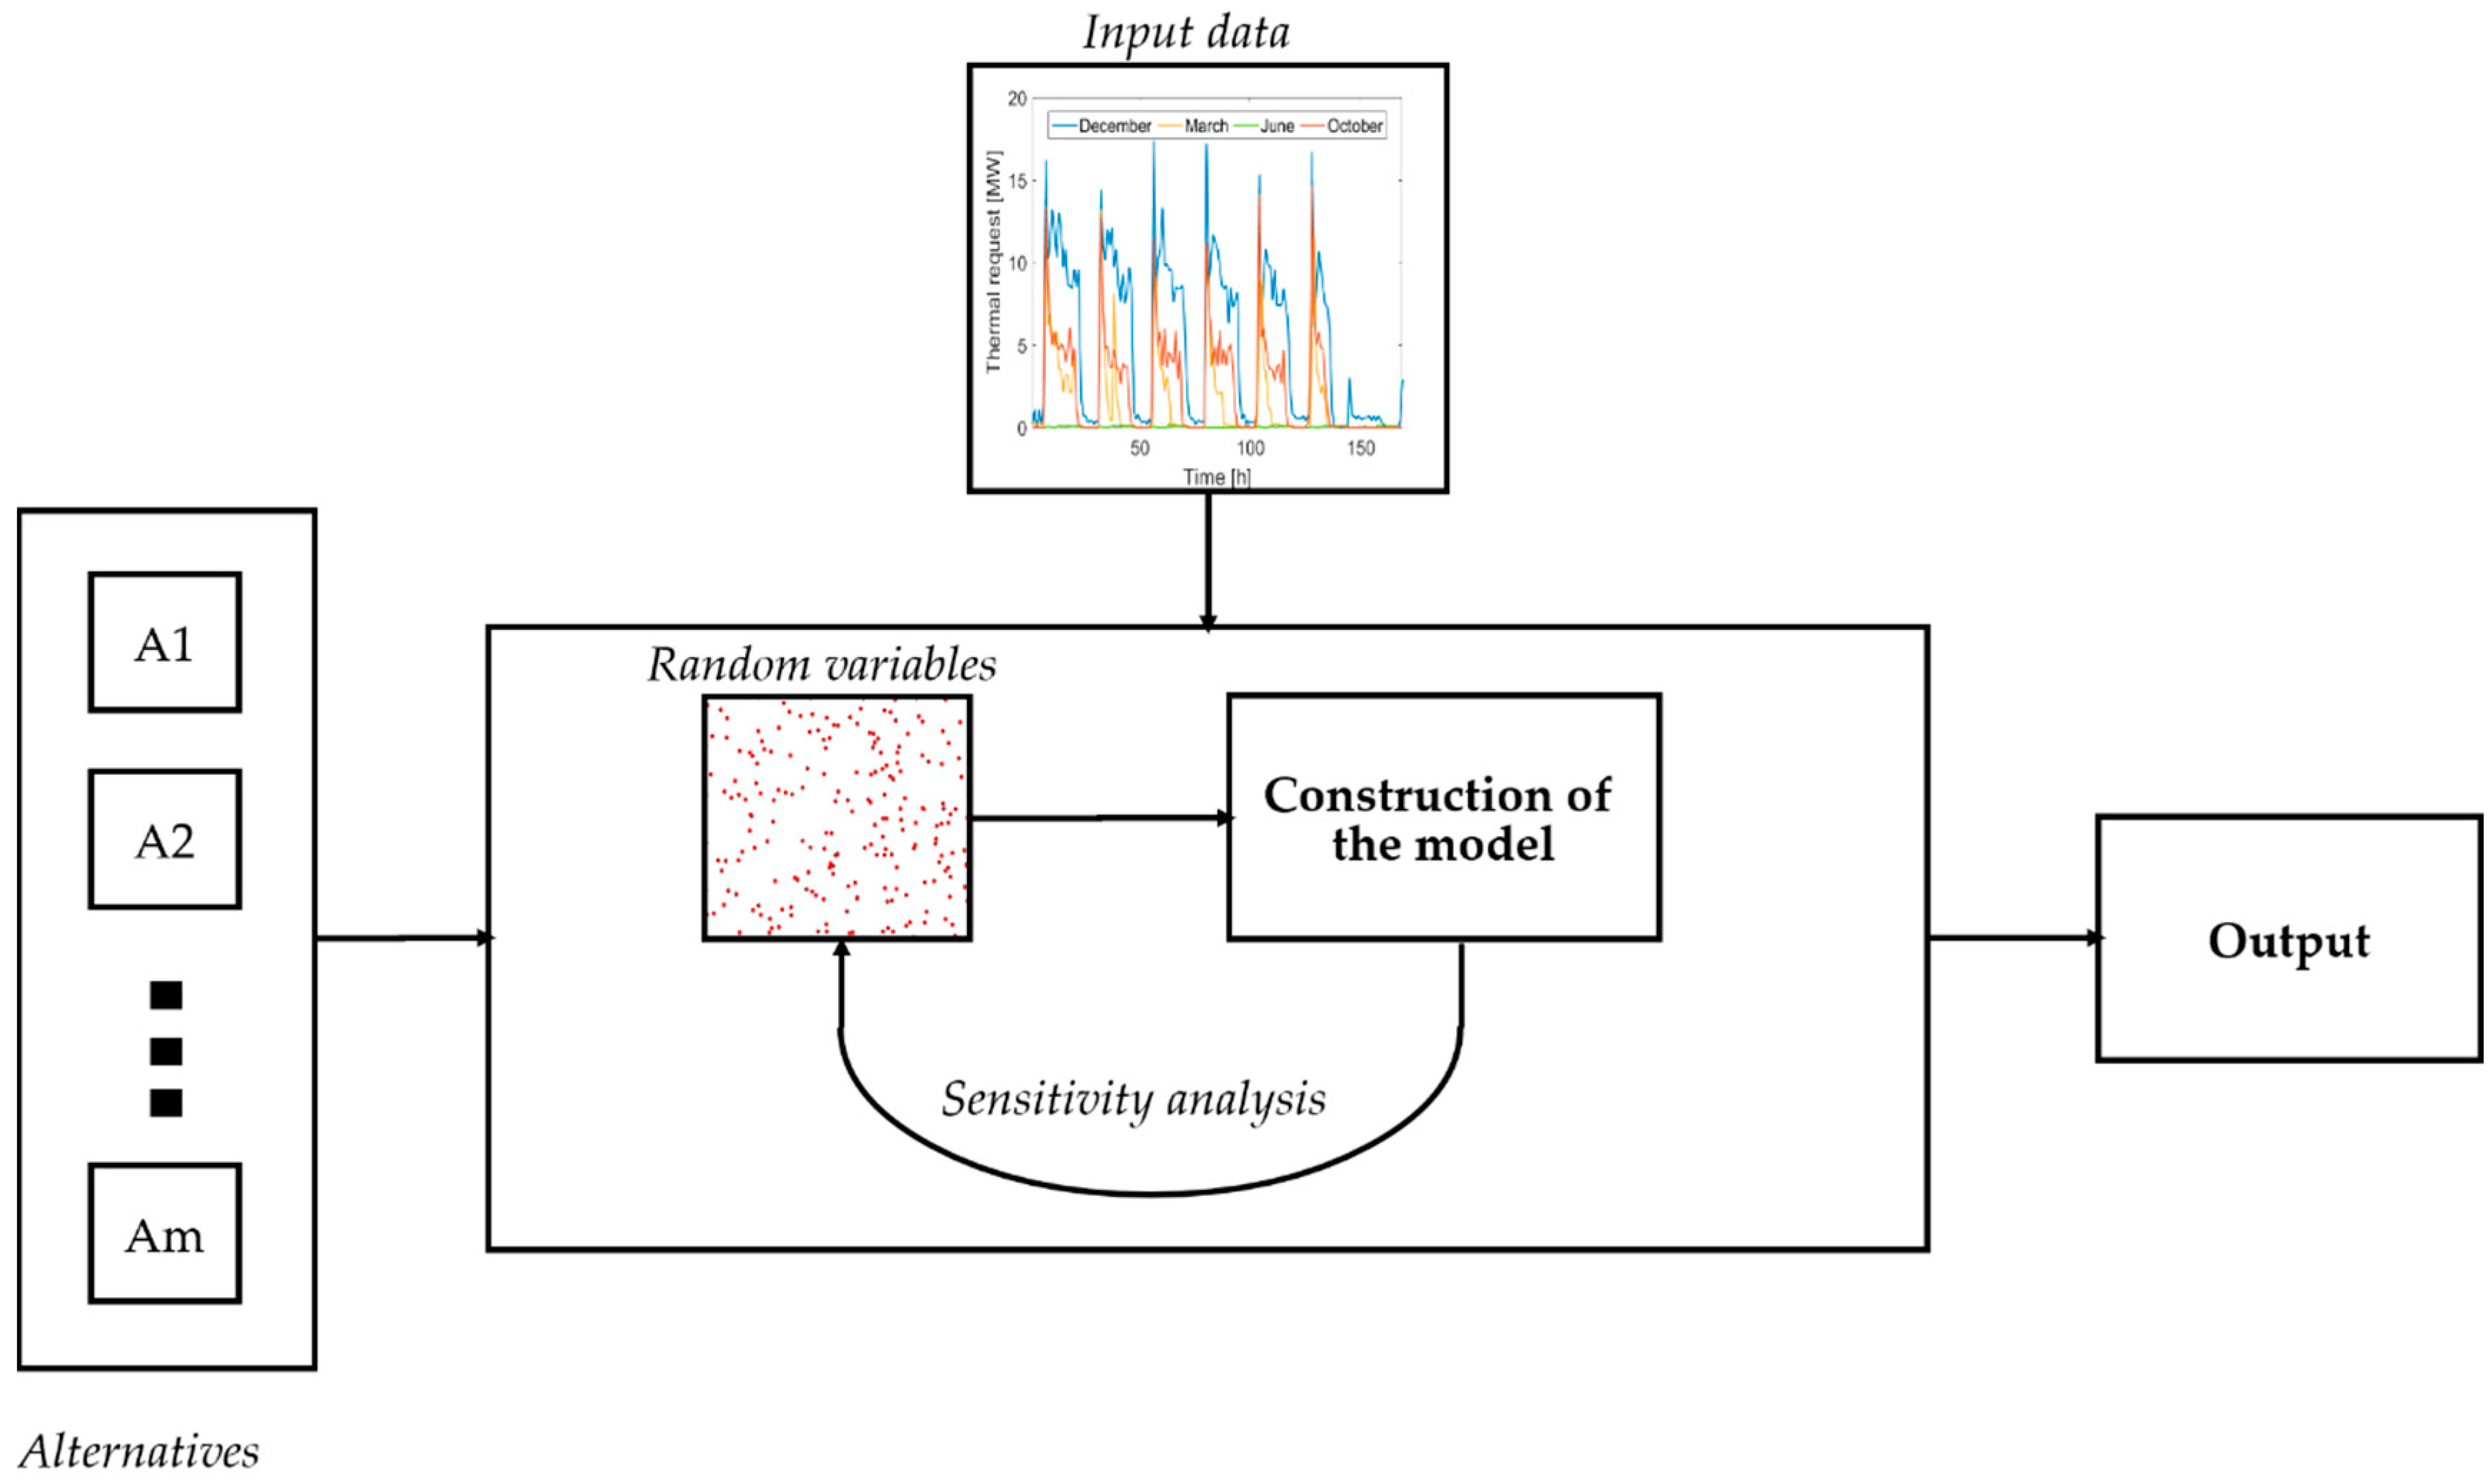
The analysis is organized in two stages. The first stage (Figure 1) consists of the simulation and optimization of the different energy system alternatives, in order to assess their performance according to different criteria. In this study, the LP2 [26] software was used and its operation is described in Section 3.1. To assess the uncertainties and their dependencies (correlations), a number of simulations were performed for all the alternatives with different random values of the stochastic parameters (e.g., fuel price and electricity price).
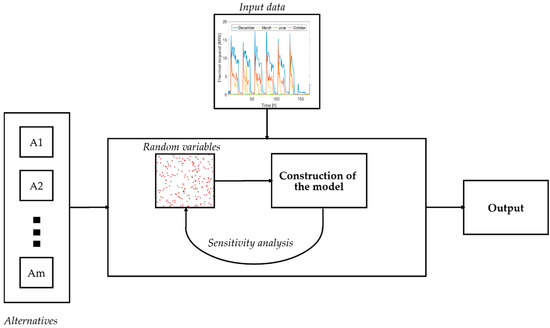
Figure 1.
Framework of the proposed methodology (Stage 1): Construction of the energy model, uncertainties and dependencies analysis for each alternative.
The outcomes of this first stage can be summarized in:
- A matrix containing mean value and uncertainties for each alternative and criteria;
- A correlation matrix.
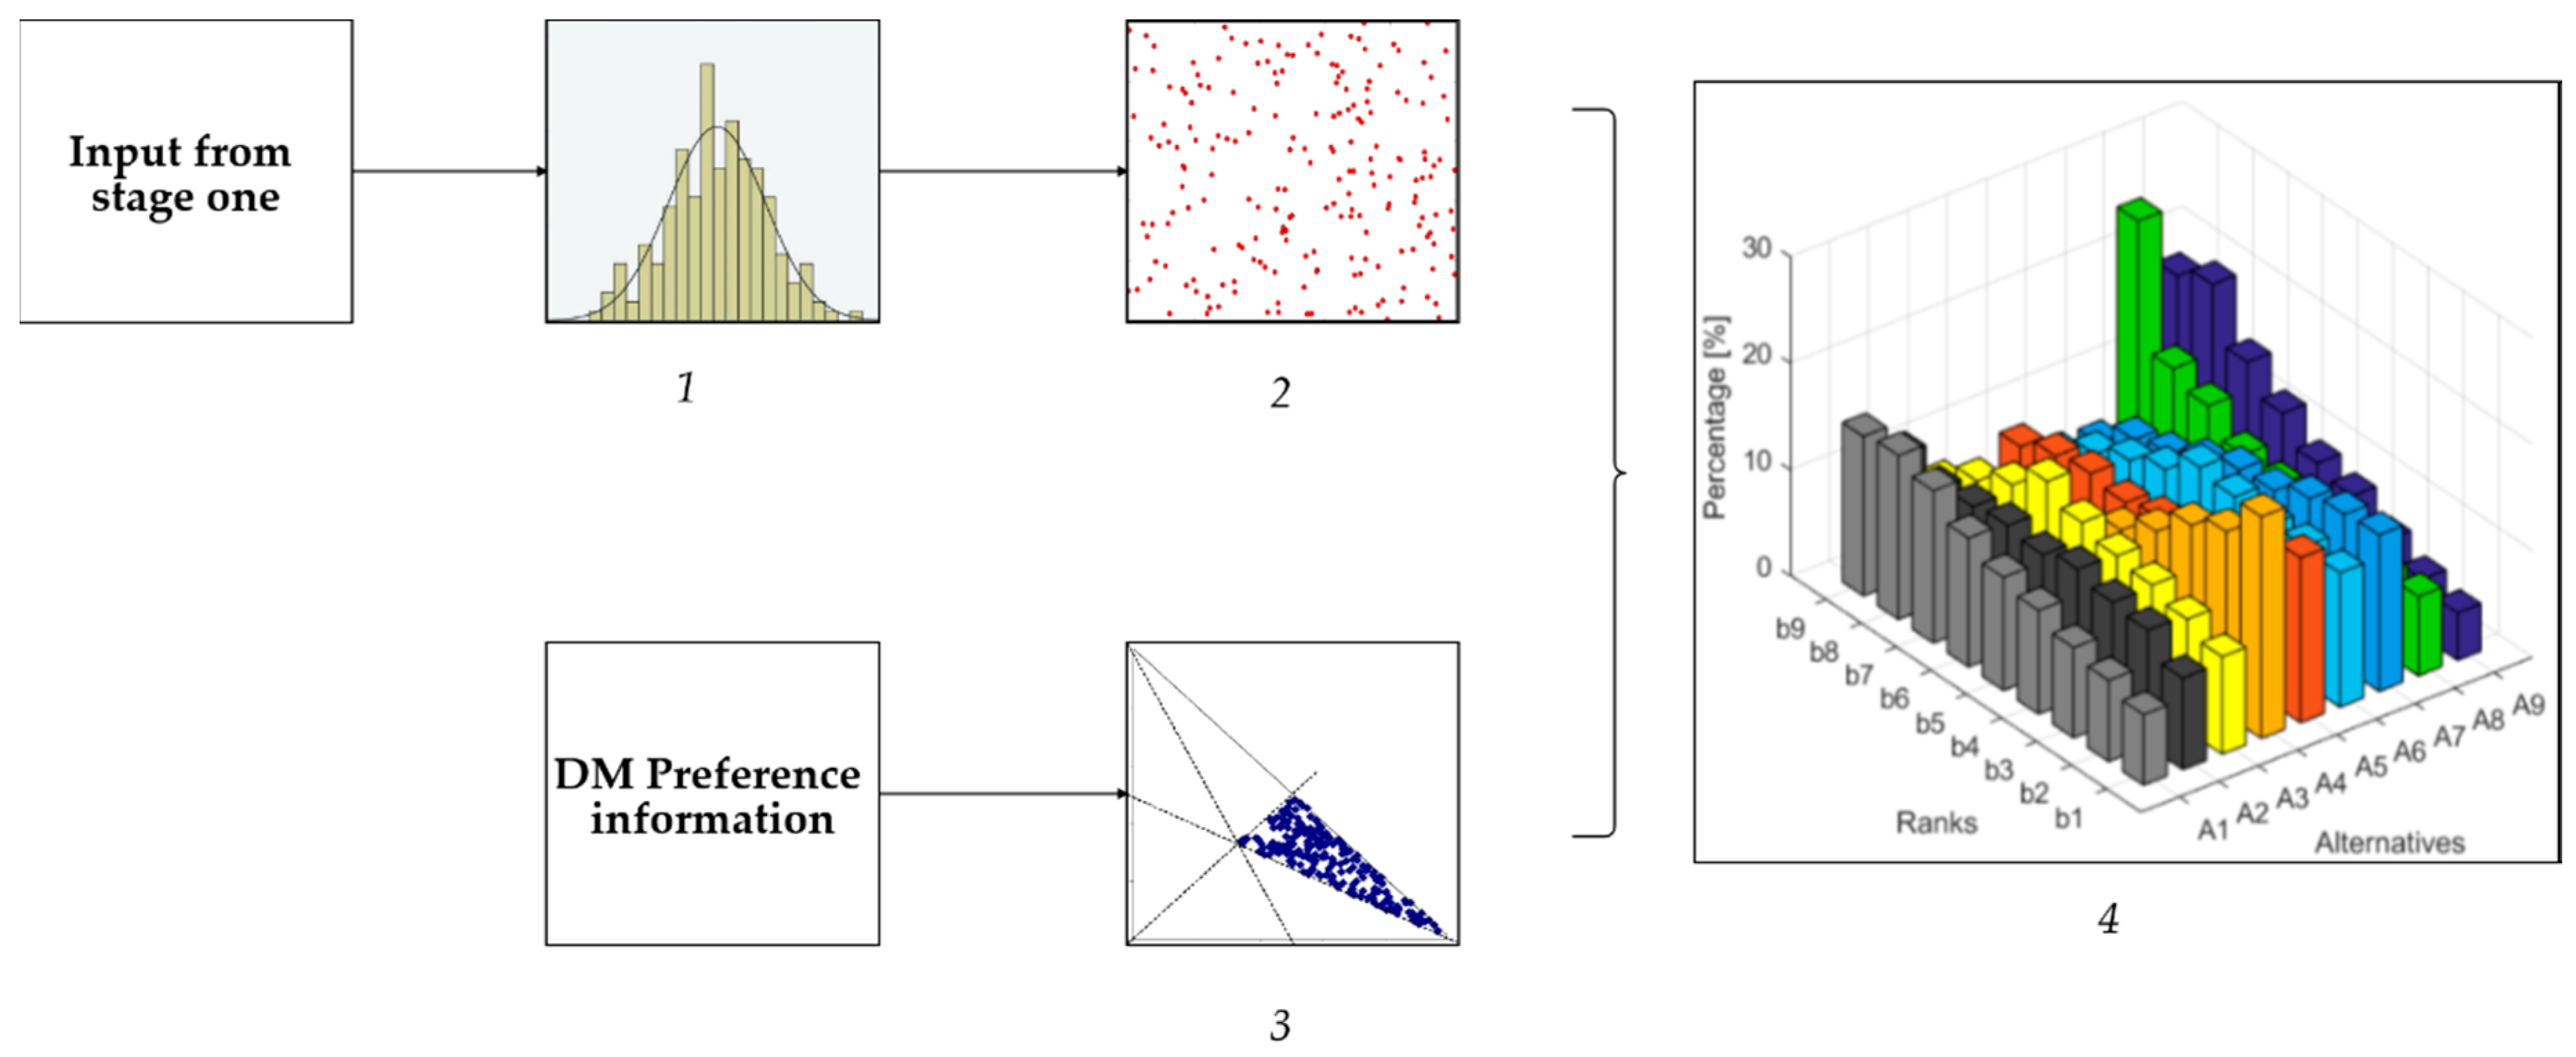
The second stage (Figure 2) consists of a multicriteria evaluation and a comparison of the different alternatives based on the results of the first stage. The SMAA method was used to identify the most “acceptable” alternative, as better specified in Section 3.2.

Figure 2.
Framework of the proposed methodology (Stage 2): (1) Definition of the PDF according to mean value and uncertainties; (2) random sample generation according to correlation matrix; (3) definition of feasible weight space; and (4) analysis of the results.
This stage involves the following steps:
- A first Monte Carlo simulation, performed on the basis of the outcome of the first stage in order to evaluate the acceptability of alternatives;
- The exploitation of preference information, used to restrict the feasible weight space for criteria;
- A second Monte Carlo simulation, performed to assess the confidence factors for the results.
The strength of the SMAA methodology consists in the ability to analyze alternatives with inaccurate or uncertain input data, even without explicit preferences of the decision makers (DM). A description of SMAA is provided in Section 3.2.
In the following, the methods used for the optimization process are briefly described, with the aim to clarify how the optimal solution is obtained and which parameters can affect it. In the same section, the SMAA method is described in more detail, highlighting the procedure adopted to consider uncertainties.
3. Methods
3.1. Simulation and Optimization
The operation of each alternative configuration was analyzed using a linear programming model. The model is solved using the LP2 software, which is based on the sparse revised Simplex algorithm and the product form of inverse [26]. LP2 has been used in several studies involving CHP and DH [27,28,29,30,31] and their interactions with renewable energy sources [32,33]. The model determines an optimal DH production planning according to a min/max function. The objective function considered in the present analysis is the minimization of the operating costs, further analyzed in Section 5. Consequently, the heat demand can be optimally satisfied, introducing an “overall rank order”. The overall rank order considers all costs, selecting the least expensive technologies for each time interval, providing a ranking from the cheapest technology to the most expensive one. In this way the heat demand can be satisfied using the cheapest combination of technologies.
The optimization procedure is divided in two steps:
- A sensitivity analysis is performed to gain maximum economic return from the introduction of each technology.
- The optimization is performed to satisfy the heat demand by maximizing the role of storage and the exploitation of renewable technologies.
The optimization procedure is further described in Section 5, while more detailed references on the method can be found in References [30,34].
3.2. Stochastic Multicriteria Acceptability Analysis
The SMAA method [19,35] was applied for evaluating and comparing the different alternatives. The SMAA is based on exploring the weight space of the criteria to describe the preferences that would make each alternative the most preferred one (or that would give a certain rank). The method has been developed for multicriteria decision making problems with multiple DMs and uncertain or partly missing information.
The decision problem is formulated as a set of m alternatives to be evaluated in terms of n criteria. The decision makers’ preference structure is represented by a value function , that maps the different alternatives by using a weight vector . The weights are non-negative and normalized, so that the feasible weight space is defined as follows:
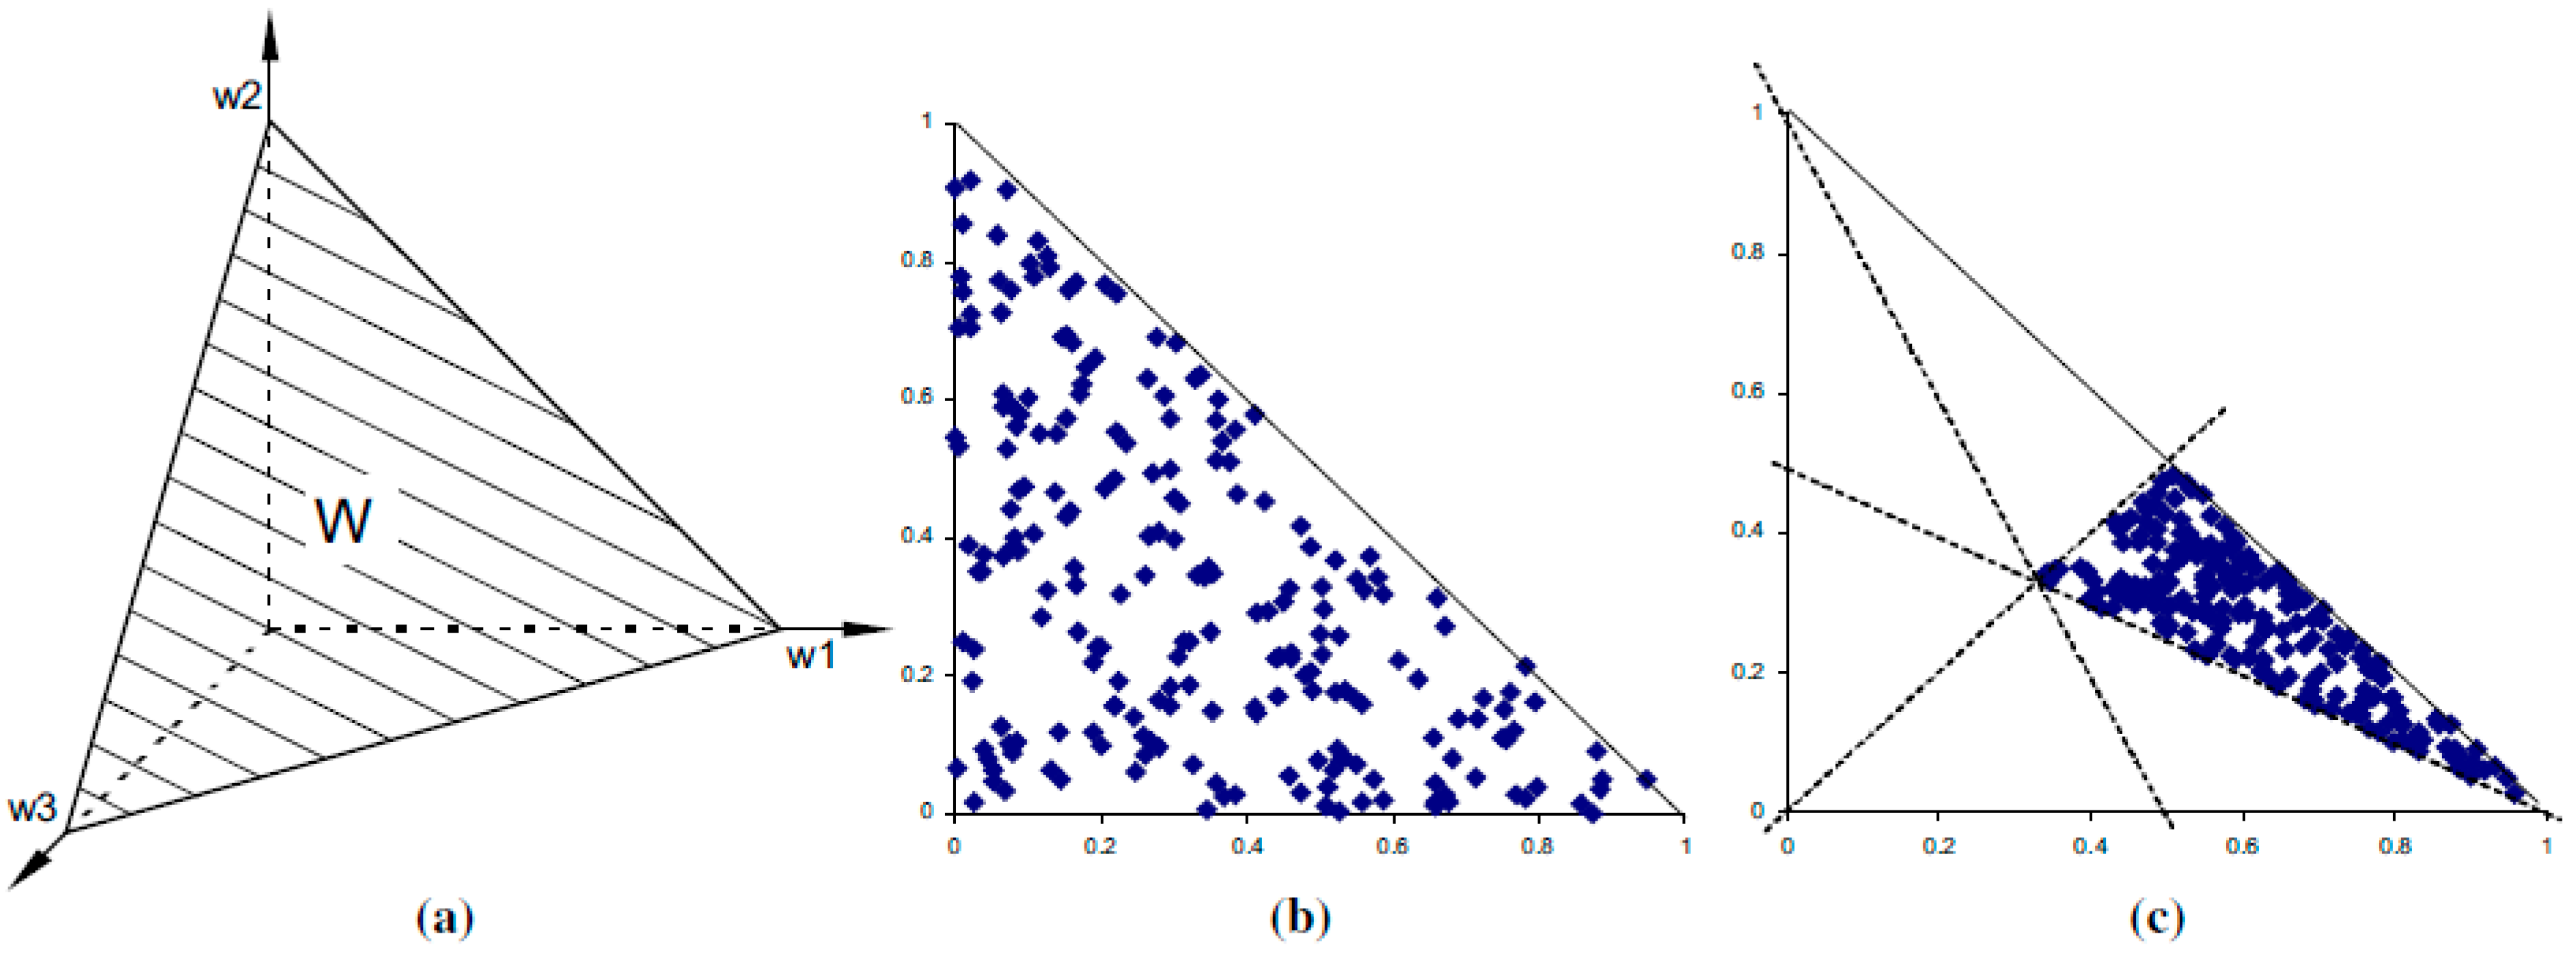
Figure 3a shows the feasible weight space in a 3-dimensional case. The DM’s preferences about weights are represented by suitable weight distribution with joint probability density function (PDF) in the feasible weight space . Uncertain or imprecise criteria are represented by a matrix of stochastic variable with joint probability density function in the space . Since all infos are represented as distributions, a Monte-Carlo simulation is used to analyze the problem efficiently. When evaluating each alternative, K = 10,000 simulation rounds were used; this sample size is sufficiently large to make the standard error of the expected value small compared to the variance ().

Figure 3.
(a) Feasible weight space in the 3-criterion case; (b) uniform sampling projected on w1-w2 plane; and (c) uniformly distributed weight with ordinal information (w1 ≥ w2 ≥ w3).
The DMs’ preference structure is represented by a value function , used to map stochastic criteria and weights, evaluating each alternative through an additive value function, as reported in Equation (2):
SMAA calculations were implemented generating simultaneously criteria measurements and weights from their distribution (to consider uncertainties), then, the value function was applied to rank the alternatives. The calculation was repeated K times and the following statistics about the performance of the alternatives were computed:
- : the number of times alternative obtained rank ;
- : sum of the weight vectors that made alternative most preferred.
Figure 3b shows a uniform distribution of the weights in a 3-dimensional space without preference information. From the statistics collected, the basic SMAA measures, rank acceptability indices, central weight vectors and confidence factors are computed.
The rank acceptability index measures the variety of different preferences that place alternative on rank . It is the share of all feasible weights that make the alternative acceptable for a certain rank. The first rank acceptability index is the probability that the alternative is most preferred. The rank acceptability indices are estimated as follows:
Alternatives with high acceptability for the best ranks are taken as candidates for the most acceptable solutions, while alternatives with low or zero acceptability are excluded. If there are no clear preferences for the best ranks, the method indicates the need to analyze the problem more thoroughly, including dependency information and a detailed analysis of criteria and weights preferences.
The central weight vector is the expected center of gravity of the favorable first rank weights of an alternative.
It is estimated as follows:
The central weight vector represents the preferences of a hypothetical DM supporting this alternative. Presenting the central weights of different alternatives to the DMs may help them to understand how different weights correspond to different choices with the assumed preference model, or even help the DMs to express their preferences in term of weights.
The confidence factor is the probability for an alternative to obtain the first rank when the central weight vector is chosen. Since central weights are available only after SMAA simulation, a second simulation is needed to compute the confidence factors. The additional statistics represents the number of times alternative obtaines rank 1 using central weights vector and it is used to estimate confidence factor as follows:
The confidence factor measures whether the criteria data are accurate enough to discern the efficient alternatives, and it is equal to the first rank acceptability index using precise information on weights. To increase the confidence factor specific analysis on uncertainties (as dependencies analysis by means of correlation matrix) could be performed.
Modelling Uncertainties
In this application, both ordinal and cardinal criteria measurements were applied:
- Ordinal criteria (Flexibility) are measured by ranking the alternatives from the best (1) to the worst (m). An ordinal scale does not include information about the intervals between the steps of the scale, i.e. how much better each rank is with respect to rank remains uncertain. Ordinal uncertainty was handled by assigning to different ranks stochastic cardinal values in the range so that they are consistent with the ranking information.
- For cardinal criteria, partial values were computed from the criteria measurements by linear scaling according to Equation (6) so that the best outcome for each criterion corresponds to 1 and the worst to 0.
4. Case Study
In this section the thermal load of the university campus of PoliTo is analyzed. First, a glance of DH system of Turin municipality is provided, then the case study is analyzed, proposing a method to overcome the mismatch between the production system size and the size of the considered substation.
Turin is the capital of the Piedmont region in North-West of Italy. The city characterized by a continental climate (2617 heating degree days) and has approximately 900,000 inhabitants. Despite being the city with the widest DH coverage in Italy, the city DH system has still large expansion possibilities. Today, the generation mix is composed of three natural gas CHP plants (740 MW), 1000 MW of auxiliary gas boilers and 12,500 million m3 of daily heat storage via water tanks.
The case study focuses on a part of Turin city, the university campus of PoliTo. The PoliTo LivingLAB [36] provided data on thermal load of the different buildings of the campus.
Since the campus represents only a substation of the DH system, introducing large-scale alternatives in the current DH network would not allow to directly evaluate benefits, due to lower order of magnitude of the campus demand. To solve this problem and go on with the application of the methodology, a smaller production system was assumed to cover the campus heat demand. The production system was scaled down according to the ratio between the campus’ peak demand and Torino city’s peak demand [37].
The scaled system shows the same operation of plants of the system investigated in this paper, giving priority to CHP and using Heat Only produced by Boilers (HOB) only during peak hours. The resulting scenario represents the base case, used as reference for the alternatives explored and described in the next section.
The thermal load profile of the PoliTo building complex follows the academic pace and it is characterized by:
- Absence of a base load;
- Absence of heat demand when PoliTo is closed;
- A decreasing of heat demand after morning peak;
- Negligible heat demand during the summer season.
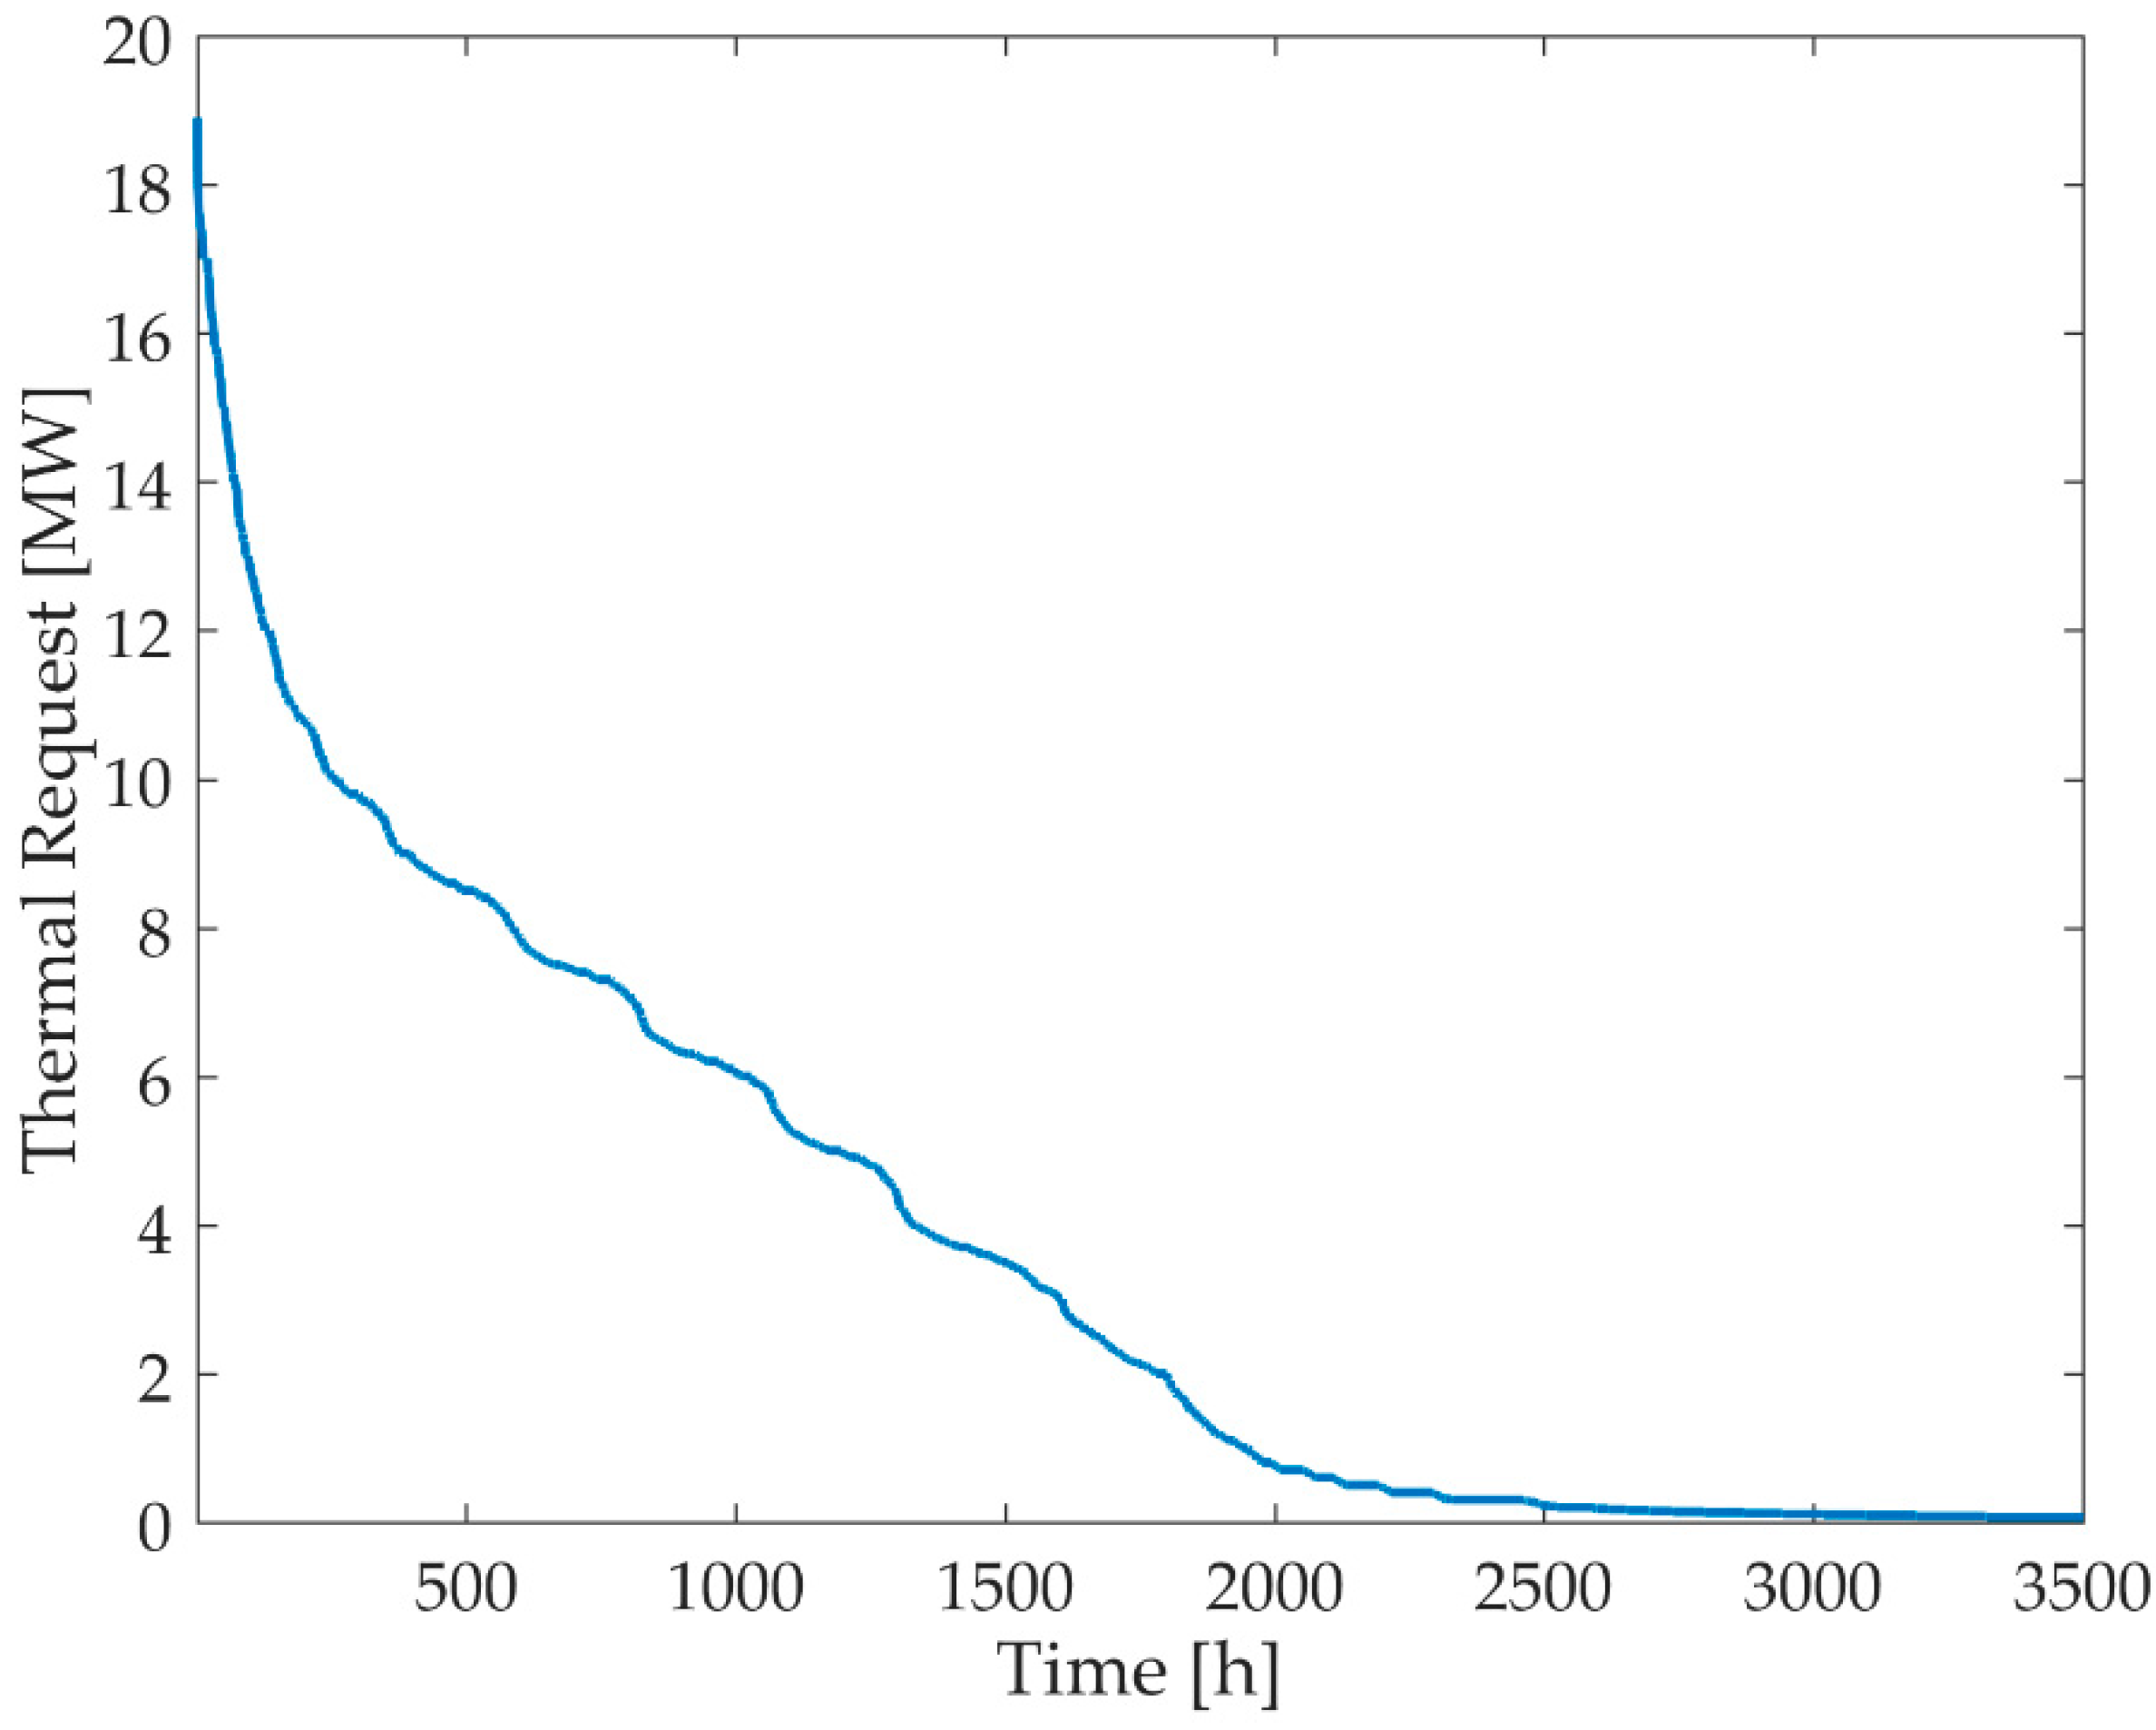
Figure 4 shows the annual heat load duration curve, which highlights how the absence of a base-load and the negligible demand during the summer period reduce the heat consumption. The heat load is higher than 0 MW for around 3000 h, higher than 5 MW for around 1250 h and higher than 10 MW for less than 500 h, highlighting the importance of the auxiliary system to cover the peak load.
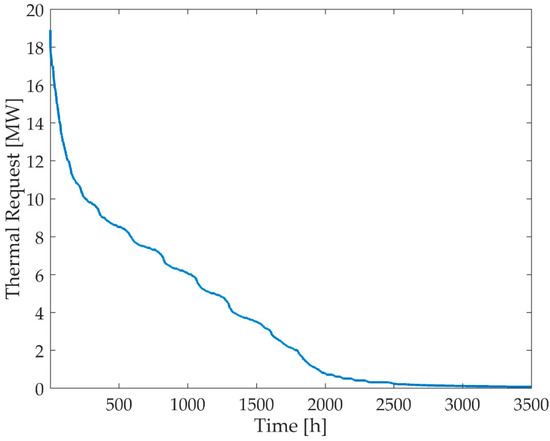
Figure 4.
Total annual heating load duration curve for the PoliTo test case.
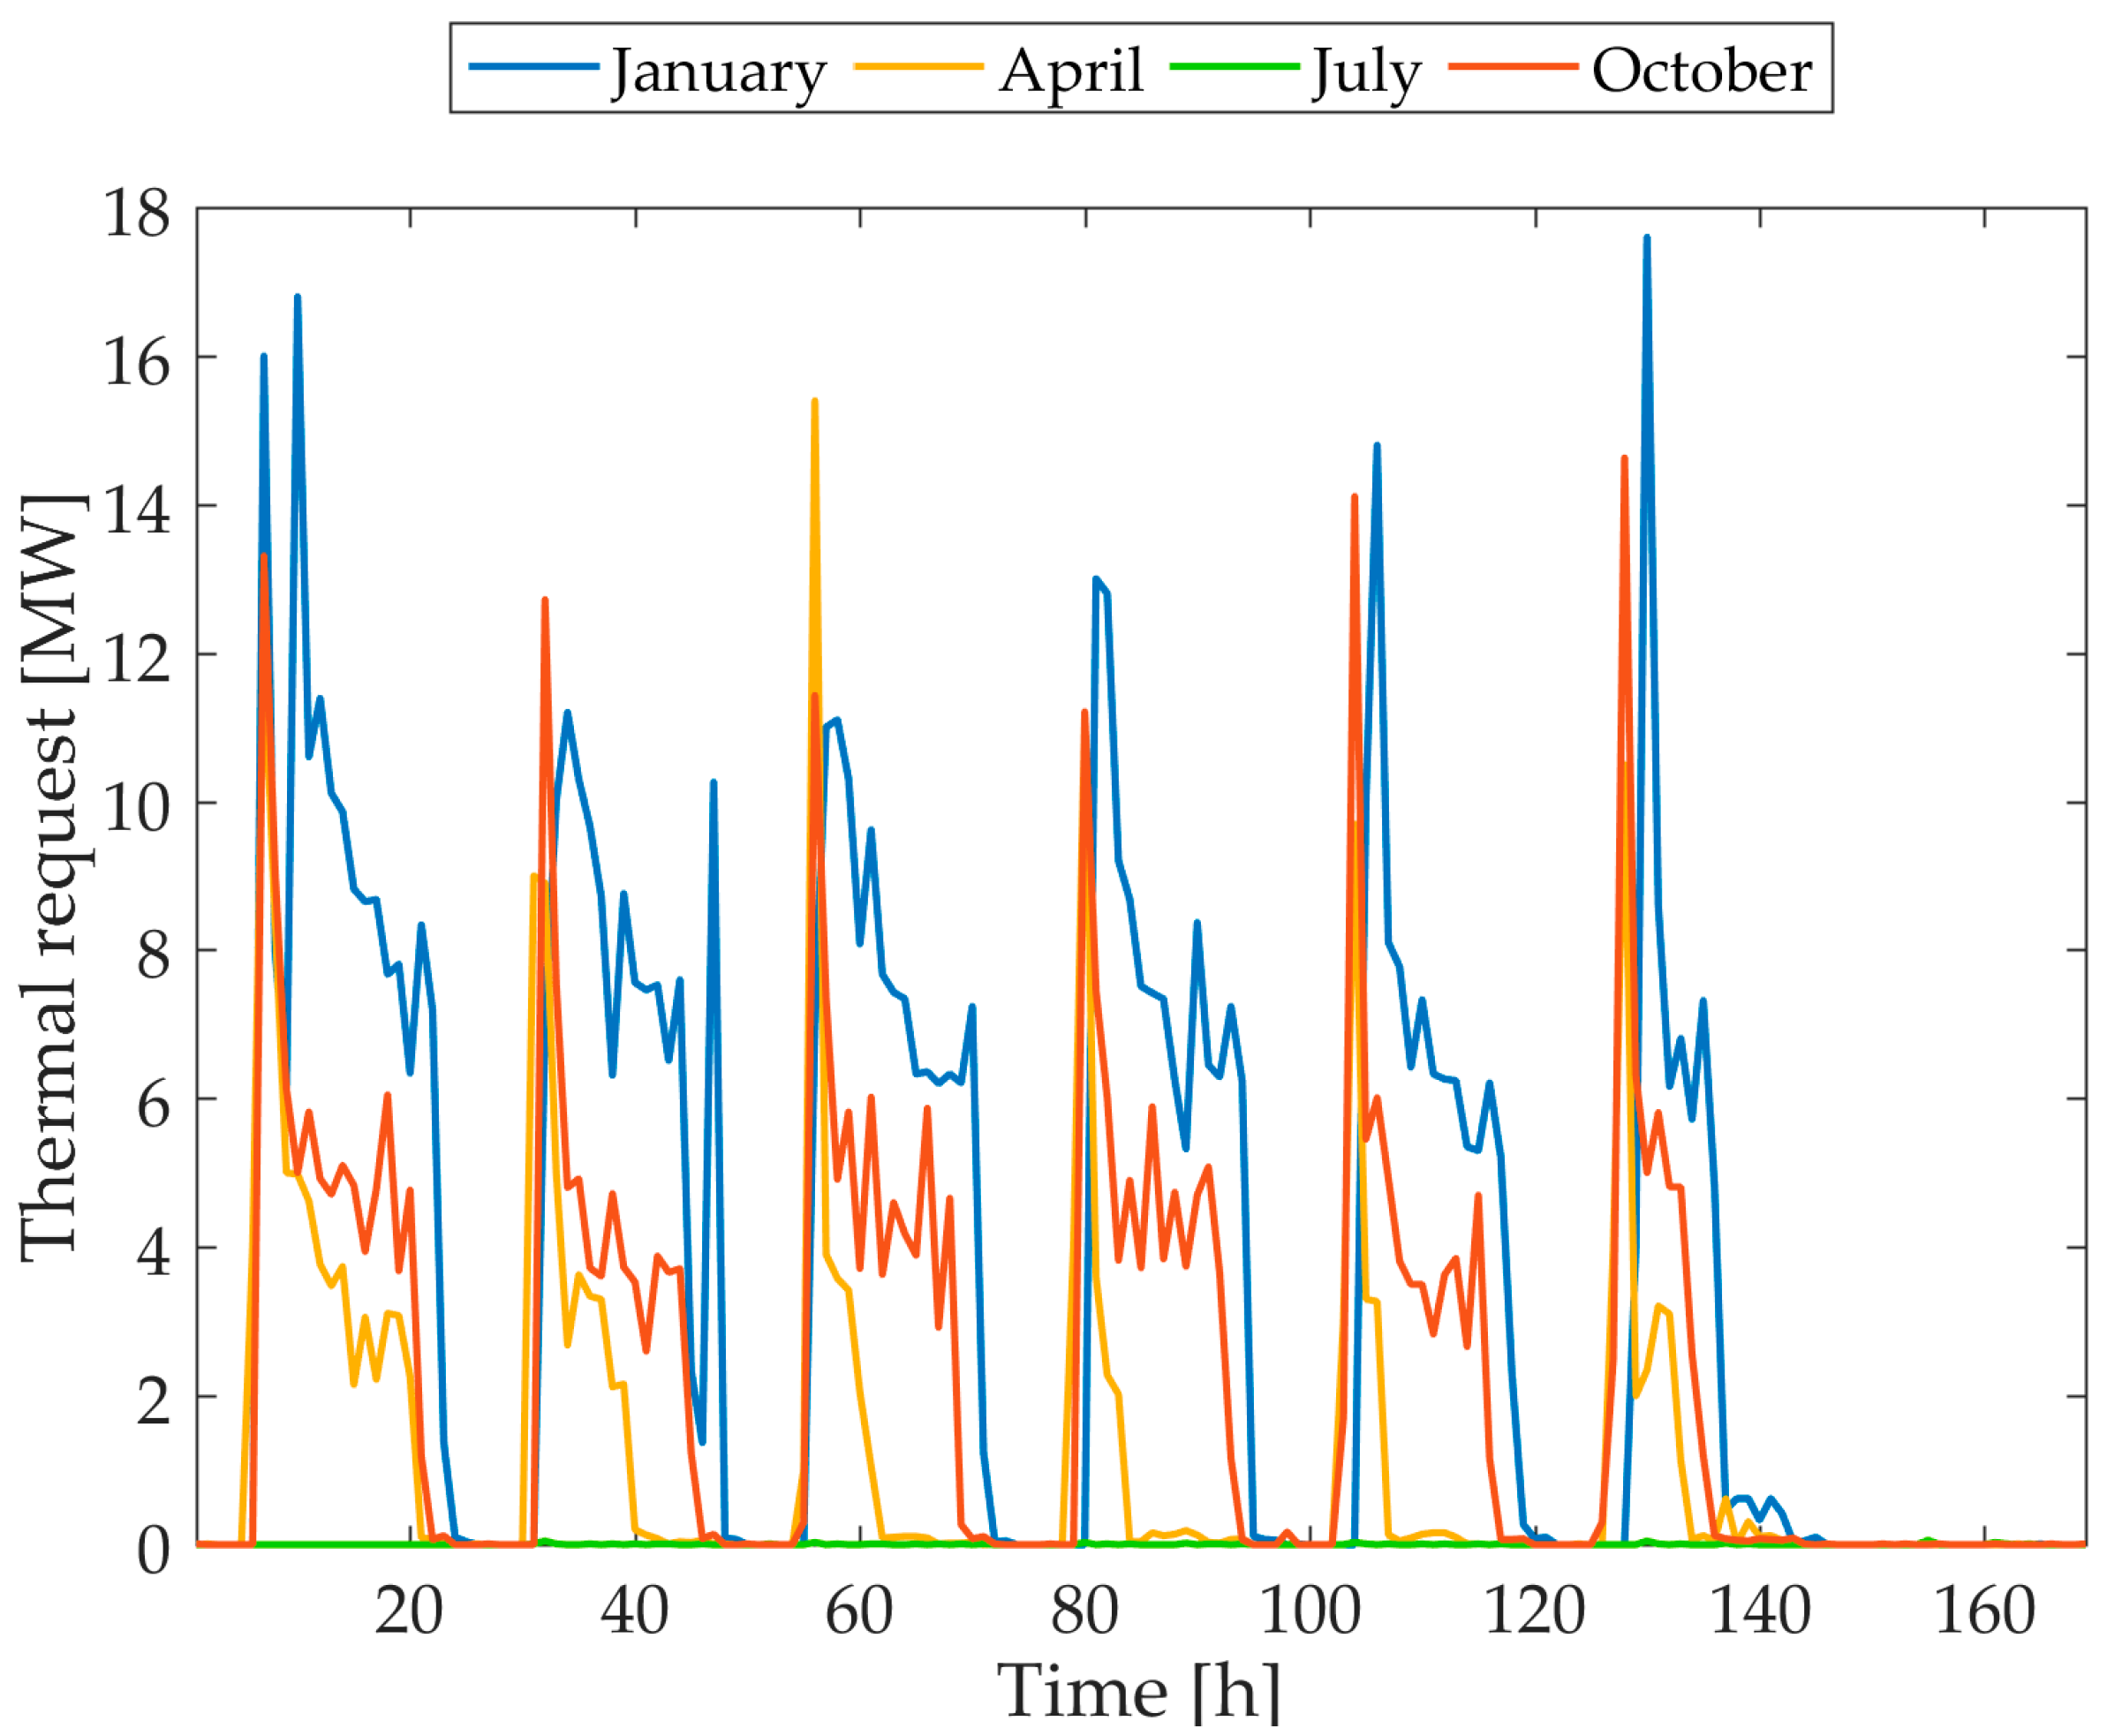
Figure 5 shows the heating profile in a typical week of the different seasons. As expected, the highest peak occurred during the winter around 6:00 in the morning, with a decrease over the day. In spring and autumn, the heat demand is lower, thanks to the increase of external temperature, while during the summer heat demand is almost negligible.

Figure 5.
PoliTo heating demand profile in a typical week of the different seasons: winter (blue line), spring (orange line), summer (green line) and autumn (red line).
5. Criteria and Design Alternatives
The selection of criteria has been performed with the aim of analyzing different scenarios after to the introduction of the alternative technologies.
Three types of criteria were selected:
- Economic: In the analysis two economy-related criteria were considered: the investment cost and the operational cost.
- Environmental: CO2 and pollutants emissions were selected according to the technology considered.
- Technical: The increase of production capacity to replace heat produced only by boilers for peak demand were considered. Flexibility indicates the ability of the production system to adjust energy production according to demand variations.
The criteria chosen for the analysis are summarized in Table 1 and their evaluation is further described in the next subsection.

Table 1.
Criteria chosen to evaluate alternatives for the case study.
The studies presented in literature on renewable-integrated DH network were analyzed to select the most suitable technologies.
Several alternatives are introduced to replace gas boilers and the aim of the analysis was to simulate the interaction between the existing CHP systems and the most promising available technologies, in order to provide a cheaper and more sustainable DH system. The analysis also aims at optimizing the use of the carbon-neutral technologies; task achieved designing the size of each technology and investigating the role of the heat storage.
The alternatives are summarized in Table 2 and briefly described in the following:
Table 2.
Set of alternative scenarios.
- Base case: The production system includes 3 CHP plants, heat supplied only by boilers and a small heat storage.
- Heat storages: The alternative A2 assumes an increase of daily storage size.
- Solar heat: A solar heat plant is integrated with DH system. Based on data gathered from an existing plant [38], and irradiance data [39], three alternatives A3, A4, and A5 were analyzed, including one alternative without additional storage, a daily storage, and a seasonal storage. The power of the solar plant is defined using the maximum specific production () and the area of the plant (), obtaining a maximum power of .
- Ground source heat pump (GSH): According to a survey on large heat pumps in Europe [40], a GSH is considered and two scenarios have been analyzed including alternatives with and without the coupling with heat storage (A6,A7).
- Biomass boiler: The alternative A8 considers the replacement of part of boiler capacity with a biomass boiler, studying the possible economic and environmental benefits.
- Electric boiler: using carbon-neutral electricity generation systems, heat can be produced with almost 100% electrical-to-thermal efficiency and no emissions. Even if it is a priori known that the conversion of electricity into heat is not economically convenient or exergy-efficient, the interaction between electrical and heating sector can help balance the overproduction of renewable electricity, since heat can be stored more easily than electricity (A9).
The production capacities for different alternatives (including base case) are summarized in Table 3.
Table 3.
Production capacities for the different alternatives.
5.1. Assumptions
In the following, the assumptions used to model the base case and the alternatives are presented. The first part focuses on the economic and technical assumptions used to simulate different alternatives, followed by uncertainties assumptions. Lastly, preference information of the experts is discussed.
5.1.1. Cost Assumptions
For the case study, the objective function used in the first stage for the simulation and optimization of different alternatives is the minimization of operating cost, displayed in Equation (7).
To evaluate the operational cost of the different alternatives, the model uses the spot electricity price () [41] (with the hypothesis that the electricity produced by the CHP is entirely sold to the market), fuel prices () [42], and other production costs (), relating them to fuel consumption () and power production (). All expenditures and revenues are summarized in Table 4 and Table 5. The optimal solution satisfies the heat demand using the cheapest technologies combination at each hour for each alternative according to technical constraints (e.g., partial load and maintenance stop), and using heat storage optimally.
Table 4.
Costs and properties of the components of the different alternatives considered in the analysis.
Table 5.
Assumed costs of the fuels, including tax and subsidies.
5.1.2. Technical Assumptions
The technical constraints for CHP assume that the characteristic operating regime of CHP is convex in terms of heat and power, meaning that if the plant can operate at two different points, it can also operate at any point on the line segment connecting them [26]. This hypothesis is well supported by the actual operation of the CHP [43]. Consequently, as done in Reference [44], the CHP is modelled as a convex combination of its characteristic operating points. The characteristic operating points were obtained from Reference [37] and Reference [45]. Moreover, to model each technology, technical constraints (e.g, efficiency, size) are used to relate output (heat, electricity) to inputs (fuel), as summarized in Table 4. One of the assumptions done to model CHP concerns with the role of heat as a by-product, that justifies the allocation of O&M costs and subsidy only to electricity production. The daily storage operation is modelled according to Reference [33], while seasonal storage operation according to Reference [46]. In particular, the size of both daily and seasonal storage was evaluated with a sensitivity analysis, by considering the marginal benefit introduced by additional size of storage and the effects of heat losses on operational costs and emissions. A detailed description of the sensitivity analysis process can be found in Reference [34].
Lastly, component and dynamic constraints (storage behavior) are coupled with the heat balance constraint.
The resulting model has a planning period of one year, with hourly resolution, therefore, to reduce computational time special decomposition techniques have been used, solving hourly models separately and coordinated under top level iterations to consider dynamic constraints.
The other criteria were evaluated as follow:
- The investment (and operational) costs were selected according to [38,45] considering subsidies if available. Solar plant and biomass boiler benefit from Conto Termico 2.0 [47], a subsidy scheme introduced in Italy that reduces investment cost; in particular, biomass boiler and electric boiler must replace existing gas boiler to access subsidies, differently from other alternatives.
- From the optimal solution CO2 and pollutants emissions were evaluated using emission factors (e.f.) according to [43,48].
- Flexibility was evaluated a priori according to the considered technology, and how the final system can adjust its energy production. According to the definition, systems with storage are more flexible than systems without storage. Moreover, since alternatives A2–A7 add capacity to the system they are more flexible than the base case and the last two alternatives. These considerations were translated into a ranking in which 1 is the best value and 9 the worst.
5.1.3. Uncertainties Assumptions
Usually, ordinal criteria are not affected by uncertainties, while for certain criteria a reasonable uncertainty needs to be assumed to avoid mistakes. For criteria that involves complex system, the iterative analysis previously described must be carried out.
In the paper the uncertainties related to the different criteria were treated as follows:
- Investment cost: It was supposed independent from the other criteria with an uncertainty of ±10%. This value was already used in previous SMAA analysis in absence of information, according to References [22,23].
- Operational cost and CO2 emissions: To consider uncertainties, the production planning procedure was repeated iteratively using electricity and fuel price variables with respect to the “current state” of the system. Depending on the fuel used, the consequent emissions change, therefore the analysis was extended to CO2 emissions.
- Pollutants emissions: Since the pollutant emissions strongly depend on startup and partial load, in absence of information a ±10% of uncertainty was supposed.
- Flexibility: Due to the nature of this criteria, the order was considered not affected by uncertainty.
5.1.4. Preference Information
A group of 4 energy experts from PoliTo participated to the selection process. The experts were chosen among professor of PoliTo; they hold a Ph.D. in the field of energy, with working experience from 5 years to over 15 years in the energy field. Each expert was asked to assess the importance of the criteria ordering it from the most to the least important. If the experts could not provide a certain preference, they could insert a question mark, denoting unspecified preference order. The experts provided information independently and anonymously, to obtain unbiased opinions. Figure 3c illustrates how such ordering information affects the weight space in 3-dimensions.
Table 6 shows the DMs’ preference information, highlighting how economic criteria are always preferred with respect to other criteria. This result was expected, since the DH is characterized by high investment costs. Moreover, pollutant emission (E2) is considered as the least important criterion by all experts, since pollutants emissions are already regulated by the law in Italy. On the other hand, the increasing attention of carbon-neutral technologies is represented by the preferences of CO2 emissions (E1) with respect to flexibility (T1) by some experts, balanced by the opinion of other experts. However, decision makers’ preferences highlight how, even if considering only carbon-neutral technologies, the main drivers of the feasibility study are of economic nature.
Table 6.
Order of preference for criteria given by experts.
6. Results
This section first analyzes the outcome of the simulations performed with LP2, and how they were used in SMAA simulations. Then, the results of the SMAA method are discussed.
6.1. Simulation and Optimization Results
Table 7 shows the mean value and the associated uncertainties of the LP2 model (Stage 1) for the different alternatives considered here.
Table 7.
LP2 outputs for the different alternatives.
Results highlights how emissions’ uncertainties are negligible compared to the mean value. This was expected and can be explained looking at the modified parameter. In fact, the variation of electric and fuel prices does not modify the overall rank order produced during the first stage (and consequently emissions).
Moreover, since most of the heat is produced by the CHP in all alternatives, there will be some dependencies across both criteria and alternatives. To assess these kind of dependencies, as proposed in [49], the output of stage 1 was used to recreate a Multivariate Gaussian distribution. If, different from the test case, a large amount of data were already available, an alternative way to represent the dependencies as a sample is presented in Reference [50].
The results of the analysis are highlighted by the correlation matrix, presented in Table A1. The matrix shows a perfect positive correlation between the operational cost of the alternatives, while a slight negative correlation was found between operational cost and emissions. The table also shows that the correlation between emissions of the alternatives is negligible.
6.2. SMAA Results
In the following, the results of SMAA simulations performed using criteria and uncertainty information (Table 7) and ordinal weight information provided by the experts (Table 6) are analyzed.
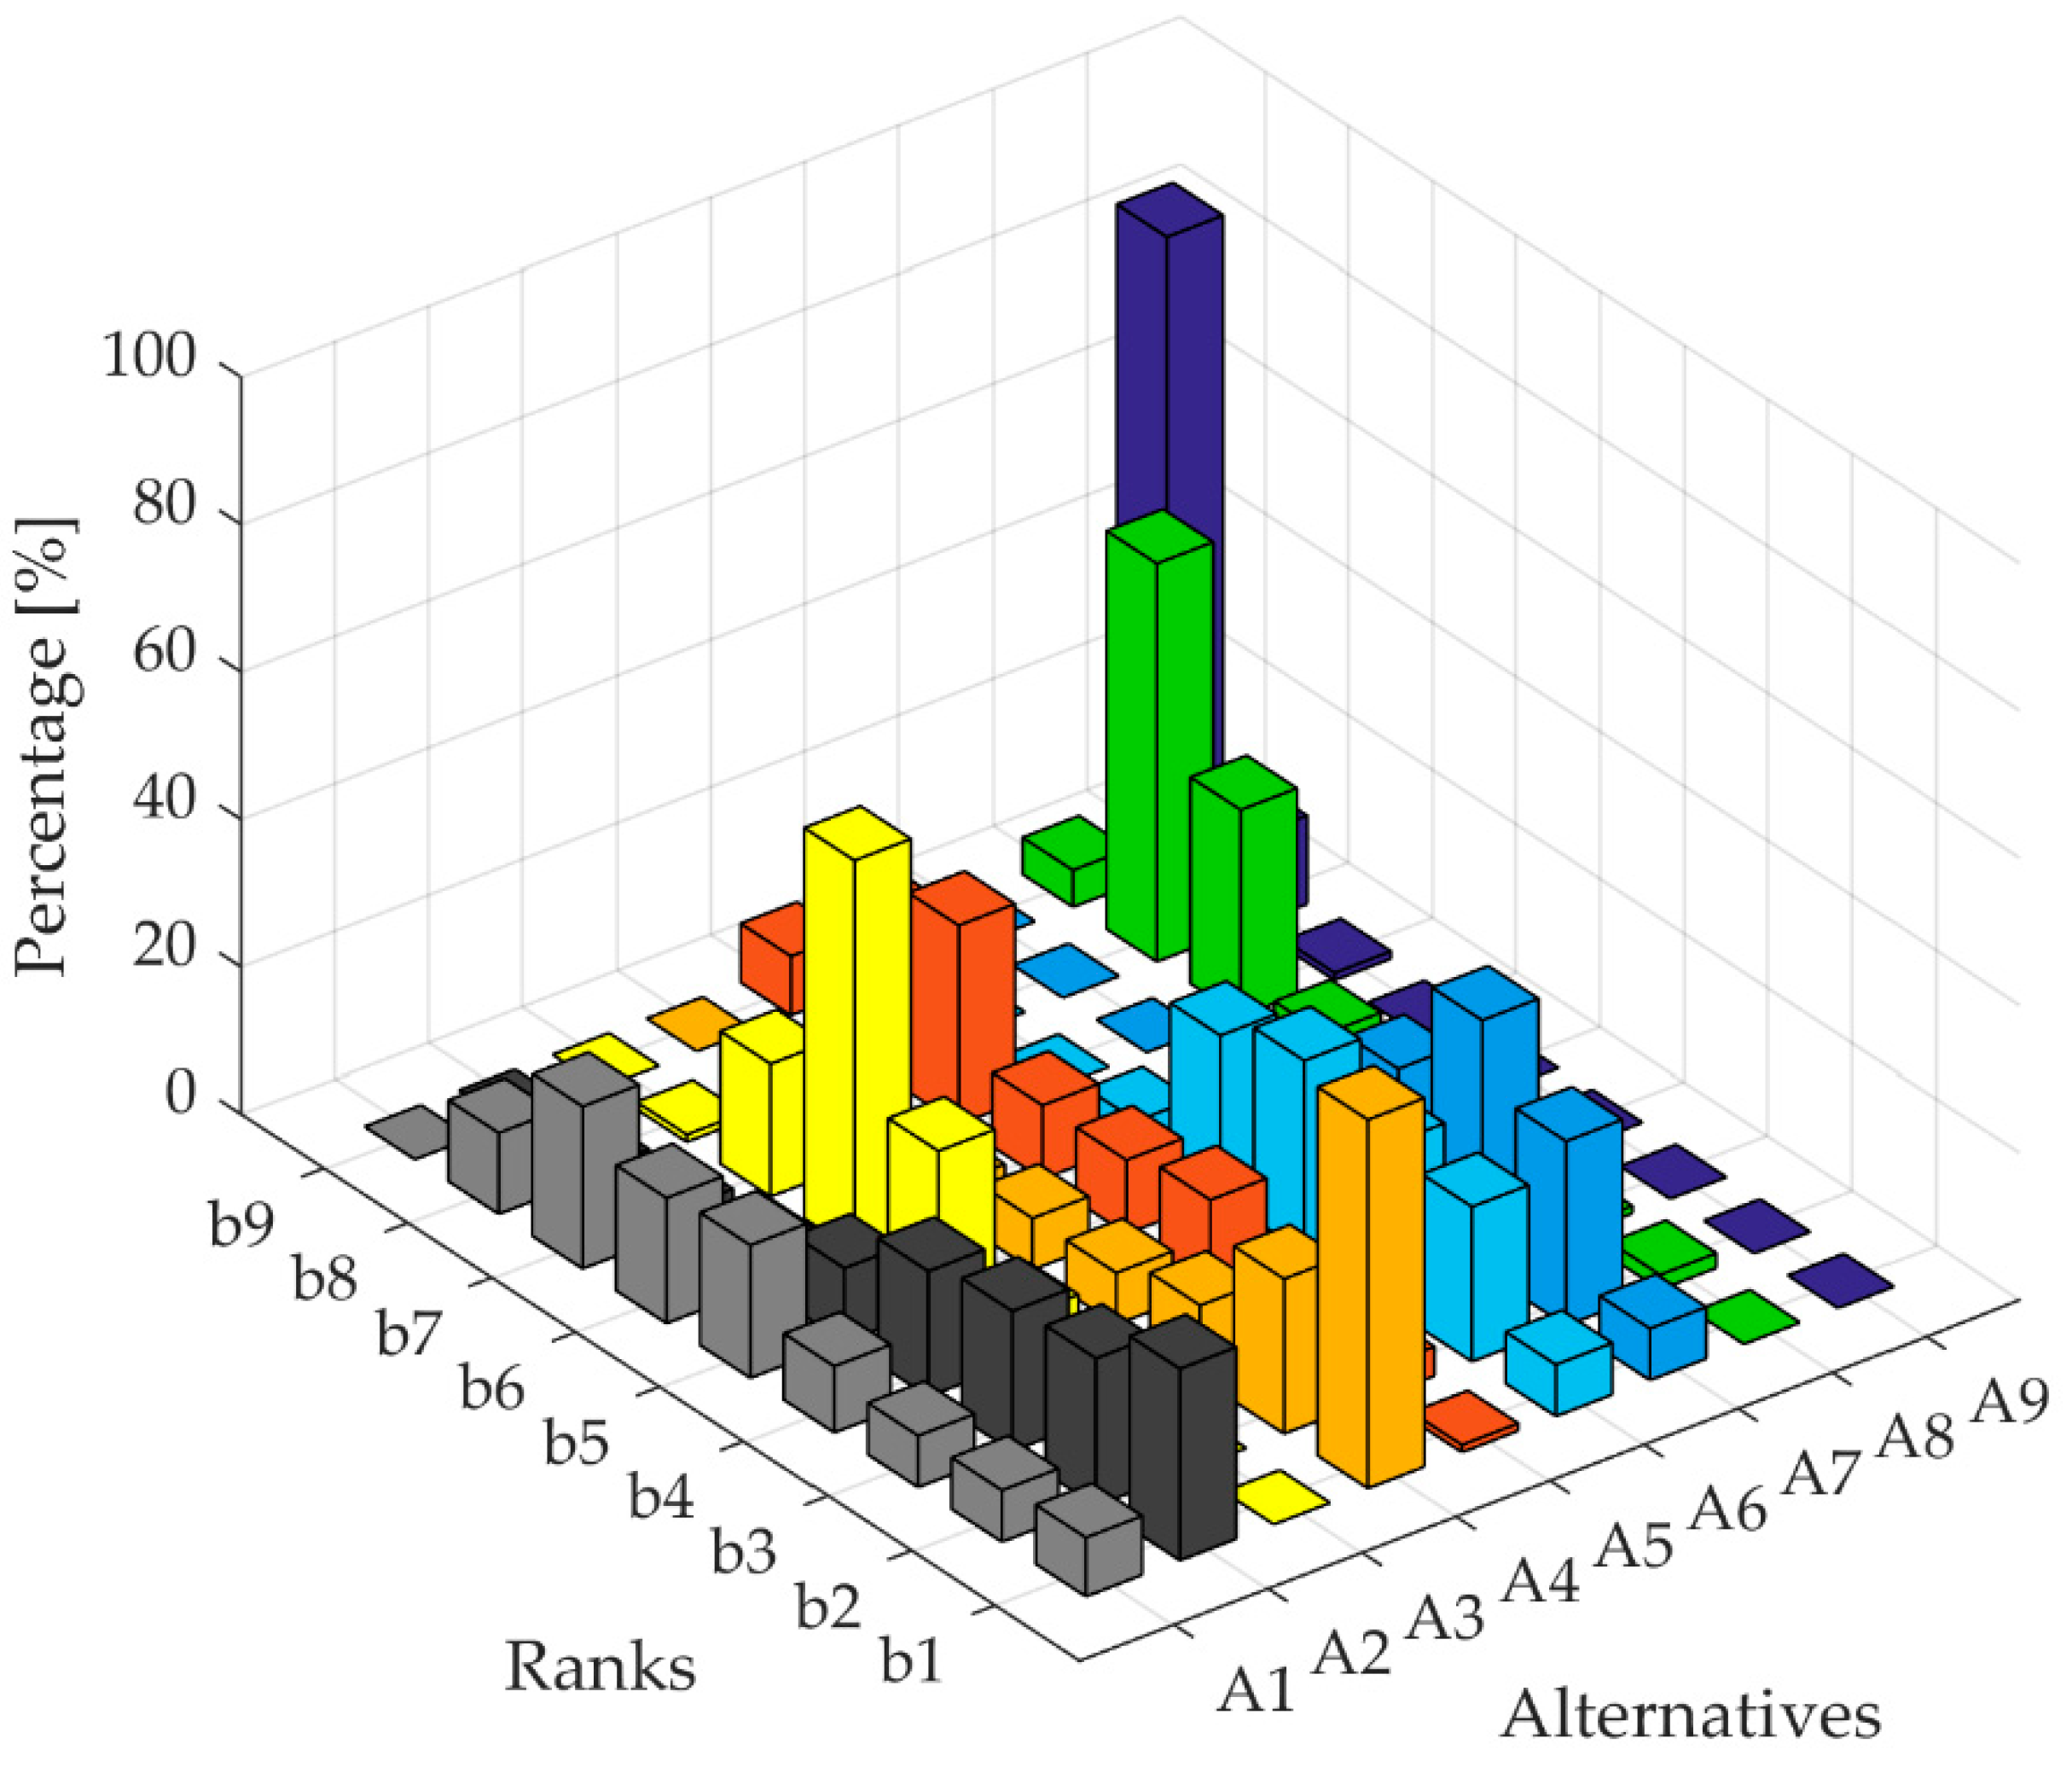
Figure 6 shows the rank acceptability indices ( for the alternatives expressed in percentage. It represents the probabilities that an alternative obtains a certain rank, considering uncertain criteria and DMs preferences. From the results it can be seen that alternative A4 (solar heat plant coupled with storage) and alternative A2 (base case with increased size of storage) are the most acceptable alternative with 50% and 26% acceptability values. The results also highlight that A3, A5, A8, and A9 obtain less than 1% of acceptability index for the first rank, classifying them as inefficient alternatives. Moreover, the last rank is clearly obtained by alternative A9 with 86% acceptability. The strength of the results is provided by the confidence factors , shown in Table 8, representing the probability that an alternative obtains the best rank if its central weight vector is chosen. For the most acceptable alternatives this value is higher than 90%, while for the alternative A3 and A9, there is no confidence factor, since they are inefficient alternatives.

Figure 6.
Rank acceptability indices of alternatives (%).
Table 8.
Confidence factor, rank acceptability indices and central weights for the alternatives.
The central weights, shown in Figure 7, represent typical preferences that make each alternative the most preferred. As discussed before, inefficient alternatives have undefined central weights, while other alternatives follow the ordinal criteria expressed by the DMs. Alternative A9 is inefficient since it obtains the highest acceptability for the last rank, alternative A3 is considered inefficient due to the presence of alternative A4, that obtains better results thanks to the coupling with the storage. Investment cost is the most important criteria, with weight that varies from 34% to 68%; on the contrary pollutants’ emission is considered the least important criteria, with weight from 2% to 5%.
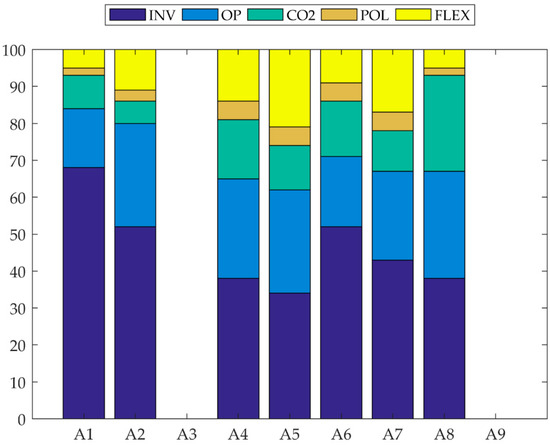
Figure 7.
Central weights of the alternatives (%).
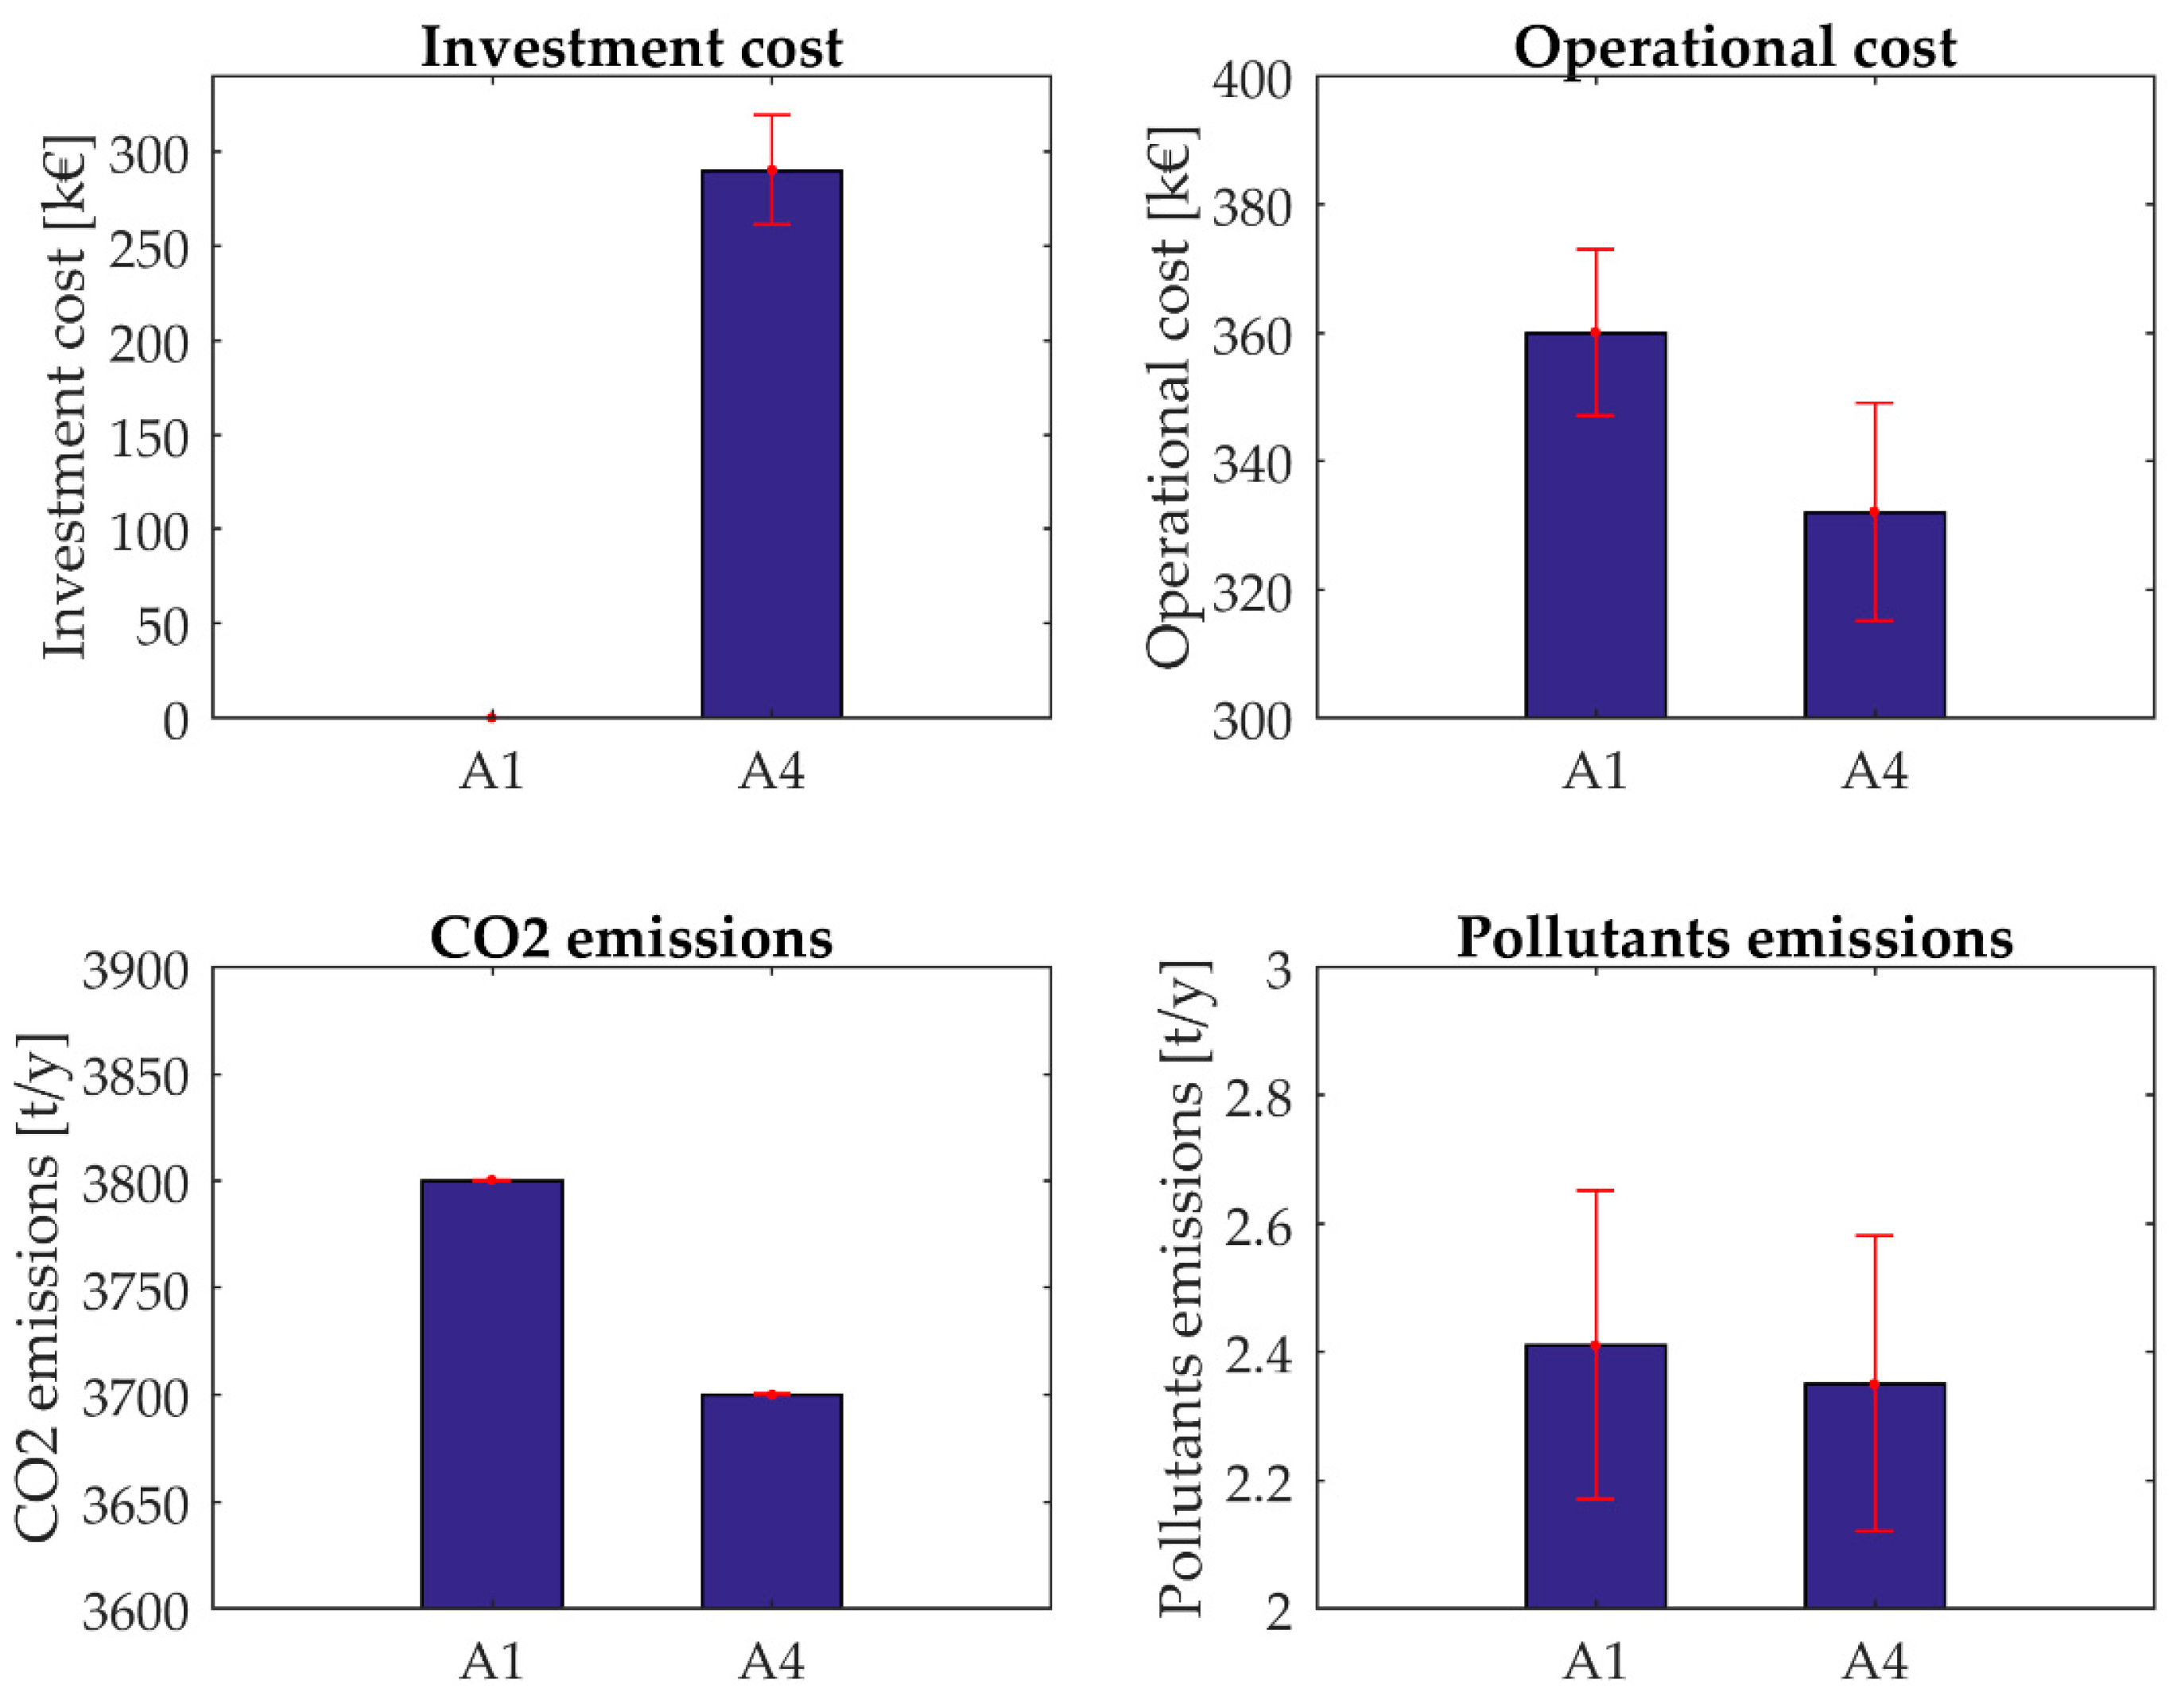
After the analysis of SMAA results, a quantitative comparison between the most acceptable alternatives and the base case was performed as shown Figure 8. In the follow-up of an initial investment, which is reduced thanks to the incentives, there are benefit in the operational costs and environmental aspects. As previously commented, there is a small uncertainty for CO2 criterion, since this value mostly depends on the fuel used. Nevertheless, due to the high correlation between the alternatives, the alternative A4 was found to be always better than the alternative A1, considering both operational cost and environmental aspects.
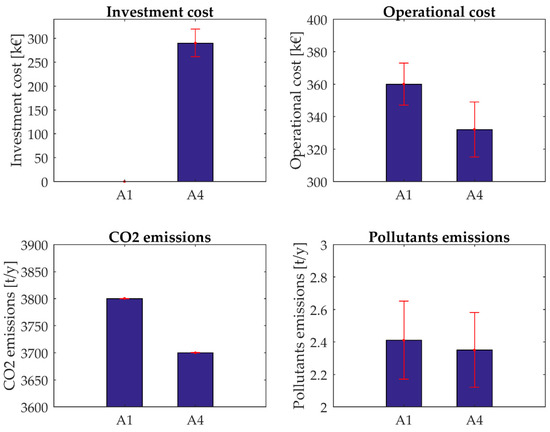
Figure 8.
Comparison of criteria between the base case and the most acceptable alternative.
7. Discussion
Even in the cases when a single superior alternative is not defined, the proposed methodology proved to be able to discern the most acceptable technologies from the least one. As demonstrated by the results, the electric boiler alternative does not seem feasible in the Italian scenario. In fact, this technology is inefficient since degrades high quality energy (electricity) into low quality energy (low temperature heat), however particular conditions such as surplus of renewable electricity or low electricity price could identify the electric boiler as the cheapest way to stabilize the electric grid.
The alternative A4, identified as the best one, has almost homogeneous weights but, differently from other alternatives with homogeneous weights (A5, A6, A7), it better reflects decision makers preferences. In particular, the alternatives A5 and A7 have almost the same weights of A4, but they are outranked by A4, as identified by the low confidence factor of these two alternatives. On the other hand, A6 is outranked by A2, the second most preferred alternative.
The ground source heat pump (A6–A7) represents a good compromise of the previous criteria, outranked by the solar technology (A4), that in the Italian case seems to be the best alternative to increase the capacity of the system. Coupling storage and solar heat helps to match the demand, while seasonal storage (A5) does not turn out to be a valid alternative, due to the high investment cost.
Moreover, analyzing the weights, can be seen that there are two inefficient alternatives, A3 and A9. These two alternatives (solar heat without additional storage and electric boiler) do not have a combination of weights that make them preferred. For the solar heat, this is explained by the fundamental role of the storage, that increases dramatically the performance of the system with an almost negligible investment cost. On the other hand, the alternative A9 is directly compared to A8, having similar investment cost and flexibility, but a higher operational cost (electricity is much more expensive than biomass) and CO2 emissions. The overall rank order produced in the first stage favors biomass boiler if electricity price increases, to maximize revenues from CHP, while the electric boilers, even if with a unitary (electrical-to-thermal) efficiency, requires electricity to be run, binding it to a marginal role.
The analysis highlighted how, even if the carbon-neutrality of the DH system can be increased thanks to the use of several technologies, the main drivers of the feasibility study are of economic nature. In particular, investment and operational costs still represent the main interests of decision makers, but the analysis point out how the emerging role of emissions in decision makers preferences is increasing as well.
To perform SMAA simulations several information turned out to be necessary, including preference information from DMs, dependencies and uncertainties. In many cases, these kinds of information are not available [51]. However, the strength of the methodology proposed lies in the iterative nature of the process, that can be initially performed without preference or dependency information and later improved.
8. Conclusions
This study proposes a methodology to support decision making of carbon-neutral technologies for district heating. The proposed methodology aims at optimizing different alternatives in a first stage, then, using uncertainty and dependency information, coupled with preference information provided by DMs, at assessing the best alternatives.
For the test case analyzed here, the methodology allowed to identify two preferred alternatives: solar heat plant with an increase of storage (A4) and base case with an increase of storage (A2) for cutting peak heat demand. On the contrary, electric boiler (A9) was ranked last, due to both its high operational cost and the marginal role obtained in the system after the overall rank order.
The comparison between the best solution and the base case highlights the advantages provided by the introduction of solar heat and storage in the system. In particular, the initial expenditure can benefit from incentives and consequently, a reduction of operational cost of around 8% was found. Looking at the environmental criteria a slight reduction of both and pollutants emission was computed, respectively of 3% and 2%, while from the technical point of view, solar plant and storage help to increase the flexibility of the system.
As far as the methodology is concerned the Stochastic Multicriteria Acceptability Analysis (SMAA) has been chosen for its ability to consider absent or poor information. The applied methodology is suitable for every kind of energy related problem, properly simulated during the first stage, while alternatives and criteria are case-specific, therefore the results cannot be extended to similar cases.
The methodology is capable to sort the best alternatives with a high confidence factor, but it requires a lot of effort in terms of data collection for the evaluation of the correlation matrix. Moreover, when the performance of the alternative technologies is affected by stochastic variables, as the external temperature or the irradiance, a more detailed analysis of the overall rank order is needed resulting in a significant increase of the computational cost. Lastly, it is worth noting that the optimization has been performed here based only on the operational costs. Should environmental aspects be included in the first-stage optimization, the complexity of the analysis increases significantly.
This paper highlights the importance of considering in the problem formulation the dependencies between alternatives. The additional information gathered thanks to the correlation matrix justifies the effort required for the data collection. The subsequent increase of computational cost due to the iterative stage is offset by an increase of the confidence factor, which leads to an enhanced decision support analysis.
Future works may consider the application of the methodology to the entire DH system. Moreover, the methodology could be subjected to improvement by implementing a “multi-objective optimization” in stage 1, exploring the Pareto front by considering the two most important criteria provided by DMs’ preferences.
Author Contributions
The research presented in this paper was a collaborative effort made by all the authors. All the authors contributed to the literature review, the methodology, the analysis of the case study and criteria and alternatives decision, as well as to the writing and reviewing the paper.
Funding
The article processing charges were supported by the starting grant awarded to Alfonso Capozzoli by Politecnico di Torino.
Acknowledgments
The authors express their gratitude to Living Lab of Politecnico di Torino for providing data for the case study presented in this work and to reviewers for their meticulous work, which allowed the paper to be significantly improved.
Conflicts of Interest
The authors declare no conflict of interest.
Abbreviations
The following abbreviations are used in this manuscript:
| Alt | Alternative |
| CHP | Combined Heat and Power |
| COP | Coefficient of Performance |
| DH | District Heating |
| DM | Decision Makers |
| EU | European Union |
| Flex | Flexibility |
| GSH | Ground Source Heat pump |
| HOB | Heat Only Boiler |
| Inv | Investment cost |
| MCDS | Multicriteria Decision Support |
| Op | Operational cost |
| O&M | Operational and Maintenance |
| Probability Density Function | |
| SMAA | Stochastic Multicriteria Acceptability Analysis |
Appendix A
Table A1.
Correlation matrix for uncertainty dependencies of criteria measurements (%).
Table A1.
Correlation matrix for uncertainty dependencies of criteria measurements (%).
| A1c | A2c | A3c | A4c | A5c | A6c | A7c | A8c | A9c | A1e | A2e | A3e | A4e | A5e | A6e | A7e | A8e | A9e | |
|---|---|---|---|---|---|---|---|---|---|---|---|---|---|---|---|---|---|---|
| A1c | 100 | 0 | 0 | 0 | 0 | 0 | 0 | 0 | 0 | 0 | 0 | 0 | 0 | 0 | 0 | 0 | 0 | 0 |
| A2c | 100 | 100 | 0 | 0 | 0 | 0 | 0 | 0 | 0 | 0 | 0 | 0 | 0 | 0 | 0 | 0 | 0 | 0 |
| A3c | 100 | 100 | 100 | 0 | 0 | 0 | 0 | 0 | 0 | 0 | 0 | 0 | 0 | 0 | 0 | 0 | 0 | 0 |
| A4c | 100 | 100 | 100 | 100 | 0 | 0 | 0 | 0 | 0 | 0 | 0 | 0 | 0 | 0 | 0 | 0 | 0 | 0 |
| A5c | 100 | 100 | 100 | 100 | 100 | 0 | 0 | 0 | 0 | 0 | 0 | 0 | 0 | 0 | 0 | 0 | 0 | 0 |
| A6c | 100 | 100 | 100 | 100 | 100 | 100 | 0 | 0 | 0 | 0 | 0 | 0 | 0 | 0 | 0 | 0 | 0 | 0 |
| A7c | 100 | 100 | 100 | 100 | 100 | 100 | 100 | 0 | 0 | 0 | 0 | 0 | 0 | 0 | 0 | 0 | 0 | 0 |
| A8c | 100 | 100 | 100 | 100 | 100 | 100 | 100 | 100 | 0 | 0 | 0 | 0 | 0 | 0 | 0 | 0 | 0 | 0 |
| A9c | 98 | 98 | 99 | 98 | 98 | 98 | 98 | 98 | 100 | 0 | 0 | 0 | 0 | 0 | 0 | 0 | 0 | 0 |
| A1e | 59 | 59 | 53 | 59 | 60 | 59 | 59 | 58 | 40 | 100 | 0 | 0 | 0 | 0 | 0 | 0 | 0 | 0 |
| A2e | −17 | −17 | −25 | −17 | −17 | −17 | −17 | −19 | −38 | 69 | 100 | 0 | 0 | 0 | 0 | 0 | 0 | 0 |
| A3e | −39 | −39 | −46 | −39 | −39 | −39 | −39 | −40 | −58 | 51 | 97 | 100 | 0 | 0 | 0 | 0 | 0 | 0 |
| A4e | −80 | −80 | −75 | −80 | −81 | −80 | −80 | −80 | −65 | −96 | −45 | −24 | 100 | 0 | 0 | 0 | 0 | 0 |
| A5e | −10 | −10 | −17 | −9 | −9 | −10 | −10 | −11 | −31 | 75 | 100 | 95 | −52 | 100 | 0 | 0 | 0 | 0 |
| A6e | −36 | −36 | −29 | −36 | −37 | −36 | −36 | −35 | −15 | −97 | −86 | −72 | 85 | −89 | 100 | 0 | 0 | 0 |
| A7e | −99 | −99 | −98 | −99 | −99 | −99 | −99 | −99 | −94 | −70 | 3 | 26 | 88 | −5 | 49 | 100 | 0 | 0 |
| A8e | 100 | 100 | 100 | 100 | 100 | 100 | 100 | 100 | 98 | 57 | −20 | −41 | −79 | −12 | −34 | −99 | 100 | 0 |
| A9e | 0 | 0 | 8 | 0 | 0 | 0 | 0 | 1 | 22 | −81 | −98 | −92 | 60 | −100 | 93 | 14 | 2 | 100 |
References
- Database-Eurostat. Available online: https://ec.europa.eu/eurostat/data/database (accessed on 23 April 2019).
- European commission Roadmap 2050. Available online: https://ec.europa.eu/energy/sites/ener/files/documents/2012_energy_roadmap_2050_en_0.pdf (accessed on 11 December 2018).
- Lund, H.; Moller, B.; Mathiesen, B.V.; Dyrelund, A. The role of district heating in future renewable energy systems. Energy 2010, 35, 1381–1390. [Google Scholar] [CrossRef]
- IEA Energy technology perspectives 2016-toward sustainable urban energy systems 2016. Available online: https://www.iea.org/publications/freepublications/publication/EnergyTechnologyPerspectives2016_ExecutiveSummary_EnglishVersion.pdf (accessed on 29 April 2019).
- Gulagi, A.; Bogdanov, D.; Breyer, C. A Cost Optimized Fully Sustainable Power System for Southeast Asia and the Pacific Rim. Energies 2017, 10, 583. [Google Scholar] [CrossRef]
- Gils, H.C.; Simon, S.; Soria, R. 100% Renewable Energy Supply for Brazil: The Role of Sector Coupling and Regional Development. Energies 2017, 10, 1859. [Google Scholar] [CrossRef]
- Connolly, D. Heat Roadmap Europe: Quantitative comparison between the electricity, heating, and cooling sectors for different European countries. Energy 2017, 139, 580–593. [Google Scholar] [CrossRef]
- Noussan, M.; Jarre, M.; Degiorgis, L.; Poggio, A. Data Analysis of the Energy Performance of Large Scale Solar Collectors for District Heating. Energy Procedia 2017, 134, 61–68. [Google Scholar] [CrossRef]
- Gudmundsson, O.; Thorsen, J.E.; Brand, M. The role of district heating in coupling of the future renewable energy sectors. Energy Procedia 2018, 149, 445–454. [Google Scholar] [CrossRef]
- Verda, V.; Colella, F. Primary energy savings through thermal storage in district heating networks. Energy 2011, 36, 4278–4286. [Google Scholar] [CrossRef]
- Olson, D.L. Multi-Criteria Decision Support. In Handbook on Decision Support Systems 1: Basic Themes; Springer Berlin Heidelberg: Berlin, Heidelberg, 2008; pp. 299–314. [Google Scholar]
- Siksnelyte, I.; Zavadskas, E.K.; Streimikiene, D.; Sharma, D. An Overview of Multi-Criteria Decision-Making Methods in Dealing with Sustainable Energy Development Issues. Energies 2018, 11, 2754. [Google Scholar] [CrossRef]
- Cavallaro, F. Multi-criteria decision aid to assess concentrated solar thermal technologies. Renew. Energy 2009, 34, 1678–1685. [Google Scholar] [CrossRef]
- Wang, T.-C.; Tsai, S.-Y. Solar Panel Supplier Selection for the Photovoltaic System Design by Using Fuzzy Multi-Criteria Decision Making (MCDM) Approaches. Energies 2018, 11, 1989. [Google Scholar] [CrossRef]
- Ali, S.; Lee, S.-M.; Jang, C.-M. Determination of the Most Optimal On-Shore Wind Farm Site Location Using a GIS-MCDM Methodology: Evaluating the Case of South Korea. Energies 2017, 10, 2072. [Google Scholar] [CrossRef]
- Mytilinou, V.; Lozano-Minguez, E.; Kolios, A. A Framework for the Selection of Optimum Offshore Wind Farm Locations for Deployment. Energies 2018, 11, 1855. [Google Scholar] [CrossRef]
- Jovanovic, M. An analytical method for the measurement of energy systems sustainability in urban areas. FME Trans. 2008, 36, 157–166. [Google Scholar] [CrossRef]
- Kolios, A.; Mytilinou, V.; Lozano-Minguez, E.; Salonitis, K. A Comparative Study of Multiple-Criteria Decision-Making Methods under Stochastic Inputs. Energies 2016, 9, 566. [Google Scholar] [CrossRef]
- Lahdelma, R.; Hokkanen, J.; Salminen, P. SMAA—Stochastic multiobjective acceptability analysis. Eur. J. Oper. Res. 1998, 106, 137–143. [Google Scholar] [CrossRef]
- Rahman, M.M.; Paatero, J.V.; Lahdelma, R. Evaluation of choices for sustainable rural electrification in developing countries: A multicriteria approach. Energy Policy 2013, 59, 589–599. [Google Scholar] [CrossRef]
- Pesola, A.; Serkkola, A.; Lahdelma, R.; Salminen, P. Multicriteria evaluation of alternatives for remote monitoring systems of municipal buildings. Energy Build. 2014, 72, 229–237. [Google Scholar] [CrossRef]
- Wang, H.; Jiao, W.; Lahdelma, R.; Zhu, C.; Zou, P. Stochastic Multicriteria Acceptability Analysis for Evaluation of Combined Heat and Power Units. Energies 2015, 8, 59–78. [Google Scholar] [CrossRef]
- Kontu, K.; Rinne, S.; Olkkonen, V.; Lahdelma, R.; Salminen, P. Multicriteria evaluation of heating choices for a new sustainable residential area. Energy Build. 2015, 93, 169–179. [Google Scholar] [CrossRef]
- Kirppu, H.; Lahdelma, R.; Salminen, P. Multicriteria evaluation of carbon-neutral heat-only production technologies for district heating. Appl. Therm. Eng. 2018, 130, 466–476. [Google Scholar] [CrossRef]
- Pelissari, R.; Oliveira, M.; Ben Amor, S.; Kandakoglu, A.; Helleno, A. SMAA methods and their applications: A literature review and future research directions. Ann. Oper. Res. 2019, 276, 1–61. [Google Scholar] [CrossRef]
- Lahdelma, R.; Hakonen, H. An efficient linear programming algorithm for combined heat and power production. Eur. J. Oper. Res. 2003, 148, 141–151. [Google Scholar] [CrossRef]
- Makkonen, S.; Lahdelma, R. Non-convex power plant modelling in energy optimisation. Eur. J. Oper. Res. 2006, 171, 1113–1126. [Google Scholar] [CrossRef]
- Rong, A.; Hakonen, H.; Lahdelma, R. A dynamic regrouping based sequential dynamic programming algorithm for unit commitment of combined heat and power systems. Energy Convers. Manag. 2009, 50, 1108–1115. [Google Scholar] [CrossRef]
- Rong, A.; Hakonen, H.; Lahdelma, R. An efficient linear model and optimisation algorithm for multi-site combined heat and power production. Eur. J. Oper. Res. 2006, 168, 612–632. [Google Scholar] [CrossRef]
- Rong, A.; Lahdelma, R. Efficient algorithms for combined heat and power production planning under the deregulated electricity market. Eur. J. Oper. Res. 2007, 176, 1219–1245. [Google Scholar] [CrossRef]
- Rong, A.; Lahdelma, R. An efficient envelope-based Branch and Bound algorithm for non-convex combined heat and power production planning. Eur. J. Oper. Res. 2007, 183, 412–431. [Google Scholar] [CrossRef]
- Wang, H.; Abdollahi, E.; Lahdelma, R.; Jiao, W.; Zhou, Z. Modelling and optimization of the smart hybrid renewable energy for communities (SHREC). Renew. Energy 2015, 84, 114–123. [Google Scholar] [CrossRef]
- Wang, H.; Yin, W.; Abdollahi, E.; Lahdelma, R.; Jiao, W. Modelling and optimization of CHP based district heating system with renewable energy production and energy storage. Appl. Energy 2015, 159, 401–421. [Google Scholar] [CrossRef]
- Pinto, G. Optimization and multicriteria evaluation of carbon-neutral heat-only production technologies for district heating in Turin. Master’s Thesis, Politecnico di Torino, Turin, Italy, 2019. Available online: https://webthesis.biblio.polito.it/10257/ (accessed on 29 April 2019).
- Lahdelma, R.; Salminen, P. SMAA-2: Stochastic Multicriteria Acceptability Analysis for Group Decision Making. Oper. Res. 2001, 49, 325–468. [Google Scholar] [CrossRef]
- LivingLAB@polito.it LivingLAB. Available online: http://smartgreenbuilding.polito.it/# (accessed on 29 October 2018).
- IREN Energia La rete IREN. Available online: https://www.gruppoiren.it/teleriscaldamento-la-rete-iren (accessed on 11 October 2018).
- Global Solar Thermal Energy Council Solar District heating. Available online: https://www.solar-district-heating.eu/it/sdh/ (accessed on 10 October 2018).
- PVGIS Photovoltaic Geographical Information System. Available online: http://re.jrc.ec.europa.eu/pvgis/ (accessed on 29 October 2018).
- David, A.; Mathiesen, B.V.; Averfalk, H.; Werner, S.; Lund, H. Heat Roadmap Europe: Large-Scale Electric Heat Pumps in District Heating Systems. Energies 2017, 10, 578. [Google Scholar] [CrossRef]
- GSE Spot Electricity Price. Available online: http://www.mercatoelettrico.org/It/download/DatiStorici.aspx (accessed on 16 October 2018).
- ARERA Natural gas price. Available online: https://www.arera.it (accessed on 10 October 2018).
- Jarre, M.; Noussan, M.; Poggio, A. Operational analysis of natural gas combined cycle CHP plants: Energy performance and pollutant emissions. Appl. Therm. Eng. 2016, 100, 304–314. [Google Scholar] [CrossRef]
- Abdollahi, E.; Wang, H.; Rinne, S.; Lahdelma, R. Optimization of energy production of a CHP plant with heat storage. In Proceedings of the 2014 IEEE Green Energy and Systems Conference (IGESC), Long Beach, CA, USA, 24 November 2014; pp. 30–34. [Google Scholar]
- ENERGINET Technology Data for Energy Plants for Electricity and District heating generation 2018. Available online: https://ens.dk/sites/ens.dk/files/Analyser/technology_data_catalogue_for_el_and_dh_-_0001.pdf (accessed on 29 April 2019).
- IEA Application of thermal energy storage in the energy transition. Available online: https://www.eces-a30.org/wp-content/uploads/Applications-of-Thermal-Energy-Storag-in-the-Energy-Transition-Annex-30-Report.pdf (accessed on 23 November 2018).
- GSE Conto Termico 2.0. Available online: https://www.gse.it/servizi-per-te/efficienza-energetica/conto-termico (accessed on 29 April 2019).
- Fracastoro, G.V.; Barbero, A.M.; Baccon, I.F. Requisiti Tecnici Per Impianti a Cippato Superiori a 350 kW. 2018. Available online: http://www.provincia.torino.gov.it/ambiente/file-storage/download/energia/pdf/all_1_bio.pdf (accessed on 29 April 2019).
- Lahdelma, R.; Makkonen, S.; Salminen, P. Multivariate Gaussian criteria in SMAA. Eur. J. Oper. Res. 2006, 170, 957–970. [Google Scholar] [CrossRef]
- Lahdelma, R.; Makkonen, S.; Salminen, P. Two ways to handle dependent uncertainties in multi-criteria decision problems. Omega 2009, 37, 79–92. [Google Scholar] [CrossRef]
- Vetschera, R. Deriving rankings from incomplete preference information: A comparison of different approaches. Eur. J. Oper. Res. 2017, 258, 244–253. [Google Scholar] [CrossRef]

© 2019 by the authors. Licensee MDPI, Basel, Switzerland. This article is an open access article distributed under the terms and conditions of the Creative Commons Attribution (CC BY) license (http://creativecommons.org/licenses/by/4.0/).