Article

Smart-Sensors to Estimate Insulation Health in Induction Motors via Analysis of Stray Flux

by
Israel Zamudio-Ramirez
1,
Roque Alfredo Osornio-Rios
1,
Miguel Trejo-Hernandez
1,
Rene de Jesus Romero-Troncoso
1 and
Jose Alfonso Antonino-Daviu
2,*
1
Engineering Faculty, San Juan del Río Campus, Universidad Autónoma de Querétaro, Av. Río Moctezuma 249, C.P. 76808 San Juan del Río, Querétaro, México
2
Instituto Tecnológico de la Energía, Universitat Politècnica de València (UPV), Camino de Vera s/n, 46022 Valencia, Spain
*
Author to whom correspondence should be addressed.
Energies 2019, 12(9), 1658; https://doi.org/10.3390/en12091658
Submission received: 6 April 2019 / Revised: 18 April 2019 / Accepted: 25 April 2019 / Published: 1 May 2019
(This article belongs to the Special Issue Advances in Rotating Electric Machines)

Abstract

:
Induction motors (IMs) are essential components in industrial applications. These motors have to perform numerous tasks under a wide variety of conditions, which affects performance and reliability and gradually brings faults and efficiency losses over time. Nowadays, the industrial sector demands the necessary integration of smart-sensors to effectively diagnose faults in these kinds of motors before faults can occur. One of the most frequent causes of failure in IMs is the degradation of turn insulation in windings. If this anomaly is present, an electric motor can keep working with apparent normality, but factors such as the efficiency of energy consumption and mechanical reliability may be reduced considerably. Furthermore, if not detected at an early stage, this degradation could lead to the breakdown of the insulation system, which could in turn cause catastrophic and irreversible failure to the electrical machine. This paper proposes a novel methodology and its application in a smart-sensor to detect and estimate the healthiness of the winding insulation in IMs. This methodology relies on the analysis of the external magnetic field captured by a coil sensor by applying suitable time-frequency decomposition (TFD) tools. The discrete wavelet transform (DWT) is used to decompose the signal into different approximation and detail coefficients as a pre-processing stage to isolate the studied fault. Then, due to the importance of diagnosing stator winding insulation faults during motor operation at an early stage, this proposal introduces an indicator based on wavelet entropy (WE), a single parameter capable of performing an efficient diagnosis. A smart-sensor is able to estimate winding insulation degradation in IMs using two inexpensive, reliable, and noninvasive primary sensors: a coil sensor and an E-type thermocouple sensor. The utility of these sensors is demonstrated through the results obtained from analyzing six similar IMs with differently induced severity faults.

1. Introduction

In the companies, electric motors have gained great importance, and have been widely used as electromechanical devices for the conversion of energy, consuming more than 60% of all the energy of any industrial nation [1]. Current quality requirements consider the use of monitoring systems and the development of incipient failure detection techniques increasingly necessary in order to enhance the reliability of these industrial systems so that production is not interrupted. Machines operating under faulty conditions consume and spend more energy, causing additional economical losses. Furthermore, some failures can remain unnoticed in motors that work continuously with apparent normality; nevertheless, if not detected in time, incipient faults can result in catastrophic and irreversible damage to the machine, and if the fault progresses it can cause collateral damages to others systems coupled to the induction motor (IM). Therefore, it is of paramount importance to study the main faults in induction motors, and there is a clear necessity to develop emergent techniques that can detect faults in the early stages, and to integrate new technologies. In this regard, some authors have adopted the concept of a smart-sensor, in which one or more primary sensors are combined with a processing unit in order to gather certain functionalities like processing, communication and integration. Smart-sensors have found an application in different research fields, including the monitoring and diagnosis of faults in distinct industrial applications [2,3], real-time high-resolution frequency measurement [4], identification of broken bars and unbalance in induction motors [5,6], among others.
Surveys on motor reliability have determined that the distribution of failures in IMs can essentially be classified into four classes: bearing faults, stator related faults, rotor related faults, and other faults (cooling, connection, terminal boxes) [7]. Some investigations have shown that most failures of electric motors can be attributed to bearings and windings [8]. Depending on the type and size of the machine, problems related to stator windings correspond to a range between 16%–36% of total reported faults [9,10], which is the second largest type of fault for IMs, just after bearings defects. Stator winding insulation failures have recently received special attention. This is mainly because the worst stator faults start from undetectable insulation degradation problems between drastically adjacent turns [11,12,13,14] that lead to the appearance of an inter-turn fault, where two or more turns become short circuited. If undetected at early stages or after its appearance, this type of fault can develop into more severe problems very quickly. Many techniques found in the literature have been proposed to detect winding faults, and focus on two main approaches: offline methods and online methods [15]. Common offline methods that are typically used in industry include insulation resistance measurement, polarization index/dielectric absorption measurement, offline partial discharge tests, and evaluation of the dissipation factor [16,17,18]. A disadvantage of offline tests is the necessity to remove the machine from service, a drawback that can lead to false indications caused by unrealistic operations [19]. On the other hand, online monitoring methods are desirable due to their capability to diagnose faults when a motor is in service. To this end, several techniques have been proposed to perform online diagnosis, and many physical magnitudes have been highlighted as potential sources of information, with each one having its own advantages and disadvantages, as discussed below. Vibration [20], thermographic [21,22], and partial discharge [23] are some of the online methods used to detect insulation inter-turn faults; however, most of these techniques are not yet proven to detect faults during early stages, before reaching a severe phase, and in the case of the thermographic approach, diagnosis is difficult to perform under real working environmental conditions, since optimal conditions must be met to get confident results. Other classical approaches are focused on the use of current and voltage signals: spectral analysis of the steady-state current using the Fourier transform (motor current signature analysis, MCSA) [24], analysis of the zero and negative sequence currents [25], and analysis of the zero-sequence voltage [26]. The main disadvantage of analyzing the zero-sequence voltage is that the final diagnosis can be affected by the influence of other parameters, such as voltage unbalances, measurement errors, and inherent asymmetries during the manufacturing process, which can cause false diagnoses. Although analysis of the negative sequence current overcomes these problems [27], it is required to measure three-line currents, a condition that is not always available.
Due to the need for a system that is able to automatically diagnose in an online mode and monitor the health of winding insulation in induction motors (before an irreversible fault occurs), this work introduces a smart-sensor composed of two primary sensors (a coil sensor and an E-type thermocouple sensor) and a hardware signal processing unit (HSP unit) in order to accomplish this task. The wavelet entropy (WE) of the coil sensor was used as an auxiliary parameter in the final diagnosis, since it is able to characterize the dynamism and the order/disorder of a signal using a single value [28,29,30,31]. The coil sensor was used to capture the stray flux signal, and the E-type thermocouple sensor acquired the temperature of the motor, since both of them have a non-invasive nature. In order to constantly monitor and diagnose winding insulation degradation, the smart-sensor applied a signal processing stage composed of the computation of the discrete wavelet transform (DWT) followed by the calculation of the WE. Furthermore, with the purpose of automating the full process, a trained artificial neural network (ANN) performed a regression estimation by using the wavelet entropy and the induction motor temperature as input signals. All computations were performed by a field-programmable gate array (FPGA) HSP digital unit by developing proprietary hardware cores focused on the above-mentioned tools, as described below.

2. Materials and Methods

In this section, we detail the mathematical tools and methodologies that constitute the main core of the smart-sensor. The DWT is used to obtain a representation of the frequency content for the different bands that make up the input electromotive force (emf) signal. Wavelet entropy is used as the main parameter that will serve to subtract relevant information about the healthiness of the winding insulation, since it is a tool capable of describing the dynamic behavior of a signal, in addition to indicating the amount of order/disorder of that signal. Furthermore, wavelet entropy shows a clear relation to the healthiness of the winding insulation, as will be shown below. Finally, a final diagnosis through an artificial neural network, whose inputs are indeed wavelet entropy and IM temperature, will indicate the healthiness of the winding insulation using an automatic process.

2.1. Discrete Wavelet Transform (DWT)

As is well known, DWT is a time-frequency analysis transform that provides significant features for the analysis of a time-variant signal, since this technique is very suitable for decomposing a signal into well-defined “wavelet signals” that cover specific frequency ranges that are known to be directly dependent on the sampling frequency used to capture the analyzed signals [32]. The DWT of a signal can be defined as
W ( i , k ) = x ( k ) ψ i , k ( t )
where i is the decomposition level, k is the number of the sample, and ψ i , k ( t ) is the discrete wavelet mother function.
To compute the DWT of a signal, a Mallat’s algorithm facilitates its application and improves its performance, processing time, and the computational burden that its application entails. The DWT of a signal x[n] of length N is calculated by applying a mathematical convolution defined by Equation (2) with a bank of high-pass filters (HPF) with impulse response g[n] to analyze the high frequencies, and simultaneously with a bank of low-pass filters (LPF) with impulse response h[n] to analyze the low frequencies.
y [ n ] = ( x * h ) [ n ] = k = 0 N x [ k ] h [ n k ]
The DWT decomposes the time-domain signal in several levels, which are limited by the sample size N. The frequency content of every decomposition level for both a C i and d C i is estimated by
a C i [ 0 , f s 2 i + 1 ] , d C i [ f s 2 i + 1 , f s 2 1 ]
where f s is the sampling frequency and i is the desired decomposition level.
The coefficients of the HPF and LPF are determined by the selection of a mother wavelet according to the application.
In this regard, some investigations have been developed to evaluate the performance of DWT in extracting features from the current signals of induction motors. This serves the purpose of detecting eccentricities [33], rotor-asymmetries [34], broken rotor bars [35], and other factors using the Daubechies (db), Symlet (sym), Morlet, and Meyer wavelet families, and varying the orders. These works have shown that a Daubechies family of higher order is well suited to extracting the information required for the detection of motor failures. Furthermore, studies have shown that higher order filters behave as more-ideal filters, allowing less overlap between adjacent frequency bands.

2.2. Wavelet Entropy

Due to the inherent constraints of some time-frequency transforms, there can be problems when a specific window is applied to a series of data. Such is the case of the uncertainty problem given in the DWT—if the window is too narrow, the resolution of the frequency will be poor, whereas if the window is too wide, the location during the time of the signal will be less precise. This limitation is of great importance when it comes to the analysis of signals with transient components located in time, which is the case for the great majority of signals with real physical magnitudes.
To minimize the effects of this limitation, a parameter based on the entropy of a signal has been defined from a time-frequency representation of the signal provided by the wavelet transform [36]. In this regard, the entropy based on the wavelet transform (wavelet entropy) reflects the degree of order/disorder in the signal, so it can provide additional information about the underlying dynamic processes associated with the signal [29]. This is achieved by combining the information of all the wavelet bands, since data between adjacent wavelet signals is taken and combined into one index in order to avoid focusing on just one wavelet band having its own time-frequency resolution.
The total wavelet entropy ( S W T ) is defined according to [37].
S W T S W T ( p ) = i = m n p i ln p i
where m and n are the first- and last-considered decomposition levels for analysis, respectively, and pi represent the relative wavelet energy normalized values, which can be computed as
p i = E i E t o t
where Ei (Equation (6)) and Etot (Equation (7)) represent the energy of wavelet level decomposition i and the total energy of all wavelet level decompositions, respectively.
E i = k | C i ( k ) | 2
E t o t = i E i

2.3. Stray Flux Analysis

Effective analysis of the stray flux by applying suitable signal processing techniques to detect several failures in induction motors, such as broken rotor bars, static and dynamic rotor eccentricity, bearing faults, and shorted turns in stator winding, have been proven and validated in a number of works [38,39,40,41].
The external magnetic field can be analyzed by its axial and radial components [42]. The axial radial field is generated by currents in the stator end windings or rotor cage end ring. The radial field is related to air gap flux density, which is attenuated by the stator magnetic circuit and by the external machine frame.
The coil sensor can be installed in the vicinity of the motor frame in convenient positions in order to measure the electromotive forces that are indicative of the axial and radial flux components, depending on its placement. Thus, Figure 1 shows the positions A, B, and C in which the sensor can be installed to measure both fields.
In position A, the sensor’s placement enables measurement of the axial flux; on the other hand, if the sensor is placed in position B, the result of the measurements will correspond to components of the axial flux and part of the radial flux simultaneously. In position C, the coil sensor is parallel to the longitudinal cross-section of the machine, which makes the axial field null and the radial flux essentially present.

2.4. Artificial Neural Network

Artificial neural networks (ANNs) are computational models that simulate the neurological structure of the human brain and its capability to learn and solve problems through pattern recognition [43]. As is well known, this method has exceptional characteristics enabling it to process and extract relevant information from large amounts of data. Among the most popular ANN architectures, feed-forward neural networks (FFNNs) are widely used, since they are simple, practical, and very good at approximating real-valued functions and at classifying data. Furthermore, the operation of this kind of ANN demands a very low computational burden, which makes it appropriate for implementation in digital systems. FFNNs are composed of a layered architecture possessing essentially one input layer, one or more hidden layers, and one output layer, as shown in Figure 2a. Each layer has one or more elementary processing units called neurons (see Figure 2b), whose processing capability is stored in the connections of synaptic weights, and whose adaptation depends on learning [44]. The mathematical model describing the functionality of each neuron is given by
y = f ( i = 1 n w i x i + b )
where y, wi, xi, b, f(·), and n are the output, synaptic weights, inputs, bias, activation function, and the total number of inputs, respectively. To define the network weights, a training process is carried out where pairs of input–output data are presented, then a training rule is defined for adjusting these weights.

2.5. Smart-Sensor

The smart-sensor proposed here is based on a low-cost system on a chip (SoC) field-programmable gate array (FPGA) to estimate the insulation health of an induction motor. Figure 3 shows the scheme of the structure of the proposed smart-sensor. The system uses a coil sensor and a thermocouple sensor as primary sensors that can be installed on the frame of the analyzed IM to capture the stray flux and temperature of the IM, respectively. The information coming from the primary sensors is acquired in the data acquisition system (DAS) module, then the signal processing is performed in the FPGA-based HSP unit by applying suitable time-frequency decomposition (TFD) tools and by extracting an efficient indicator based on the wavelet entropy. Finally, the estimated health of the insulation is supplied to the final user using an liquid crystal display (LCD).

2.5.1. Primary Sensors

Two sensors are used as primary sensors—one flux sensor, and one thermocouple sensor. The flux sensor is generated by 1000 turns of a coil. Its dimensions are specified in Figure 4b. The main purpose of the coil is to detect the largest amount of stray flux possible through the induced electromotive force (emf) in that coil. The coil is protected with a material that is able to isolate the greater amount of electromagnetic noise coming from the outside using a special meshed cable for the transmission of the induced voltage towards the DAS. On the other hand, to capture the temperature of the analyzed IM, an E-type thermocouple sensor (Figure 4a) is used, since it is a non-magnetic sensor and has a wide temperature ranging from −50 °C to 740 °C.

2.5.2. DAS and LCD

As secondary elements, the DAS and LCD modules enable the interaction between the final user and the primary sensors. On the one hand, the DAS module is constituted by a signal-conditioning submodule and an ADS7841 analog-to-digital converter. The signal-conditioning module is composed of one operational amplifier with two processing stages, the first of which is configured to sum a constant voltage to the input flux signal, while the second amplifies it by a factor of 10 in order to standardize the input-voltage range to the analog-to-digital converter used. On the other hand, the LCD is used to display the estimated winding insulation degradation to the final user.

2.6. HSP Unit

The FPGA-based HSP unit is created by processing the DWT, feature-extraction wavelet entropy, and regression FFNN, and by mapping the min–max function to normalize inputs and outputs of the FFNN, as shown in Figure 5. First, the input emf signal ( ϕ ) is decomposed by the DWT in multiple “wavelet signals” in order to obtain the time-frequency representation of the input signal in well-known frequency bands. Then, the feature extraction is performed by applying Equation (3). Note that the S W T value of a signal is a normalized parameter ranging from zero to 1, where a minimum value indicates a light disorder in the analyzed signal (that is, the signal is mainly represented by one wavelet signal having the highest amplitude). On the other hand, if the value is near 1, the analyzed signal is considered to have a high disorder, since it penetrates several wavelet signals, each one having high relative amplitudes. Next, the min–max function map normalizes the IM temperature signal (T) and the S W T , in order to perform the mathematical operations inside the FFNN in a defined closed range. Finally, the FFNN unit performs the regression diagnosis by using the normalized values of the extracted S W T and the temperature of the induction motor as inputs.
Figure 6 shows the emf and induction motor temperature signals processing the flow to the FFNN evaluation for the purpose of obtaining a health estimation of the winding insulation. The processing flow starts with the emf signal acquisition; then, it is computed by the DWT to a level defined by the final user. The next step is to obtain the S W T parameter from the detail decomposition signals after performing the DWT by applying Equation (4). Finally, wavelet entropy and induction machine temperature are used as inputs to the FFNN, so that the information of both parameters can be combined to offer an automated estimation of the health of the winding insulation. Note that the FFNN is composed of one input layer with two input neurons (the wavelet entropy and the induction machine temperature); two hidden layers with four and two neurons, respectively; and one output neuron (the estimated health of the winding insulation, a parameter shown to the final user via the LCD). To specify the health of the winding insulation, results are shown in a continuous scale ranging from 10% (indicating a severe degradation) up to 95% (implying a healthy winding insulation system).

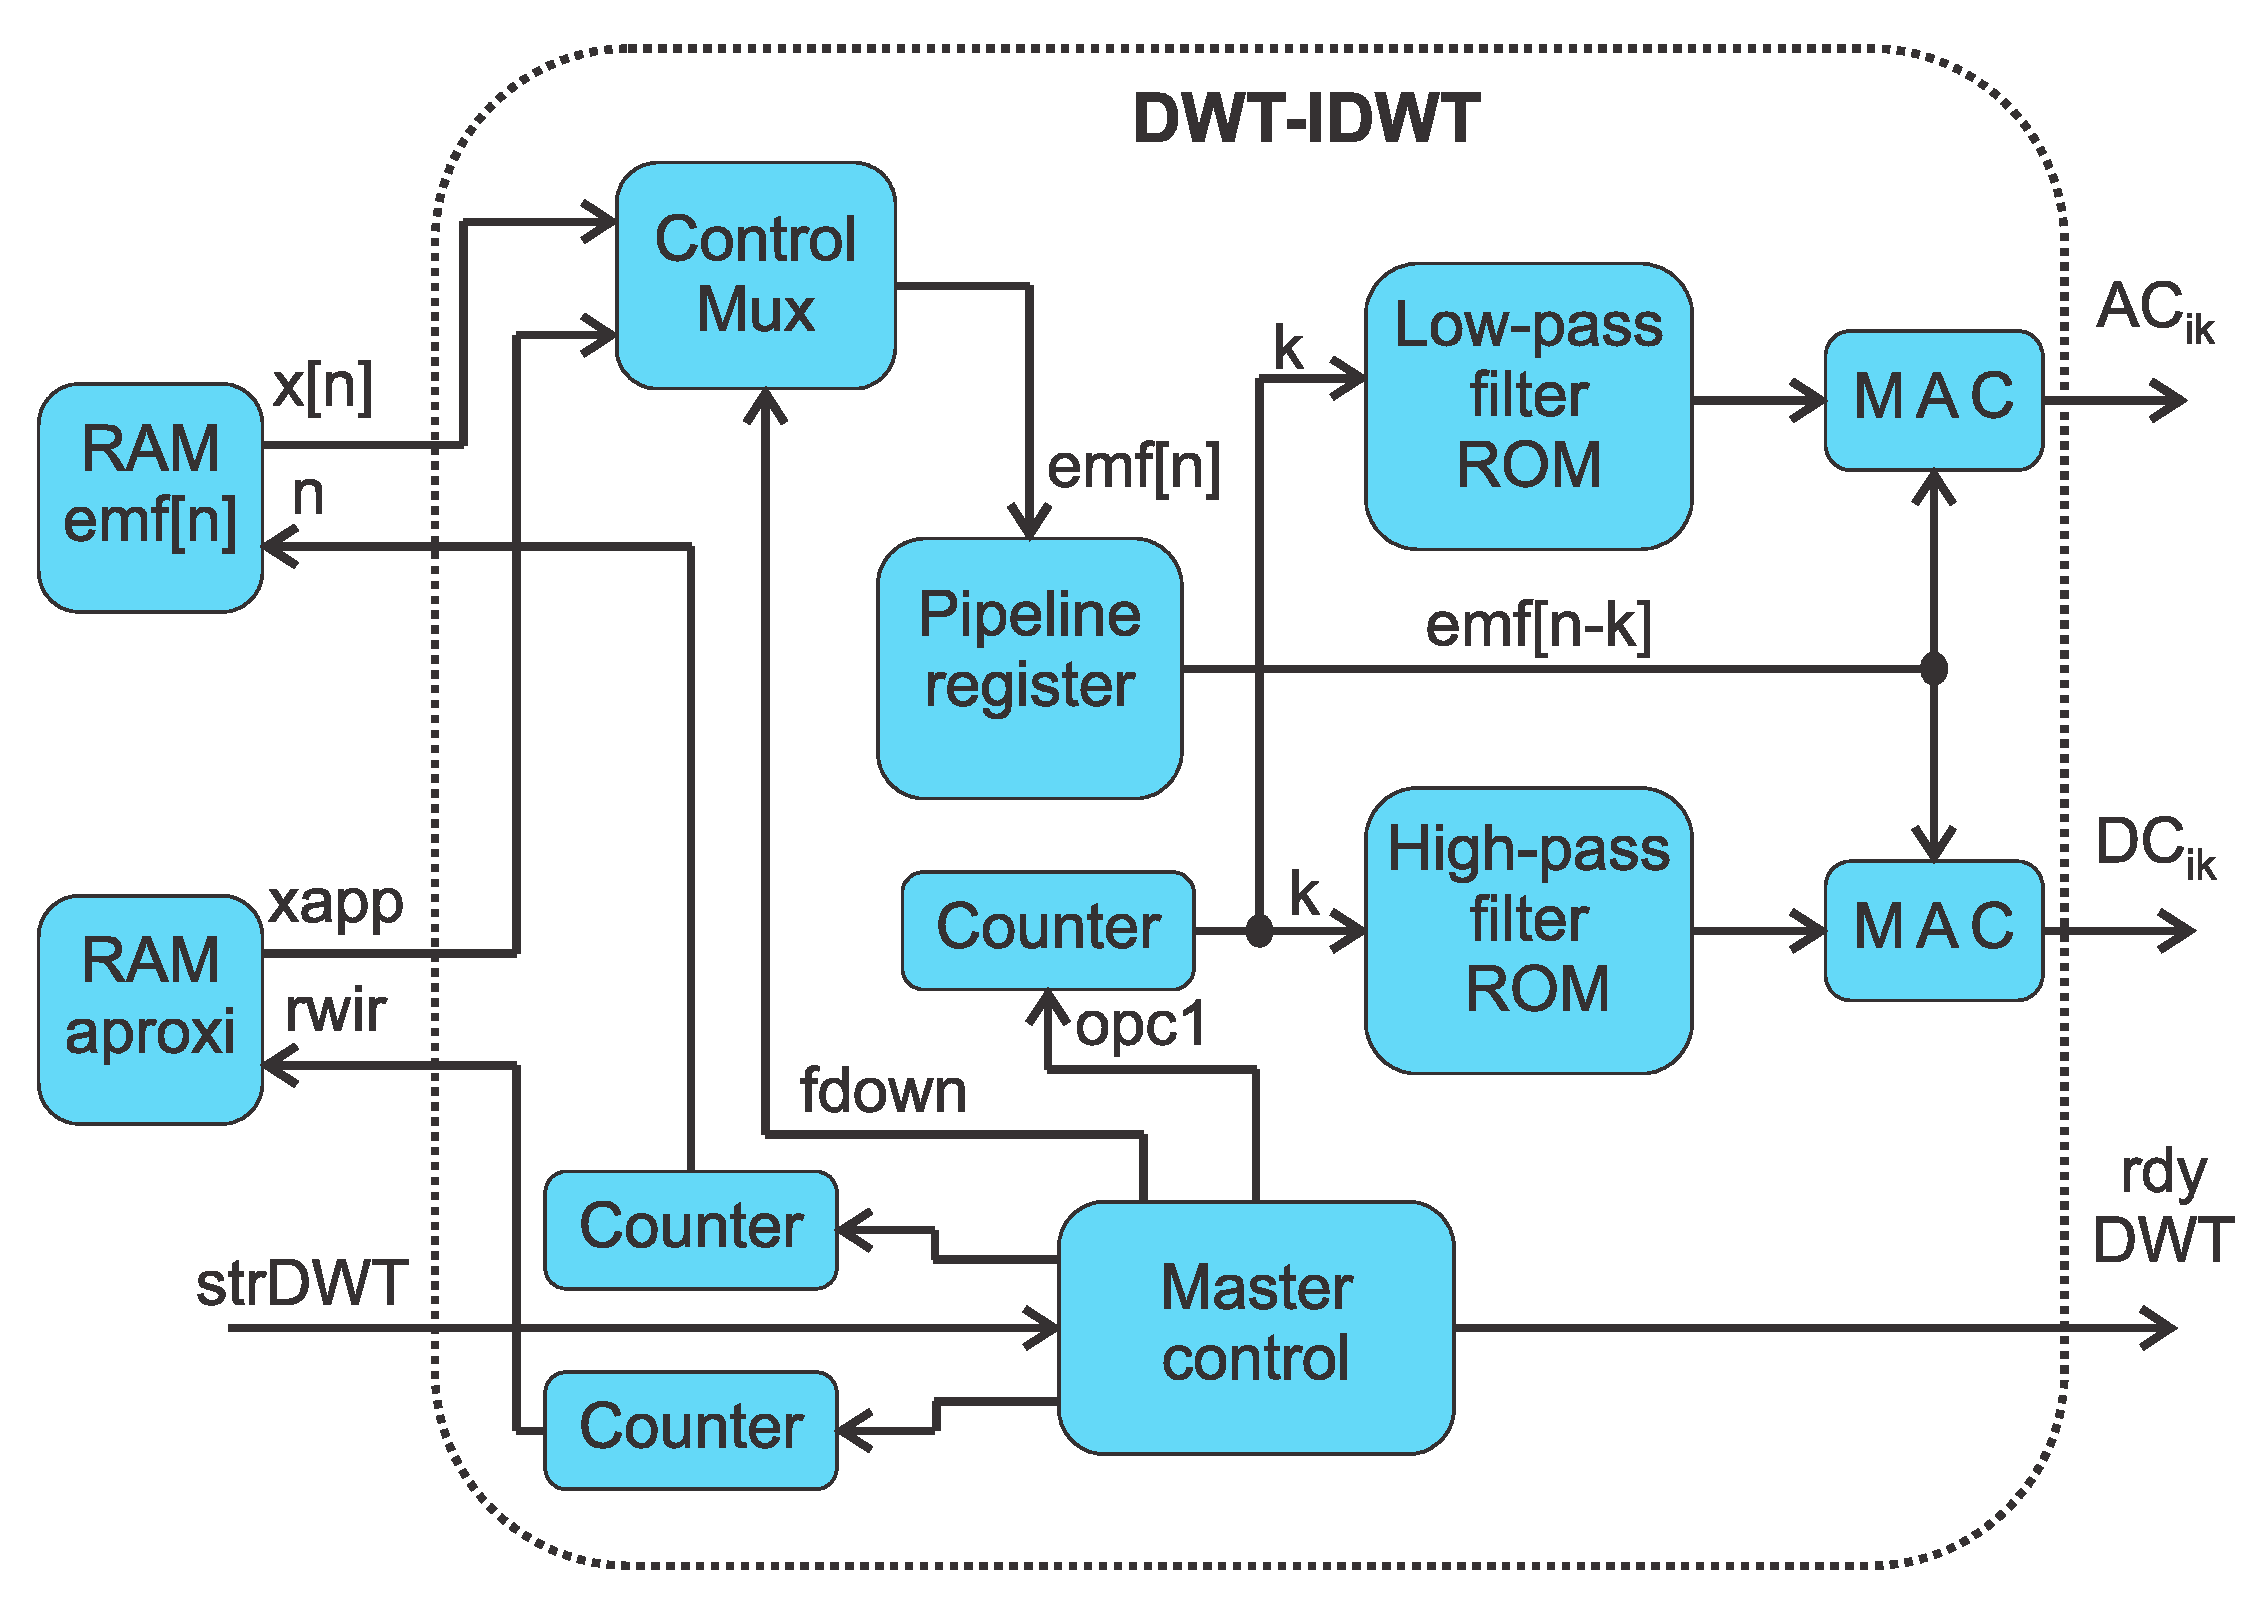
2.6.1. DWT–IDWT Digital Structure

In Figure 7, the counters n and rwdir indicate the index of the sample x[n] to read and the read/write direction of the approximation and detail coefficients, respectively. Note that it is necessary to fill the RAMemf[n] with the number of samples from the coil sensor specified by the user prior to testing. When asserting strDWT, the module starts to compute the convolution operation defined by Equation (2), which is essentially composed of a multiply–accumulate (MAC) process. The MAC operation requires the coefficients of a filter obtained from four Read-only Memory (ROM)previously filled with the corresponding coefficients (ROM Lo-D and ROM Hi-D for low-pass and high-pass decomposition filters, respectively; and ROM Lo-R and ROM Hi-R for low-pass and high-pass reconstruction filters, respectively), as well as the emf[n-k] signal, which is obtained by passing emf[n] through a k-level pipeline register. Finally, when the computation process is finished, signal rdyDWT is set to high. The approximation and detail coefficients will be given by the output signals a C i k and d C i k , respectively.

2.6.2. Wavelet Entropy Digital Structure

Figure 8 shows a block diagram of the proposed digital architecture used to obtain the wavelet entropy of a signal by applying Equation (3) where the MAC process is the main operation. Note that it is essential to fill the RAM and RAM-pi with the corresponding relative wavelet energies p i of the corresponding “wavelet signals” prior to testing. To start the S W T computation, the signal StrWE is asserted. After that, the counter Rddir selects the signal p i to be processed, and the log2(pi2) is computed by applying the algorithm proposed in [45], since it offers an easy implementation in hardware. Next, to obtain the required log e ( p i 2 ) value, a simple multiplication factor defined by Equation (9) is applied to log 2 ( p i 2 ) .
log e ( x ) = log 2 ( x ) log 2 ( e ) 0 , 693147 * log 2 ( x )

2.6.3. FFNN Digital Structure

Figure 9 shows the block diagram of the proposed digital architecture to compute a regression FFNN. When the signal strANN is asserted, the input signals S W T and T are stored in in the first two memory elements of the Ni submodule. Note that the submodule Ni works as a storage memory for the total number of neurons that constitute the FFNN architecture used here (that is, neurons on the input layer, neurons on the hidden layers and neurons on the output layer). Memory ROMs ROMidx-rd, ROMwi, ROM-layer, and ROMb[i] store the indices of each neuron to read/write, depending on the actual layer (layer), synaptic weights, and biases. This design is based on a MAC operation in order to save element resources and use only one multiplier. The inputs for the MAC operation are the synaptic weights ( w i ) and the corresponding neuron outputs ( x i ). Finally, when the MAC process is finished, its output is summed by the corresponding bias ( b i ) in order to compute the activation function tansig(x) using the piece-wise linear function defined in [46].
To train the FFNN, the information of the wavelet entropy and motor frame temperature are used. In addition, to establish a frame of reference between a motor with healthy winding insulation and a motor with a degraded insulation system, the index of dielectric absorption of the motor is extracted by means of a megger device during the degradation tests. These data (wavelet entropy, motor frame temperature, and dielectric absorption index) are obtained during the process of induced degradation to the winding insulation system on a three-phase induction motor whose characteristics are specified in the results section. The wavelet entropy and the temperature of the motor frame are used as the input data set for the training of the neural network and as the desired output, then the interpolation between the dielectric absorption rates obtained for each test are carried out and limits are established for the purposes of this work (that is, 95% for a healthy motor, and 10% for motor with serious winding insulation degradation).

3. Results

The diagnostic procedure and functionality of the smart-sensor proposed in this paper was validated in the laboratory on six IMs with the following same characteristics: 1.1 kW, 400 V, Y-connected, 50 Hz, 4 poles, where several experiments were carried out for healthy IMs and IMs with induced winding insulation degradation, as explained below.

Experimental Set-Up

An experimental test bench was designed to develop and implement the diagnostic technique proposed here and simulate a load using a three-phase squirrel-cage induction motor connected to a Direct Current (DC) generator, as shown in Figure 10b,c, respectively. The coil sensor and the thermocouple sensor (see Figure 10a), which was connected to the encased proprietary FPGA-based HSP unit, were attached to the frame of the motor. The laboratory room where the experiments were carried out was a closed space where the ambient temperature was maintained at an approximate value of 26 °C. Other elements that could potentially interfere with the experiments were removed (inverters, other test benches, etc.) to ensure that no other factor might influence the results.
Two different experiments were carried out in order to probe the functionality and effectiveness of the proposed smart-sensor. In the first experiment, five IMs with the same characteristics but different health statuses where diagnosed. The smart-sensor was placed on the frame of a healthy motor, then on an IM with one or two broken bars (one of the most common failures in this type of motor), but with a healthy winding insulation. Finally, smart-sensors were added to one IM with light winding insulation degradation, and one with severe winding insulation degradation. All experiments in this first stage were developed maintaining the same operating temperature in order to keep the winding insulation temperature in a controlled range of approximately 26 °C.
In the second experiment, a winding insulation degradation was progressively induced to one IM, in order to fully diagnose several levels of deterioration. With the purpose of establishing a reference between a healthy motor and a faulty motor in the insulation system, the first IM used was in a healthy condition at the beginning of the tests. Afterwards, an overheating of the winding insulation was artificially created by connecting and disconnecting one of the motor supply phases in successive cycles. In that way, while one phase was disconnected, the other two were overloaded, leading to abrupt thermal increments that produced higher temperatures than those defined by the thermal class of the insulation (class F). The connection–disconnection cycles of one supply phase were repeated a large number of times, a fact that led to an accelerated degradation of the insulation due to thermal effects. It is worth noting that this experimental setup tries, for the first time, to study the thermal degradation that the insulation system of an induction motor suffers when it is in service (that is, before a short circuit occurs between turns). A total of 100 tests were carried out on the same induction motor, thus generating a premature and irreversible wear to the insulation of the winding, since the temperatures reached in the machine frame exceeded 150 °C. This level implies that much higher temperatures were present inside the motor that clearly exceeded the limit for class insulation (155 °C at the hottest point).

4. Discussion

In this section, the results obtained from testing the smart-sensor by installing it on six similar induction motors with different induced failures are shown.
Firstly, to probe the effectiveness of the smart-sensor and diagnose the winding insulation degradation over different faults, the smart-sensor was installed on five IMs at an ambient temperature (26 °C), all with the same constructive characteristics, but with each one possessing a special failure case, namely: minimal insulation degradation, light insulation degradation, severe insulation degradation, and an IM with one and two broken bars, but with a healthy winding insulation.
It can be clearly seen in Figure 11 how the S W T parameter amplitudes were highly related to the winding insulation degradation, and it is also evident that the combined failures negligibly affected negligibly the results (that is, other failures like broken bars—one of the most frequent failures in IMs—did not affect the proposed methodology).
Figure 12 shows the results obtained when using the smart-sensor to compute the wavelet entropy for different prematurely induced degradation stages on the winding insulation of an IM. At the top of the same figure, the temperatures reached on the IM frame for different test points are shown, in order to contrast the results of when the temperature changes drastically. Similarly, five results displayed by the LCD of the smart-sensor proposed here are included, and shown at the top of Figure 12. These results correspond to tests labeled as A, B, C, and D for different winding insulation health states. For this purpose, over 100 tests were run. In each test, the winding insulation was degraded continuously. Evidently, the more severe the winding insulation degradation, the higher the amplitude of the wavelet entropy. Furthermore, note how the S W T parameter is also dependent on the temperature of the motor, since numerous tests showed an increase of S W T amplitudes with higher temperatures (especially in frame temperatures above 130 °C). Additionally at the top of Figure 12, the diagnosis offered by the smart-sensor proposed here is shown. The final results ranged from 10% to 95%, indicating the healthiness of the winding insulation (where 10% indicates a severe degradation, and 95% indicates very low or null degradation).
Considering a wavelet entropy value over 0.18 at ambient temperature (26 °C), a threshold value of 35% or below could be set as the criterion for discriminating between healthy and severe winding insulation system (requiring immediate maintenance) conditions (see Figure 12).

5. Conclusions

This work has introduced a new approach to performing an online estimation of the status of winding insulation degradation in IMs (a very common failure in this type of motors). The methodology is implemented in an FPGA in order to generate a smart-sensor, which is achieved by developing the digital cores needed to compute the DWT, the S W T index, and the regression FFNN. These tools provide the smart-sensor with the capability to automatically diagnose the health of the winding insulation, specifically before incipient faults progress into irreversible damage to the motor, making the smart-sensor an excellent device for the online diagnosis of winding insulation degradation.
What makes the smart-sensor proposed here even more attractive, is that the signal processing tools rely on a stray-flux analysis combined with the temperature of the analyzed IM, where the signals are obtained from a coil sensor and an E-type thermocouple sensor, both of which are installed externally on the motor frame. The coil sensor complies with several characteristics that make it an excellent alternative as a source of information, including its simple design, small size, low cost, installation flexibility, and non-invasive nature.
Furthermore, the proposed methodology relies on the study of the WE parameter obtained from the stray flux captured by a coil sensor. The wavelet entropy provides a very useful and practical index to gather information related to the analyzed signal, since it can characterize and combine the dynamism and order/disorder of this signal in a single value.
In addition, it can be deduced from the results obtained here that the S W T was sensitive to temperature variations in the analyzed IM, so it is very important to take this fact into account when diagnosing the severity degradation of the winding insulation, which was situation-controlled by the FFNN in this proposal.
For future work, the authors propose to further research in this open field, and suggest testing different IMs in order to deepen knowledge of the relationship discovered between the IM temperature and winding insulation degradation.

Author Contributions

J.A.A.-D. and R.A.O.-R. conceived and designed the experiments; I.Z.-R. performed the experiments and processed data; J.A.A.-D., R.A.O.-R., and R.d.J.R.-T. analyzed the data; I.Z.-R. and M.T.-H. wrote the paper.

Funding

We would like to thank Consejo Nacional de Ciencia y Tecnología (CONACYT) for providing economic support in this work (scholarship). Finally, thanks to the next projects: SEP-CONACYT 222453-2013, and FOFIUAQ-FIN201812. This wok was also funded by Spanish ‘Ministerio de Ciencia Innovación y Universidades’ and FEDER program in the framework of the ‘Proyectos de I+D de Generación de Conocimiento del Programa Estatal de Generación de Conocimiento y Fortalecimiento Científico y Tecnológico del Sistema de I+D+i, Subprograma Estatal de Generación de Conocimiento’ (ref: PGC2018-095747-B-I00).

Conflicts of Interest

The authors declare no conflict of interest.

References

  1. Al Badawi, F.S.; AlMuhaini, M. Reliability modelling and assessment of electric motor driven systems in hydrocarbon industries. IET Electr. Power Appl. 2015, 9, 605–611. [Google Scholar] [CrossRef]
  2. Trejo-Hernandez, M.; Osornio-Rios, R.A.; Romero-Troncoso, R.D.; Rodriguez-Donate, C.; Dominguez-Gonzalez, A.; Herrera-Ruiz, G. FPGA-based fused smart-sensor for tool-wear area quantitative estimation in CNC machine inserts. Sensors 2010, 10, 3373–3388. [Google Scholar] [CrossRef] [PubMed]
  3. Cabal-Yepez, E.; Garcia-Ramirez, A.G.; Romero-Troncoso, R.J.; Garcia-Perez, A.; Osornio-Rios, R.A. Reconfigurable monitoring system for time-frequency analysis on industrial equipment through STFT and DWT. IEEE Trans. Ind. Inform. 2013, 9, 760–771. [Google Scholar] [CrossRef]
  4. Granados-Lieberman, D.; Romero-Troncoso, R.; Cabal-Yepez, E.; Osornio-Rios, R.; Franco-Gasca, L. A real-time smart sensor for high-resolution frequency estimation in power systems. Sensors 2009, 9, 7412–7429. [Google Scholar] [CrossRef]
  5. Cabal-Yepez, E.; Fernandez-Jaramillo, A.A.; Romero-Troncoso, R.J.; Garcia-Perez, A.; Osornio-Rios, R.A. Smart sensor for electrical machine monitoring through statistical analysis. In Proceedings of the 2012 XXth International Conference on Electrical Machines, 2–5 September 2012. [Google Scholar]
  6. Garcia-Ramirez, A.G.; Osornio-Rios, R.A.; Granados-Lieberman, D.; Garcia-Perez, A.; Romero-Troncoso, R.J. Smart sensor for online detection of multiple-combined faults in VSD-fed induction motors. Sensors 2012, 12, 11989–12005. [Google Scholar] [CrossRef]
  7. Zhang, P.; Du, Y.; Habetler, T.G.; Lu, B. A survey of condition monitoring and protection methods for medium-voltage induction motors. IEEE Trans. Ind. Appl. 2011, 1, 34–46. [Google Scholar] [CrossRef]
  8. Bonnett, A.H.; Yung, C. Increased efficiency versus increased reliability. IEEE Ind. Appl. Mag. 2008, 14, 29–36. [Google Scholar] [CrossRef]
  9. Motor Reliability Working Group. Report of large motor reliability survey of industrial and commercial installations, Part I. IEEE Trans. Ind. Appl. 1985, 1, 865–872. [Google Scholar]
  10. Thorsen, O.V.; Dalva, M. A survey of faults on induction motors in offshore oil industry, petrochemical industry, gas terminals, and oil refineries. IEEE Trans. Ind. Appl. 1995, 31, 1186–1196. [Google Scholar] [CrossRef]
  11. Capolino, G.A.; Antonino-Daviu, J.A.; Riera-Guasp, M. Modern diagnostics techniques for electrical machines, power electronics, and drives. IEEE Trans. Ind. Electron. 2015, 62, 1738–1745. [Google Scholar] [CrossRef]
  12. Wang, L.; Li, Y.; Li, J. Diagnosis of inter-turn short circuit of synchronous generator rotor winding based on volterra kernel identification. Energies 2018, 11, 2524. [Google Scholar] [CrossRef]
  13. Malekpour, M.; Phung, B.T.; Ambikairajah, E. Online technique for insulation assessment of induction motor stator windings under different load conditions. IEEE Trans. Dielectr. Electr. Insul. 2017, 24, 349–358. [Google Scholar] [CrossRef]
  14. Cabanas, M.F.; Norniella, J.G.; Melero, M.G.; Rojas, C.H.; Cano, J.M.; Pedrayes, F.; Orcajo, G.A. Detection of stator winding insulation failures: Online and offline tests. In Proceedings of the 2013 IEEE Workshop on Electrical Machines Design, Control and Diagnosis (WEMDCD), Paris, France, 11–12 March 2013. [Google Scholar]
  15. Siddique, A.; Yadava, G.S.; Singh, B. A review of stator fault monitoring techniques of induction motors. IEEE Trans. Energy Conver. 2005, 20, 106–114. [Google Scholar] [CrossRef]
  16. Brown, A.; David, E.; Essalihi, M. Insulation resistance measurements for machine insulation. In Proceedings of the 2011 Electrical Insulation Conference (EIC), Annapolis, MD, USA, 5–8 June 2011. [Google Scholar]
  17. Stone, G.C. Recent important changes in IEEE motor and generator winding insulation diagnostic testing standards. IEEE Trans. Ind. Appl. 2005, 41, 91–100. [Google Scholar] [CrossRef]
  18. Yang, J.; Lee, S.B.; Yoo, J.; Lee, S.; Oh, Y.; Choi, C.A. Stator winding insulation condition monitoring technique for inverter-fed machines. IEEE Trans. Power Electron. 2007, 22, 2026–2033. [Google Scholar] [CrossRef]
  19. Lee, S.B.; Yang, J.; Younsi, K.; Bharadwaj, R.M. An online ground wall and phase-to-phase insulation quality assessment technique for AC-machine stator windings. IEEE Trans. Ind. Appl. 2006, 42, 946–957. [Google Scholar]
  20. Seshadrinath, J.; Singh, B.; Panigrahi, B.K. Vibration analysis based interturn fault diagnosis in induction machines. IEEE Trans. Ind. Inf. 2014, 10, 340–350. [Google Scholar] [CrossRef]
  21. Singh, G.; Kumar, T.C.; Naikan, V.N. Induction motor inter turn fault detection using infrared thermographic analysis. Infrared Phys. Tech. 2016, 77, 277–282. [Google Scholar] [CrossRef]
  22. Glowacz, A.; Glowacz, Z. Diagnosis of the three-phase induction motor using thermal imaging. Infrared Phys. Tech. 2017, 81, 7–16. [Google Scholar] [CrossRef]
  23. Stone, G.C. A perspective on online partial discharge monitoring for assessment of the condition of rotating machine stator winding insulation. IEEE Electr. Insul. Mag. 2012, 28, 8–13. [Google Scholar] [CrossRef]
  24. Wolkiewicz, M.; Tarchała, G.; Orłowska-Kowalska, T.; Kowalski, C.T. Online stator interturn short circuits monitoring in the DFOC induction-motor drive. IEEE Trans. Ind. Electron. 2016, 63, 2517–2528. [Google Scholar] [CrossRef]
  25. Gyftakis, K.N.; Kappatou, J.C. The zero-sequence current as a generalized diagnostic mean in Δ-connected three-phase induction motors. IEEE Trans. Energy Conver. 2014, 29, 138–148. [Google Scholar] [CrossRef]
  26. Cash, M.A.; Habetler, T.G.; Kliman, G.B. Insulation failure prediction in AC machines using line-neutral voltages. IEEE Trans. Ind. Appl. 1998, 34, 1234–1239. [Google Scholar] [CrossRef]
  27. Lee, S.B.; Tallam, R.M.; Habetler, T.G. A robust, online turn-fault detection technique for induction machines based on monitoring the sequence component impedance matrix. IEEE Trans. Power Electron. 2003, 18, 865–872. [Google Scholar]
  28. Dasgupta, A.; Nath, S.; Das, A. Transmission line fault classification and location using wavelet entropy and neural network. Electric Power Compon. Syst. 2012, 40, 1676–1689. [Google Scholar] [CrossRef]
  29. Rosso, O.A.; Blanco, S.; Yordanova, J.; Kolev, V.; Figliola, A.; Schürmann, M.; Başar, E. Wavelet entropy: A new tool for analysis of short duration brain electrical signals. J. Neurosci. Methods. 2001, 105, 65–75. [Google Scholar] [CrossRef]
  30. İşler, Y.; Kuntalp, M. Combining classical HRV indices with wavelet entropy measures improves to performance in diagnosing congestive heart failure. Comput. Biol. Med. 2007, 37, 1502–1510. [Google Scholar] [CrossRef]
  31. Guojun, L.; Yong, W.; Le, L.; Shaofeng, G.; Haiqing, N.; Xuemei, W. Suppressing white noise in PD signal based on wavelet entropy and improved threshold function. In Proceedings of the 2017 IEEE 11th International Symposium on Diagnostics for Electrical Machines, Power Electronics and Drives (SDEMPED), Tinos, Greece, 29 August–1 September 2017. [Google Scholar]
  32. Antonino-Daviu, J.A.; Riera-Guasp, M.; Folch, J.R.; Palomares, M.P. Validation of a new method for the diagnosis of rotor bar failures via wavelet transform in industrial induction machines. IEEE Trans. Ind. Appl. 2006, 42, 990–996. [Google Scholar] [CrossRef] [Green Version]
  33. Antonino-Daviu, J.A.; Jover, P.; Riera, M.; Arkkio, A.; Roger-Folch, J. DWT analysis of numerical and experimental data for the diagnosis of dynamic eccentricities in induction motors. Mech. Syst. Signal Proc. 2007, 21, 2575–2589. [Google Scholar] [CrossRef]
  34. Riera-Guasp, M.; Antonino-Daviu, J.A.; Pineda-Sanchez, M.; Puche-Panadero, R.; Pérez-Cruz, J.A. General approach for the transient detection of slip-dependent fault components based on the discrete wavelet transform. IEEE Transa. Ind. Electron. 2008, 55, 4167–4180. [Google Scholar] [CrossRef]
  35. Antonino-Daviu, J.A.; Riera-Guasp, M.; Pineda-Sánchez, M.; Pons-Llinares, J.; Puche-Panadero, R.; Pérez-Cruz, J. Feature extraction for the prognosis of electromechanical faults in electrical machines through the DWT. Int. J. Comput. Intell. Syst. 2009, 2, 158–167. [Google Scholar] [CrossRef]
  36. Quiroga, R.Q.; Rosso, O.A.; Başar, E.; Schürmann, M. Wavelet entropy in event-related potentials: A new method shows ordering of EEG oscillations. Biol. Cybern. 2001, 84, 291–299. [Google Scholar] [CrossRef] [PubMed]
  37. Blanco, S.; Figliola, A.; Quiroga, R.Q.; Rosso, O.A.; Serrano, E. Time-frequency analysis of electroencephalogram series. Wavelet packets and information cost function. Phys. Rev. E. 1998, 57. [Google Scholar] [CrossRef]
  38. Ramirez-Nunez, J.A.; Antonino-Daviu, J.A.; Climente-Alarcón, V.; Quijano-López, A.; Razik, H.; Osornio-Rios, R.A.; Romero-Troncoso, R.D. Evaluation of the detectability of electromechanical faults in induction motors via transient analysis of the stray flux. Trans. Ind. Appl. 2018, 54, 4324–4332. [Google Scholar] [CrossRef]
  39. Iglesias-Martínez, M.E.; Antonino-Daviu, J.A.; Fernández de Córdoba, P.; Conejero, J.A. Rotor Fault Detection in Induction Motors Based on Time-Frequency Analysis Using the Bispectrum and the Autocovariance of Stray Flux Signals. Energies 2019, 12, 597. [Google Scholar] [CrossRef]
  40. Frosini, L.; Harlişca, C.; Szabó, L. Induction machine bearing fault detection by means of statistical processing of the stray flux measurement. IEEE Trans. Ind. Electron. 2015, 62, 1846–1854. [Google Scholar] [CrossRef]
  41. Dehghan, H.; Haghjoo, F.; Cruz, S.M. A Flux-Based Differential Technique for Turn-to-Turn Fault Detection and Defective Region Identification in Line-Connected and Inverter-Fed Induction Motors. IEEE Trans. Energy Conver. 2018, 33, 1876–1885. [Google Scholar] [CrossRef]
  42. Romary, R.; Roger, D.; Brudny, J.F. Analytical computation of an AC machine external magnetic field. Euro. Phys. J.-Appl. Phys. 2009, 47. [Google Scholar] [CrossRef]
  43. Camarena-Martinez, D.; Valtierra-Rodriguez, M.; Garcia-Perez, A.; Osornio-Rios, R.A.; Romero-Troncoso, R.D. Empirical mode decomposition and neural networks on FPGA for fault diagnosis in induction motors. Sci. World J. 2014, 2014. [Google Scholar] [CrossRef]
  44. Rairán-Antolines, J.D. Reconstruction of periodic signals using neural networks. Tecnura 2014, 18, 34–46. [Google Scholar]
  45. Mitchell, J.N. Computer multiplication and division using binary logarithms. IRE Trans. Electron. Comput. 1962, 4, 512–517. [Google Scholar] [CrossRef]
  46. Tlelo-Cuautle, E.; de la Fraga, L.G.; Rangel-Magdaleno, J. Engineering applications of FPGAs; Springer: New York, NY, USA, 2016. [Google Scholar]
Figure 1. Coil sensor positions in the tested induction motor.
Energies 12 01658 g001
Figure 2. Artificial neural network (ANN): (a) feed-forward neural network (FFNN) architecture, (b) functional structure of a neuron.
Energies 12 01658 g002
Figure 3. Block diagram of the proposed smart-sensor: primary sensor, data acquisition system (DAS), field-programmable gate array (FPGA) and liquid crystal display (LCD).
Energies 12 01658 g003
Figure 4. Primary sensors: (a) thermocouple sensor, (b) coil sensor dimensions.
Energies 12 01658 g004
Figure 5. FPGA-based Hardware Signal Processing (HSP) unit: Analogical-Digital Converter (ADC), Discrete Wavelet Transform (DWT), Inverse Discrete Wavelet Transform (IDWT), Wavelet Entropy and Healthiness estimation module.
Energies 12 01658 g005
Figure 6. Proposed methodology flow.
Energies 12 01658 g006
Figure 7. Block diagram of the DWT–IDWT unit: including Random Access Memory (RAM), Multiplier Accumulator (MAC), Read-only Memory (ROM), Alternating current AC and Direct current (DC) modules.
Energies 12 01658 g007
Figure 8. Block diagram of the wavelet entropy unit.
Energies 12 01658 g008
Figure 9. Block diagram of the FFNN digital unit.
Energies 12 01658 g009
Figure 10. Laboratory test bench: (a) coil sensor and thermocouple sensor, (b) induction motor, (c) DC generator acting as the load, (d) proprietary FPGA-based HSP unit.
Energies 12 01658 g010
Figure 11. Wavelet entropy for different Induction Motors (IM) winding insulation degradations.
Energies 12 01658 g011
Figure 12. Wavelet entropy for different IM winding insulation degradation.
Energies 12 01658 g012

