Optimal Operational Strategy for Power Producers in Korea Considering Renewable Portfolio Standards and Emissions Trading Schemes

Abstract
:1. Introduction
2. Literature Review
2.1. Associated with Government Policy
2.1.1. Renewable Portfolio Standards (RPS)
2.1.2. Emission Trading Scheme (ETS)
2.2. Generation Expansion Planning (GEP) Optimization
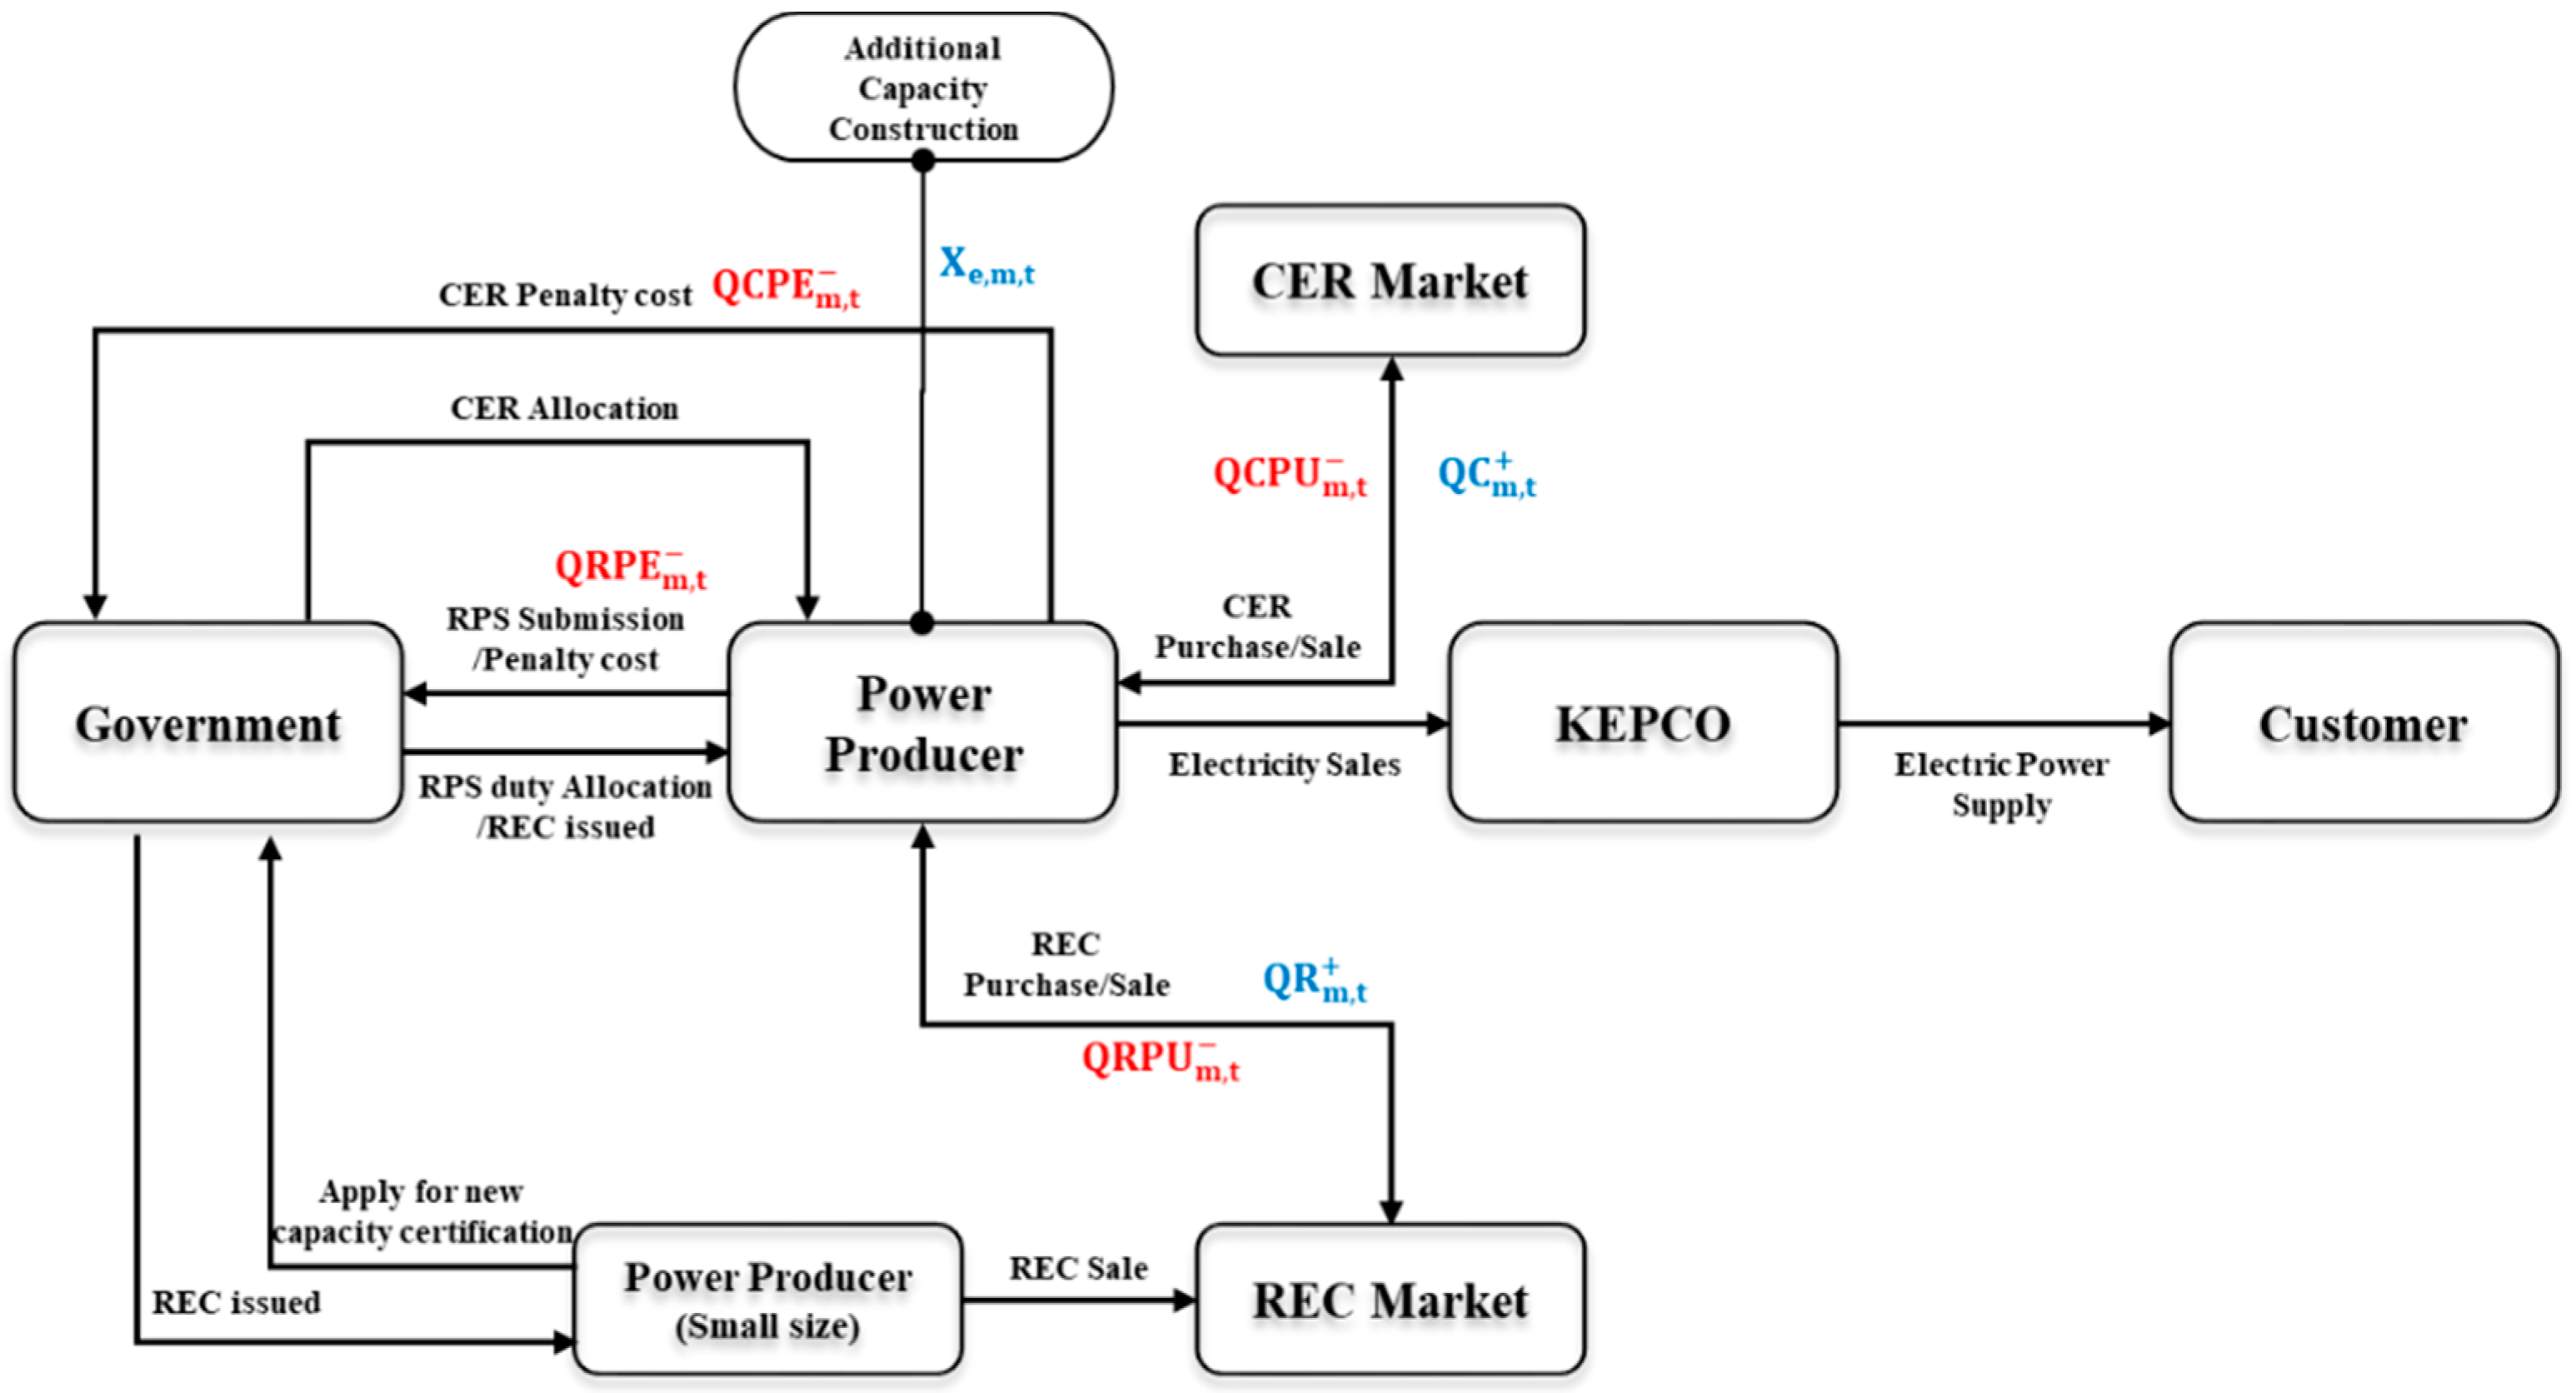
3. An Operational Scheme Considering a Combined Regulatory Environment
4. Mathematical Modeling
4.1. Problem Structure and Definition
4.2. Mathematical Model for Operational Strategy
4.2.1. Objective Function
4.2.2. Constraints
5. Scenario-Based Analysis
5.1. Input Data
5.2. Results
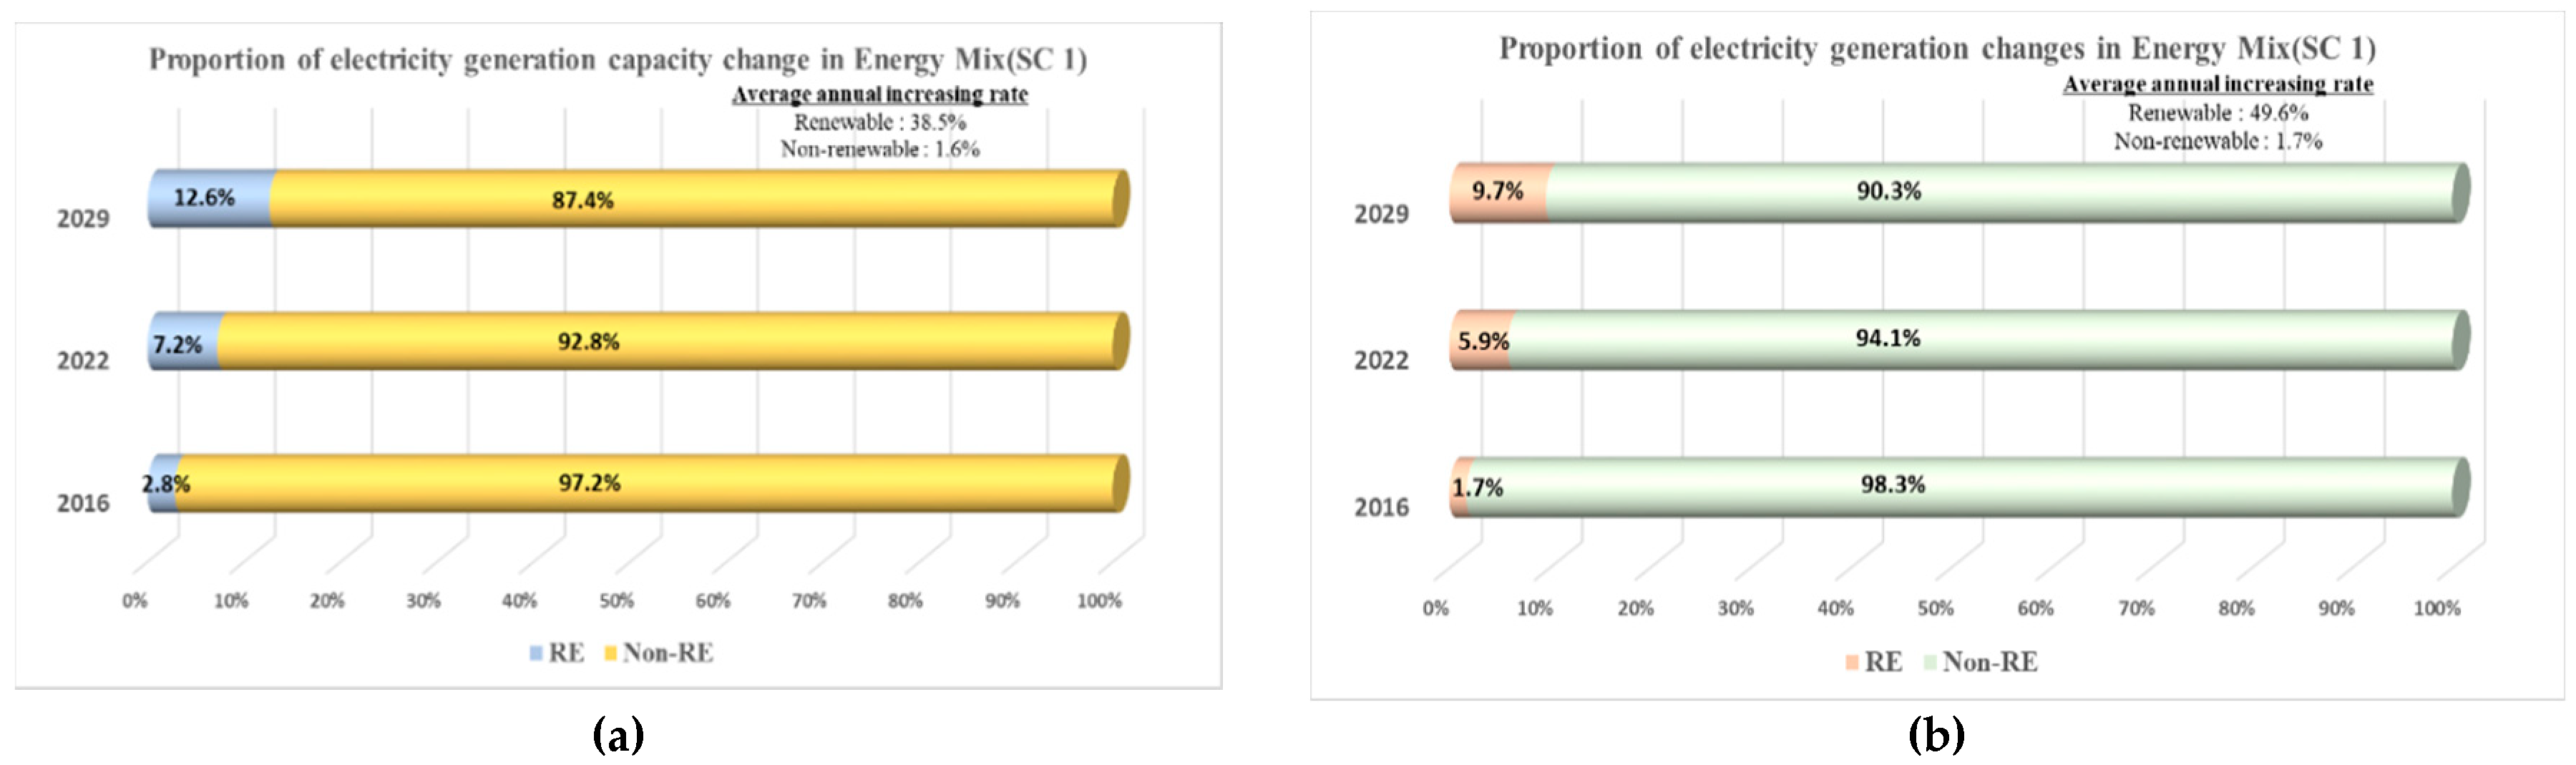
5.2.1. Scenario 1: Reference Case
5.2.2. Scenario 2: Nuclear and Coal Phase-out Scenario Considering a Strengthened RPS Duty Ratio
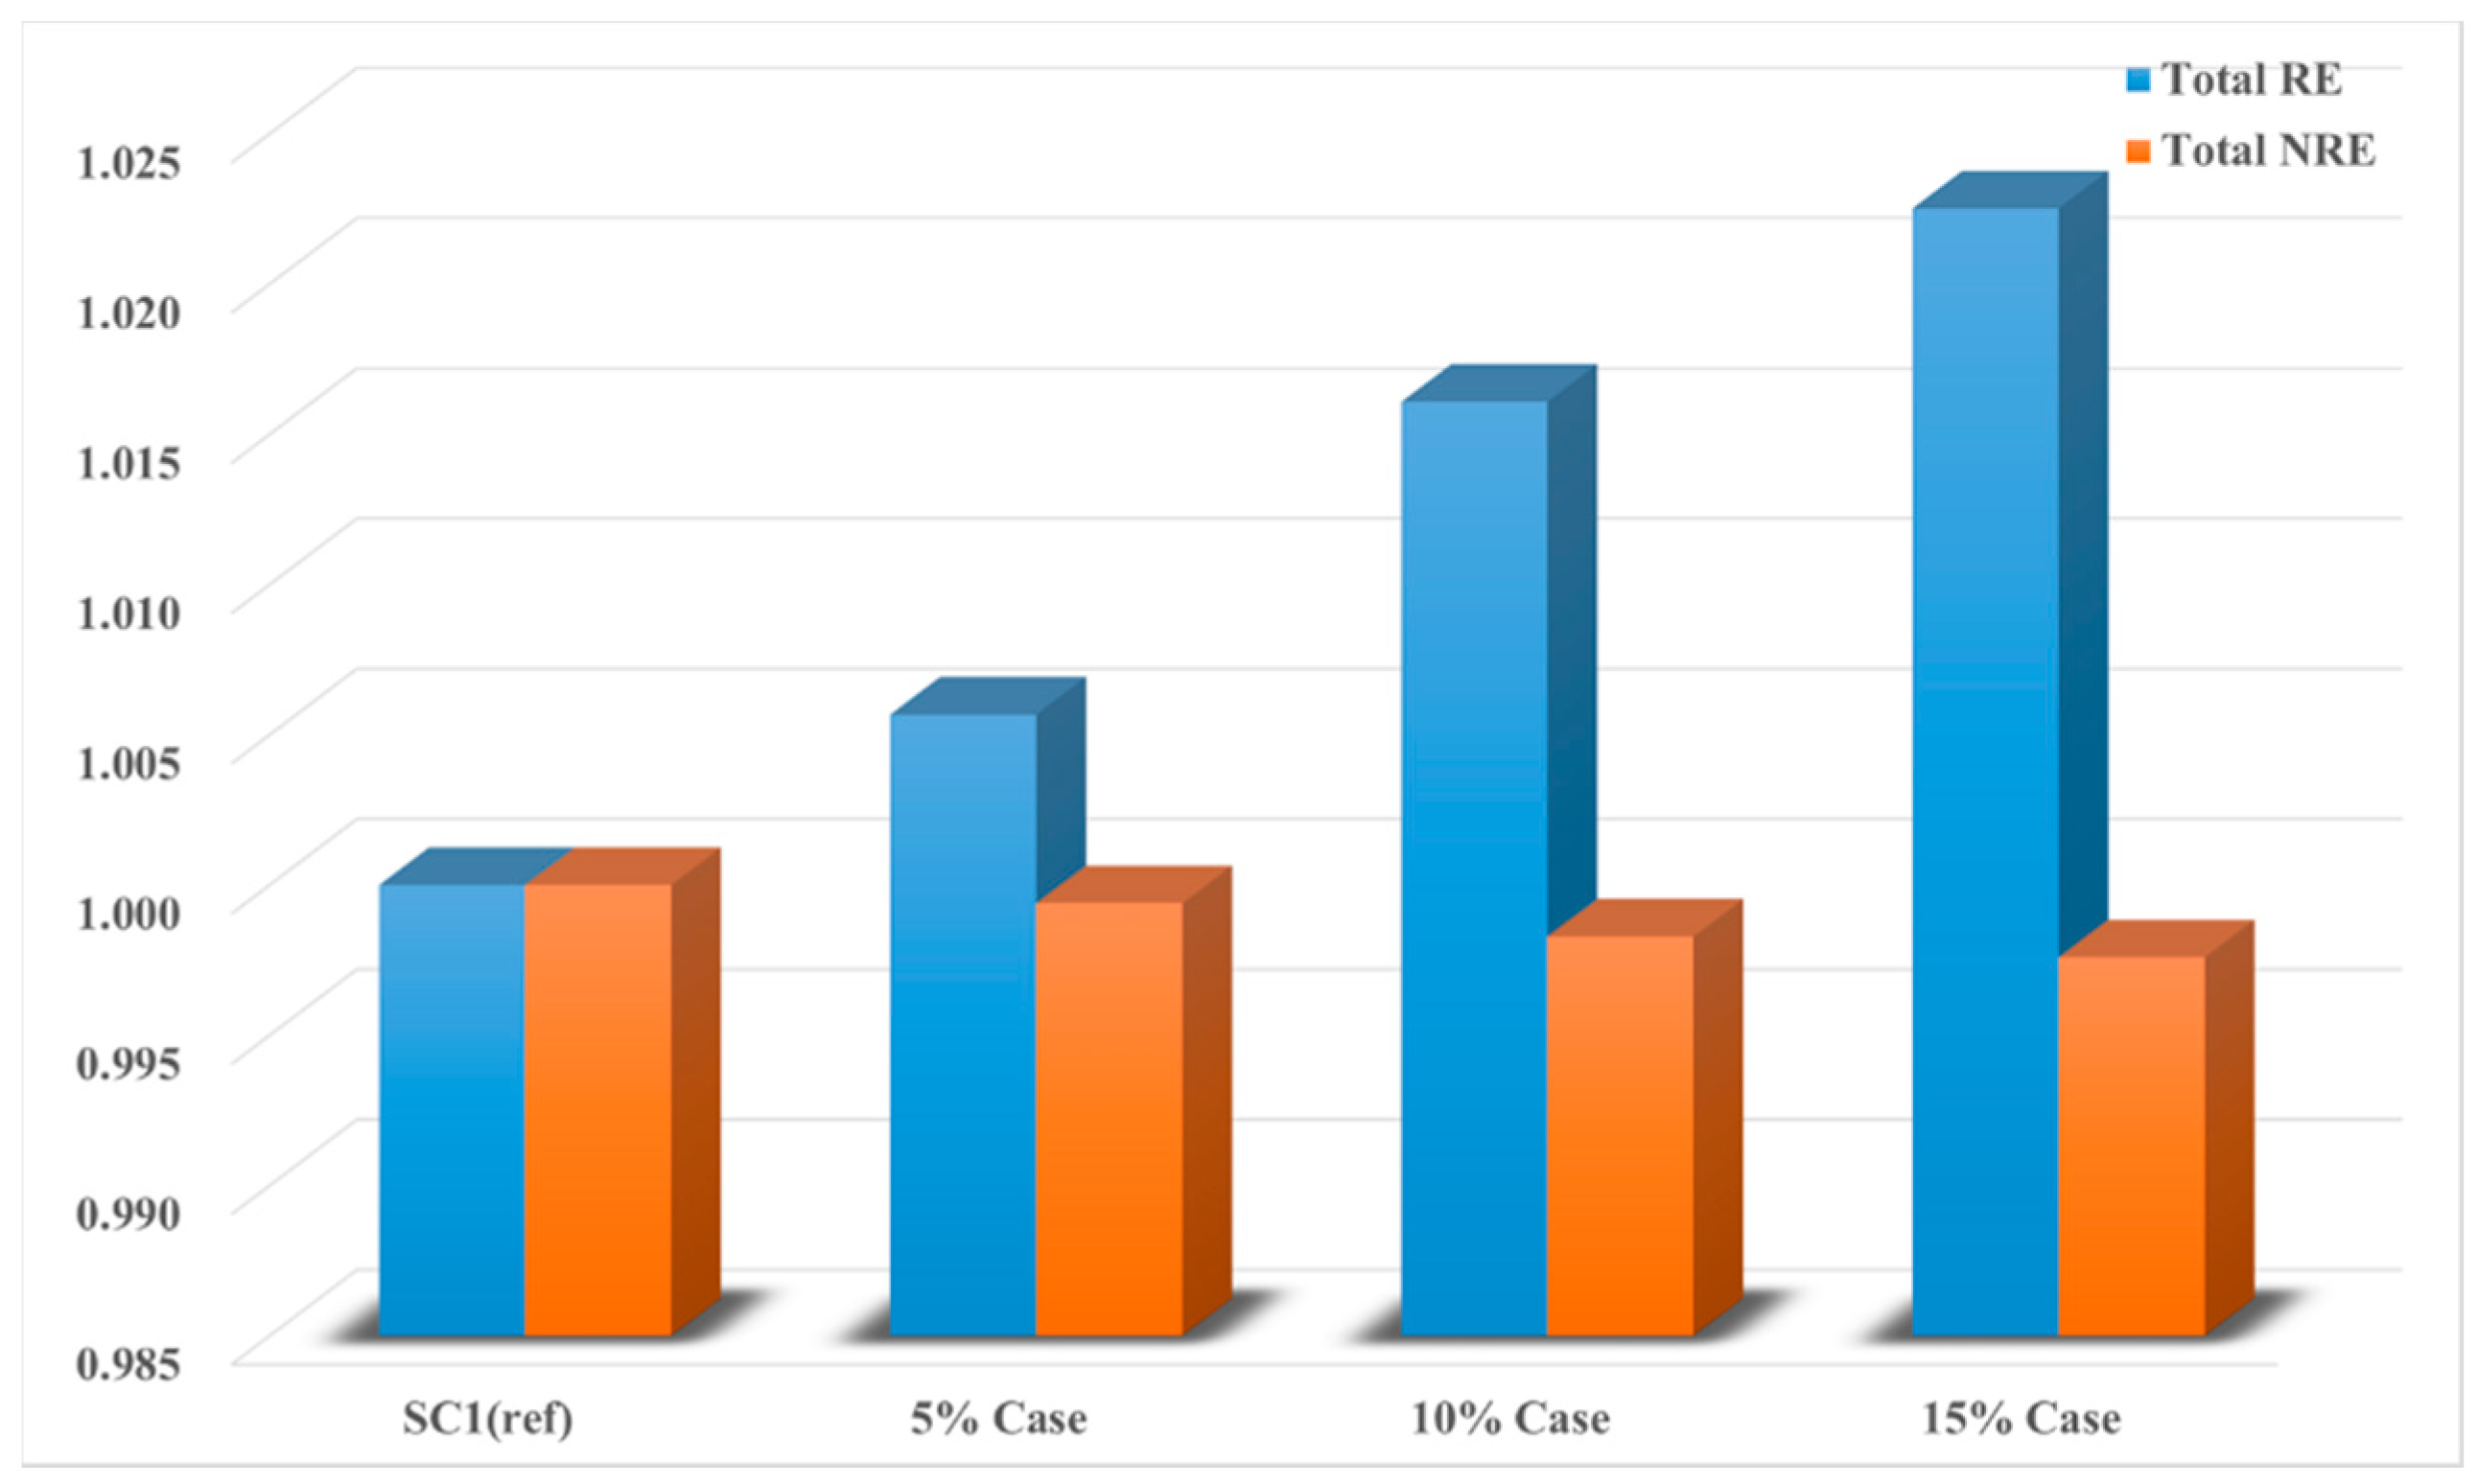
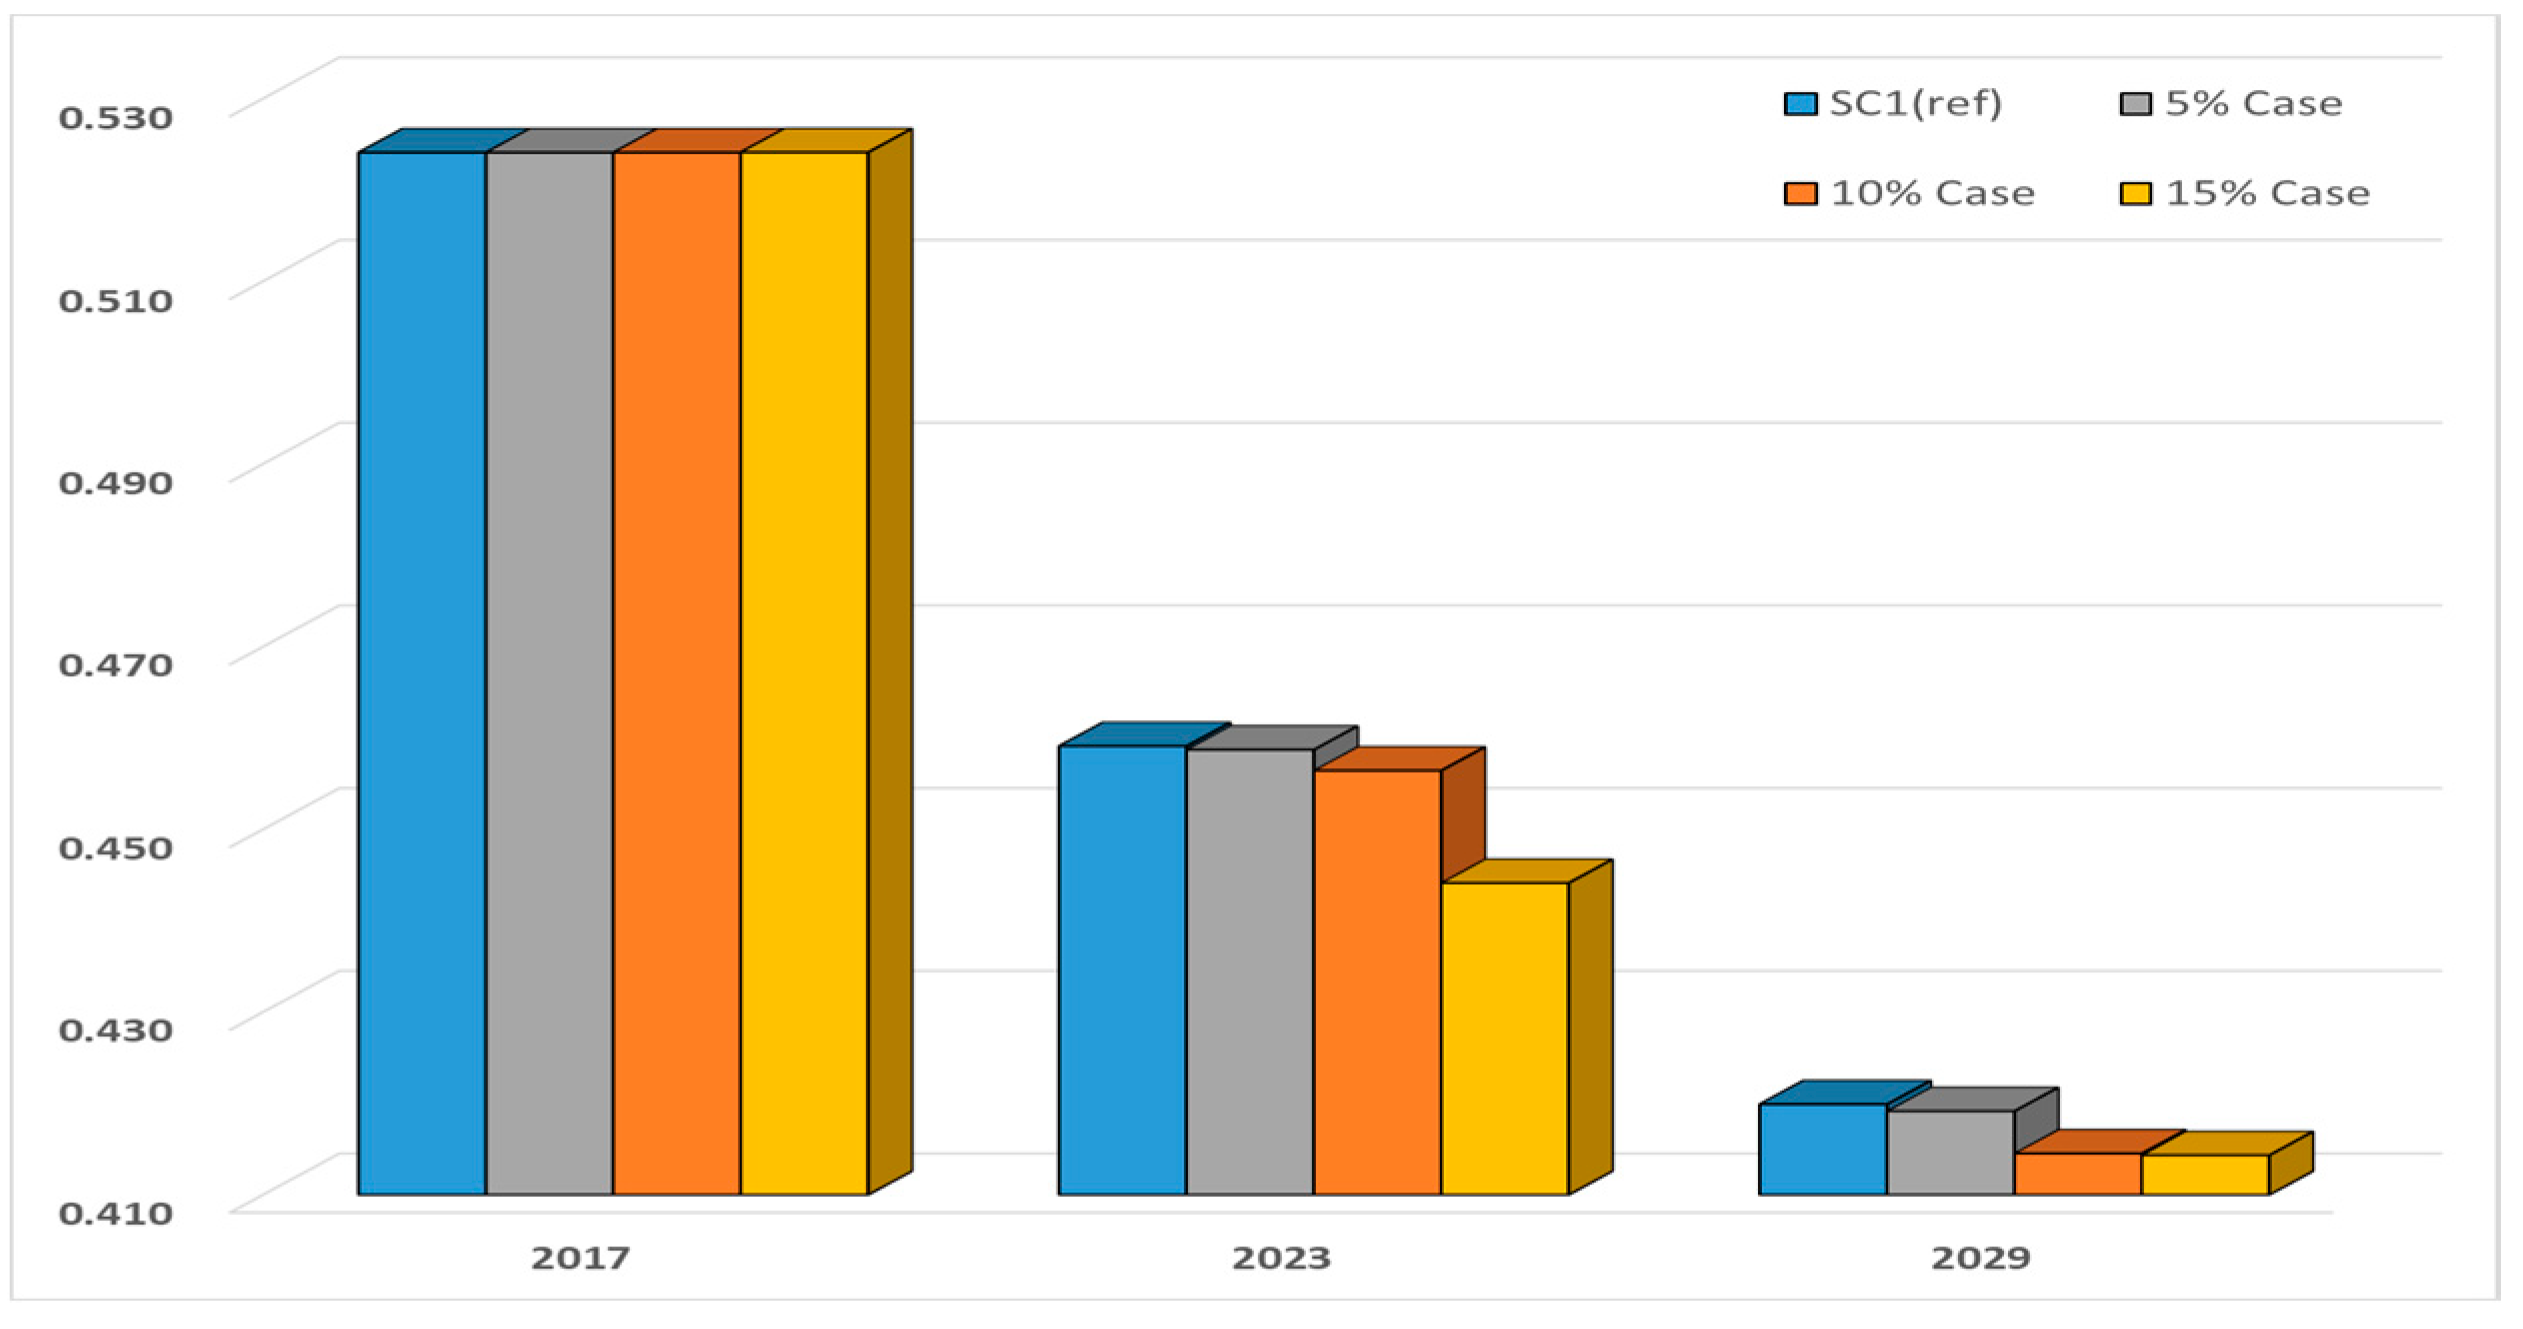
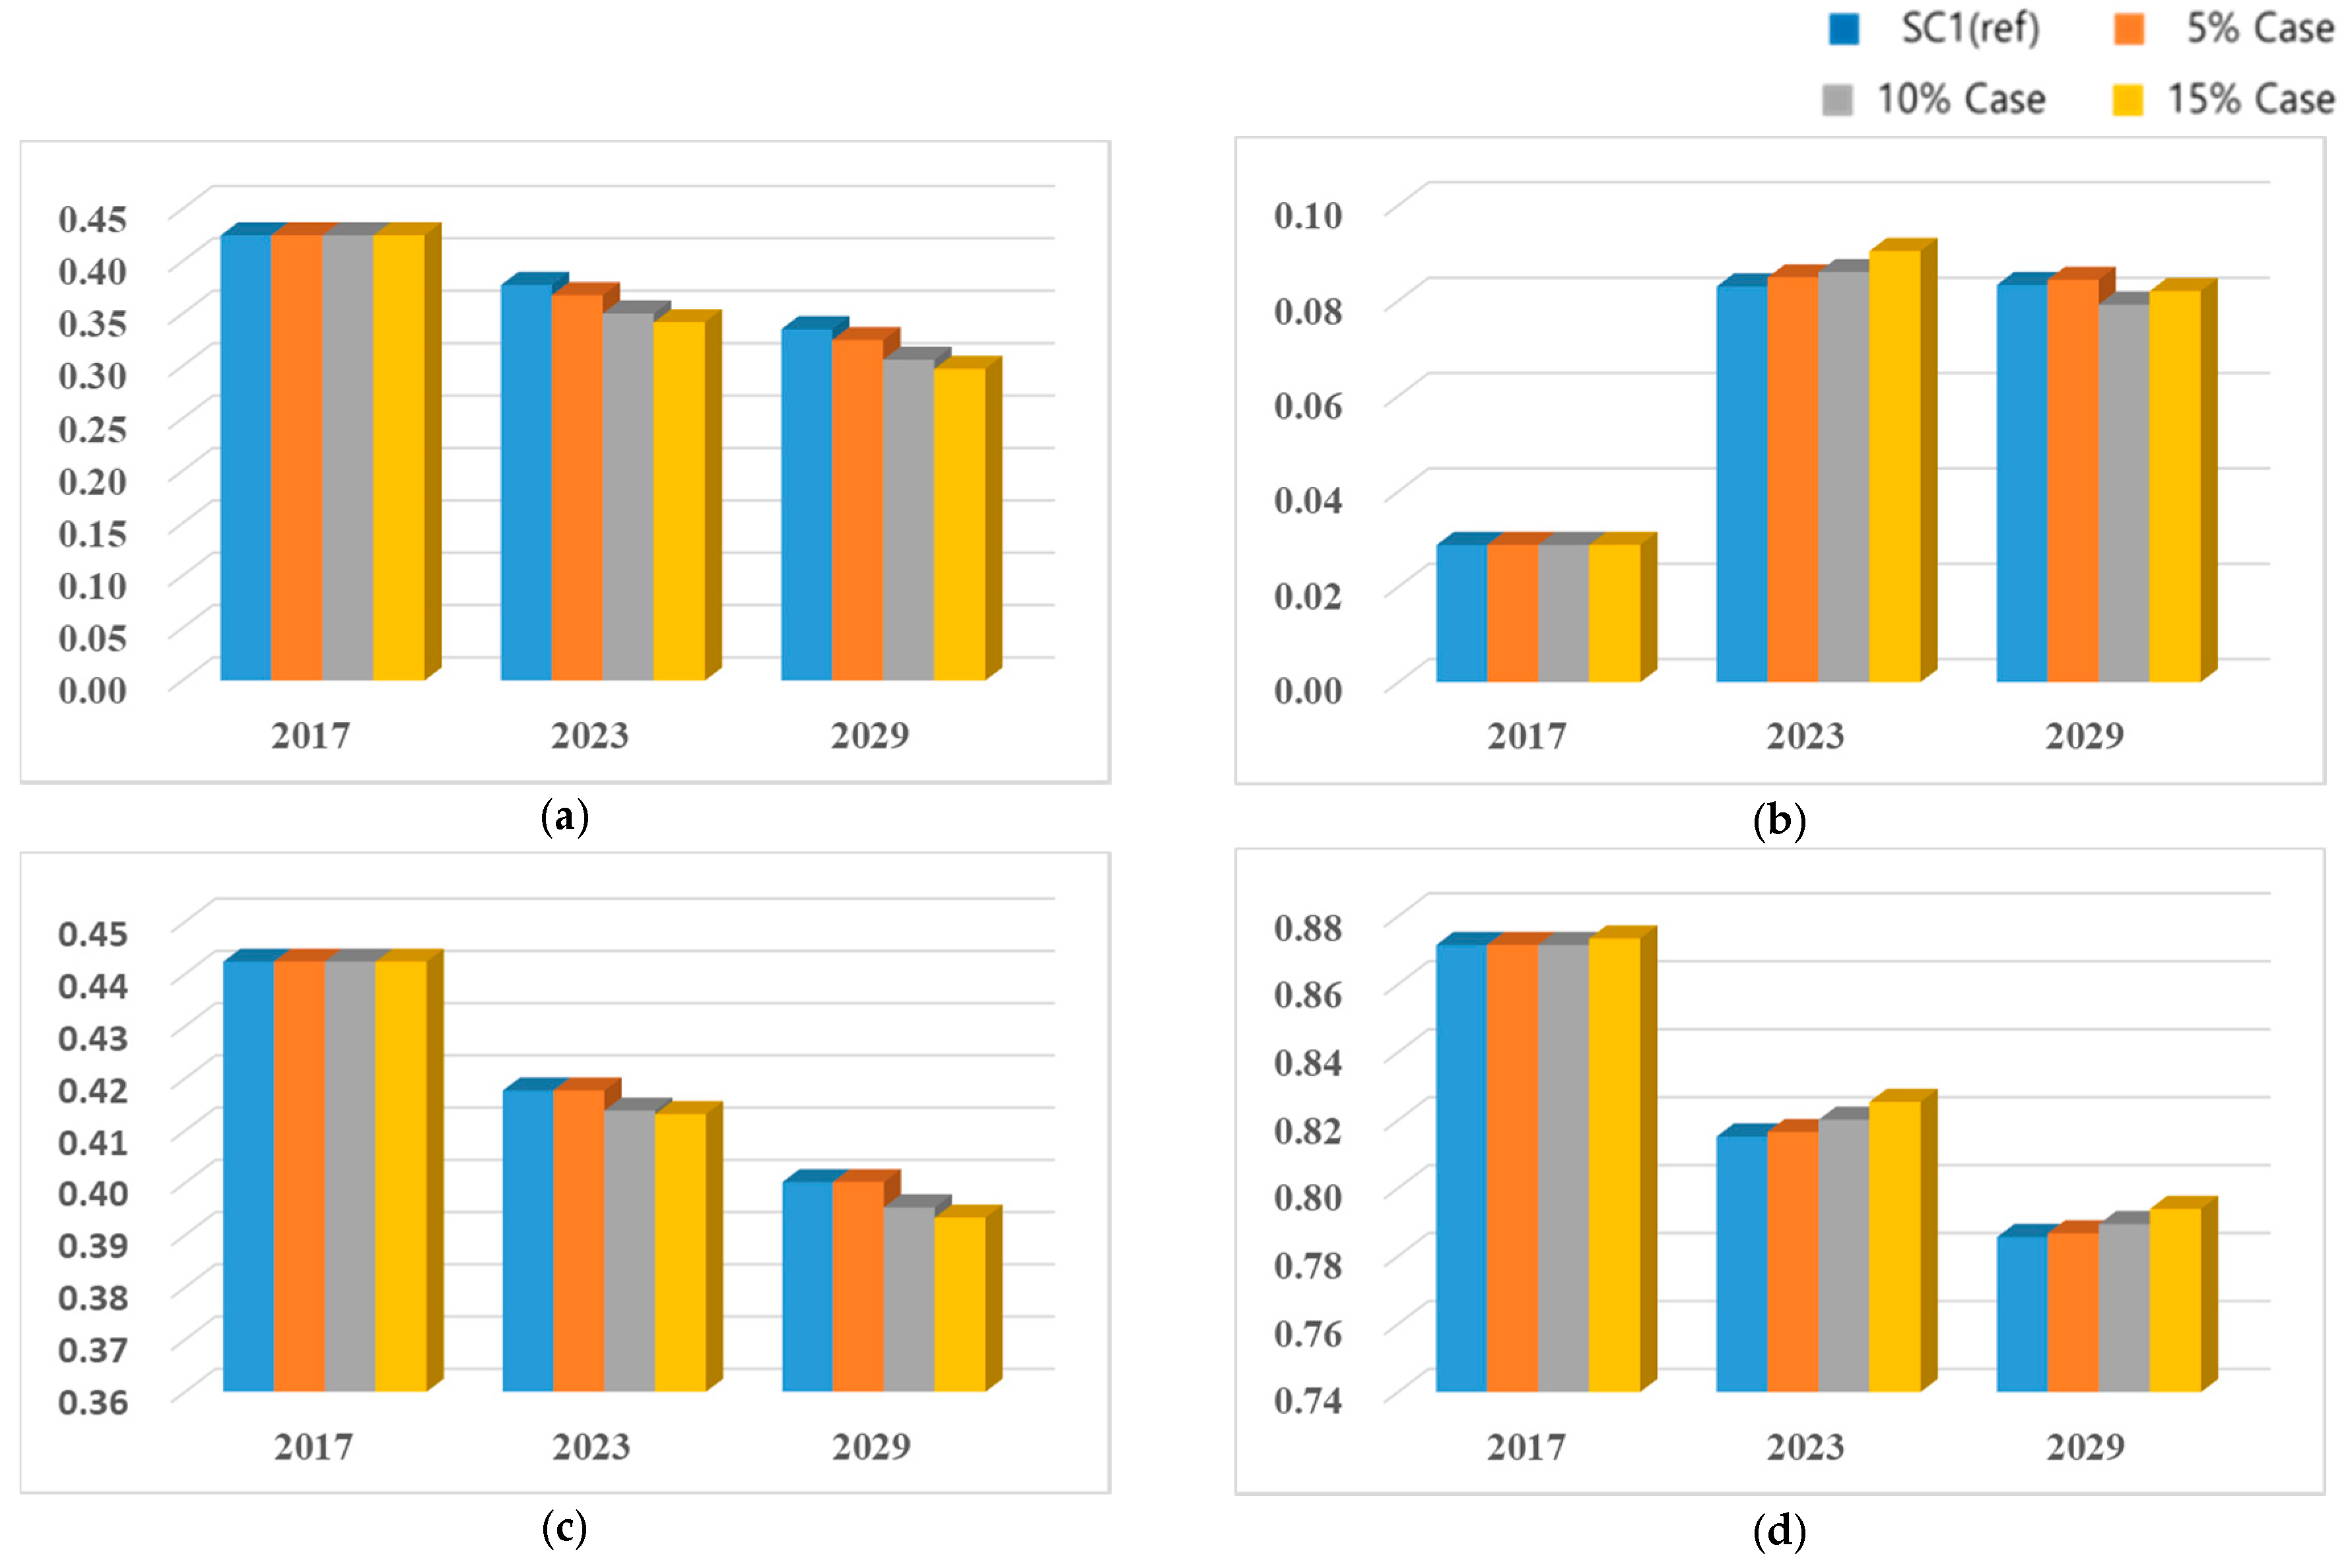
5.2.3. Scenario 3: Impact of Increasing the Unit CER Prices
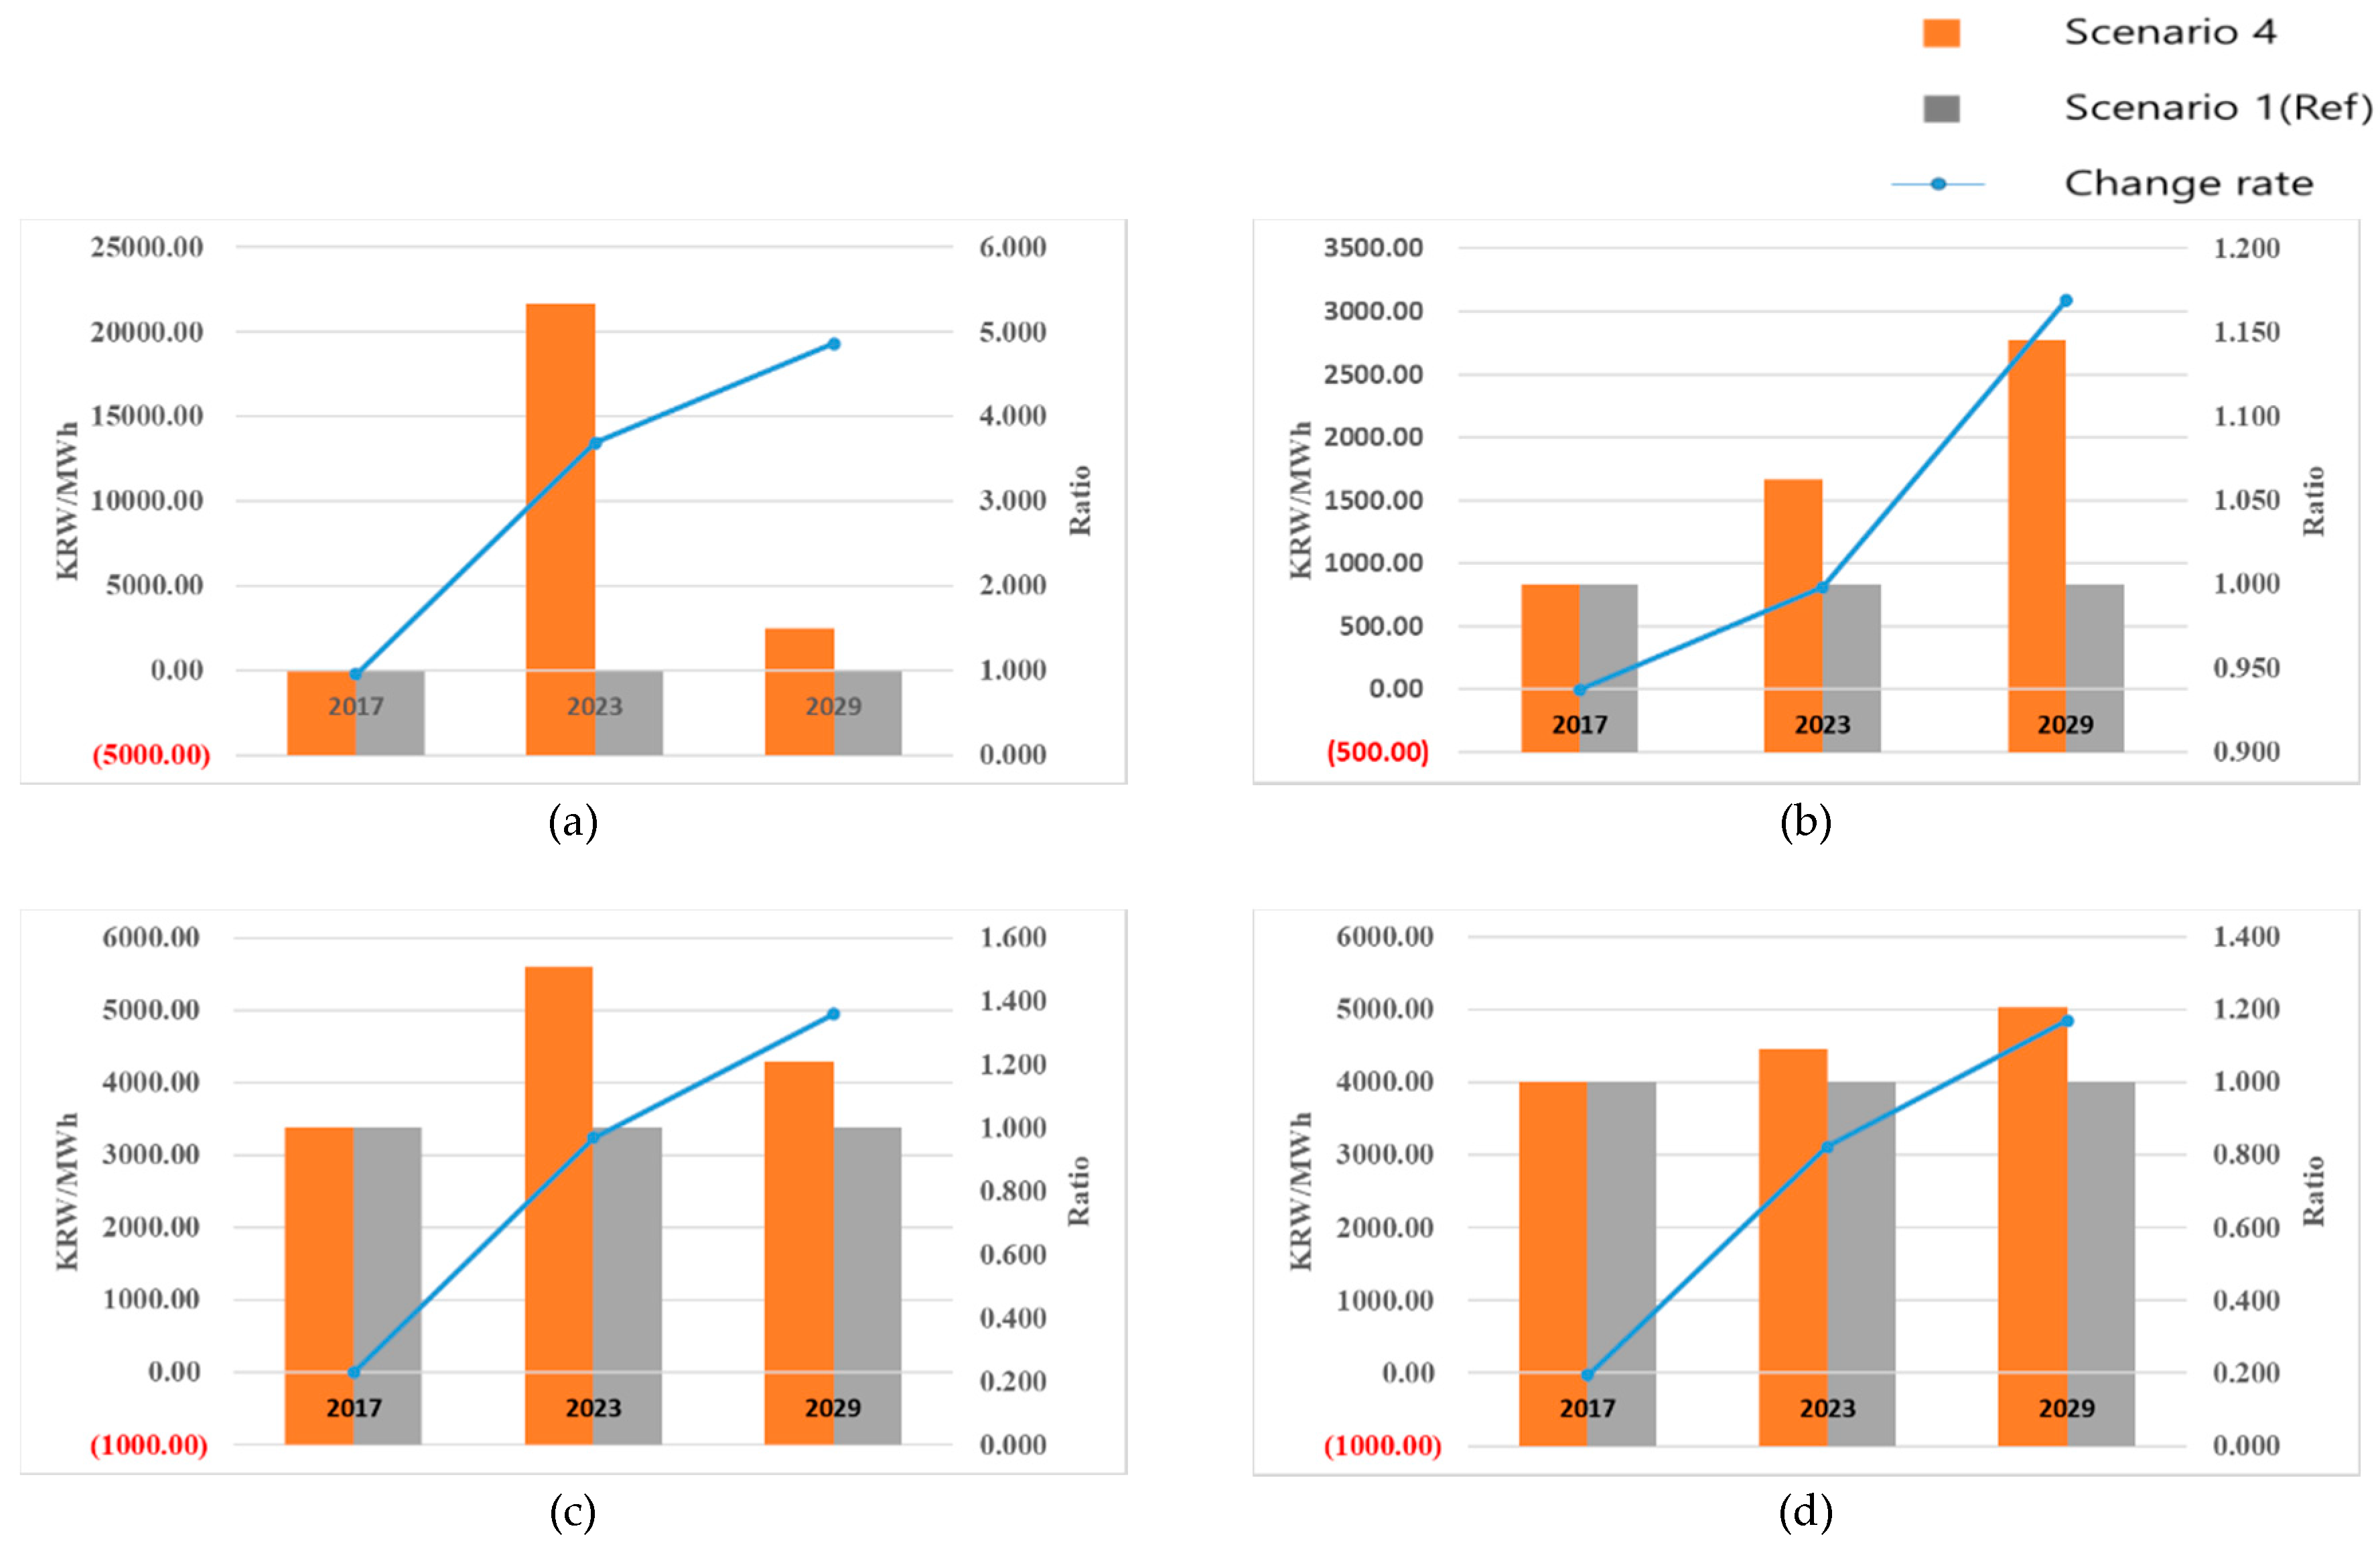
5.2.4. Scenario 4: The Influence of Reaching Grid Parity by Changing the Generation and Operation Costs of RE Sources
6. Discussion and Conclusions
6.1. Discussion and Political Implications
6.2. Limitations and Future Research
Author Contributions
Funding
Conflicts of Interest
Abbreviations
| RPS | Renewable Portfolio Standard |
| ETS | Emissions Trading Scheme |
| GHG | Greenhouse Gas |
| NRE | Non-renewable Energy |
| RE | Renewable Energy |
| CER | Carbon Emissions Reductions |
| REC | Renewable Energy Certificates |
| GEP | Generation Expansion Planning |
| BAU | Business as Usual |
| KEPCO | Korea Electric Power Corporation |
| EPSIS | Electric Power Statistics Information System |
| SMP | System Marginal Prices |
| LNG | Liquefied Natural Gas |
| IL | Industry Leaders |
| RS | Reliable Supporters |
| IF | Industry Followers |
| AP | Aggressive Participants |
| Indices | |
| Power generation source index (e = i ∪ j, e = 1, 2, …, 10) | |
| Renewable energy (RE) source index (I = 1,2, …, 6) | |
| Non-renewable energy (NRE) source index (j = 7, 8, 9, 10) | |
| Power Producer (PP) index (m = M1, M2, …, M18) | |
| Time Horizon (2017(t = 1)~2029(t = T = 13), 2029: Target year) | |
| Decision Variables | |
| New generation capacity of energy source e of each power producer in period t (MW) | |
| Constructed new generation capacity of energy source e of each power producer in period k to complete in period t (MW) | |
| 1 if the capacity expansion of energy source e is considered for each power producer in period k to complete in period t (∈{0,1}) | |
| Sales amount of Renewable Energy Certificate (REC) of each power producer in period t | |
| Additional purchasing amount of REC of each power producer in period t | |
| Non-fulfillment amount of REC of each power producer in period t | |
| Sales amount of Carbon Emission Reduction (CER) of each power producer in period t | |
| Additional purchasing amount of CER of each power producer in period t | |
| Non-fulfillment amount of CER of each power producer in period t | |
| Parameters | |
| Planned expansion capacity of energy source e of each power producer in period t (MW) | |
| Budget limitation of each power producer for capacity expansion in period t (KRW) | |
| Potential expansion capacity of energy source i in period t (MW) | |
| Initial generation capacity of power producer of each energy source e (MW) | |
| CO2 emission coefficient of energy source e (kgCO2/MWh) | |
| Upper limit of additional purchasing amount of CER of each power producer in period t (tCO2) | |
| Electric power demand in period t(MWh) | |
| Power generation efficiency of energy source e (%) | |
| CO2 emission limitation of each power producer in period t (tCO2) | |
| Planned expired capacity of energy source e of each power producer in period t (MW) | |
| Power generation and operation cost of energy source e in period t (KRW/MWh) | |
| Annual generating hours of energy source e (hour) | |
| Investment cost of unit expansion capacity of energy source e (KRW/MW) | |
| M | Big M |
| Predicted CER in period t (KRW/MWh) | |
| Predicted SMP in period t (KRW/MWh) | |
| Predicted REC in period t (KRW/MWh) | |
| Reserve margin in period t (%) | |
| RPS target ratio of each power producer in period t (%) | |
| RULm | Upper limit of additional purchasing amount of REC of each power producer in period t (tCO2) |
| Weight of REC issued of renewable energy source i | |
| Γ | Interest rate (%) |
| δe | Available constructed capacity of energy source e in each period (MW/year) |
| ε | Net ratio of transmission and distribution |
| Capacity proportion of power producer (obligatory) compared to total capacity (%) | |
References
- Chen, Q.; Kang, C.; Xia, Q.; Zhong, J. Power generation expansion planning model towards low-carbon economy and its application in China. IEEE Trans. Power Syst. 2010, 25, 1117–1125. [Google Scholar] [CrossRef]
- Mitigation of Climate Change. IPCC special report on renewable energy sources and climate change mitigation. Renew. Energy 2011, 20, 1–24. [Google Scholar]
- Kim, S.; Koo, J.; Lee, C.J.; Yoon, E.S. Optimization of Korean energy planning for sustainability considering uncertainties in learning rates and external factors. Energy 2012, 44, 126–134. [Google Scholar] [CrossRef]
- Park, S.Y.; Yun, B.Y.; Yun, C.Y.; Lee, D.H.; Choi, D.G. An analysis of the optimum renewable energy portfolio using the bottom-up model: Focusing on the electricity generation sector in South Korea. Renew. Sustain. Energy Rev. 2016, 53, 319–329. [Google Scholar] [CrossRef]
- Ministry of Trade, Industry, and Energy. The 2nd National Energy Basic Plan; Ministry of Trade, Industry, and Energy: Seoul, Korea, 2014.
- Korea Energy Agency. Energy Statistics Handbook; Korea Energy Management Corporation: Ulsan, Korea, 2015. [Google Scholar]
- Ministry of Environment. National Emission Allocation Plan; Ministry of Environment: Seoul, Korea, 2014.
- Dehghan, S.; Amjady, N.; Kazemi, A. Two-stage robust generation expansion planning: A mixed integer linear programming model. IEEE Trans. Power Syst. 2014, 29, 584–597. [Google Scholar] [CrossRef]
- Li, S.; Coit, D.W.; Felder, F. Stochastic optimization for electric power generation expansion planning with discrete climate change scenarios. Electr. Power Syst. Res. 2016, 140, 401–412. [Google Scholar] [CrossRef] [Green Version]
- Valinejad, J.; Barforoushi, T. Generation expansion planning in electricity markets: A novel framework based on dynamic stochastic MPEC. Int. J. Electr. Power Energy Syst. 2015, 70, 108–117. [Google Scholar] [CrossRef]
- Bhattacharya, A.; Kojima, S. Power sector investment risk and renewable energy: A Japanese case study using portfolio risk optimization method. Energy Policy 2012, 40, 69–80. [Google Scholar] [CrossRef]
- Schelly, C. Implementing renewable energy portfolio standards: The good, the bad, and the ugly in a two state comparison. Energy Policy 2014, 67, 543–551. [Google Scholar] [CrossRef]
- Upton, G.B.; Snyder, B.F. Renewable energy potential and adoption of renewable portfolio standards. Util. Policy 2015, 36, 67–70. [Google Scholar] [CrossRef]
- Barbose, G.; Wiser, R.; Heeter, J.; Mai, T.; Bird, L.; Bolinger, M.; Carpenter, A.; Heath, G.; Keyser, D.; Macknick, J.; et al. A retrospective analysis of benefits and impacts of US renewable portfolio standards. Energy Policy 2016, 96, 645–660. [Google Scholar] [CrossRef]
- Bowen, W.M.; Park, S.; Elvery, J.A. Empirical estimates of the influence of renewable energy portfolio standards on the green economies of states. Econ. Dev. Quart. 2013, 27, 338–351. [Google Scholar] [CrossRef]
- Yoon, J.H.; Sim, K.H. Why is South Korea’s renewable energy policy failing? A Qual. Eval. Energy Policy 2015, 86, 369–379. [Google Scholar] [CrossRef]
- Kwon, T.H. Is the renewable portfolio standard an effective energy policy?: Early evidence from South Korea. Util. Policy 2015, 36, 46–51. [Google Scholar] [CrossRef]
- Choi, D.G.; Park, S.Y.; Hong, J.C. Quantitatively exploring the future of renewable portfolio standard in the Korean electricity sector via a bottom-up energy model. Renew. Sustain. Energy Rev. 2015, 50, 793–803. [Google Scholar] [CrossRef]
- Calvo-Silvosa, A.; Antelo, S.I.; Soares, I. The European low-carbon mix for 2030: The role of renewable energy sources in an environmentally and socially efficient approach. Renew. Sustain. Energy Rev. 2015, 48, 49–61. [Google Scholar]
- Yi, B.W.; Xu, J.H.; Fan, Y. Coordination of policy goals between renewable portfolio standards and carbon caps: A quantitative assessment in China. Appl. Energy 2019, 237, 25–35. [Google Scholar] [CrossRef]
- Jiang, J.J.; Ye, B.; Ma, X.M. The construction of Shenzhen's carbon emission trading scheme. Energy Policy 2014, 75, 17–21. [Google Scholar] [CrossRef]
- Wu, L.; Qian, H.; Li, J. Advancing the experiment to reality: Perspectives on Shanghai pilot carbon emissions trading scheme. Energy Policy 2014, 75, 22–30. [Google Scholar] [CrossRef]
- Park, H.; Hong, W.K. Korea’s emission trading scheme and policy design issues to achieve market-efficiency and abatement targets. Energy Policy 2014, 75, 73–83. [Google Scholar] [CrossRef]
- Zhang, X.; Qi, T.Y.; Ou, X.M.; Zhang, X.L. The role of multi-region integrated emissions trading scheme: A computable general equilibrium analysis. Appl. Energy 2017, 185, 1860–1868. [Google Scholar] [CrossRef]
- Hong, Z.; Chu, C.; Zhang, L.L.; Yu, Y. Optimizing an emission trading scheme for local governments: A Stackelberg game model and hybrid algorithm. Int. J. Prod. Econ. 2017, 193, 172–182. [Google Scholar] [CrossRef]
- Boersen, A.; Scholtens, B. The relationship between European electricity markets and emission allowance futures prices in phase II of the EU (European Union) emission trading scheme. Energy 2014, 74, 585–594. [Google Scholar] [CrossRef]
- Song, T.H.; Lim, K.M.; Yoo, S.H. Estimating the public’s value of implementing the CO2 emissions trading scheme in Korea. Energy Policy 2015, 83, 82–86. [Google Scholar] [CrossRef]
- Li, F.; Schwarz, L.; Haasis, H.D. A framework and risk analysis for supply chain emission trading. Logist. Res. 2016, 9, 10. [Google Scholar] [CrossRef]
- Shim, S.; Lee, J. On Inefficiency Factors in the Korean Emissions Trading Scheme. Korea Energy Econ. Rev. 2015, 14, 177–211. [Google Scholar]
- Hemmati, R.; Hooshmand, R.A.; Khodaabakhshian, A. Reliability constrained generation expansion planning with consideration of wind farms uncertainties in deregulated electricity market. Energy Convers. Manag. 2013, 76, 517–526. [Google Scholar] [CrossRef]
- Koltsaklis, N.E.; Georgiadis, M.C. A multi-period, multi-regional generation expansion planning model incorporating unit commitment constraints. Appl. Energy 2015, 158, 310–331. [Google Scholar] [CrossRef]
- Antunes, C.H.; Martins, A.G.; Brito, I.S. A multiple objective mixed integer linear programming model for power generation expansion planning. Energy 2004, 29, 613–627. [Google Scholar] [CrossRef] [Green Version]
- Gitizadeh, M.; Kaji, M.; Aghaei, J. Risk based multi-objective generation expansion planning considering renewable energy sources. Energy 2013, 50, 74–82. [Google Scholar] [CrossRef]
- Muñoz-Delgado, G.; Contreras, J.; Arroyo, J.M. Joint expansion planning of distributed generation and distribution networks. IEEE Trans. Power Syst. 2015, 30, 2579–2590. [Google Scholar] [CrossRef]
- Luz, T.; Moura, P.; de Almeida, A. Multi-objective power generation expansion planning with high penetration of renewables. Renew. Sustain. Energy Rev. 2018, 81, 2637–2643. [Google Scholar] [CrossRef]
- Ghaderi, A.; Moghaddam, M.P.; Sheikh-El-Eslami, M.K. Energy efficiency resource modeling in generation expansion planning. Energy 2015, 68, 529–537. [Google Scholar] [CrossRef]
- Li, S.; Tirupati, D. Dynamic capacity expansion problem with multiple products: Technology selection and timing of capacity additions. Oper. Res. 1994, 42, 958–976. [Google Scholar] [CrossRef]
- Chen, X.; Lv, J.; McElroy, M.B.; Han, X.; Nielsen, C.P.; Wen, J. Power system capacity expansion under higher penetration of renewables considering flexibility constraints and low carbon policies. IEEE Trans. Power Syst. 2018, 33, 6240–6253. [Google Scholar] [CrossRef]
- Lim, H.; Jo, H. Analysis on the effects of RPS and FIT policies on the renewable energy supply: Panel tobit analysis of 104 countries. Korean Energy Econ. Rev. 2017, 16, 1–31. [Google Scholar]
- Lee, K.; Kim, L.; Yeo, Y. Optimization of Integrated District Heating System (IDHS) Based on the Forecasting Model for System Marginal Prices (SMP). Korean Chem. Eng. Res. 2012, 50, 479–491. [Google Scholar] [CrossRef] [Green Version]
- Ministry of Knowledge Economy. The 7th Basic Plan of Long-Term Electricity Supply and Demand; Ministry of Knowledge Economy: Seoul, Korea, 2015.
- Ahn, J.; Woo, J.; Lee, J. Optimal allocation of energy sources for sustainable development in South Korea: Focus on the electric power generation industry. Energy Policy 2015, 78, 78–90. [Google Scholar] [CrossRef]
- Korea Power Exchange. Electric Power Statistics Information System (EPSIS). Available online: http://epsis.kpx.or.kr/ (accessed on 15 November 2017).
- Moné, C.; Smith, A.; Maples, B.; Hand, M. 2013 Cost of Wind Energy Review; NREL Technical Report TP-5000-63267; National Renewable Energy Laboratory: Lakewood, CO, USA, 2015.
- International Energy Agency. Projected Costs of Generating Electricity, 2015th ed.; International Energy Agency: Paris, France, 2015. [Google Scholar]
- Lazard. Levelized Cost of Energy Analysis–Version 10.0; Lazard: Hamilton, Bermuda, 2016. [Google Scholar]
- New and Renewable Energy Data Center. National Potential Statistics. Available online: http://kredc.kier.re.kr/kier/03_dataEnquiry/Whole_measure_static.aspx (accessed on 10 November 2017).
- Korea Exchange. CER Market Price Information. Available online: http://marketdata.krx.co.kr/mdi#document=070301 (accessed on 6 November 2017).
- Tidball, R.; Bluestein, J.; Rodriguez, N.; Knoke, S. Cost and Performance Assumptions for Modeling Electricity Generation Technologies; National Renewable Energy Lab: Golden, CO, USA, 2010.


| Year | 2017 | 2018 | 2019 | 2020 | 2021 | 2022 | 2023 on |
|---|---|---|---|---|---|---|---|
| RPS target ratio (%) | 4 | 5 | 6 | 7 | 8 | 9 | 10 |
| No | Description | Control Factor | |||
|---|---|---|---|---|---|
| Enhanced RPS Duty | Nuclear Option | CER Price | Generation Cost | ||
| SC1 | Reference case | - | - | - | - |
| SC2 | Nuclear and coal phase-out scenario: Considering strengthened RPS duty ratio | O | O | - | - |
| SC3 | Impact of increasing the unit CER prices | - | - | O | - |
| SC4 | Influence of reaching grid parity: Changing the generation and operation cost of RE sources | - | - | - | O |
| Year | 2017 | 2018 | 2019 | 2020 | 2021 | 2022 | 2023 | 2024 | 2025 | 2026 | 2027 | 2028 | 2029 |
|---|---|---|---|---|---|---|---|---|---|---|---|---|---|
| Demand (TWh) | 498 | 522 | 544 | 563 | 580 | 597 | 612 | 627 | 642 | 657 | 671 | 684 | 698 |
| Reserve Margin (%) | 26.3 | 24.9 | 23.7 | 23.2 | 26.8 | 27.7 | 25.3 | 22.4 | 21.2 | 21.3 | 21.4 | 21.5 | 21.6 |
| Type | Energy Source | Investment Cost (M KRW/MW) | Capacity Factor (h) | Generation and Operation Costs (KRW/MWh) | CO2 Emissions Coefficient (kgCO2/MWh) | |
|---|---|---|---|---|---|---|
| Low | High | |||||
| Renewable Energy (RE) | Solar PV | 3500 | 1314 | 65,000 | 271,000 | 33 |
| Wind | 2500 | 2891 | 35,000 | 83,000 | 12 | |
| Hydro | 1170 | 4643 | 32,000 | 108,000 | 4 | |
| Biomass | 3500 | 7271 | 83,000 | 119,000 | 18 | |
| Fuel cell | 5680 | 7446 | 115,000 | 181,000 | 221 | |
| Ocean | 3824 | 1752 | 249,000 | 271,000 | 37 | |
| Non-renewable Energy (NRE) | LNG | 620 | 6132 | 54,000 | 87,000 | 450 |
| Coal | 540 | 7446 | 70,000 | 162,000 | 950 | |
| Oil | 1908 | 7621 | 114,000 | 129,000 | 680 | |
| Nuclear | 1562 | 7884 | 60,000 | 147,000 | 16 | |
| Year | 2017 | 2018 | 2019 | 2020 | 2021 | 2022 | 2023 | 2024 | 2025 | 2026 | 2027 | 2028 | 2029 |
|---|---|---|---|---|---|---|---|---|---|---|---|---|---|
| RPS Target Ratio (%) | 4.0 | 6.0 | 8.0 | 10.0 | 12.0 | 13.0 | 14.0 | 15.0 | 16.0 | 17.0 | 18.0 | 19.0 | 20.0 |
| Year | 2017 | 2018 | 2019 | 2020 | 2021 | 2022 | 2023 | 2024 | 2025 | 2026 | 2027 | 2028 | 2029 |
|---|---|---|---|---|---|---|---|---|---|---|---|---|---|
| CO2 Target (MCO2ton) | 247 | 249 | 250 | 252 | 254 | 255 | 257 | 259 | 260 | 262 | 264 | 265 | 267 |
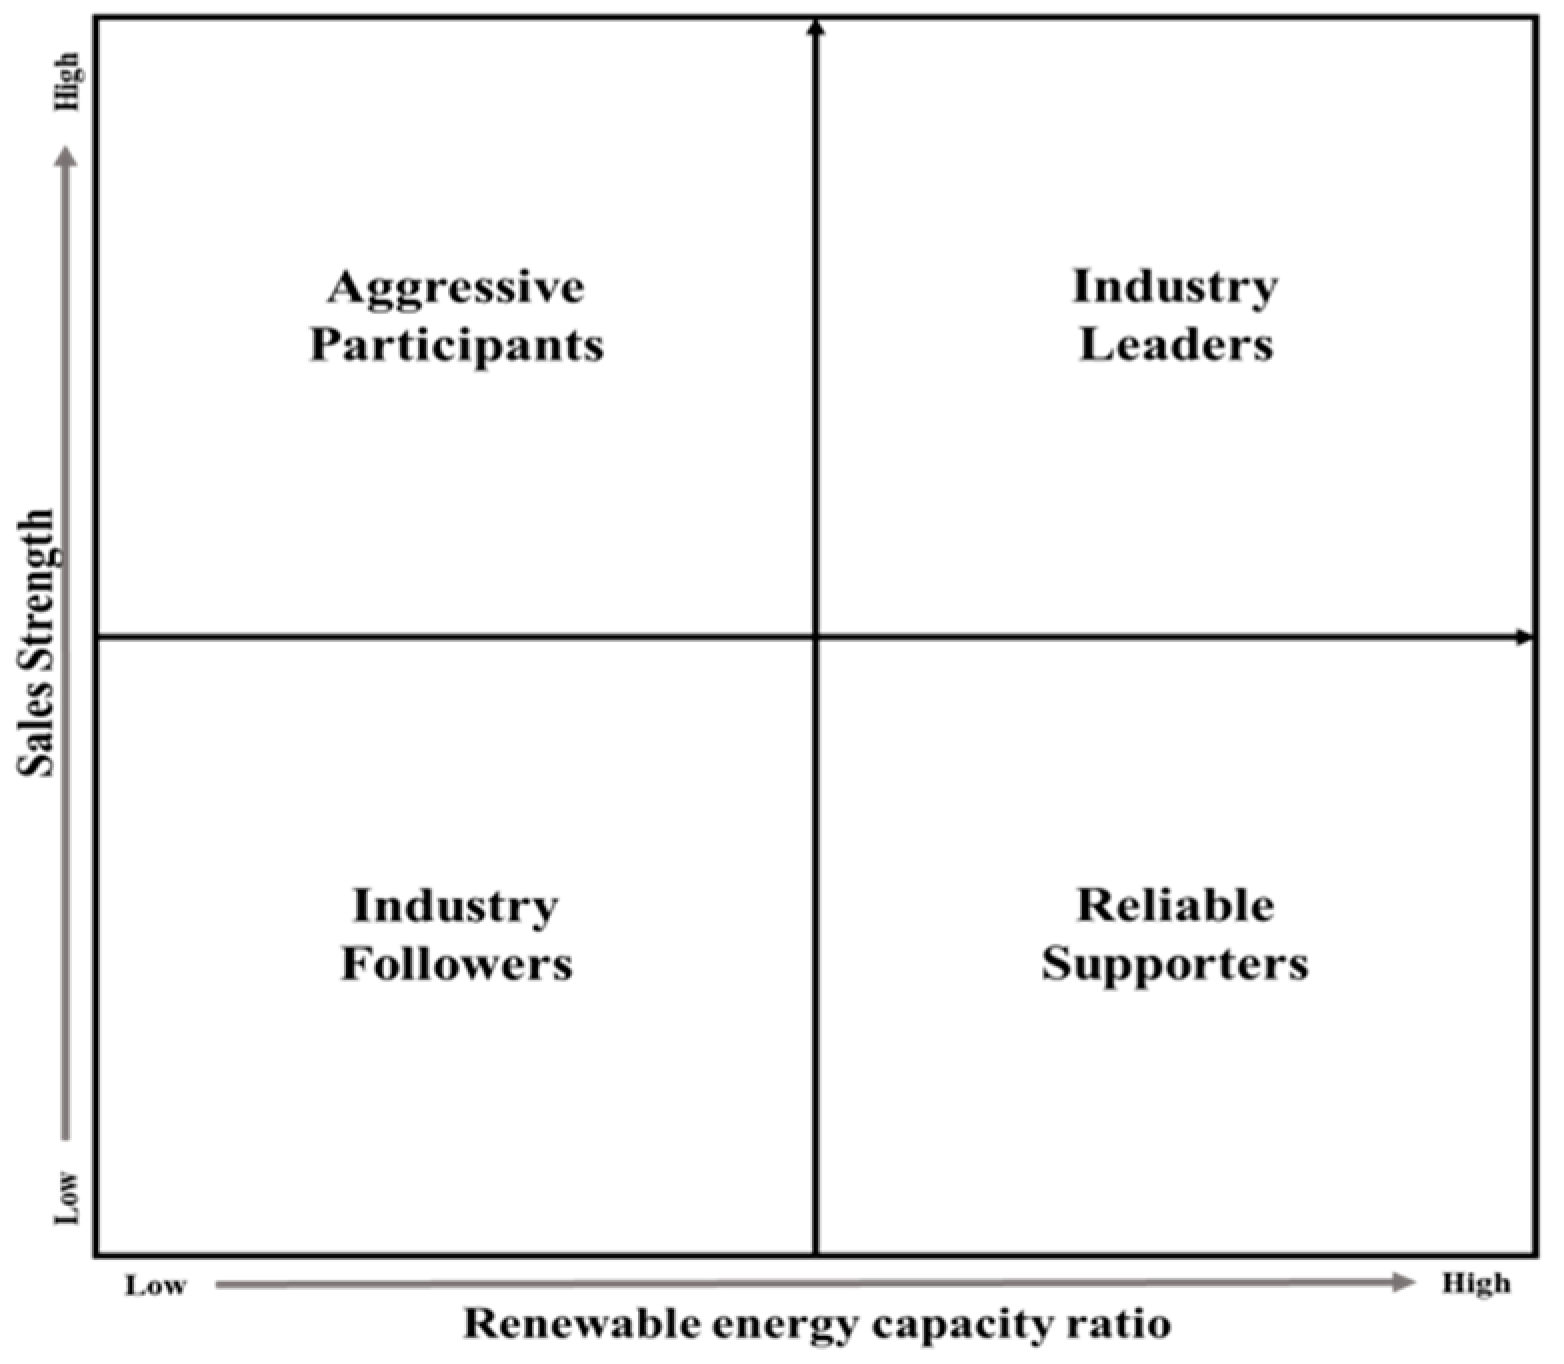
| Segment | Characteristics |
|---|---|
| Industry Leaders | Power producers whose initial RE capacity proportion and initial sales are both high |
| The group with the largest installed capacity share in the entire group | |
| Reliable Supporters | Although initial RE capacity retention ratios are high, power generation is less than that of IL, and with lesser sales |
| Power producers with a reliable response to government regulation | |
| Industry Followers | The group with the largest number of producers |
| Relatively low initial sales and initial RE capacity share | |
| Power producers who accommodate requests slowly to minimize the damage caused by government regulations | |
| Aggressive Participants | The group with higher sales but low RE capacity retention ratio |
| Power producers with a motive force to maximize profit through aggressive additional RE investments |
| RE/NRE Generation (TWh) | Scenario 1 (Reference) | 5% Case | 10% Case | 15% Case | |||||||||
|---|---|---|---|---|---|---|---|---|---|---|---|---|---|
| 2017 | 2023 | 2029 | 2017 | 2023 | 2029 | 2017 | 2023 | 2029 | 2017 | 2023 | 2029 | ||
| M1 (IL) | RE | 3.42 | 11.26 | 21.53 | 3.42 | 10.88 | 21.46 | 3.42 | 9.68 | 20.99 | 3.42 | 9.18 | 20.69 |
| NRE | 174.4 | 262.1 | 310.7 | 174.4 | 264.2 | 312.6 | 174.4 | 269.7 | 317.3 | 174.4 | 272.6 | 319.7 | |
| M5 (RS) | RE | 1.65 | 5.27 | 8.38 | 1.65 | 5.46 | 8.56 | 1.65 | 5.77 | 8.92 | 1.68 | 6.07 | 9.21 |
| NRE | 72.03 | 75.54 | 75.54 | 72.03 | 74.84 | 74.84 | 72.03 | 73.39 | 73.39 | 71.63 | 71.63 | 71.63 | |
| M10 (AP) | RE | 0.45 | 5.74 | 5.74 | 0.45 | 3.49 | 5.99 | 0.45 | 3.87 | 6.38 | 0.45 | 4.03 | 6.54 |
| NRE | 5.85 | 15.62 | 15.62 | 5.85 | 14.44 | 14.44 | 5.85 | 12.57 | 12.57 | 5.85 | 11.76 | 11.76 | |
| M18 (IF) | RE | 0.18 | 1.41 | 1.41 | 0.18 | 0.88 | 1.41 | 0.18 | 0.96 | 1.52 | 0.18 | 0.97 | 1.57 |
| NRE | 10.14 | 10.88 | 10.88 | 10.14 | 10.88 | 10.88 | 10.14 | 10.5 | 10.5 | 10.14 | 10.43 | 10.43 | |
| Scenario 1 (Ref) | Scenario 4 | |||||||
|---|---|---|---|---|---|---|---|---|
| % of Electricity Generation Capacity(A) | % of Electricity Generation(B) | % of Electricity Generation Capacity(A) | % of Electricity Generation(B) | |||||
| Year | RE | NRE | RE | NRE | RE | NRE | RE | NRE |
| 2016 | 2.8 | 97.2 | 1.7 | 98.3 | 2.8 | 97.2 | 1.7 | 98.3 |
| 2022 | 7.2 | 92.8 | 5.9 | 94.1 | 7.1 | 92.9 | 5.9 | 94.1 |
| 2029 | 12.6 | 87.4 | 9.7 | 90.3 | 11.4 | 88.6 | 10.2 | 89.8 |
© 2019 by the authors. Licensee MDPI, Basel, Switzerland. This article is an open access article distributed under the terms and conditions of the Creative Commons Attribution (CC BY) license (http://creativecommons.org/licenses/by/4.0/).
Share and Cite
Son, D.; Kim, J.; Jeong, B. Optimal Operational Strategy for Power Producers in Korea Considering Renewable Portfolio Standards and Emissions Trading Schemes. Energies 2019, 12, 1667. https://doi.org/10.3390/en12091667
Son D, Kim J, Jeong B. Optimal Operational Strategy for Power Producers in Korea Considering Renewable Portfolio Standards and Emissions Trading Schemes. Energies. 2019; 12(9):1667. https://doi.org/10.3390/en12091667
Chicago/Turabian StyleSon, Dongmin, Joonrak Kim, and Bongju Jeong. 2019. "Optimal Operational Strategy for Power Producers in Korea Considering Renewable Portfolio Standards and Emissions Trading Schemes" Energies 12, no. 9: 1667. https://doi.org/10.3390/en12091667