Article

The Study of Flow Characteristics During the Decomposition Process in Hydrate-Bearing Porous Media Using Magnetic Resonance Imaging

1
Key Laboratory of Solidification Control and Digital Preparation Technology, School of Materials Science and Engineering, Dalian University of Technology, Dalian 116024, China
2
Key Laboratory of Ocean Energy Utilization and Energy Conversion of Ministry of Education, Dalian University of Technology, Dalian 116024, China
*
Authors to whom correspondence should be addressed.
Energies 2019, 12(9), 1736; https://doi.org/10.3390/en12091736
Submission received: 10 March 2019 / Revised: 5 May 2019 / Accepted: 6 May 2019 / Published: 8 May 2019
(This article belongs to the Special Issue Advances in Natural Gas Hydrates)

Abstract

:
The flow characteristics during decomposition of hydrate-bearing sediments are the most critical parameters for the gas recovery potential from natural gas hydrate reservoirs. The absolute and relative permeability and the flow field distribution during the decomposition process of hydrate-bearing porous media synthetically created by glass beads are in-situ measured by using magnetic resonance imaging. The absolute permeability value increased slowly, then became stable after the decomposition amount was 50%. The relative permeability change curve is a typical X-shaped cross curve. As the hydrate decomposed, the relative permeability values of the two phases increased, the range of the two-phase co-infiltration zone increased with the increase of relative permeability at the endpoint, and the coexistence water saturation decreased. At the beginning of the decomposition, (hydrate content 100% to 70%), the relative permeability of methane and water rose rapidly from 22% to 51% and from 58% to 70%, respectively. When the amount of the remaining hydrate was less than 50%, the relative permeability curve of the hydrate-bearing glass beads almost kept unchanged. During the hydrate decomposition process, the velocity distribution was very uneven and coincided with the porous media structure.

1. Introduction

As one kind of potential energy resource, Natural Gas Hydrates have caused concern for scientists around the world [1,2]. Natural gas hydrate is a caged crystalline compound formed by natural gas guest molecules and water molecules under low temperature and high pressure [3]. Natural Gas Hydrates are the crystals formed when natural gas molecules enter a cage of hydrogen bonds in water. As the lattice of Natural Gas Hydrates is composed of water molecules, there are many similarities between the properties of Natural Gas Hydrates and ice. Natural Gas Hydrates and ice are similar in density, mechanical properties, and acoustic properties, and their density, hardness, resistivity, and thermal conductivity are slightly lower than that of ice [4]. Its energy density is so high that, under ideal conditions, 1 m3 of methane hydrate can hold about 163 m3 of methane and 0.8 m3 of water [5]. Hydrates are stable under certain temperatures and pressure conditions, which are called phase equilibrium conditions [6].
The flow characteristics during decomposition of hydrate-bearing sediments are the most critical parameters for the gas recovery potential from natural gas hydrate reservoirs [7]. The feasibility of the hydrates extraction methods depends on the specific conditions of gas hydrate-bearing layers, which are uncertain during the hydrate production. Permeability is one of the critical performance parameters used in the simulation of gas hydrate production, which determines the ability of gas or fluid flow in porous media and heat/mass transfer among these phases [8]. Seol et al. [9,10] studied the process of water flow through a hydrate-bearing sand sample by X-ray CT and found that the existence of the hydrate in porous media governed the permeability and the multiphase flow of the hydrate-bearing sediments. The effective permeability in natural hydrate sediments was investigated by using water flooding method, and the results showed the water effective permeability decreased with the increasing hydrate saturation in the core [11,12]. Although the flow characteristics of hydrate sediments have been investigated, the permeability and direct visualization results of water migration in the decomposition process of hydrate-bearing samples were rarely reported. It is of important guiding significance for the development and evaluation of the mining technology of hydrate deposits to probe the variation of permeability and fluid migration during the decomposition process [13,14].
In order to in situ visually investigate porous media characteristics, several methods have been used recently. Klapp et al. [15] examined the crystallographic structures of the gas hydrate samples from various locations in the Gulf of Mexico using Field-Emission Scanning Electron Microscopy (FE-SEM), and the result showed the evidence of co-occurrence of gas hydrate and liquid oil on a micrometer scale. Yang et al. [16] obtained experimental data of CO2 hydrate formation and dissociation in a porous media using magnetic resonance imaging, and the result indicated that the Magnetic resonance imaging (MRI) could visualize hydrate formation and dissociation, and the MRI meant intensity of water was in good agreement with the vessel pressure changes. Wu et al. [17] used the scanning electron microscope (SEM), MICP, NMR, and X-ray computed tomography (X-ray CT) to characterize the geometric and topological properties of pore space of several low-permeability porous media. It is found that the NMR technique is a promising tool for characterizing geometric features of pore systems as it can cover more details than other techniques.
Magnetic resonance imaging (MRI) is a well-established technique in the medical field, typically used for imaging liquid water in porous media. Initially, due to experimental conditions, it was impossible to accurately measure and display flow characteristics in porous media. Therefore, researchers have mostly simulated the flow in porous media from a model perspective. With the maturity of MRI technology, it has gradually been developed into other fields [18,19,20]. Mantle et al. [21,22] used MRI technology to measure the seepage data in porous media and compared the data with the results obtained by Lattice Boltzmann Method (LBM). It was found that MRI technology can be applied to the flow measurement of both Newtonian fluid and non-Newtonian fluid in porous media. Soon afterwards, MRI technology has been widely used in flow characteristics and research in porous media. Martin et al. [23,24] proposed a method for measuring the local porosity of dry porous media and the pore distribution of porous media space using MRI technology in 2001. Thomas et al. [25] used MRI technology to visually measure the flow of colloid in porous media, and obtained the propagation velocity data of colloid in porous media. Later on, many scientists also used MRI technology to measure the flow characteristics of porous media [18,25,26,27,28,29]. Ersland et al. [30] measured gas hydrate formation and exchange with CO2 in Bentheim sandstone using MRI. The MRI proved to give excellent information about the spatial distribution of the hydrate growth, the rate of the hydrate formation and the rate of the CO2–CH4 exchange. All the results proved that MRI was powerful and reliable in measuring the flow characteristics, whereas this technique has rarely been applied in the study of permeability and fluid migration in hydrate-bearing sediments.
In this paper, the absolute and relative permeability changes and the flow field distribution during decomposition process of hydrate-bearing porous media are in-situ measured by using MRI, in order to determine the effects of hydrate decomposition on permeability and fluid migration in hydrate-bearing sediments.

2. Materials and Methods

2.1. Apparatus and Materials

In the present study, an MRI flow characteristics experimental system was established for the in situ observation of the hydrate in porous media created by glass beads in Figure 1. The MRI system was from Varian, Inc. Images were collected with 256 points for read-out and phase-encoding. The field of view was set to 40 mm × 40 mm. The MRI cell, where the hydrate forms and decomposes, was inserted vertically into the MRI testing cavity, loading glass beads to in situ observe the formation/decomposition process.
The fluorinert was used as a coolant in the MRI system. Because the fluorinert cannot be imaged by MRI, the interference on the imaging system was minimized. The temperature controller was a high-precision circulator with a temperature control range from −28 °C to 200 °C at a precision of ±0.01 °C. The injection pump was a 260D piston pump produced by ISCO, Inc., (Nebraska, NE, USA) with a volume of 266 mL, a maximum pressure of 7500 PSI, and an injection flow rate of 0.001–107 mL/min. The temperature pressure control part mainly composed of temperature and pressure sensors. The temperature sensors were the armored thermocouple produced by Nagano of Japan, and integrated between the internal and external tubes of the MRI cell. The measurement accuracy was ±0.01 °C. The pressure was measured by a high-precision Luosimengte 3051 series pressure transducer produced by Rosemount (Missouri, MO, USA), which were located at both ends of the MRI cell. The measurement accuracy was 0.003 MPa. At the exit end, there was a back-pressure valve to measure and regulate the pressure at the exit end. The back-pressure valve was a quick response and high-precision BP-2080-M back-pressure valve produced by JASCO Corporation (Tokyo, Japan), which maintained stability of the back-pressure with a small flow rate.
Methane was produced by Dalian Special Gases Co., Ltd (Dalian, China), with a purity of 99.99%. The quartz glass beads (AS-ONE, Co., Ltd., Osaka, Japan), BZ-4 (3.962–4.699 mm, average 4.5 mm), were used to simulate the porous media. The determination of the porous media indicated that the porosity maintained at an invariable level of about 35%. Although the fluid injection would cause the deformation of the sediment structure, which is the result of external stress, particle-particle, and fluid-particle interactions [31,32], but for the sphere pack the deformation rate was relatively lower than the sandstone [33]. Meanwhile, in previous studies, the CH4 hydrate formation in the pore space of the porous media, and the connection between grains and hydrates was weak. The gas hydrates growth follows the free-floating model, not cementing or supporting of the adjacent grains [34]. Therefore, the influence of the fluid and the hydrate decomposition can be ignored in this study.

2.2. Absolute Permeability Measurement

Permeability of a porous media refers to the property of a porous media to allow fluid to pass its connected pores under a certain differential pressure. That is, the permeability of a porous media refers to its ability to conduct fluid. When the porous media is saturated with a single-phase fluid, the measured permeability of the porous media to the fluid is called the absolute permeability of the porous media when the fluid is in a linear and stable flow state under a certain differential pressure.
According to Darcy’s Law, absolute permeability can be defined as
K = Q μ L A Δ P
In this formula K is the permeability; Q is the volume flow of the liquid; ΔP is the differential pressure between the ends of the porous media; μ is the viscosity of the liquid; A is the cross-sectional area of the porous media; L is the length of the porous media.
Theoretically, the permeability of a porous media only reflects the properties of the porous media itself. The permeability is independent of the nature of the fluid used and the measurement condition [35].
The absolute permeability of the hydrate decomposition process can be measured using the flow experimental platform diagram in Figure 1. The experimental steps are as follows.
(1)
The MRI cell was filled with glass beads to simulate the porous media and form a hydrate in the sample tube.
(2)
After the hydrate formation, the VNMRJ software 4.0 (Palo Alto, CA, USA) was run in the image acquisition computer, shimming, tuning, and then the imaging sequence was set, the relevant parameters were set, and the appropriate slice was selected to start scanning.
(3)
A decomposition ratio was selected during the decomposition process, and the water injected into the pump was cooled to 1 °C by a water bath, rather than a heat flow injection into the MRI cell. The outlet pressure and flow rate were controlled by a back-pressure valve. This stopped the decomposition of the undecomposed hydrate, and the entering of cold water also displaced the free gas generated by the decomposition, so that the amount of the hydrate did not change.
(4)
A differential pressure sensor was used to record the pressure difference at the inlet and outlet of the MRI cell, and the flow of liquid into the MRI cell was recorded with a pump.
(5)
The tubing was disassembled and the MRI cell was cleaned.

2.3. Relative Permeability Measurement Method

The methods for measuring the relative permeability of gas and water in a porous media are usually classified into a steady state method and an unsteady state method [36,37,38,39,40]. The steady state method for measuring gas-water relative permeability is to inject water and gas into a porous media at a constant flow rate. When the inlet and outlet pressures and gas and water flow rates were stable, the distribution of the gas and water saturation in the porous media had also been stabilized. When the inlet and outlet pressure, gas and water flow rates, and corresponding gas and water saturations were measured, the relative permeability of the gas and water was calculated using Darcy’s law. Then, the ratio of injected gas and water was changed to realize a new balance, to find the relative permeability of gas and water under another saturation. Finally, draw the curve of the relationship between the relative permeability of gas-water and the saturation in porous media, which is the relative permeability curve.
The non-steady state method for measuring the relative permeability of gas and liquid is based on the method of distribution of gas-liquid two phases as a function of gas displacement time and distance. In the process of liquid injection, the permeability of gas and liquid phases changed with its saturation distribution, and the instantaneous velocity of gas and liquid phases in a certain section also changed accordingly. In general, as long as the pressure changes at a constant injection speed or the flow rate changes at a constant pressure during the gas-liquid injection process measured, the relative permeability curve of the two phases can be obtained according to Darcy’s law.
This experiment was carried out to determine the relative permeability of gas-liquid two phases during the decomposition of the hydrate. In order to ensure a certain state in the decomposition process of the hydrate, the temperature and pressure conditions must be controlled under the hydrate formation conditions. However, the steady state method needs to inject a gas and water mixture according to a certain ratio, which causes a large amount of hydrate to be formed in a porous media. This cannot ensure an unchanged internal structure of the porous media of the hydrate in a certain state of decomposition. Therefore, the steady state method is not the suitable method to determine the relative permeability of the two phases of the hydrate-bearing sediments. At the same time, the MRI imaging technique can accurately obtain the saturation change and velocity distribution of the gas and liquid phases in the sediment, thereby obtaining the relative permeability curve.
When the hydrate was completely formed, water of 1 °C was injected into the MRI cell, and the pressure in the MRI cell was controlled to be above the phase equilibrium pressure. The free gas in the porous media was driven out to sufficiently saturate the porous media of the hydrate. After standing to stabilize, CH4 was injected into the MRI cell to drive out free water in the MRI cell. Supposing there was no change in the amount of hydrate at this time, and no displacement between the hydrate and the porous media, and the hydrate and the porous media were seen together as one solid phase. The two-phase saturation and velocity distribution during CH4 driving water were measured using an MRI imaging system. According to Darcy’s law, the expression of the local velocity of the gas and liquid phases are [41]:
V w = K λ w ( P w z + ρ w g )
V g = K λ g ( P g z + ρ g g )
In this expression, V w and V g represent the local velocity of water and gas, respectively; λ w and λ g are the mobility ratio of the water phase and the gas phase, respectively; g is the acceleration of gravity. The mobility ratio can be expressed as the following:
λ = K r μ
Here, K r is the relative permeability of a phase; μ is the kinematic viscosity of such phase.
The capillary force can be calculated by the following formula:
P c w ( S w ) = P g ( S w ) P w ( S w )
In this formula, P ( S w ) indicates the pressure of a certain phase when the saturation of such phase is S w . From the above formula, it can be obtained that
V g = V ( t ) λ g λ g + λ w ( 1 + K g ( ρ w ρ g ) λ w V t ) K λ g λ w λ g + λ w d P c w d S w S w z
It can be seen from the above formula that the local velocity of CH4 is a function of water saturation, gas-liquid two-phase fluidity ratio, and injection velocity.
The viscous force function, gravity countercurrent function, and capillary diffusivity of CH4 are represented as follows:
f g ( S w ) = λ g λ g + λ w
G g ( S w ) = g ( ρ w ρ g ) λ g λ w λ g + λ w
d c p w ( S w ) = λ g λ w λ g + λ w d P c w d S w
The local velocity expression of CH4 can be obtained by substituting the above formula into Equation (6).
V g = V ( t ) f g ( S w ) + K G g ( S w ) + K d c p w ( S w ) S w z
Parameter f g g ( S w ) can be defined as follows:
f g g ( S w ) = f g ( S w ) + K V G g ( S w )
Then the Equation (10) can be changed to the following:
V g ( z , t ) = V ( t ) f g g ( S w , V ) + K d c p w ( S w ) S w z
The function of water saturation over time in a porous media as a function of time during CH4 injection can be defined as the following:
S w ( z * ( t ) , t ) = S w *
It can be obtained from the above two formulas that the saturation of a certain point in the porous media changes with time at a certain time during the injection process.
V g ( z * , t ) = V ( t ) f g g ( S w * , V ) + K d c p w ( S w * ) S w z | z * , t
Since the total CH4 injection speed V ( t ) is known, the above equation can be
V g ( z * , t ) V ( t ) = f g g ( S w * , V ) + d c p w ( S w * ) K V ( t ) S w z | z * , t
Since the injection rate of CH4 is constant, the two are linear related. The slope representing the linear equation is d c p w ( S w * ) , the intercept of the linear equation is f g g ( S w * , V ) . The values of V g ( z * , t ) V ( t ) and K V ( t ) S w z | z * , t can bec calculated using the saturation data obtained by the MRI imaging system. The viscous force function, the gravity countercurrent function and the capillary diffusivity can be obtained by the calculation of Equations (8)–(11).
It can be drawn from Equations (7) and (8)
G g ( S w ) f g ( S w ) = g ( ρ w ρ g ) λ w
Combine the above formula with Equation (4)
K r w = G g ( S w ) f g ( S w ) 1 g ( ρ w ρ g ) μ w
K r g = G g ( S w ) 1 f g ( S w ) 1 g ( ρ w ρ g ) μ w μ g
Therefore, the relative permeability curve during the CH4 injection process was calculated with the values previously obtained. The relative permeability of the hydrate decomposition process can be measured by Magnetic Resonance Imaging using a flow experimental platform. The experimental steps are as follows:
(1)
The glass beads were inserted into the MRI cell to simulate the porous media, and the hydrate was formed in the MRI cell by referring to the experimental procedure in last section.
(2)
After the hydrate formation was completed, the VNMRJ software in the image acquisition computer was used to shim and tune. Then the spin echo multi-section scanning (SEMS) imaging sequence was set, the relevant parameters were set, and the appropriate slice was selected to get ready for scanning.
(3)
After the system was debugged, and the injection pump flow rate was set, a heat flow was injected into the MRI cell to decompose the hydrate in the MRI cell. In the meantime, the flow of the decomposed water was measured using a nuclear magnetic resonance imaging system. When a certain percentage of decomposition was reached, the injection of the heat flow was stopped, and the temperature and pressure conditions of the MRI cell were controlled to stop the decomposition of the hydrate in the porous media.
(4)
The CH4 was injected at a constant rate to drive out the free water in the hydrated porous media while the MRI imaging system was used to determine the saturation change and velocity distribution during the process of gas driving water.
(5)
Water was injected at a constant rate to drive the CH4 in the hydrate bearing porous media, while the saturation change and velocity distribution during the water driving gas process were measured using an MRI imaging system.
(6)
The relative permeability of the gas and water phases of the hydrate bearing porous media of such decomposition degree was calculated using the experimental data obtained.
(7)
The relative permeability of the two phases in the hydrate bearing porous media at different decomposition degrees were obtained by repeating the above steps.

2.4. Flow Measurement Method in Hydrate Decomposition Process

The flow characteristics of the hydrate during its decomposition can be MRI measured using the flow characteristic experimental platform described in Section 2.1. The experimental steps are as follows.
(1)
The glass beads were inserted into the MRI cell to simulate the porous media, and the hydrate was formed in the MRI cell referring to the experimental procedure in Section 2.2.
(2)
After the hydrate was formed, the VNMRJ software in the image collection computer was used for shimming and tuning. Then the SEMS imaging sequence was set, with the relevant parameters set. The appropriate slice was selected to get ready for scanning.
(3)
The injection pump flow rate was set. A heat flow was injected into the MRI cell to decompose the hydrate in the MRI cell. At the same time, the flow of the decomposed water was measured using a nuclear MRI system.
(4)
The pipeline was dissembled and the MRI cell was cleaned. Different hydrates were generated, and different heat flow injection rates were set. Then flow changes in the decomposition process of gas and liquid hydrate at different injection rates were obtained by repeating the above steps.

3. Results and Discussion

3.1. Permeability of Decomposition Process in Hydrate-Bearing Porous Media

3.1.1. Analysis of Absolute Permeability

The absolute permeability of the porous media in which the hydrate was formed was measured according to the experimental procedure described in the previous section. After the hydrate was completely formed, the temperature and pressure conditions of the MRI cell were adjusted to slowly decompose the porous media of the hydrate. When the hydrate saturation was 100%, 88.5%, 78.9%, 70.0%, 54.1%, 34.9%, 15.1%, and 0% (completely decomposed) of the initial hydrate, a cold water of 1 °C was injected at a constant flow rate. The MRI cell pressure was controlled to stop the hydrate decomposition. The porosity values at each decomposition percentage and the pressure difference across the MRI cell at the time of cold-water injection were measured by the MRI imaging system using the method of 1.1 According to Equation (1), the absolute permeability values of those six decomposition percentages were calculated, and the results are shown in the following table.
As shown in Table 1, during the decomposition of the hydrate, the porosity of the hydrate-bearing porous media increased continuously, as well as the value of the absolute permeability. Figure 2 shows the absolute permeability acquired by experiments in the decomposition of the hydrate-bearing porous media. As can be seen from the figure, the absolute permeability increased significantly at the very beginning of the hydrate decomposition. The increase rate in permeability also became lower as the percentage of hydrate decreased. Since the value of absolute permeability is related to the size of the pore channel in the porous media, absolute permeability increased as the pore radius increased. The absolute permeability values increased sharply at the first three experimental points where the decomposition percentage was low. This is due to that in the early stage of hydrate decomposition, a large passage was formed in the porous media of the hydrate, which led to a sharp decrease of the absolute permeability of the entire porous media. The pores in the porous media are composed of pore abdominal and pore channels. The channels with smaller openings, rather than the ones with larger openings, have a greater influence on the permeability [42]. In the late stage of decomposition, most of the hydrate decomposition positions were in the pore abdomen, so the influence on the permeability reduced gradually. As shown in the figure, the slope of the permeability curve decreased gradually, and when the decomposition reached about 50%, the value of the permeability tended to be stable.

3.1.2. Analysis of Relative Permeability

The relative permeability curve during the CH4 injection process was calculated with the values previously obtained, as shown in the Figure 3. As can be seen, the relative permeability curves of CH4 and water exhibit a typical X-shaped cross curve.
When the water saturation was low (less than 20%), the relative permeability of the water phase was extremely low, which was close to zero. The experimental glass beads were hydrophilic, and the water in the porous media was mostly present on the surface of the glass beads and the corners of the pores, which cannot flow into the pore channel. At this time, the gas flow in the porous media was continuous, and the relative permeability was high. At this time, the relative permeability of the water tended to be zero, indicating that the water was trapped in the porous media, so as not to flow easily. When the water saturation was high (greater than 80%), the relative permeability of the gas phase was extremely low, which was close to zero. Due to the hydrophilicity of the glass beads, water occupied most of the corners of the particle surface, and the gas was also in the flowable pore channels. Therefore, the interaction between the two phases was small, which made the change in permeability of the two phases in the region with high water saturation unobvious. The area in the above two regions was a two-phase co-infiltration zone. In the co-infiltration zone, the relative permeability of water increased with the increase of water saturation, and the relative permeability of methane decreased with the increase of water saturation. In the porous media, the pore structure was very complicated. The liquid resistance effect caused by the interaction of the two phases greatly reduced the permeability of the gas-liquid two-phase. Therefore, the minimum of the sum of the relative permeability of the two phases was in the two-phase co-infiltration zone.
It can be seen from the figure that as the hydrate decomposed, the relative permeability values of the two phases increased, and the range of the two-phase co-infiltration zone increased. The relative permeability at the end points also increased, with a decrease of the coexistence water saturation. At the beginning of the decomposition, the amount of change was more obvious. When the amount of the remaining hydrate was less than 50%, there was no significant change in the relative permeability curve of the porous media of the hydrate. In the initial stage of decomposition, the hydrate decomposed in the porous media formed a fluid passage, which caused a significant increase in the permeability of the two phases. However, after the hydrate was decomposed to a certain extent, the fluid passage in the porous media was basically formed, and the hydrate occupied the corners of the pores. So, the hydrate had less effect on the permeability.

3.2. Analysis of Flow Rate during the Decomposition in Hydrate-Bearing Porous Media

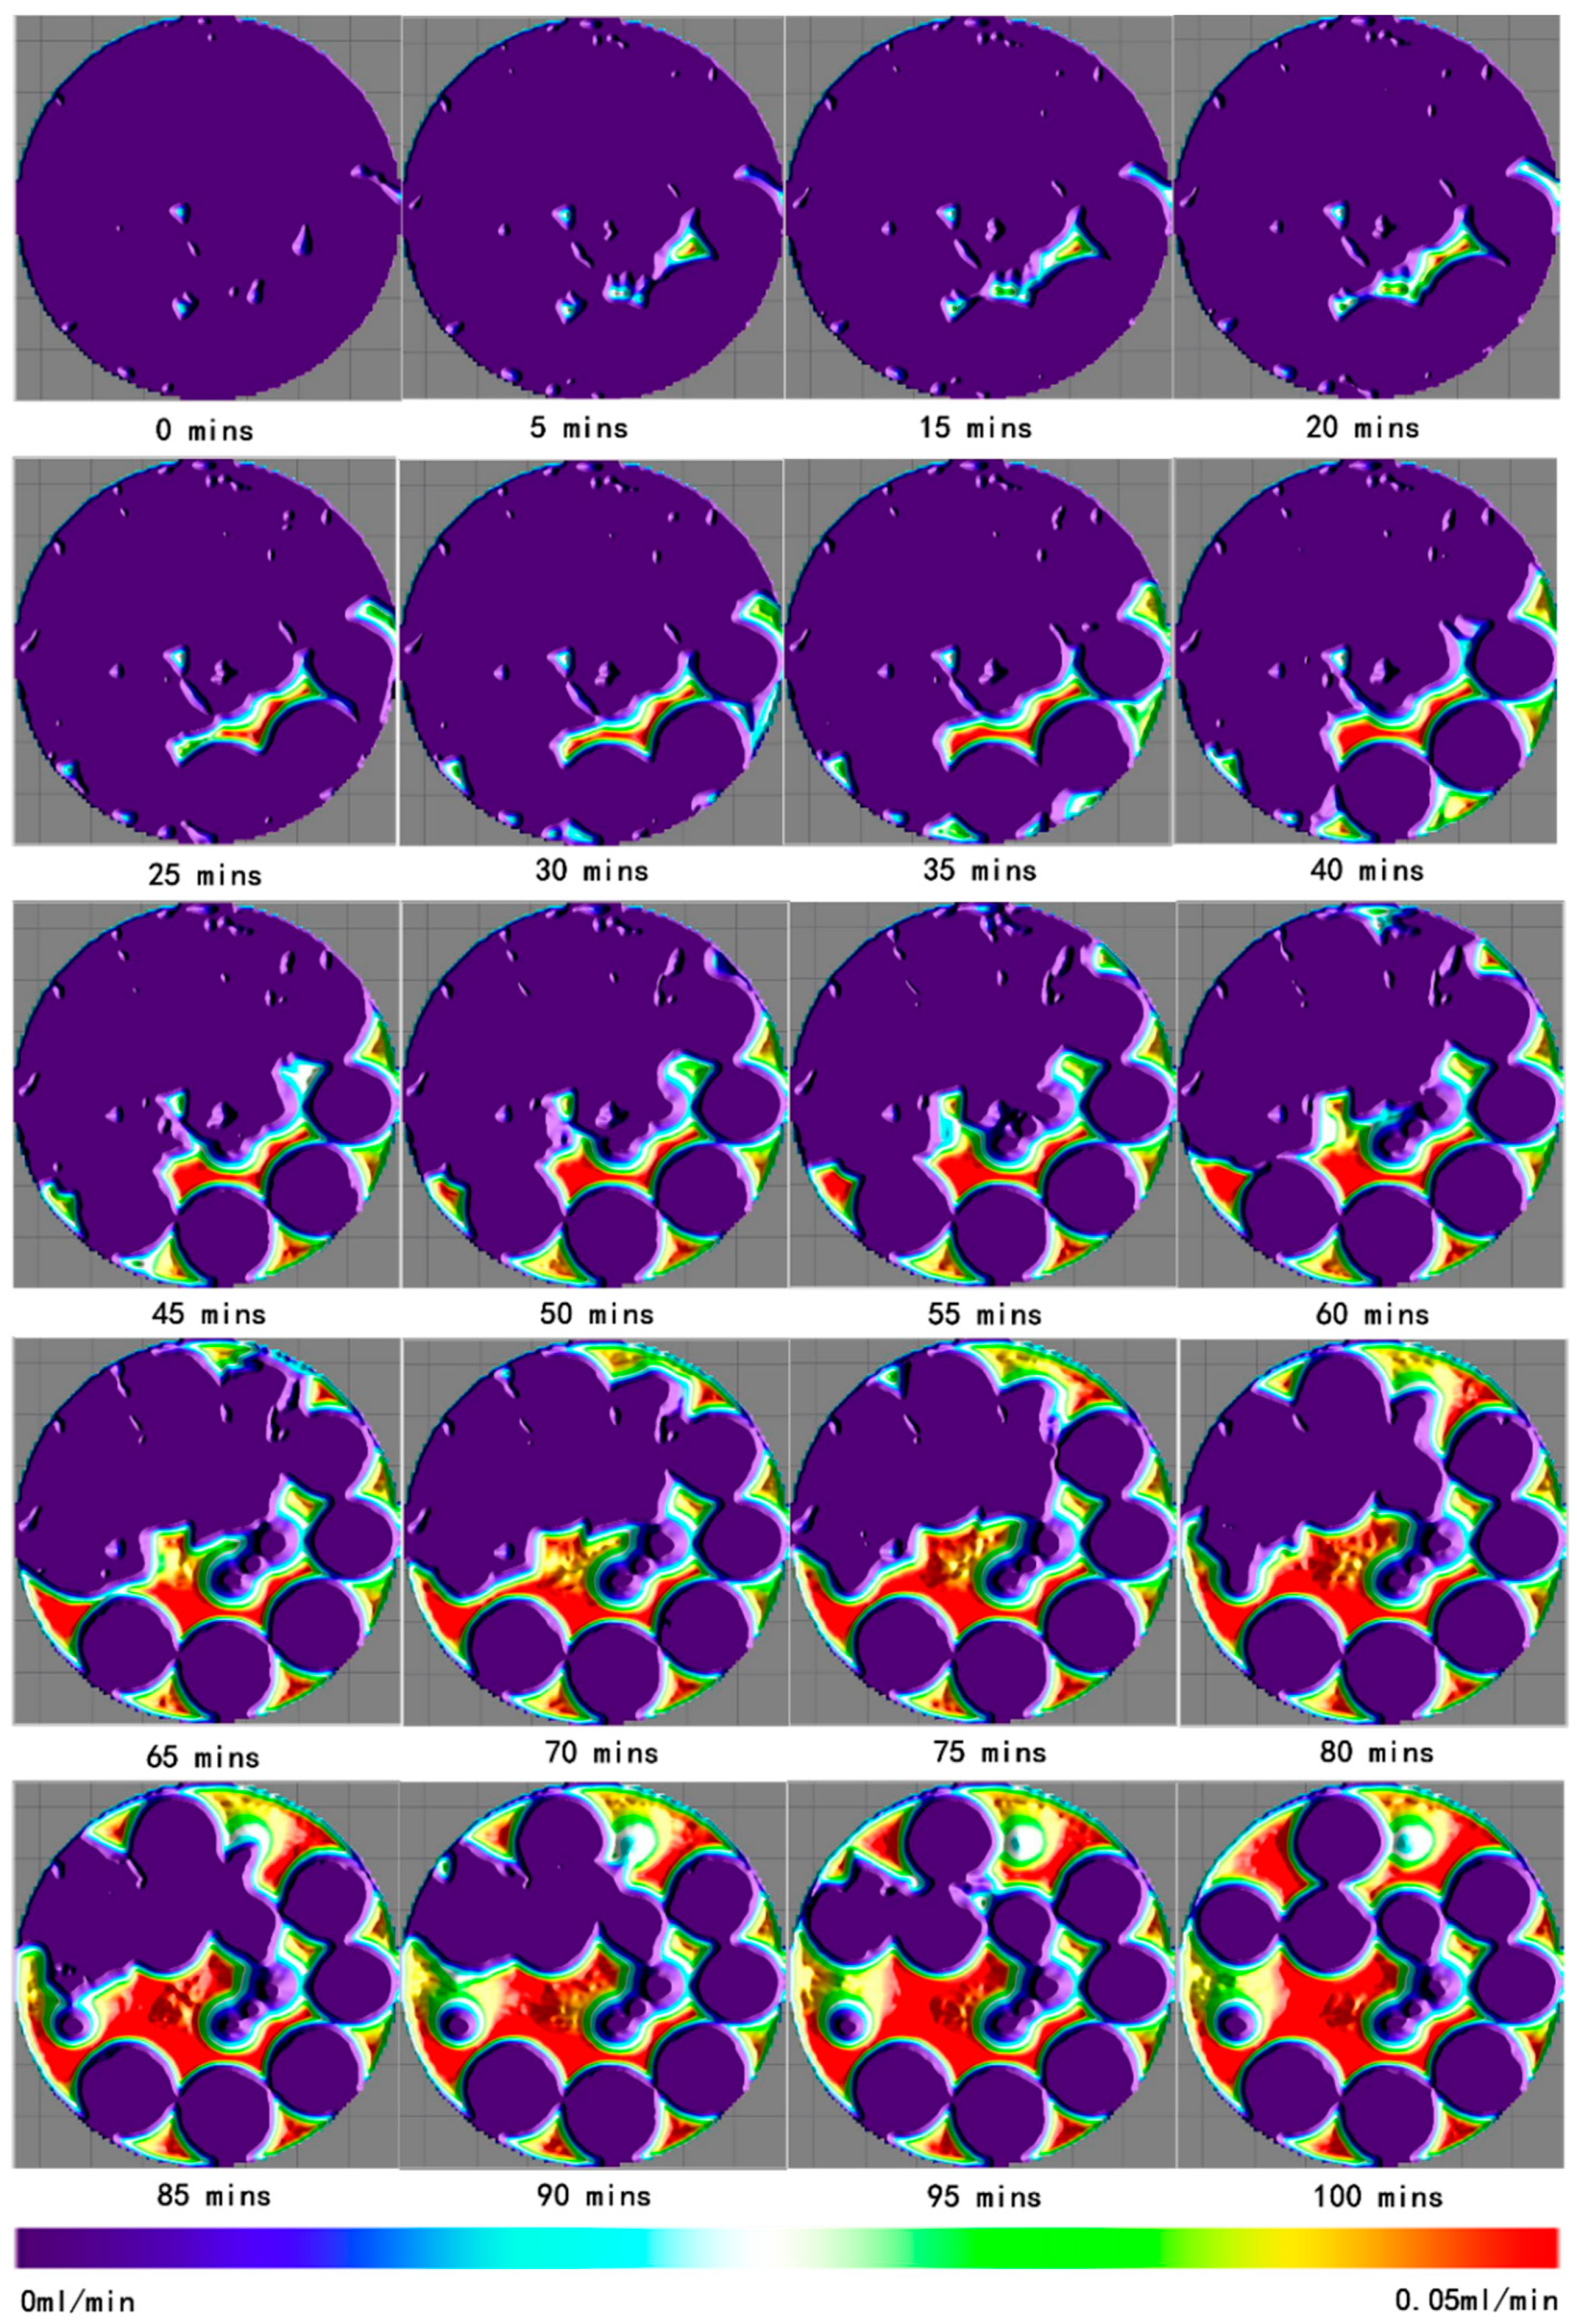
Figure 4 shows the velocity distribution of the heated decomposition of CH4 hydrate in glass beads at a flow rate of 2 mL/min at 25 °C. As shown in the figure, during the decomposition process, the velocity distribution was not uniform, and the pore distribution in the cross section affected the velocity distribution of the fluid. With the injection of hot fluid, the hydrate decomposed gradually. The pore structure also changed with a gradual increase of the porosity. The flow of the fluid was first observed in the pores in the middle of the cross section, and the hydrate gradually began to decompose centered on such pore. The heat injected by the heat flow was gradually introduced into the hydrate of the surrounding fluid, causing the hydrate to decompose.
In the cross section, the fluid flow velocity distribution was very uneven. The larger the pores, the greater the fluid flow velocity. In the large pores, the flow velocity at the center of the pore was high, and the flow velocity near the surface of the porous media and the wall surface of the sample tube were low. This is consistent with the phenomenon of suffusion. However, in small pores, the flow velocity was greatly affected by the wall effect. The flow velocity was affected by the hydrate surface, the glass beads surface and the sample tube surface. In general, when a fluid flows in a porous media, an adsorption retention layer is formed at the interface between the porous media and the fluid. This retention layer does not easily flow and seriously affects the flow of the fluid in the porous media. In low permeability porous media, the pore channel diameter is very small, and the retention layer seriously occupies the flow cross section in the pore, so the impact cannot be ignored. However, the porous media in this paper has a large permeability and a large pore channel diameter, so the influence of the retention layer is negligible.
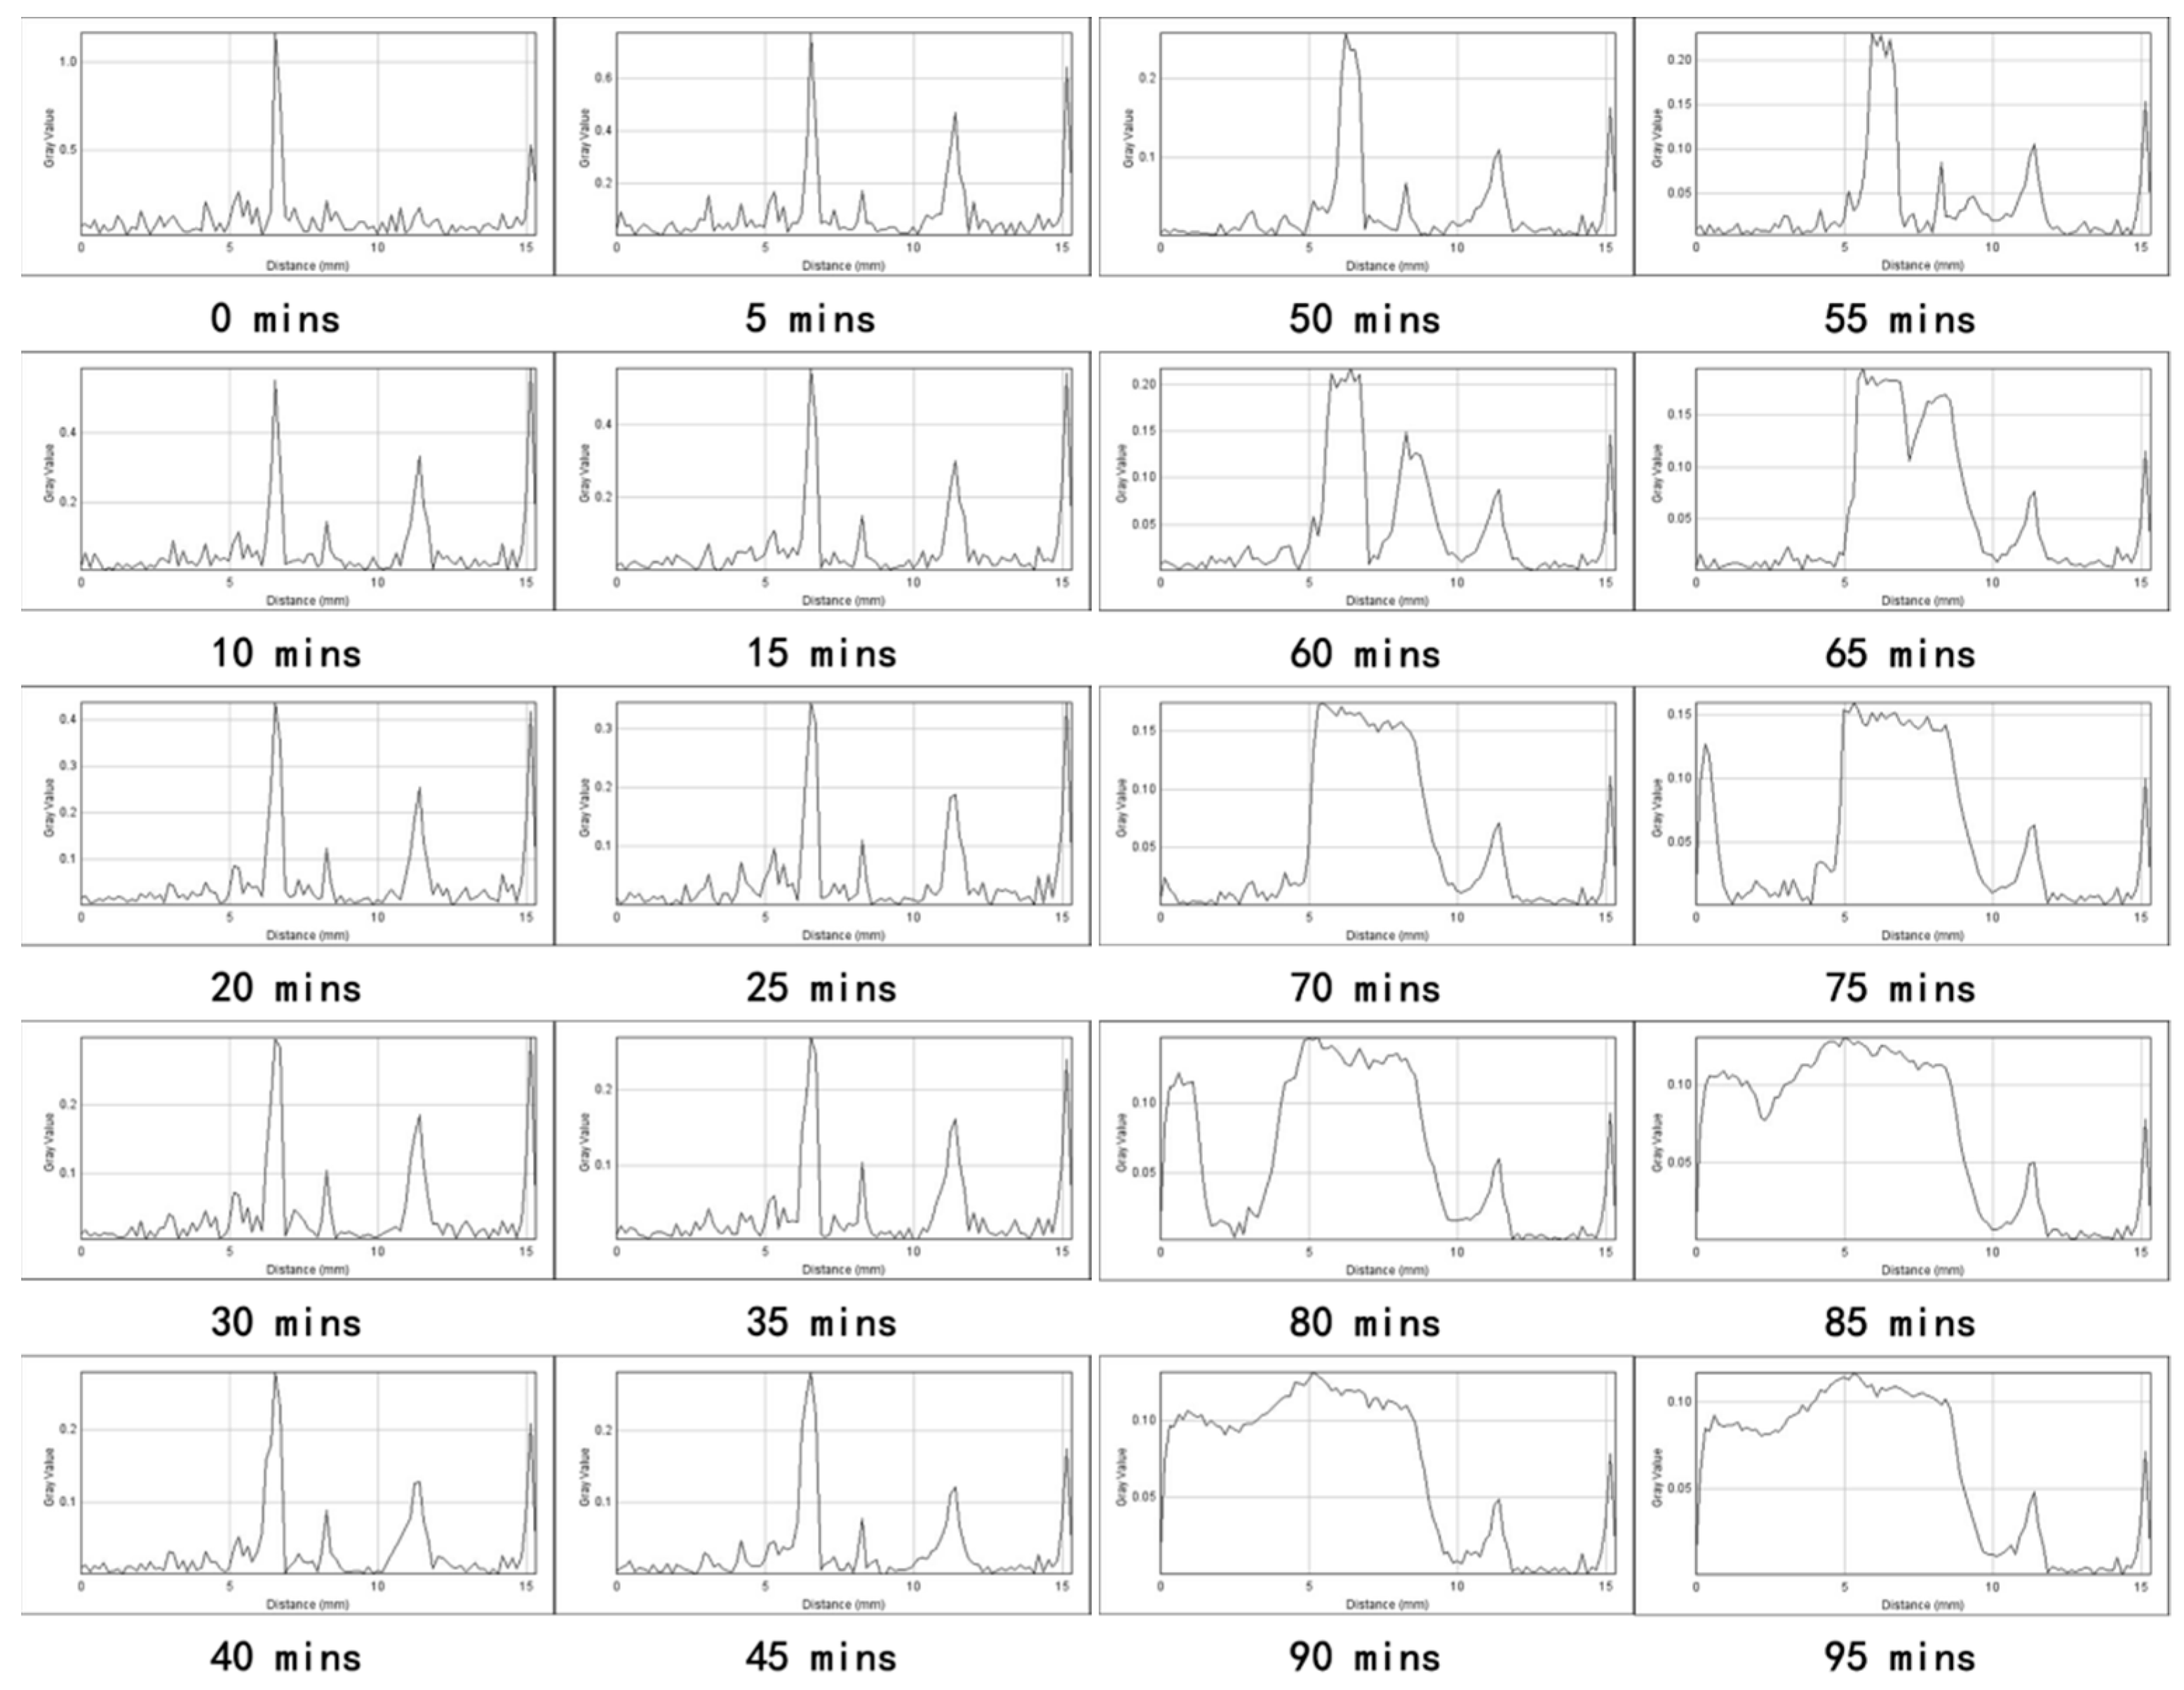
Figure 5 shows the velocity distribution on the horizontal central axis of the cross section during the heated decomposition of the hydrate at 2 mL/min. Free water and solids (hydrates and glass beads) can be distinguished from the velocity distribution image on the central axis. As shown in the figure, the area near speed 0 is glass beads and hydrate, and the other part is water. Since the porosity is small at the initial stage of the injection of the fluid, the flow rate is also relatively large. As the hydrate decomposed, the porosity gradually increased and the fluid flow rate gradually decreased. However, in the pores, the velocity distribution is approximately similar to a parabolic shape, and the center velocity of the pores is greater than the portion near the surface of the glass beads, the hydrate, and sample tube. Nevertheless, as the hydrate decomposed, the velocity pattern in the pores also changed, and the velocity distribution in the pores was not a complete parabolic shape. This is consistent with the velocity profile in the section shown in Figure 4.
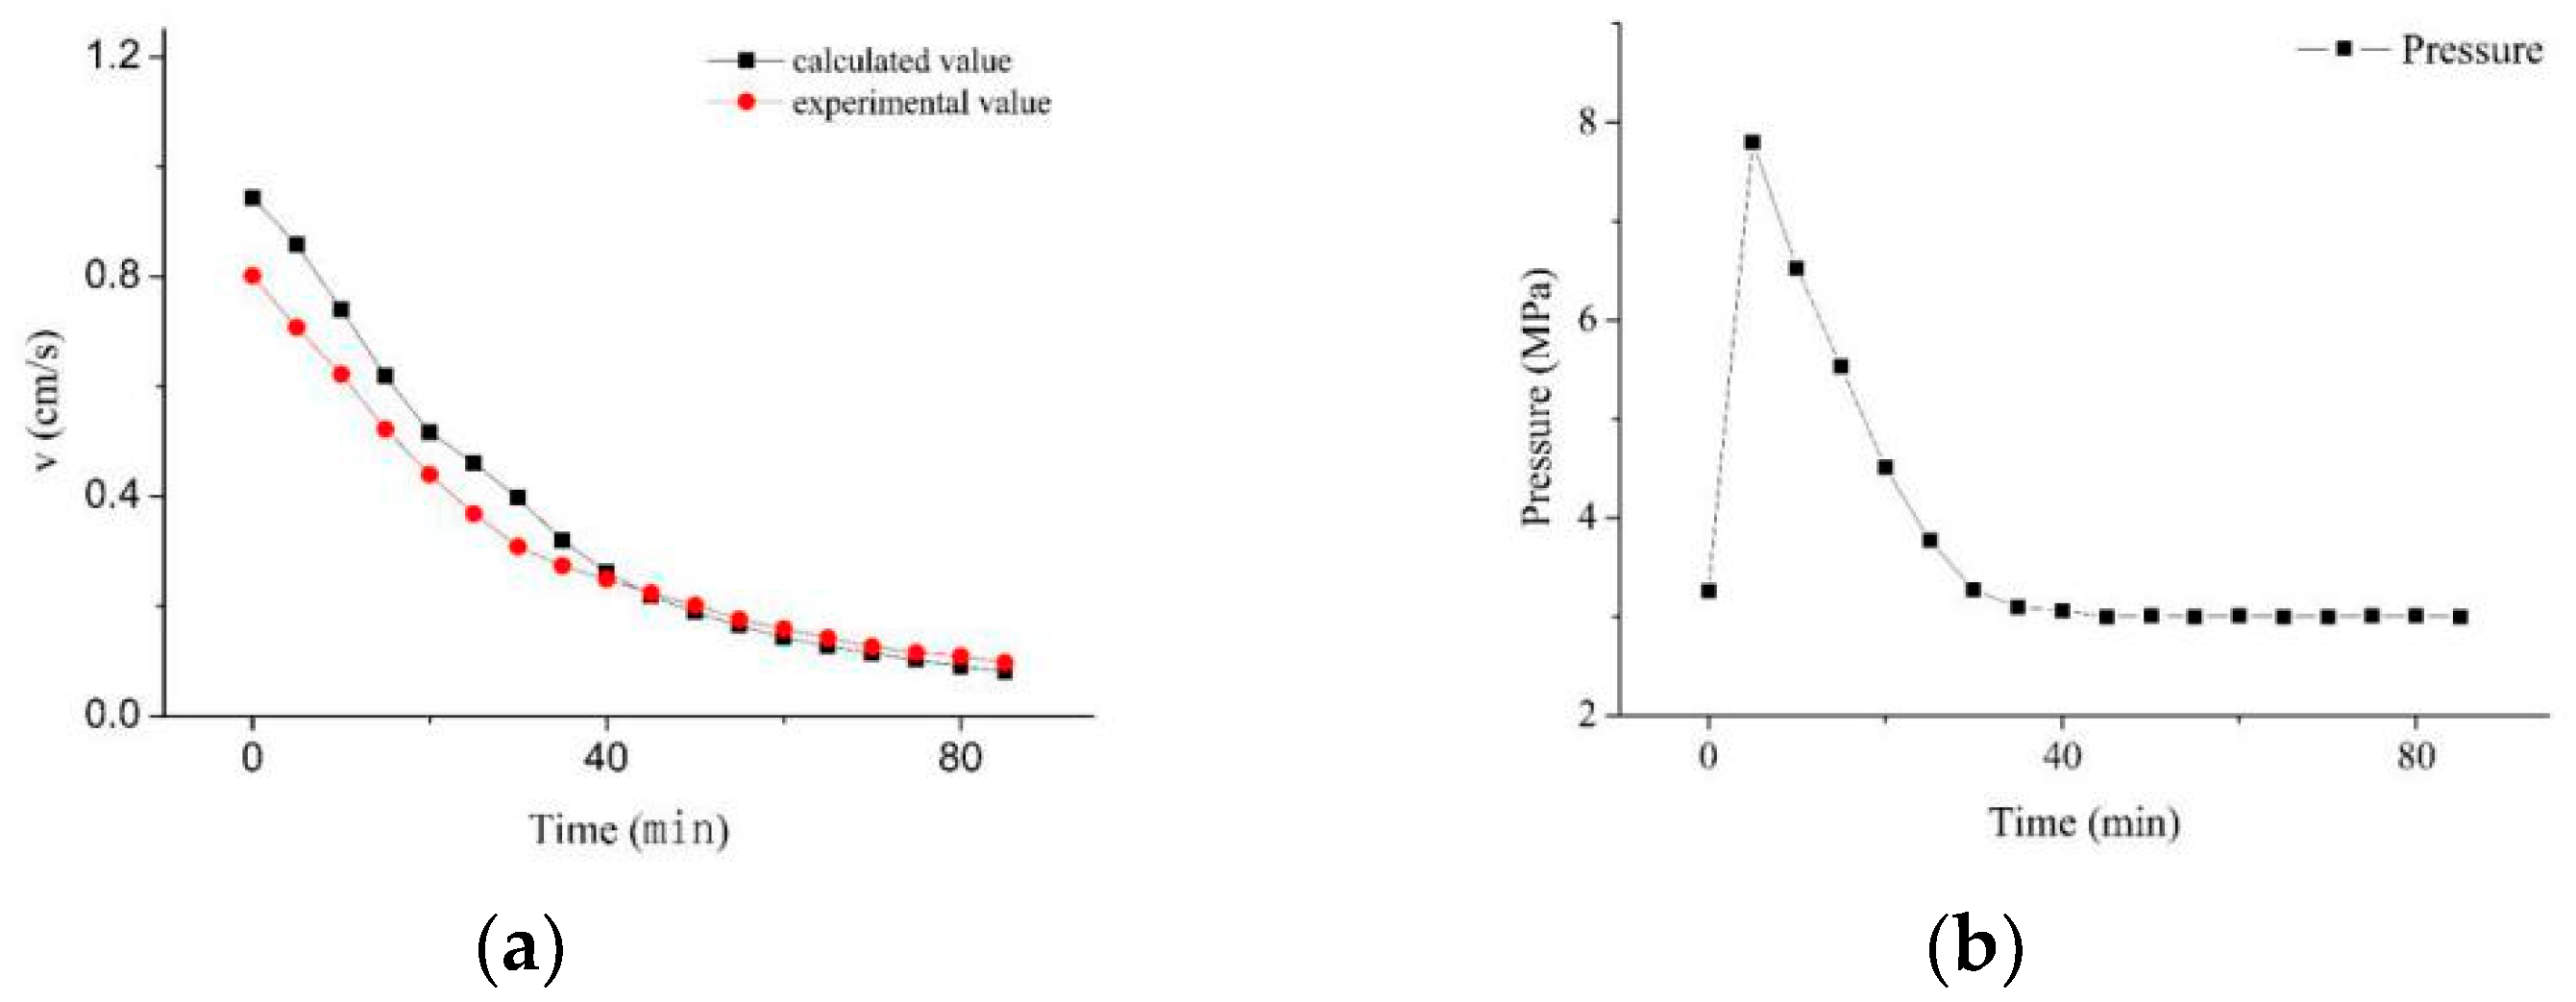
At each time point, the average velocity of the fluid throughout the section was determined by the injection velocity, cross-sectional area, and porosity of the fluid, as shown in Equation (1).
v i = q A φ i
Here v i is the actual average velocity at the i time point, q is the injection flow rate set for the experiment, φ i is the porosity at i time point, and A is the cross-sectional area.
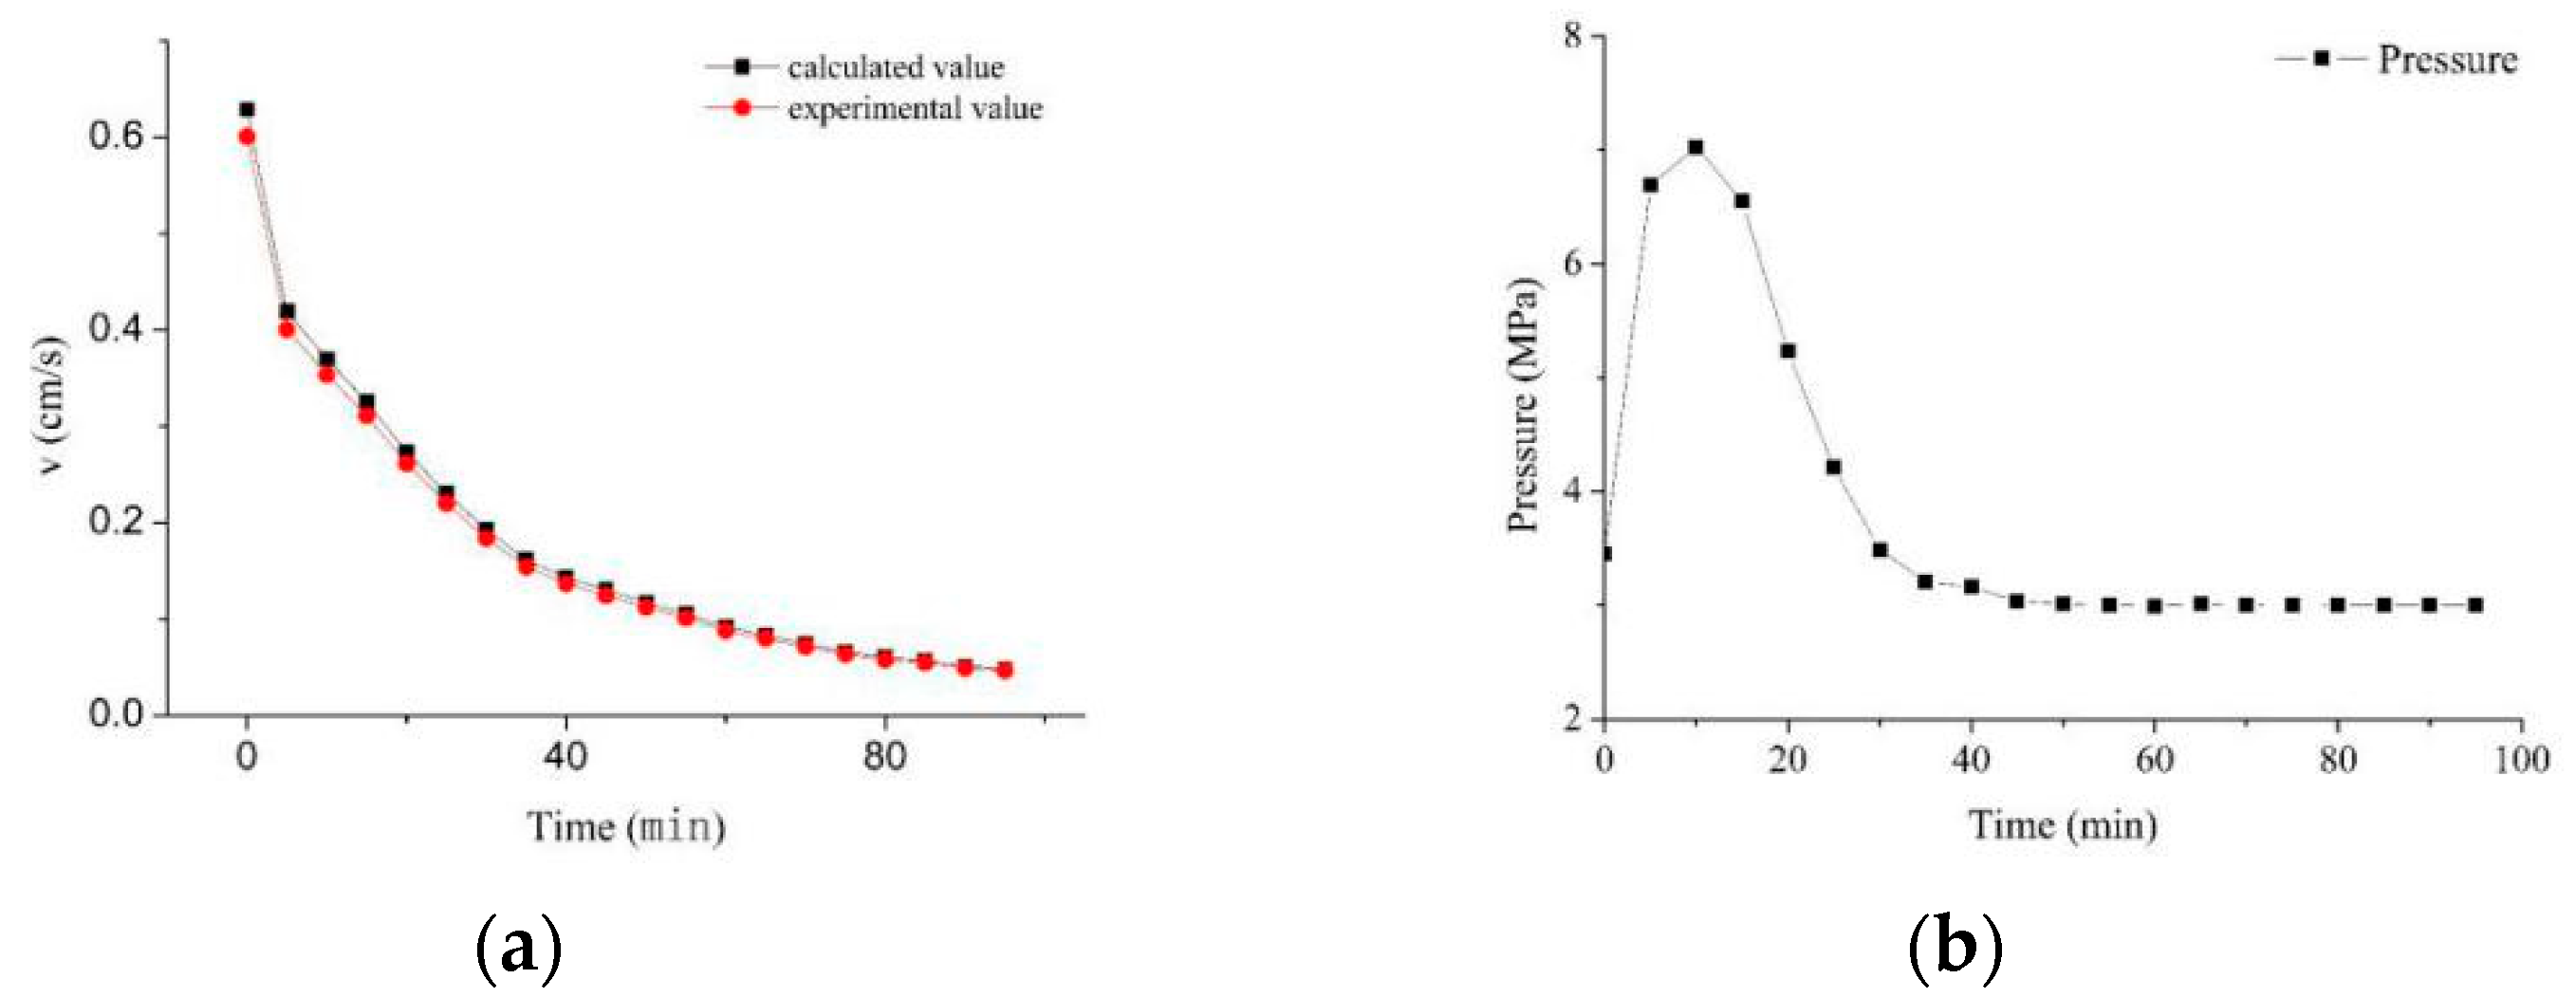
Since the injection flow rate of each set of experiments was constant, as the hydrate decomposed, the porosity in the sheet increased. So, the average speed at each time point also reduced gradually. Figure 6a shows the experimentally measured average velocity and calculated average velocity in the cross section of the graph, and Figure 6b is the injection pressure curve in the cross section. As shown in the figure, the average flow velocity of the cross section decreased with the decomposition of the hydrate, and the constant flow injection pressure also decreased with the decomposition of the hydrate. The actual measured value of the average velocity in the cross section was close to the calculated value, indicating that the speed measurement method used in the experiment is feasible.
Figure 7 shows the velocity distribution of the CH4 hydrate in glass beads at a flow rate of 4 mL/min at 25 °C The fluid velocity distribution was similar to the 2 mL/min case, but the distribution was more uneven and was greatly affected by changes in pore structure. Large pores less affected by the solid surface had a higher velocity, while small pores less affected by the surface had a lower velocity, and the retention layer was also negligible. The fluid flow was first observed at the position close to the sample tube wall, and there was also a small pore flow at the center of the interface. Over time, the hydrate began to decompose centered on these two positions, and the heat from the heat flow was passed to the hydrate in the pores and began to cause the hydrate to decompose.
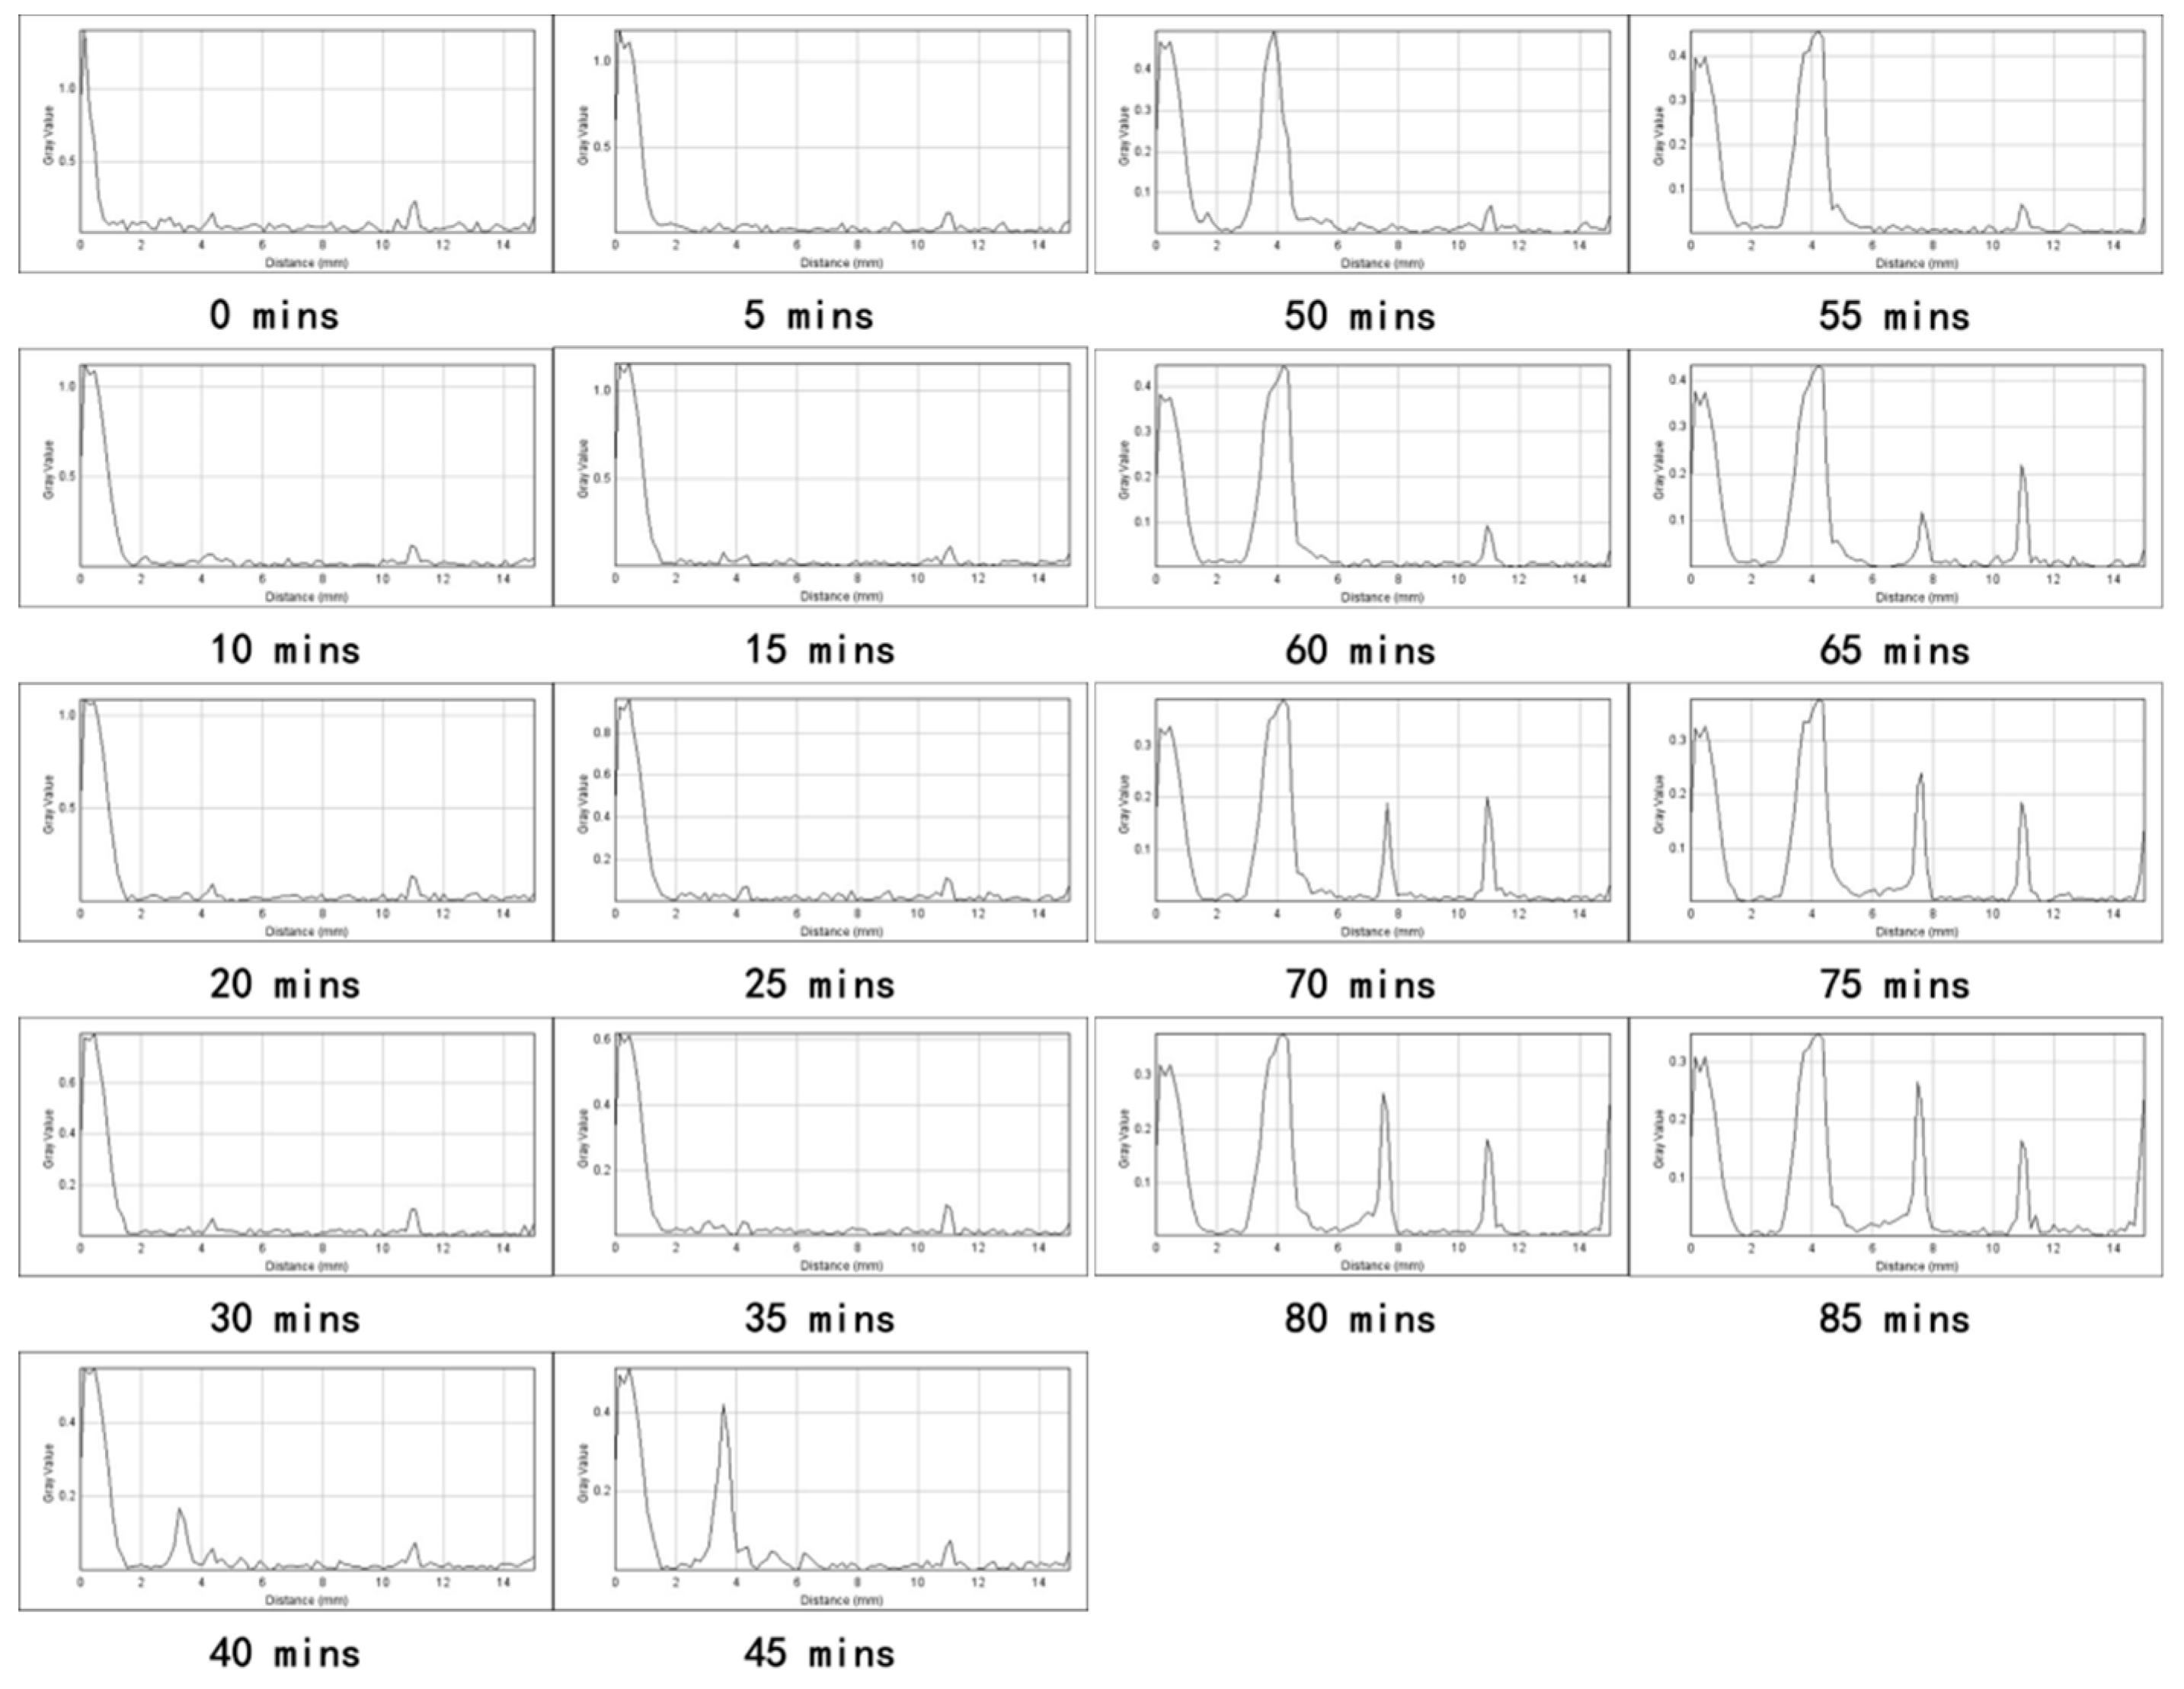
Figure 8 shows the velocity distribution over the horizontal central axis of the cross section during the heated decomposition of the hydrate at 4 mL/min. Similar to the case of 2 mL/min, free water and solids (hydrate and glass beads) can also be distinguished from the velocity distribution image on the central axis. Since the porosity was small at the initial stage of the fluid injection, the flow rate was also relatively high. As the hydrate decomposed, the porosity gradually increased and the fluid flow rate gradually decreased. Since the pores passing through the central axis were smaller than the pores in 2 mL/min case, the velocity distribution in the pores shown in the figure exhibits a distinct parabolic shape.
Figure 9a shows the average velocity distribution at various time points in the 4 mL/min velocity injection process, and Figure 9b shows the injection pressure for constant current injection. As the hydrate decomposed, the average velocity in the cross section also decreased, and the injection pressure also decreased. The calculated average velocity calculated by Equation (1) is in good agreement with the experimentally measured average velocity value, but slightly higher than that in the 2 mL/min case.
We may obtain from the experiment results that the existence of hydrate affects the water flow in the porous media strongly. The water flows into the pore channels which are unoccupied by hydrate. With the heat input, the radius of the heat flow runner increases. The hydrate near the heat flow runner decomposes due to the heat transfer. Because of the low injecting velocity, the hydrate does not decompose violently. When the injection rate increases, the decomposition intensifies and more heat is absorbed which reduces the local temperature. If the temperature and pressure conditions are below the phase equilibrium conditions, the hydrate reformation will occur immediately [43]. The newly formed hydrate causes the narrowing of the flow runners and even a plug of the runners. This makes the average velocity value in 4 mL/min slightly higher than the calculated average velocity.

4. Conclusions

In this paper, the MRI technique was used to study the absolute and relative permeability and flow distribution of the hydrate-bearing porous media in heated decomposition process. The following conclusions were obtained.
In the decomposition process of hydrate bearing porous media, the absolute permeability value of porous media increased continuously, and there was an obvious increase in the permeability in the initial stage of decomposition. As the hydrate decomposition proceeded, the absolute permeability value increased slowly, and became stable after the decomposition amount was 50%.
The relative permeability change curve of the hydrate bearing porous media during the decomposition process was obtained by MRI imaging system. The curve is a typical X-shaped cross curve. When the water saturation was low (less than 20%), the relative permeability of the water phase was extremely low, which was close to zero. And the water was trapped in the porous media, which made the water difficult to flow. When the water saturation was high (greater than 80%), the relative permeability of the gas phase was extremely low, which was close to zero. But the interaction between the two phases was small, which made an unchanged permeability of the two phases in the region with high water saturation. In the two-phase co-infiltration zone, the relative permeability of water increased with the increase of water saturation, and the relative permeability of methane decreased with the increase of water saturation. As the hydrate decomposed, the relative permeability values of the two phases increased, the range of the two-phase co-infiltration zone increased with the increase of relative permeability at the endpoint, and the coexistence water saturation decreased. At the beginning of the decomposition, the change was more obvious. When the amount of the remaining hydrate was less than 50%, the relative permeability curve of the hydrate-bearing porous media was not significantly changed.
The instantaneous flow velocity distribution during the decomposition of the hydrate in the porous media was obtained. During the hydrate decomposition process, the velocity distribution was very uneven and coincided with the porous media structure. The flow rate of large pores was high, and the flow rate of small pores was low. The average velocity in the cross section decreased as the hydrate decomposed.

Author Contributions

Conceptualization, K.X., Y.S. and J.Z.; methodology, K.X. and L.Y.; validation, K.X., and Y.L.; formal analysis, K.X.; investigation, K.X. and L.Y.; resources, Y.S. and S.Y.; data curation, L.Y and Y.L.; writing—original draft preparation, K.X.; writing—review and editing, K.X. and J.Z.; visualization, K.X. and L.Y.; supervision, S.Y. and Y.S.; project administration, K.X., J.Z. and L.Y.

Funding

This research was funded by the National Natural Science Foundation of China, Grant number 51706032, 51622603 and 51806027.

Conflicts of Interest

The authors declare no conflict of interest.

References

  1. Collett, T.; Bahk, J.J.; Baker, R.; Boswell, R.; Divins, D.; Frye, M.; Goldberg, D.; Husebo, J.; Koh, C.; Malone, M.; et al. Methane hydrates in nature-current knowledge and challenges. J. Chem. Eng. Data 2015, 60, 319–329. [Google Scholar] [CrossRef]
  2. Sloan, E.D. Clathrate Hydrates of Natural Gases, 2nd ed.; Marcel Decker Inc.: New York, NY, USA, 1998; pp. 66–79. [Google Scholar]
  3. MacDonald, G.J. Role of methane clathrates in past and future climates. Clim. Chang. 1990, 16, 247. [Google Scholar] [CrossRef]
  4. Klauda, J.B.; Sandler, S.I. Global Distribution of Methane Hydrate in Ocean Sediment. Energy Fuels 2005, 19, 459–470. [Google Scholar] [CrossRef]
  5. Koh, C.A. Towards fundamental understanding of natural gas hydrates. Chem. Soc. Rev. 2002, 31, 157. [Google Scholar] [CrossRef] [PubMed]
  6. Belosludov, V.R.; Lavrentiev, M.Y.; Dyadin, Y.A. Dynamic and thermodynamic properties of clathrate hydrates. J. Incl. Phenom. Mol. Recognit. Chem. 1990, 8, 59–69. [Google Scholar] [CrossRef]
  7. Li, G.; Moridis, G.J.; Zhang, K.; Li, X.S. Evaluation of gas production potential from marine gas hydrate deposits in Shenhu Area of South China Sea. Energy Fuels 2010, 24, 6018–6033. [Google Scholar] [CrossRef]
  8. Li, B.; Li, X.S.; Li, G.; Jia, J.L.; Feng, J.C. Measurements of water permeability in unconsolidated porous media with methane hydrate formation. Energies 2013, 6, 3622–3636. [Google Scholar] [CrossRef]
  9. Seol, Y.; Kneafsey, T.J. X-ray computed-tomography observations of water flow through anisotropic methane hydrate-bearing sand. J. Petrol. Sci. Eng. 2009, 66, 121–132. [Google Scholar] [CrossRef] [Green Version]
  10. Seol, Y.; Kneafsey, T.J. Methane hydrate induced permeability modification for multiphase flow in unsaturated porous media. J. Geophys. Res. 2011, 116. [Google Scholar] [CrossRef] [Green Version]
  11. Konno, Y.; Yoneda, J.; Egawa, K.; Ito, T.; Jin, Y.; Kida, M.; Suzuki, K.; Fujii, T.; Nagao, J. Permeability of sediment cores from methane hydrate deposit in the Eastern Nankai Trough. Mar. Pet. Geol. 2015, 66, 487–495. [Google Scholar] [CrossRef]
  12. Priest, J.A.; Druce, M.; Roberts, J.; Schultheiss, P.; Nakatsuka, Y.; Suzuki, K. PCATS Triaxial: A new geotechnical apparatus for characterizing pressure cores from the Nankai Trough, Japan. Mar. Pet. Geol. 2015, 66, 460–470. [Google Scholar] [CrossRef]
  13. Oyama, H.; Konno, Y.; Masuda, Y.; Narita, H. Dependence of depressurization-induced dissociation of methane hydrate bearing laboratory cores on heat transfer. Energy Fuels 2009, 23, 4995–5002. [Google Scholar] [CrossRef]
  14. Konno, Y.; Oyama, H.; Nagao, J.; Naiki, M.; Jiro, N. Sustainable gas production from methane hydrate reservoirs by the cyclic depressurization method. Energy Convers. Manag. 2016, 108, 439–445. [Google Scholar] [CrossRef]
  15. Klapp, S.A.; Bohrmann, G.; Kuhs, W.F.; Murshed, M.M.; Pape, T.; Klein, H.; Techmer, K.S.; Heeschen, K.U.; Abegg, F. Microstructures of structure I and II gas hydrates from the Gulf of Mexico. Mar. Petrol. Geol. 2010, 27, 116–125. [Google Scholar] [CrossRef]
  16. Yang, M.; Song, Y.; Zhao, Y.; Liu, Y.; Jiang, L.; Li, Q. MRI measurements of CO2 hydrate dissociation rate in a porous medium. Magn. Reson. Imaging 2011, 29, 1007–1013. [Google Scholar] [CrossRef]
  17. Wu, Y.; Tahmasebi, P.; Lin, C.; Zahid, M.A.; Dong, C.; Golab, A.N.; Ren, L. A comprehensive study on geometric, topological and fractal characterizations of pore systems in low-permeability reservoirs based on SEM, MICP, NMR, and X-ray CT experiments. Mar. Petrol. Geol. 2019, 103, 12–28. [Google Scholar] [CrossRef]
  18. Baumann, T.; Petsch, R.; Niessner, R. Direct 3-D measurement of the flow velocity in porous media using magnetic resonance tomography. Environ. Sci. Technol. 2000, 34, 4242–4248. [Google Scholar] [CrossRef]
  19. Ikuo, O.; Shuichiro, H.; Kuniyasu, O. MRI velocity measurements of water flow in porous media containing a stagnant immiscible liquid. Meas. Sci. Technol. 2001, 12, 1465. [Google Scholar]
  20. Minagawa, H.; Nishikawa, Y.; Ikeda, I.; Sakamoto, Y.; Miyazaki, K.; Takahara, N.; Komai, T.; Narita, H. Relation between permeability and pore-size distribution of methane-hydrate-bearing sediments. In Proceedings of the Offshore Technology Conference, Houston, TX, USA, 5–8 May 2008. [Google Scholar]
  21. Mantle, M.D.; Sederman, A.J.; Gladden, L.F. Single- and two-phase flow in fixed-bed reactors: MRI flow visualisation and lattice-Boltzmann simulations. Chem. Eng. Sci. 2001, 56, 523–529. [Google Scholar] [CrossRef]
  22. Mantle, M.D.; Sederman, A.J.; Gladden, L.F.; Raymahasay, S.; Winterbottom, J.M.; Stitt, E.H. Dynamic MRI visualization of two-phase flow in a ceramic monolith. AICHE J. 2004, 48, 909–912. [Google Scholar] [CrossRef]
  23. Martin, B.; Chandrasekhar, R. Method for measuring local hydraulic permeability using magnetic resonance imaging. Phys. Rev. E 2001, 63, 6. [Google Scholar]
  24. Martin, B.; Chandrasekhar, R. Direct measurement of porous media local hydrodynamical permeability using gas MRI. Magn. Reson. Imaging 2001, 19, 379–383. [Google Scholar]
  25. Thomas, B.; Charles, J.W. Visualization of colloid transport through heterogeneous porous media using magnetic resonance imaging. Colloids Surf. A 2005, 265, 2–10. [Google Scholar]
  26. Yuen, E.H.L.; Sederman, A.J.; Sani, F.; Alexander, P.; Gladden, L.F. Correlations between local conversion and hydrodynamics in a 3-D fixed-bed esterifieation Proeess: An MRI and lattice-Boltzmann study. Chem. Eng. Sci. 2003, 58, 613–619. [Google Scholar] [CrossRef]
  27. Davies, S.; Hardwick, A.; Spowage, K.; Packer, K.J. Fluid velocity imaging of reservoir core samples. Magn. Reson. Imaging 1994, 12, 265–268. [Google Scholar] [CrossRef]
  28. Merrill, M.; Jin, Z. Veloeity measurements in natural porous rocks. Magn. Reson. Imaging 1994, 12, 345–348. [Google Scholar] [CrossRef]
  29. Deurer, M.; Vogeler, L.; Khrapitehev, A.; Scotter, D. Imaging of water-flow in porous media by magnetic resonance imaging microscopy. J. Environ. Qual. 2002, 31, 487–493. [Google Scholar] [CrossRef]
  30. Erslanda, G.; Husebø, J.; Graue, A.; Baldwin, B.A.; Howardc, J.; Stevens, J. Measuring gas hydrate formation and exchange with CO2 in Bentheim sandstone using MRI tomography. Chem. Eng. J. 2010, 158, 25–31. [Google Scholar] [CrossRef]
  31. Zhang, X.; Tahmasebi, P. Micromechanical evaluation of rock and fluid interactions. Int. J. Greenh. Gas Control 2018, 76, 266–277. [Google Scholar] [CrossRef]
  32. Tahmasebi, P.; Kamrava, S. A pore-scale mathematical modeling of fluid-particle interactions: Thermo-hydro-mechanical coupling. Int. J. Greenh. Gas Control 2019, 83, 245–255. [Google Scholar] [CrossRef]
  33. Fagbemi, S.; Tahmasebi, P.; Piri, M. Interaction Between Fluid and Porous Media with Complex Geometries: A Direct Pore—Scale Study. Water Resour. Res. 2018, 54, 6336–6356. [Google Scholar] [CrossRef]
  34. Zhao, J.; Yang, L.; Xue, K.; Lam, W.; Li, Y.; Song, Y. In situ observation of gas hydrates growth hosted in porous media. Chem. Phys. Lett. 2014, 612, 124–128. [Google Scholar] [CrossRef]
  35. Kumar, A.; Maini, B.; Bishnoi, P.R.; Clarke, M.; Zatsepina, O.; Srinivasan, S. Experimental determination of permeability in the presence of hydrates and its effect on the dissociation characteristics of gas hydrates in porous media. J. Pet. Sci. Eng. 2010, 70, 114–122. [Google Scholar] [CrossRef]
  36. Honarpour, M.; Mahmood, S.M. Relative-permeability measurements: An overview. J. Pet. Technol. 1988, 40, 963–966. [Google Scholar] [CrossRef]
  37. Johnson, E.F.; Bossler, D.P.; Naumann, V.O. Calculation of relative permeability from displacement experiments. AIME 1959, 216, 370–372. [Google Scholar]
  38. Li, H.; Yang, D.; Arhuoma, M. Relative permeability estimation from displacement experiments using EnKF method. In Proceedings of the CPS/SPE International Oil and Gas Conference and Exhibition, Beijing, China, 8–10 June 2010. [Google Scholar]
  39. Eydinov, D.; Gao, G.; Li, G.; Reynolds, A.C. Simultaneous estimation of relative permeability and porosity/permeability fields by history matching production data. J. Pet. Technol. 2009, 48, 13–25. [Google Scholar] [CrossRef]
  40. Chardaire-Riviere, C.; Chavent, G.; Jaffre, J.; Liu, J.; Bourbiaux, B. Simultaneous estimation of relative permeability and capillary pressure. SPE Form. Eval. 1992, 7, 283–289. [Google Scholar] [CrossRef]
  41. Emmanuil, G.S.; Moritz, B. Hydromechanics Theory and Fundamentals; Wiley-VCH: Weinheim, Germany; John Wiley distributor: Chichester, UK, 2011; pp. 296–330. [Google Scholar]
  42. Nariman, M.; Sheng, D.; Yongkoo, S.; Jaewon, J. Impact of hydrate saturation on water permeability in hydrate-bearing sediments. J. Pet. Sci. Eng. 2019, 174, 696–703. [Google Scholar]
  43. Seol, Y.; Myshakin, E. Experimental and numerical observations of hydrate reformation during depressurization in a core-scale reactor. Energy Fuels 2011, 25, 1099–1110. [Google Scholar] [CrossRef]
Figure 1. The flow characteristics in-situ test experimental platform diagram. MRI: Magnetic resonance imaging.
Energies 12 01736 g001
Figure 2. The absolute permeability acquired by experiments in the decomposition of the hydrate-bearing porous media.
Energies 12 01736 g002
Figure 3. The relative permeability acquired by experiments during the decomposition process of the hydrate-bearing porous media.
Energies 12 01736 g003
Figure 4. The velocity distribution in the progress of the decomposition of the hydrate bearing porous media.
Energies 12 01736 g004
Figure 5. The velocity distribution in the progress of the decomposition of the hydrate bearing porous media on the central axis.
Energies 12 01736 g005
Figure 6. (a) The average velocity value and (b) the pressure change curve in the cross section.
Energies 12 01736 g006
Figure 7. The velocity distribution in the progress of the decomposition of the hydrate bearing porous media.
Energies 12 01736 g007
Figure 8. The velocity distribution in the progress of the decomposition of the hydrate bearing porous media on the central axis.
Energies 12 01736 g008
Figure 9. (a) The average velocity value and (b) the pressure change curve in the cross section.
Energies 12 01736 g009
Table 1. The absolute permeability acquired by experiments during the decomposition process of the hydrate bearing porous media.
Decomposition RatePorosityAbsolute Permeability
µm2
100.0%0.03010.9
88.5%0.04546.8
78.9%0.08280.7
70.0%0.11791.2
54.1%0.17997.2
34.9%0.25499.8
15.1%0.331101.3
0.0%0.390102.1