Article

An Analytic Method for Power System Fault Diagnosis Employing Topology Description

1
State Key Laboratory of Advanced Electromagnetic Engineering and Technology, Huazhong University of Science and Technology, Wuhan 430074, China
2
Wuhan Second Ship Design and Research Institute, Wuhan 430064, China
*
Author to whom correspondence should be addressed.
Energies 2019, 12(9), 1770; https://doi.org/10.3390/en12091770
Submission received: 23 March 2019 / Revised: 22 April 2019 / Accepted: 9 May 2019 / Published: 10 May 2019

Abstract

:
When a fault occurs in a power system, fault section estimation is the primary premise for troubleshooting and power recovery, and an effective fault diagnosis system will play a big role in decision making. However, the topology information is not well employed in existing fault diagnosis methods, and it is complex and time consuming to analyze the relationship between the protective devices and the sections. In this paper, a novel analytic method which employs topology description is proposed for fault diagnosis. The topology descriptions of the sections and the protective devices are firstly established according to the network structure, and based on which the operating logic and the cooperative relationship of the protective devices can be easily analyzed by matrix operation. Considering the factors of logic error and communication error, the fault diagnosis problem is formulated as an integer programming problem and can be solved by intelligent algorithm. The case studies of different power systems show that the proposed method can quickly identify the fault section, even with the abnormal operation or error alarm of protective devices.

1. Introduction

Modern power systems are equipped with redundant protective devices to increase security and reliability. Under this background, a large number of alarms will flow into the dispatch center when fault occurs. The fault diagnosis problem is to interpret the raw alarms into summarized information, which helps dispatchers make the right decisions for troubleshooting and power recovery. This task can be very hard, especially under complex fault scenarios. Thus, it’s of great significance to develop an effective fault diagnosis system [1].
To deal with the fault diagnosis problem, many kinds of methods have been proposed, such as the approaches based on expert system [2,3,4], artificial neural network [5,6,7], fuzzy theory [8,9], rough sets [10,11], Bayesian network [12,13,14], Petri nets [15,16,17] and analytic model [18,19,20,21]. Although these methods have advantages in some respects, they have their own disadvantages. For example, the expert system has difficulty in establishing and maintaining the knowledge base; the artificial neural network lacks the ability to interpret the reasoning results; the fuzzy rules and membership functions of the fuzzy theory are subject to subjective influences; the prior probability is difficult to obtain for a Bayesian network; the Petri nets-based method has difficulties in online modeling and thus the adaptability is poor.
The analytic model-based method formulates the fault diagnosis problem as a programming problem, and many well developed intelligent algorithms can be used to solve the problem, such as the genetic algorithm [18,22], Tabu-search [20], ant colony algorithm [23], immune algorithm [24,25], honey-bee mating algorithm [26], brain storm optimization [27]. Therefore, this kind of method has strong theoretical and mathematical foundations and gets more and more attention in recent years.
At present, the research of analytic model is mainly focused on improving the objective function. In Reference [28], the cooperating relationship of the protective devices is introduced into the objective function, and the GATS algorithm is developed to solve the optimization problem. In [29], the malfunctions of protective relays and circuit breakers are considered in the analytic model, and the results show that the model has better fault tolerance. Based on this research, the operating logic of the protective devices and their coupling relationship with the alarms are further analyzed in [30], and a novel analytic model is established to solve the problem of alarm distortion. In reference [31], different weight coefficients are assigned to the protective devices in the objective function, and the results show that the coefficients can eliminate the problem of multiple solutions. In References [32,33], temporal reasoning is employed to analyze the timing information of the alarms, and the temporal constraints are further introduced into the objective function, which enriches the theoretical connotation of the analytic model. In reference [34], the discrepancy index, temporal conflict index and minimum index are comprehensively considered in the objective function, which can adapt to various protection schemes and wiring modes.
While the above methods are attractive for the fault diagnosis problem, they fail to make full use of the topology information. As a result, the analysis of the operating logic is performed in units of each single section, and it is complex and time consuming to determinate the relationship between the sections and the protective devices as well as their related paths [29]. Besides, additional variables are needed to represent the uncertainties of the alarm, which may lead to the problems of dimension disaster and contradictory hypothesis.
To this end, a novel analytic method for power system fault diagnosis employing topology description is proposed in this paper. According to the network structure, the topology descriptions of the system, sections and protective devices are established based on the incident matrix, and the mapping relationship between the protective devices and the sections is analyzed using matrix operations. In this way, the expected states of protective devices as well as the objective function can be established in matrix form. Finally, the genetic algorithm is used to solve the programing problem in the part of case studies, and the testing results demonstrate the effectiveness and fault tolerance of the proposed method. The following three aspects are the major features of this work.
(1)
Based on the incident matrix, the topology description of the power system is established to represent the correlation between the sections and the protective devices, and the expected states of the protection devices can be analyzed by simple matrix operations.
(2)
Considering both the operating logic error and the communication error of the protective devices, the improved objective function of the analytic model is constructed, which can adapt to power systems with different structure or connections.
(3)
The optimized solution can distinguish the true hypothesis from the false ones with better fault tolerance, and the diagnosis result is helpful to evaluate the abnormal operation of protective device and the communication error of alarm signals.

2. Topology Analyses of Power System

The protection is the first defending line for power system security. If a fault occurs in the power system, the protection will detect the fault by measuring relative electrical quantities, and then trip off the circuit breakers, thus to remove the fault section from the system. Therefore, there is a fixed correspondence between the sections and the protective devices, and the topology description of the power system is of great significance to the analysis of the protection logic.

2.1. Topology Description of Power System

Taking a simple power system with four buses and four transmission lines as an example, the power network and the protection configuration are shown in Figure 1, where the transmission lines are equipped with main protection (m), primary backup protection (p) and secondary backup protection (s), and the buses are equipped with main protection (m). For example, the protection L1Am represent the main protection of line L1 at the bus A side. The detailed operating principle of the protections can be found in [18,34].
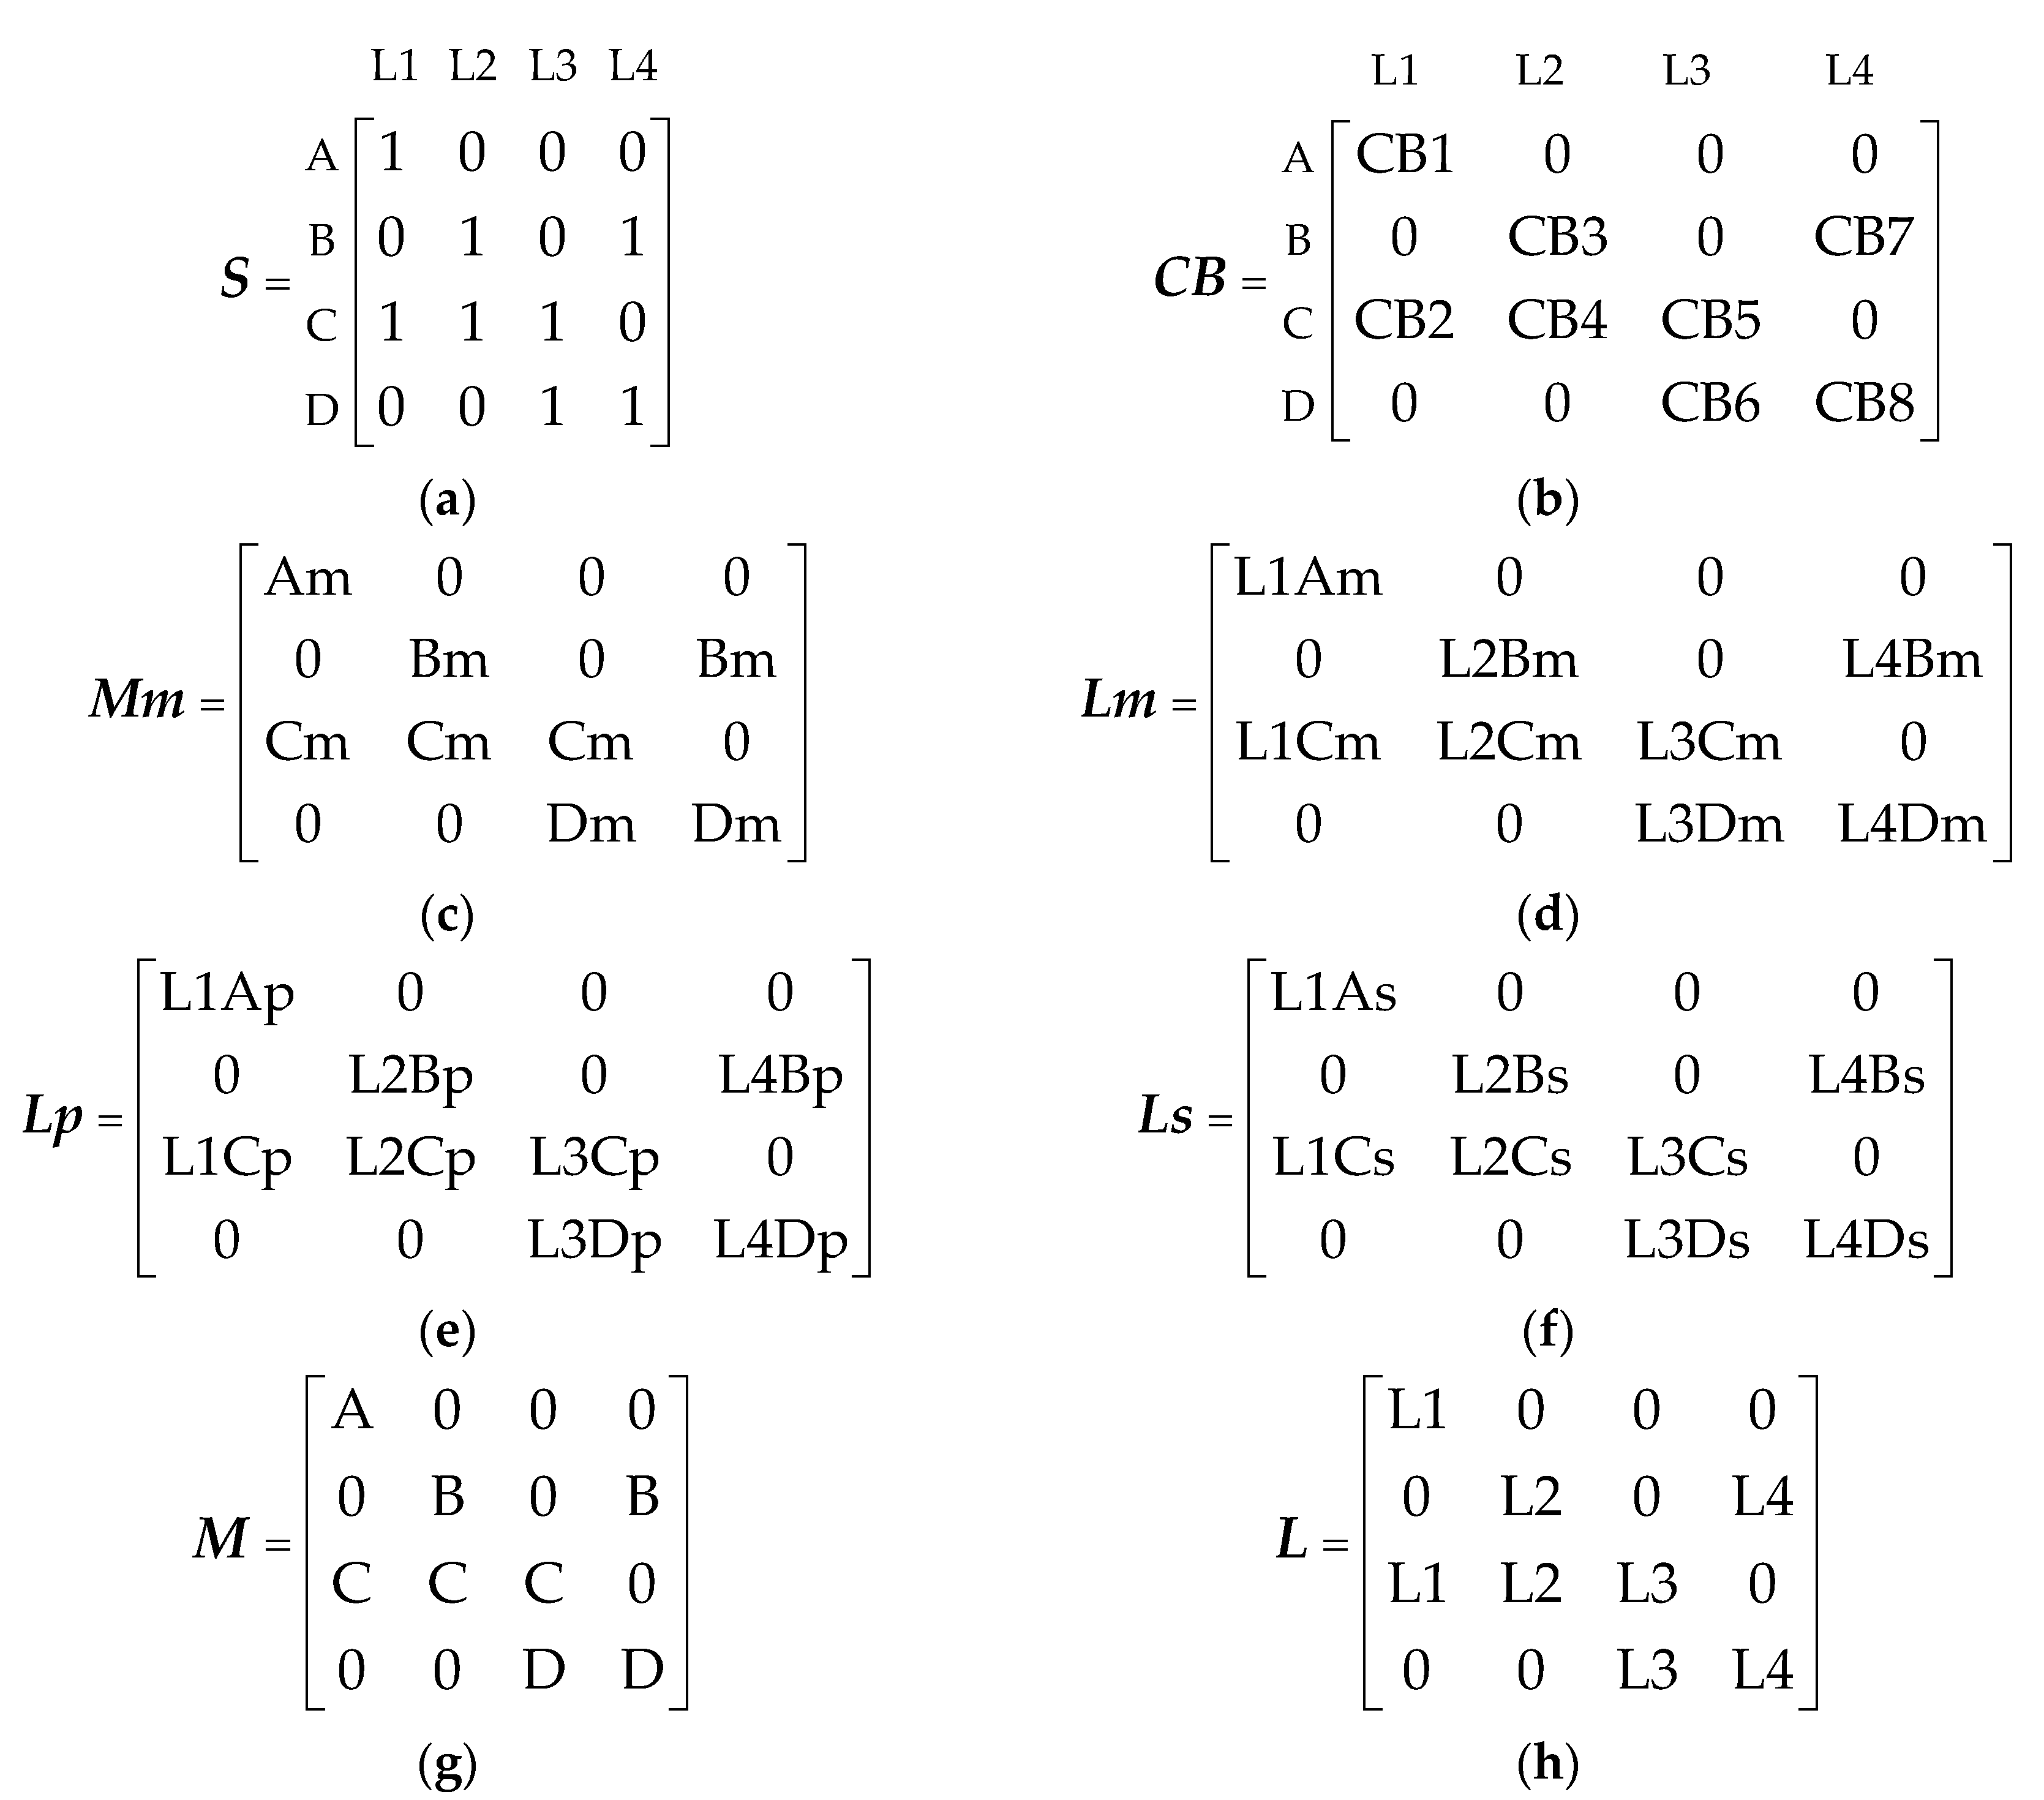
According to the power network theory, a system with m buses and n lines can be described by an m × n dimensional incident matrix, and the non-zeros of the matrix represent the connection between the buses and lines. For the system in Figure 1, the incident matrix is shown in Figure 2a.
From Figure 1, it is obviously that the location of the protective devices is related to the system topology. For instance, the buses and lines are connected by circuit breakers, if the non-zeros of the incident matrix are replaced with the corresponding circuit breakers, the topology matrix of the circuit breaker can be obtained, as shown in Figure 2b.
Similarly, the protections are equipped to trip off corresponding circuit breakers, and thus they have direct correspondence in location. Therefore, the topology description of different kinds of protections can be obtained by replacing the non-zeros of the circuit breaker matrix with the corresponding relays, as shown in Figure 2c–f.
In order to establish the mapping relationship between the sections and the protective devices, the topology description of the buses and transmission lines is constructed according to their outlet connections, which can be obtained based on the incident matrix, as shown in Equations (1) and (2).
M = Diag { M 1 , , M m } × S
L = S × Diag { L 1 , , L n } ,
where the “Diag” operation generates a k × k dimensional diagonal matrix which uses k × 1 vectors as the diagonal elements. For the sample system, the topology matrices of the buses and transmission lines are shown in Figure 2g–h.
Note that the denotations of the sections and the protective devices are used to represent their state variables in the topology description, and the value can be 0 or 1. For example, the value 1 represents the operation of the protective device or the fault state of the section; while the value 0 means the protective device doesn’t operate or the section is normal.

2.2. Expected States of the Protective Devices

Considering that the main protection and primary backup protection are both local protection, their expected states are directly related to the local section. Besides, the expected state of the circuit breaker is determined by the corresponding protections. Therefore, the expected states of the main protection, primary backup protection and the circuit breaker can be directly determined by Equations (3)–(6).
L m * = L
M m * = M
L p * = L L m ¯
C B * = L m L p L s M m ,
where the superscript “ * ” represents the expected state of the topology matrices, “ ” represents the element-by-element multiplication between matrices, “ ” denotes the logical element-by-element “or” operation of matrices, and the logical “not” operation of matrix is represented by overline. As the zeros in S are physically meaningless, the “not” operation is implemented by subtraction in this paper, such as L m ¯ = S L m .
The Equations (3) and (4) represent that if a fault occurs on the line or the bus, then the corresponding main protection should operate. Similarly, the Equation (5) means that if a fault occurs on the line but the local main protection fails to operate, then the primary backup protection should operate. The Equation (6) means that the circuit breaker should trip off if one of the corresponding protections operates.
Specially, the expected state of the secondary backup protection is determined not only by the local line, but also by the protected bus at the end of the line and the adjacent lines. Therefore, it should be separately analyzed according to the protected object.
(1) Protecting the local line: Ls1
If the fault occurs on the local line, but the corresponding main protection and primary backup protection both fail to remove the fault, then the secondary backup protection should operate. Therefore, the expected state can be determined as in Equation (7).
L s 1 * = L L m ¯ L p ¯ .
(2) Protecting the bus at the end of the line: Ls2
If the fault occurs on the bus at the end of the line, but the bus protection fails to remove the fault, then the secondary backup protection should operate. However, the topology matrices of the secondary backup protection and the bus do not directly correspond to each other in the protection relationship, the mapping transformation between them should be established.
According to the graph theory, the bus incident matrix SM can be obtained easily by the incident matrix as in Equation (8).
S M = S S T I ,
where “ ” represents the logical multiplication operation, ST is the transpose of S, and the identity matrix I is introduced to remove the self-correlation of the bus. For the sample system shown in Figure 1, the bus incident matrix is
A B C D S M = A B C D [ 0 0 1 0 0 0 1 1 1 1 0 1 0 1 1 0 ]
Obviously, the non-zeros in SM represents the association between adjacent buses, it can be used to establish the mapping transformation between the secondary backup protection and the protected bus, therefore the expected state of the protection can be determined as in Equation (9).
L s 2 * = S ( S M × ( M C B ¯ ) ) ,
where the CB represents the related path between the secondary backup protection and the protected bus. The incident matrix S is introduced here to ignore the elements without physical meaning. Taking the first column elements of Ls2* as examples, according to the matrix multiplication rule, the results are
{ L 1 As 2 * = C × CB 2 ¯ L 1 Cs 2 * = A × CB 1 ¯ ,
which mean that if a fault occurs on the bus C, while the breaker CB2 fails to trip off, then the protection L1As should operate; if a fault occurs on the bus A, while the breaker CB1 fails to trip off, then the protection L1Cs should operate. Obviously, the results meet the actual operating logic of the secondary backup protection.
(3) Protecting the adjacent line: Ls3
If the fault occurs on the adjacent line, but the local protections fail to remove the fault, then the secondary backup protection should operate. Similarly, the topology matrices of the secondary backup protection and the line do not directly correspond to each other in the protection relationship.
To perform the mapping transformation, the three-order incident matrix between the bus and line can be calculated according to graph theory, as in (10).
S 3 = S S T S S .
The non-zero in values in S3 indicate that the corresponding bus and line are structurally separated by three circuit breakers, which is the same as the relationship between the secondary backup protection and the protected line. Therefore, the adjacent line matrix can be established by Equation (11), which is similar to Equation (2).
L 3 = S 3 × diag { L 1 , , L n } .
For the sample system, the adjacent line matrix is
S 3 = [ 0 L 2 L 3 0 L 1 0 L 3 0 0 0 0 L 4 L 1 L 2 0 0 ] .
In addition, the related path between the secondary backup protection and the protected adjacent line is constituted by the intermediate circuit breakers [29]. For example, the related path between the L1As and L2 is composed of CB2 and CB4, and the related path between the L1As and L3 is composed of CB2 and CB5. Obviously, the circuit breakers in the related path are all related to the bus at the end of the line, which is the same as the relationship between adjacent lines. Therefore, the related path matrix P can be obtained by applying the transformation of Equation (8) to the circuit break matrix CB, as shown in Equation (12).
P = C B T C B I .
For the sample system, the related path matrix is:
             L 1                           L 2                           L 3                           L 4              P = L 1 L 2 L 3 L 4 [ 0 CB 4 CB 2 CB 5 CB 2 0 CB 2 CB 4 0 CB 5 CB 4 CB 7 CB 3 CB 2 CB 5 CB 4 CB 5 0 CB 8 CB 6 0 CB 3 CB 7 CB 6 CB 8 0 ]
Therefore, if the fault occurs on the adjacent line and the circuit breakers on the related path fail to trip off, then the secondary backup protection is expected to operate, as shown in (13).
L s 3 * = S ( L 3 P ¯ ) .
Taking the first row and first column element of Ls3* as an example, according to the matrix multiplication rule, the result is
L 1 As 3 * = L 2 × CB 2 CB 4 ¯ + L 3 × CB 2 CB 5 ¯ ,
which means that if a fault occurs on L2, while both the breakers CB2 and CB4 fail to trip off, then the protection L1As should operate. Similarly, if a fault occurs on L3, while both the breakers CB2 and CB5 fail to trip off, then the protection L1As should also operate. Therefore, the above mapping transformation can effectively reflect the operating logic of secondary backup protection.
In summary, if one of the above three situations occurs, the secondary backup protection should operate. Therefore, the synthesized expected state of the secondary backup protection is determined by (14).
L s * = L s 1 * L s 2 * L s 3 * .

3. The Analytic Model for Fault Diagnosis Employing Topology Description

The basic idea of the analytic model-based method is to formulate the fault diagnosis problem as a programming problem, and the key task is to establish an objective function that is able to evaluate the numerous fault hypotheses, so as to distinguish the true hypothesis from the false ones.

3.1. Objective Function of the Analytic Model

In the process of troubleshooting and power recovery, the most critical information for the dispatchers is to know where the fault occurred and how the fault was removed by the protection system. Therefore, the states of the sections and the protective devices are chosen as the fault hypothesis in this paper, such as X = {D, R, C}, where D represents the states of the sections, R represents the states of the protections and C represents the states of the circuit breakers.
Given this background, the deviation between the expected state and the actual state of the protective device represents the operating logic error, such as refusal-operation or mal-operation; while the deviation between the alarming state and the actual state characterizes the communication error, such as missing or misreporting of the alarm signals. Combining these two aspects, the objective function of the analytic model is constructed as
min    E ( X ) = w 1 × E 1 ( X ) + w 2 × E 2 ( X ) .
where w1 and w2 are the weight factors, E1(X) represents the index of operating logic error, and E2(X) represents the index of communication error. The specific expressions of the indexes are as given as in Equation (16).
{ E 1 ( X ) = Sum ( | L m L m * | L m P L m S 1 L m S 3 ¯ + | L p L p * | L p S 1 L p S 3 ¯ + | L s L s * |                   + T × ( | M m M m * | M m S 2 ¯ ) + | C B C B * | ) E 2 ( X ) = Sum ( | L m L m a | + | L p L p a | + T × | M m M m a | + | L s L s a | + | C B C B a | ) T = ( diag ( S × 1 n ) ) 1 ,
where the “Sum” operator implements the summation of all elements in the matrix, and the superscript “a” is introduced to indicate the alarming state of the protective devices, if the alarm signal of the protective device is received, then its alarming state is determined as 1; otherwise it is determined as 0. The intermediate variable T is introduced to merge the influence of the bus protection since it is decomposed in the topology description. 1n represents the n×1 dimensional vectors with all elements equal to 1.
Actually, the objective function in Equation (15) is established to evaluate the matching degree between the fault hypothesis and actual fault scenario. The closer the fault hypothesis is to the actual fault scenario, the smaller the objective function. It should be noted that the cooperative relationship between the protections is considered in the index of operating logic error, which is described in the form of corrective matrices, such as the LmP, LmS1, LpS1, MmS2, LmS3, LpS3 which appeared in Equation (16). The specific meaning of the corrective matrices and their calculating method will be given in the next part.
Since the cooperative relationship between the protections are introduced into the logic error index, the inner logical constraint of the index is stronger than the communication error index. Therefore, the w1 should be set greater than w2, and in this paper they are set to be 0.6 and 0.4 respectively. A large number of tests show that the parameters can obtain satisfying results.

3.2. Determination of the Corrective Matrices

Since the main protection and primary backup protection have the same protecting range, the operation of the primary backup protection can be used to correct the discrepancy caused by the main protection, as shown in Equation (17). Similarly, if the secondary backup protection is triggered by a fault on the local line, then its corrective matrices for the main protection and the primary backup protection can be determined as in Equation (18).
L m P = L p L p * ,
L m S 1 = L p S 1 = L s L s 1 * .
Noted that in Equations (17) and (18), the variable’s meaning is indicated by the subscript. For instance, LmP represents the corrective matrix between the primary backup protection (p) and the line main protection (m), and LmS1 represents the corrective matrix between the secondary backup protection (S1) and the line main protection (m).
If the secondary backup protection is triggered by a fault on the bus at the end of the line, then its operation shall be considered to correct the corresponding bus protection. Since the mapping relationship here is the same as in Equation (9), the corrective matrix can be determined as in Equation (19).
M m S 2 = S ( S M × ( L s L s 2 * ) ) .
Similarly, if the secondary backup protection is triggered by a fault on the adjacent line, then its operation shall be considered to correct the local protections of the faulted line. According to the topology description, the mapping transformation between the protection and the protected adjacent lines can be divided into the following two steps: (1) mapping to bus at the end of the line, and (2) mapping to the adjacent lines. Obviously, the first step of the mapping transformation is the same as in Equation (19), and could be expressed as in Equation (20).
L s 31 = S ( S M × ( L s L s 3 * ) ) .
In order to perform the second step of the transformation, the line incident matrix is required. Similar to Equation (8), the line incident matrix can be obtained by the incident matrix S, as shown in Equation (21).
S L = S T S I .
For the sample system, the result is:
L 1   L 2   L 3   L 4 S L = L 1 L 2 L 3 L 4 [ 0 1 1 0 1 0 1 1 1 1 0 1 0 1 1 0 ]
The non-zeros in SL represent the association between adjacent lines, and thus can be used to perform the second step of the mapping transformation as Equation (22).
L s 32 = S ( L s 31 × S L ) .
When protecting the adjacent lines, one secondary backup protection may protect multiple downstream lines, and one line may also be protected by many protections locate on the upstream lines. Therefore, the same mapping transformation is applied to the incident matrix S to determine the number of backup protections.
N s = S ( S × S L ) .
Finally, the corrective matrices between the main protection and the primary backup protection of the adjacent lines can be determined by Equation (24).
L m S 3 = L p S 3 = S ( L s 32 © N s ) ,
where the “©” operation performs the element by element comparisons between matrices.

3.3. Adaptability to Special Sections and Connection Modes

The above modeling process is described primarily for the lines and buses. In fact, for the other kinds of power sections, such as the generator and the transformer, their protection configuration is similar to the line, that is, the main protection and the primary backup protection are equipped to protect the section itself, while the secondary backup protection operates to remove the fault on the adjacent section. Therefore, they can be thought as the line in the process of modeling (the generator can be considered as a single-ended line).
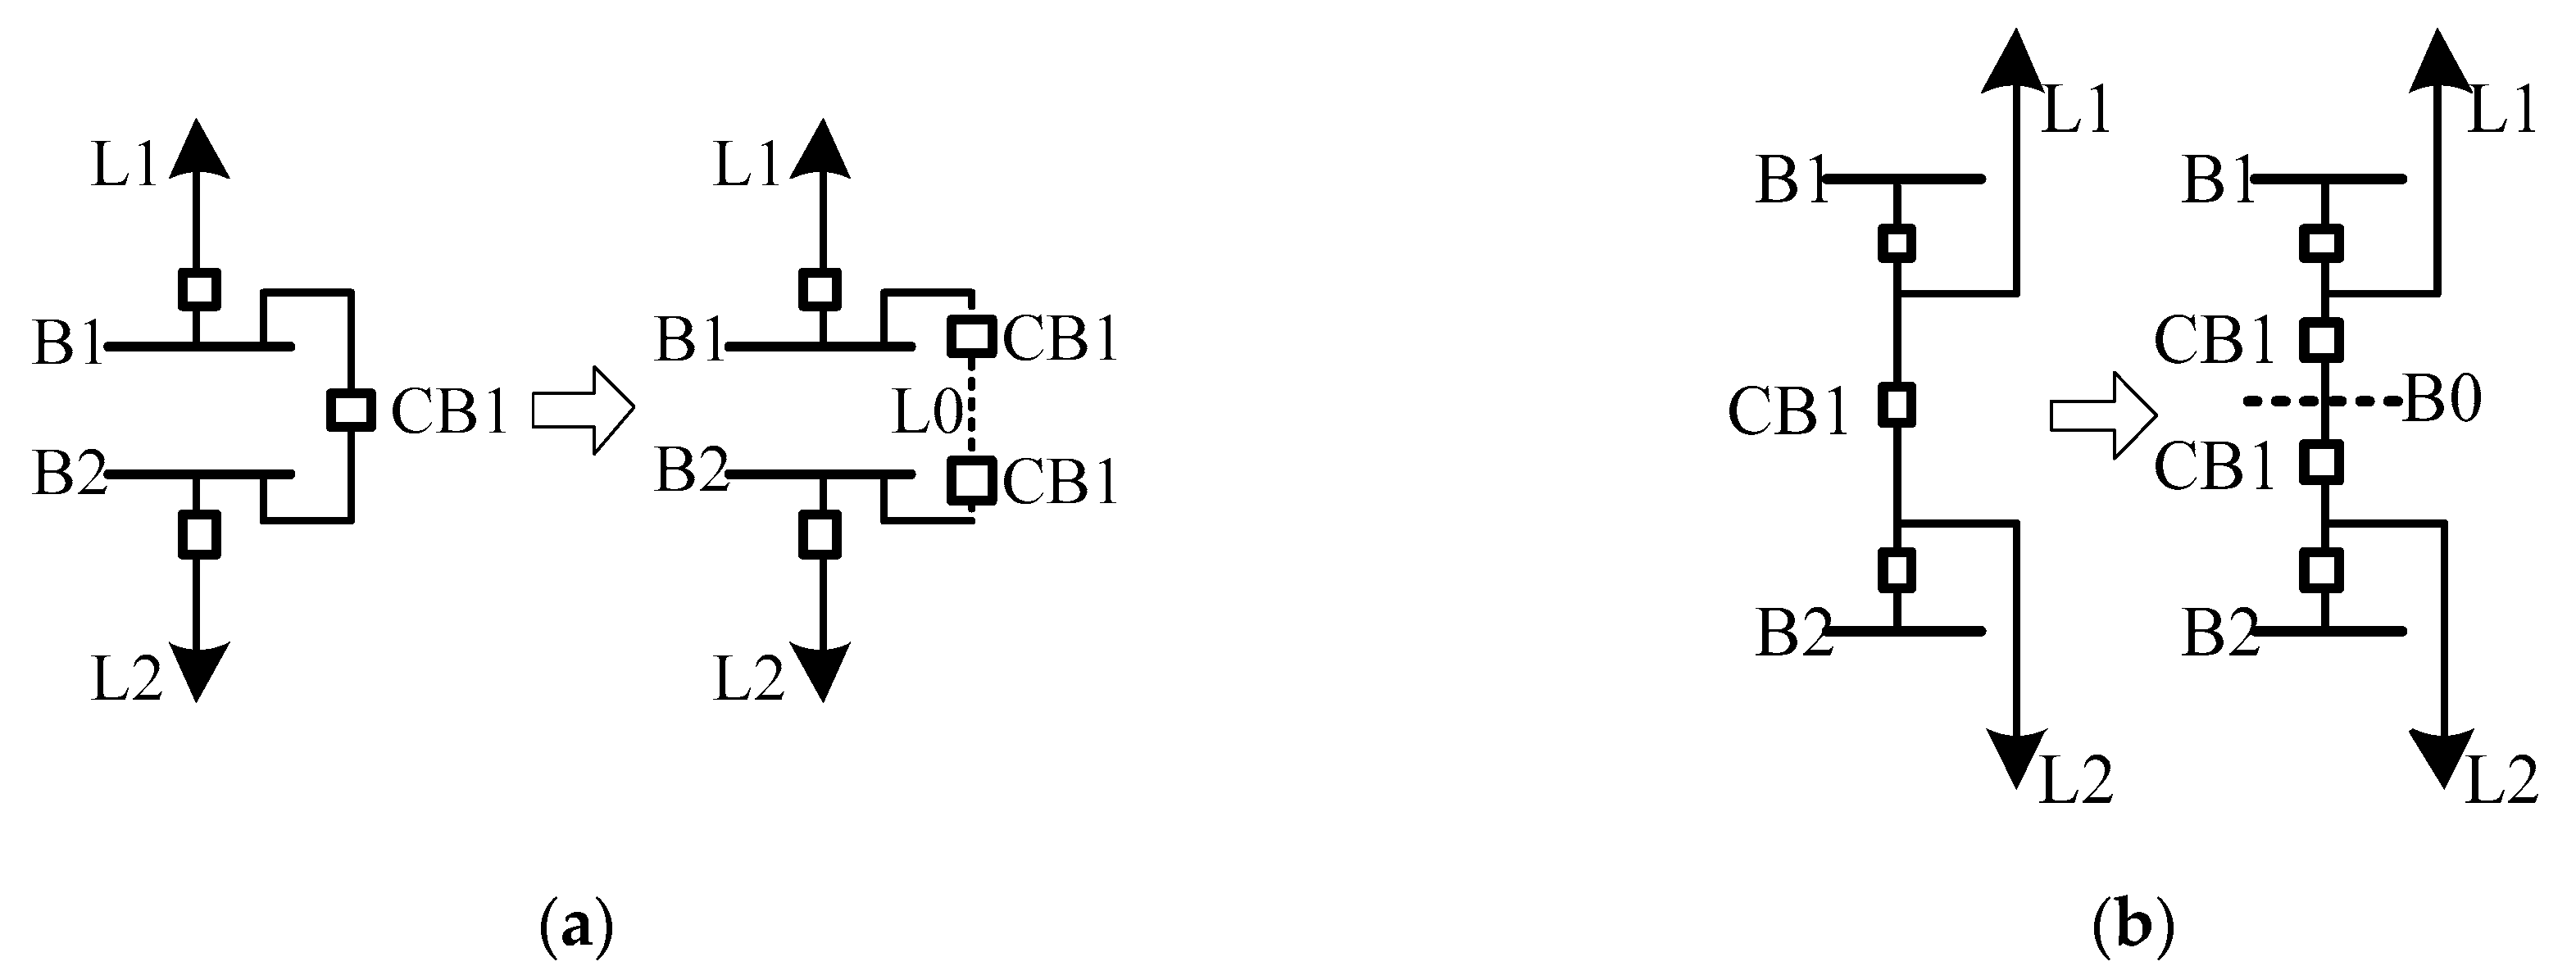
On the other hand, if the power grid is in 3/2 wiring mode or double-bus mode, it is difficult to describe the topology structure directly by the incident matrix. To this end, the “virtual line” and “virtual bus” can be introduced for topology modeling according to the special connection, such as the L0 and B0 shown in Figure 3.
It should be noted that there are no protections equipped for the virtual line and the virtual bus. In this way, it only needs to extend the incident matrix by one column or one row, the topology description of the 3/2 wiring mode or double-bus mode can be realized, and there is no need to make big adjustments to the construction of the objective function.
In summary, all the calculation of the expected state matrices, corrective matrices and the objective functions are carried out based on the topology description, and the relationship between the sections and the protective devices are analyzed by simple matrix operations. Therefore, the objective function of the diagnosis problem can be easily generated online, which avoids the complex process of traversal search.

3.4. Framework of the Fault Diagnosis Method

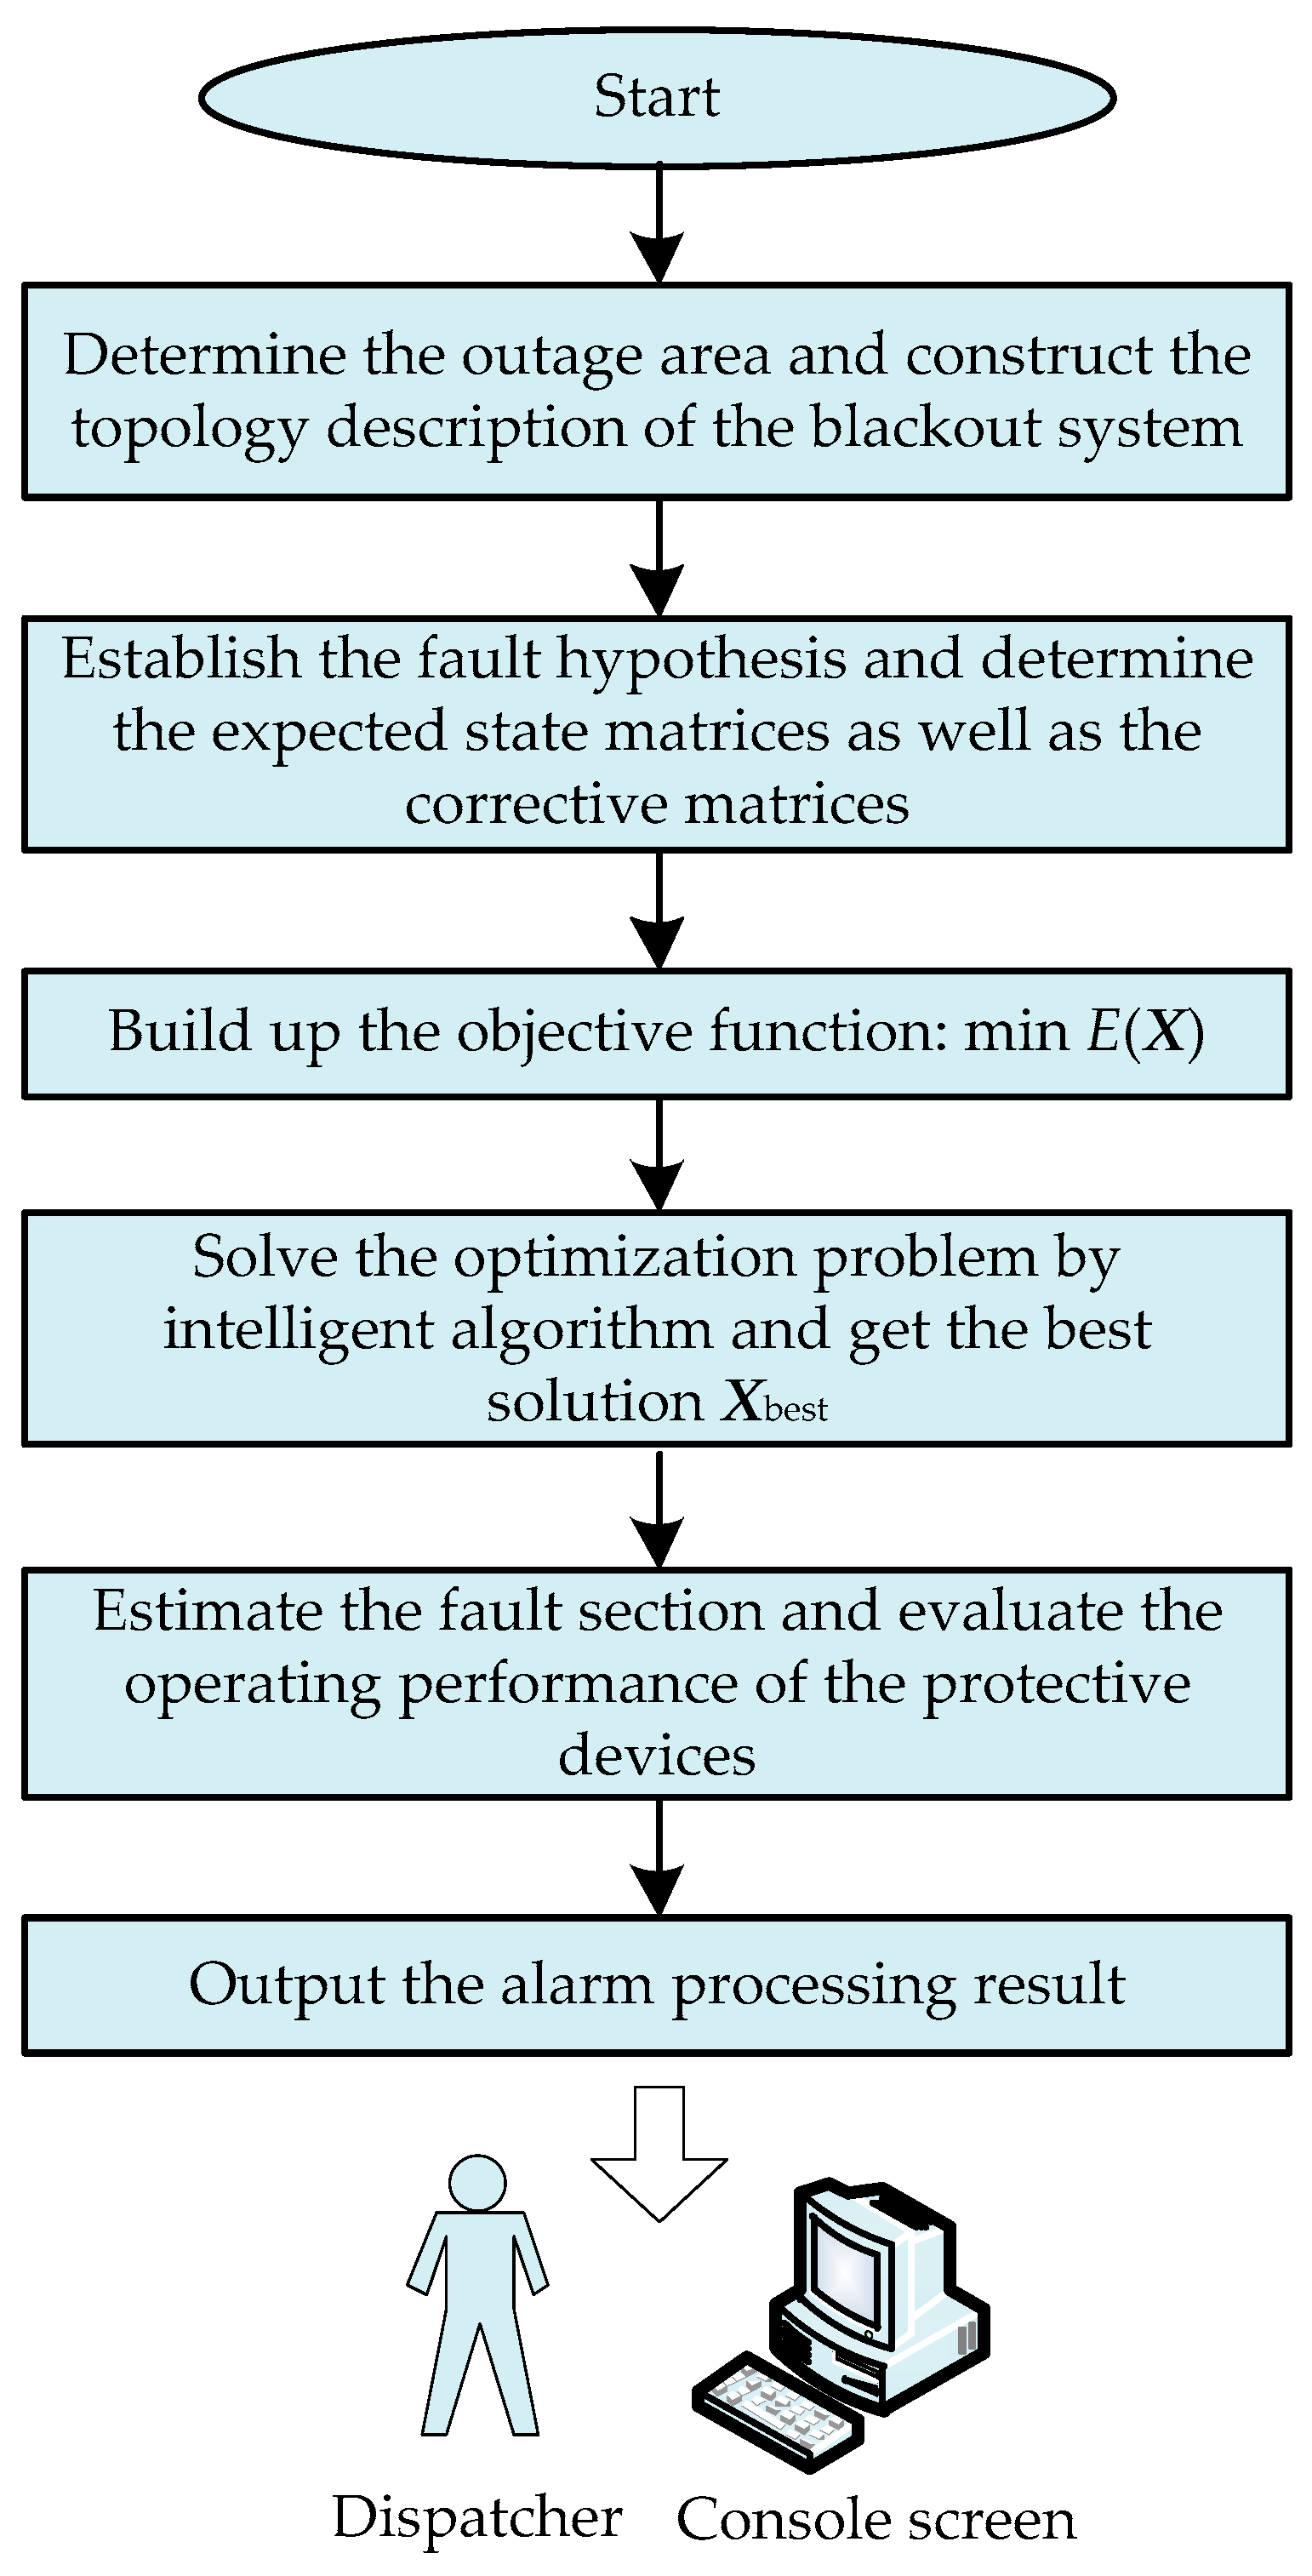
The framework of the proposed fault diagnosis method is shown in Figure 4. When a fault occurs in the power system, the outage area can be firstly determined according to the switch states. Under this situation, it only needs to establish the diagnosis model for the outage area, and therefore the diagnosis performance is independent with the system scale.
Besides, the system only needs to communicate with the SCADA system, and the expected states of the protective devices as well as the objective function can be quickly established by simple matrix operations. The programming problem is then solved by an intelligent algorithm, and, based on the best solution the actual fault section can be estimated and the operating performance of the protective devices can be evaluated. The summarized and synthesized information is finally sent to the dispatcher for decision making.
In this paper, a genetic algorithm is chosen to solve the programming problem, and the number of the population is set to be 30; the roulette wheel selection is chosen to update the population in the selection process, and the selection ratio is 0.9. In order to increase the diversity of the population, the one-point crossover is selected to recombine the population with a probability of 0.7, and the mutation probability of the chromosome is set to be 0.7/l, where l is the length of chromosome. Considering that the probability of communication errors is relatively small, the states of the protective devices in each chromosome (corresponding to the fault hypothesis) are initialized by randomly mutating 1~3 bits on the basis of the alarming states, thus speeding up the convergence of the algorithm.

4. Case Studies

In this part, the IEEE 14-bus power system and a typical four-zone power system were selected to perform the case studies.

4.1. Test System #1

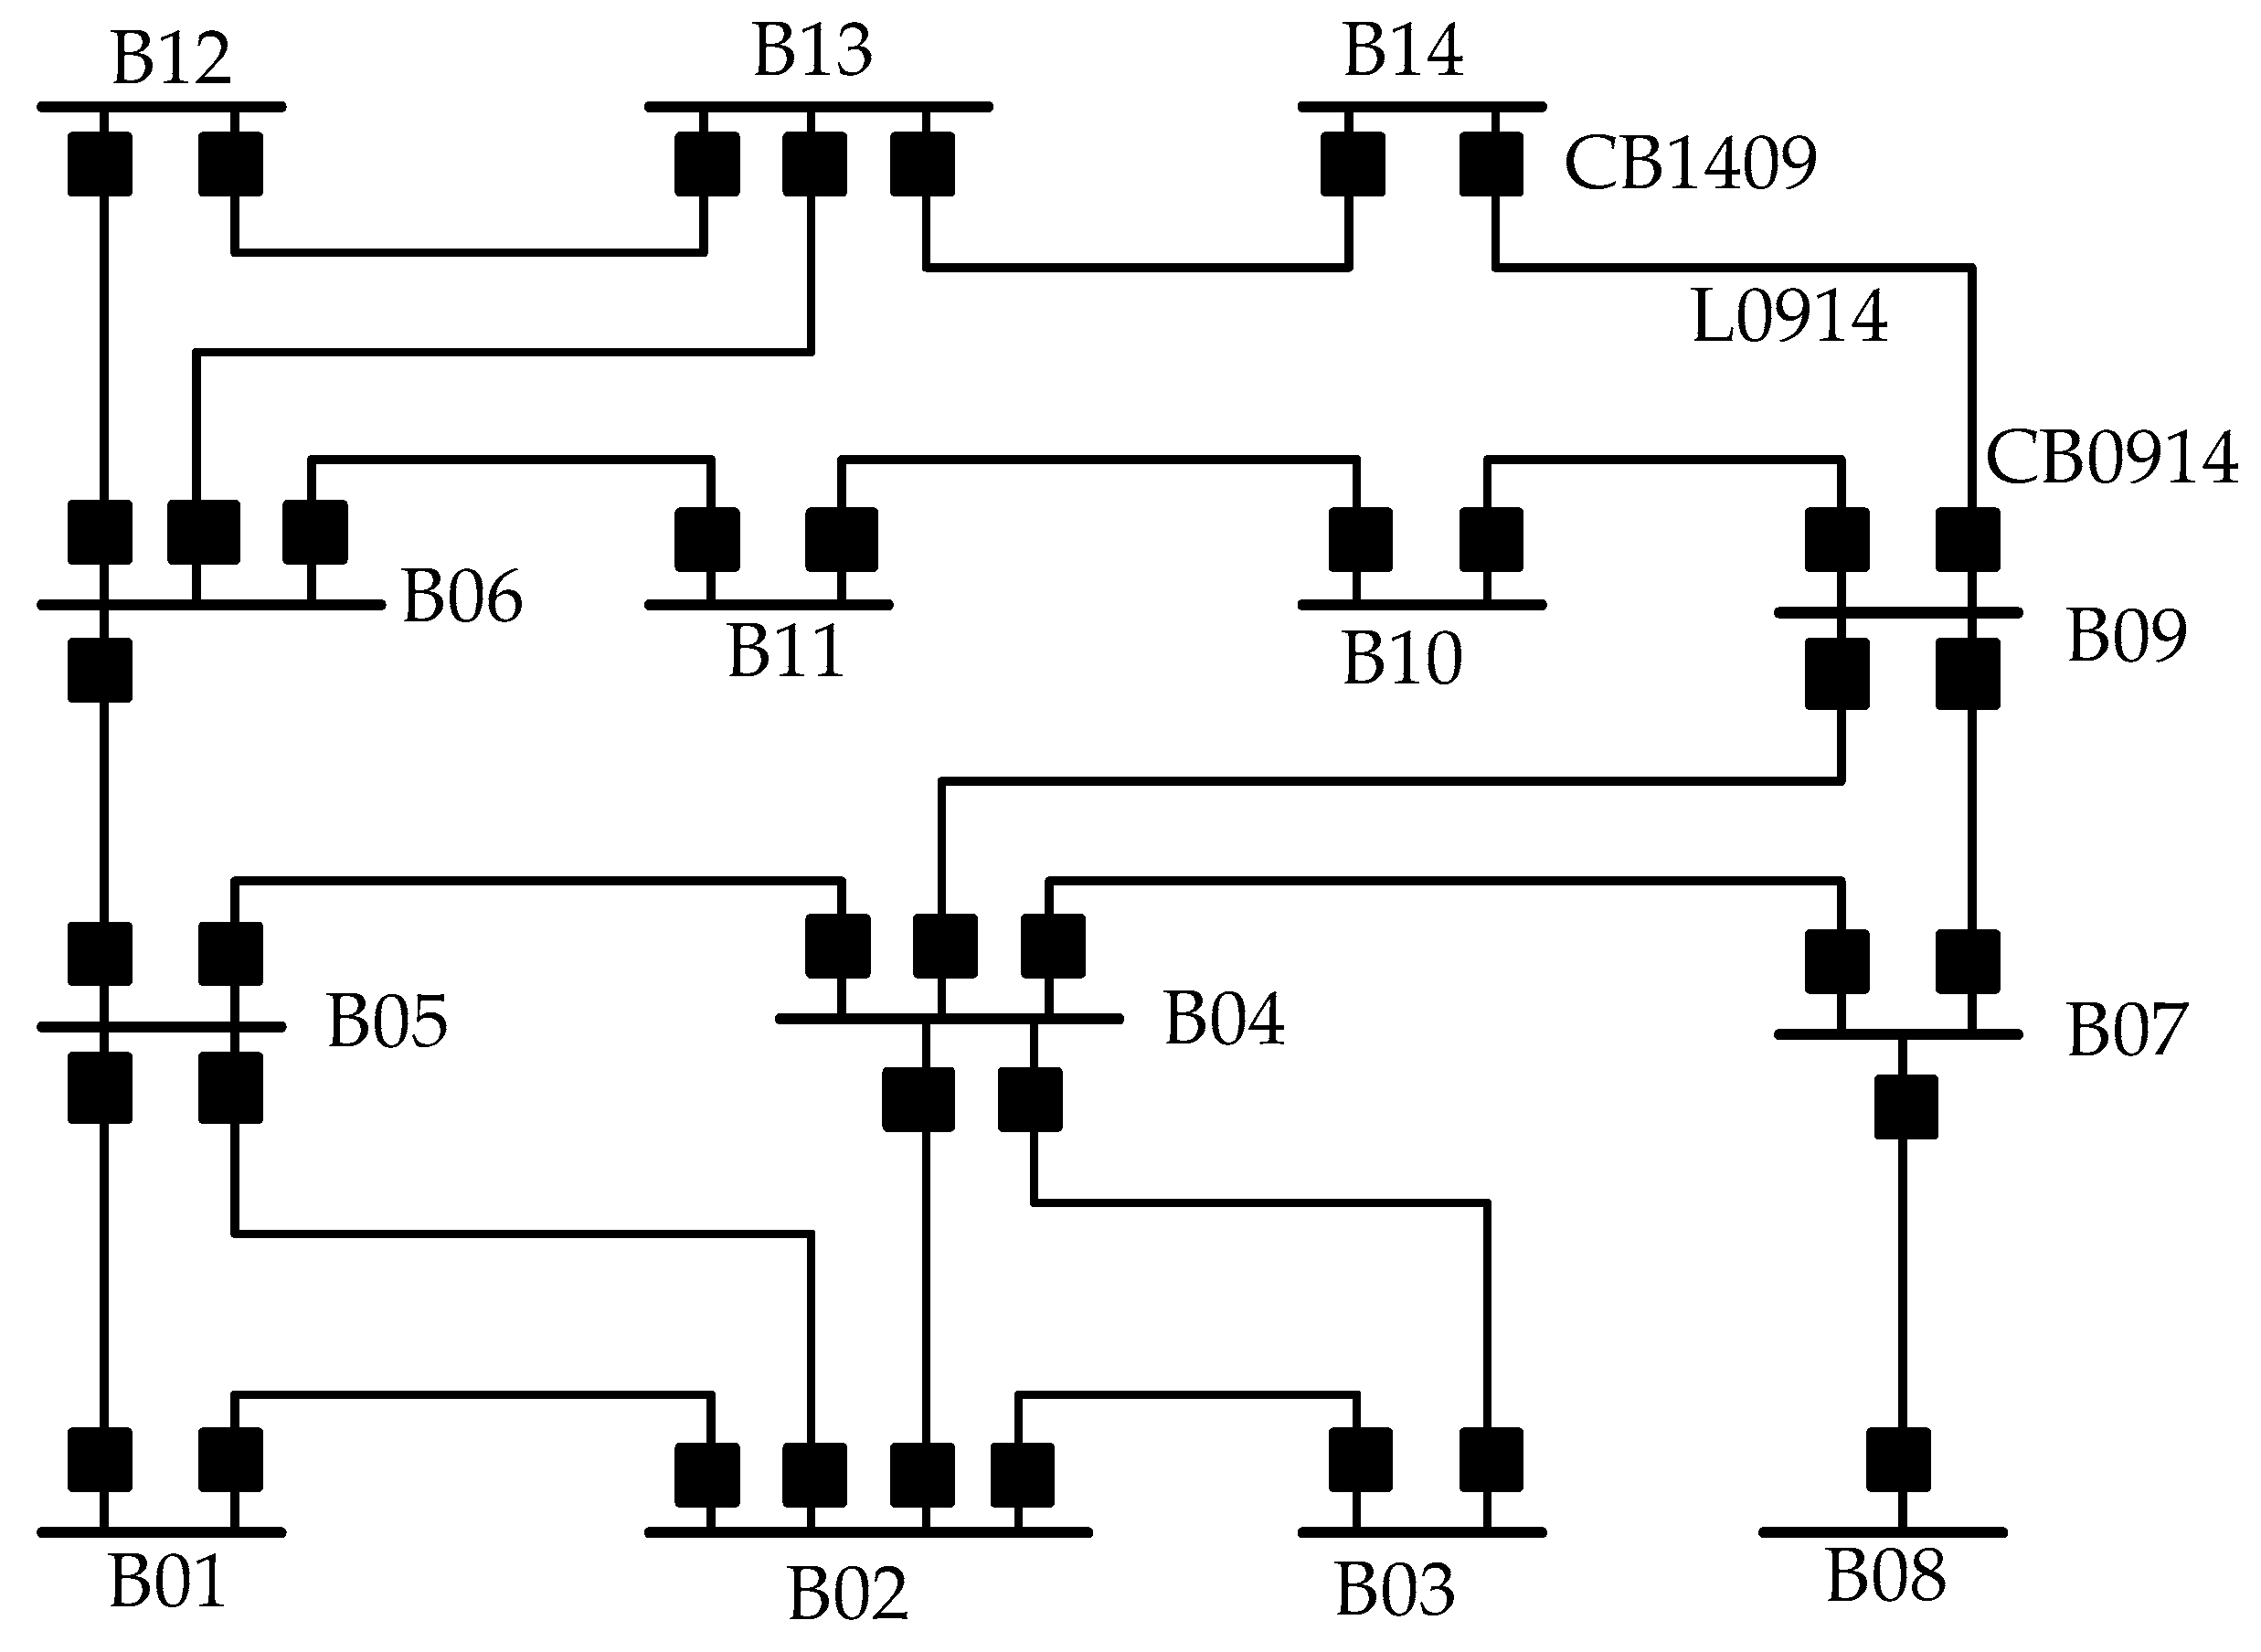
The IEEE 14-bus system shown in Figure 5 was first selected to illustrate the effectiveness of the method. This system contained 14 buses, 20 lines and 40 circuit breakers, and for easy of description, the sections and the protective devices were numbered according to the bus number. For example, the line connected with bus B09 and B14 was denoted as L0914, the circuit breaker near B09 was denoted as CB0914, and the circuit breaker in the other side was denoted as CB1409. Since the protection configuration is consistent with Figure 1, the modeling process was the same as the sample system except that the dimension of the topology matrices changes from 4 × 4 to 14 × 20.
A large number of cases were tested by the proposed method, and some of the testing results are listed in Table 1, where the cases 1 and 2 represent single fault scenarios with complete alarms. The case 3 represents a multi-fault scenario with complete alarms. Case 4 and 5 were multi-fault scenarios accompanied with abnormal operation of the protective devices, and case 6 further simulated the impact of information errors.
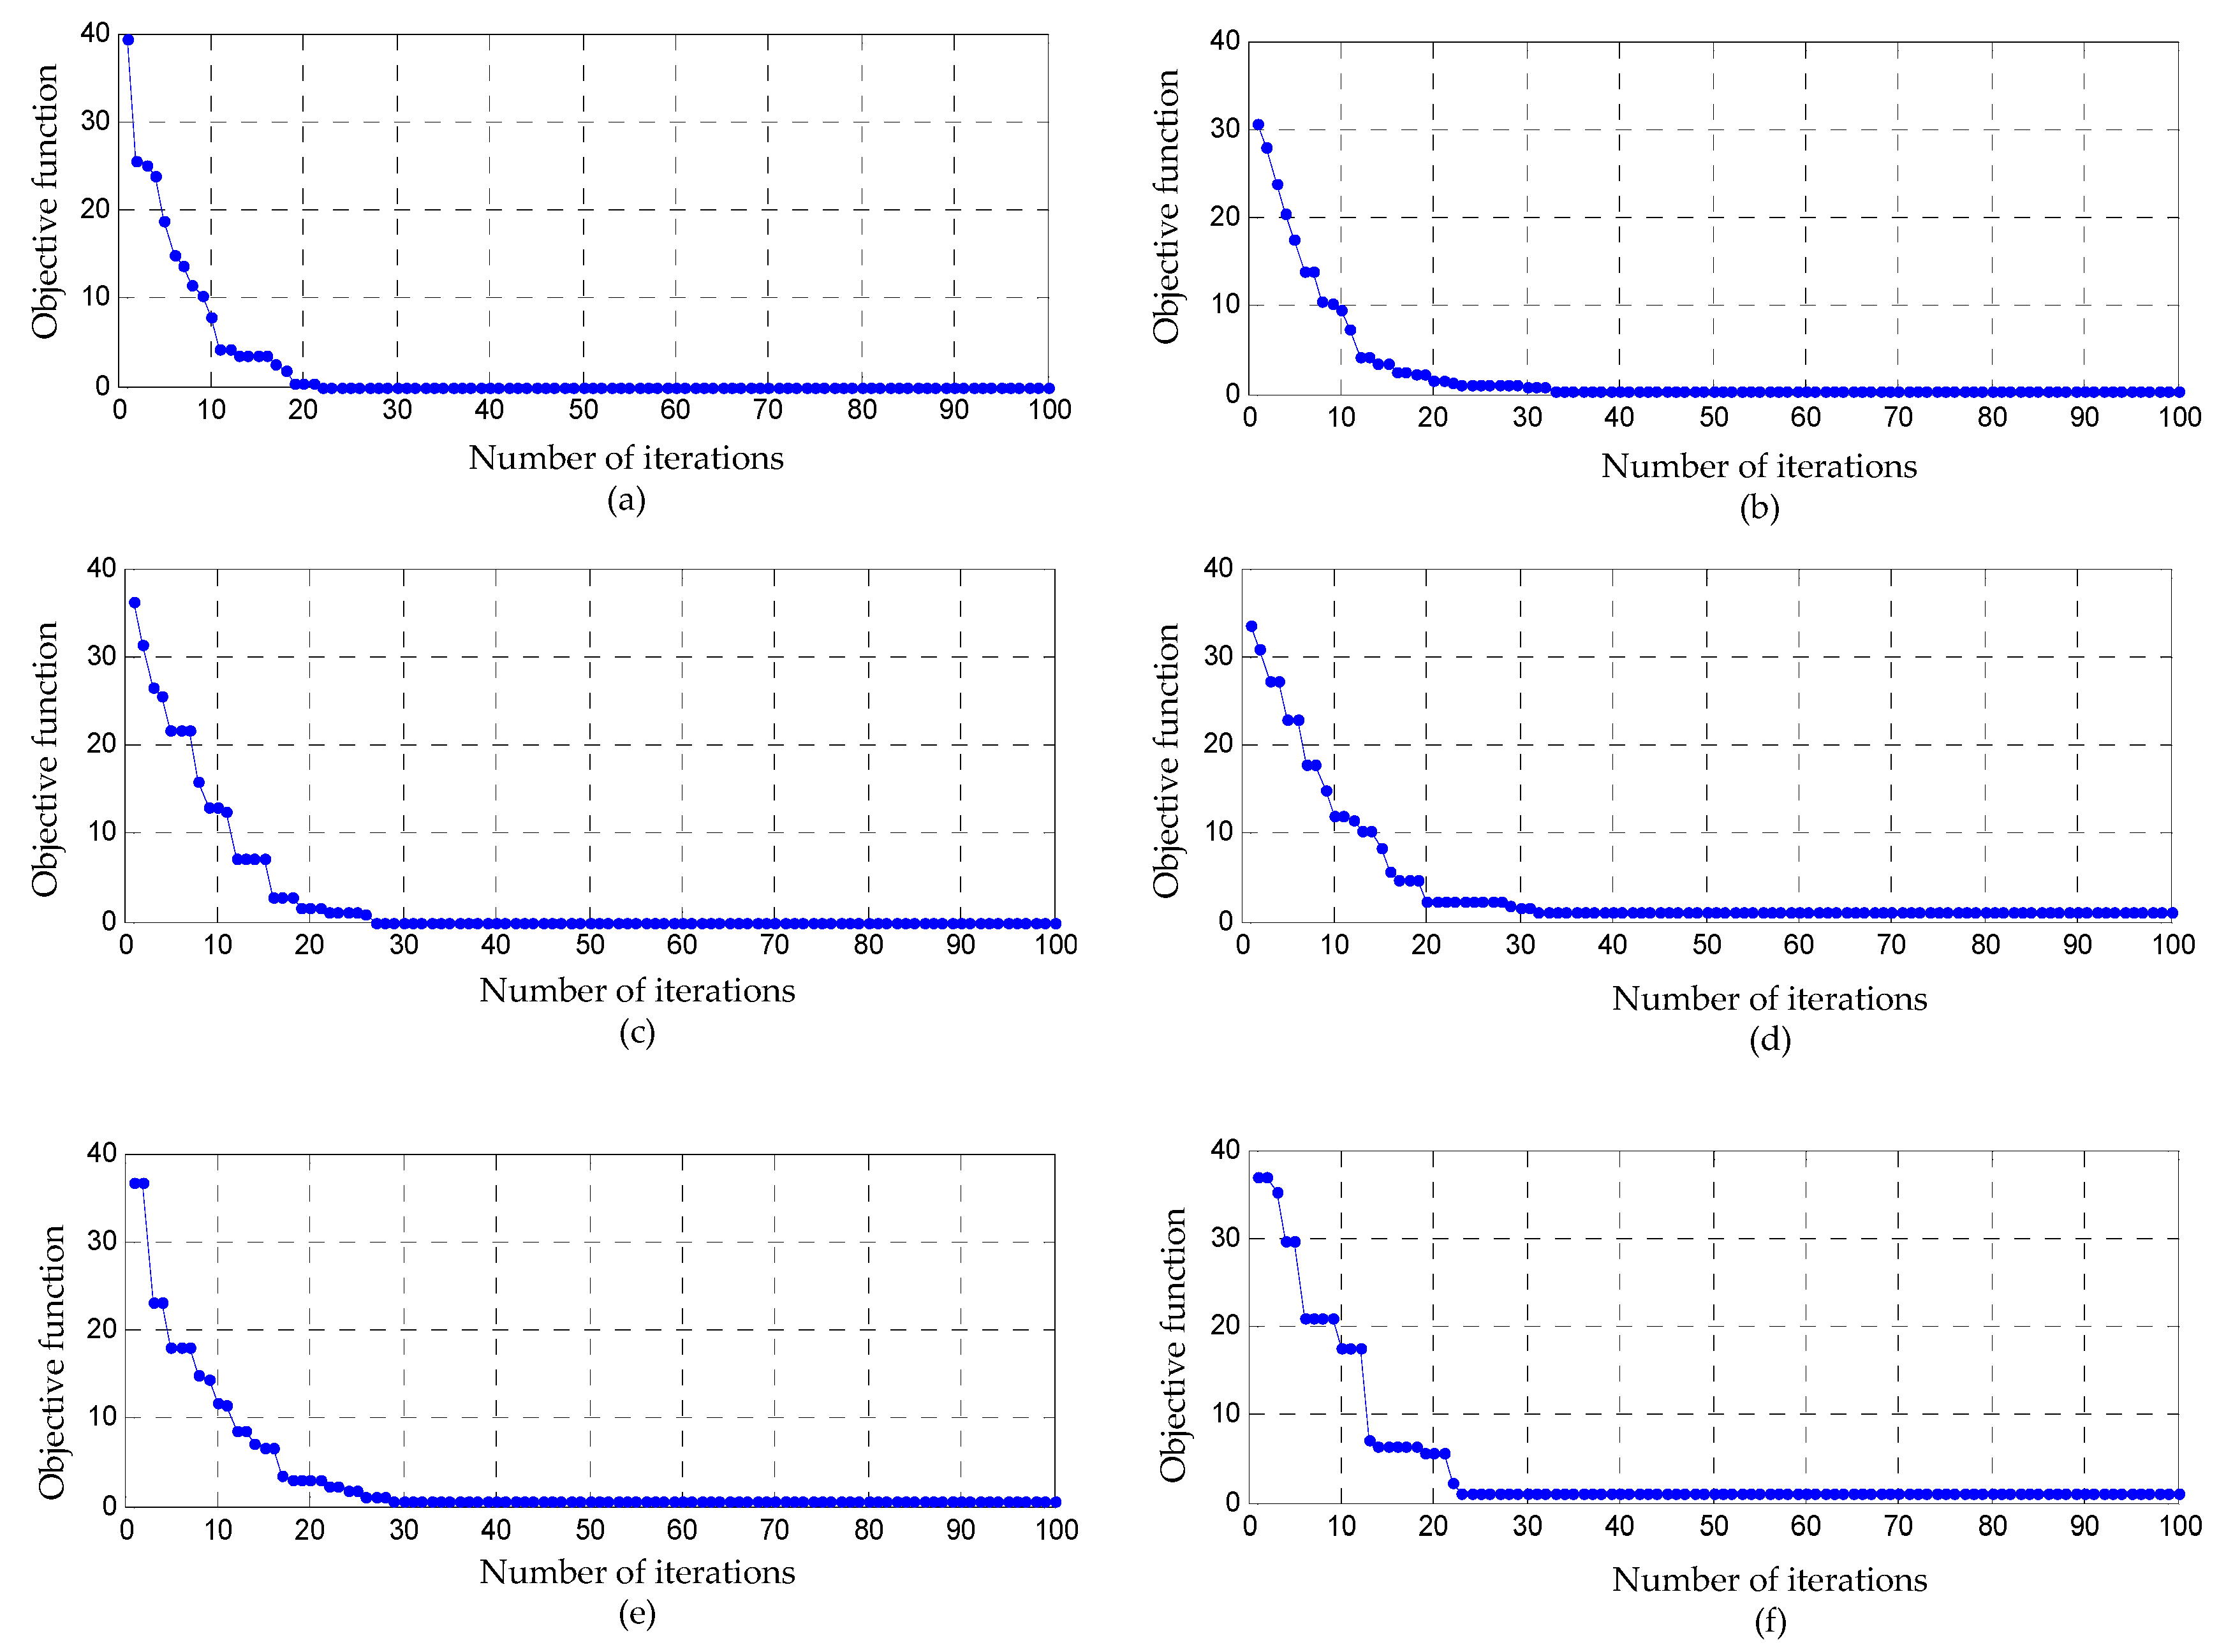
The convergence graphs of genetic algorithms for the cases are shown in Figure 6. Since the states of the protective devices in each chromosome were initialized by randomly mutating 1~3 bits on the basis of the alarming states, the increase in dimensionality of the chromosome had little impact on the time-complexity of achieving optimized solution, and the genetic algorithm can converge to the optimal solution in the first 50 iterations for all the fault scenarios. The detailed fault diagnosis results are shown in the Table 1. Form Table 1, it is clear that fault diagnosis result can effectively explain the received alarms for both simple and complex fault scenarios, which demonstrates the correctness and effectiveness of the proposed method preliminary.

4.2. Test System 2

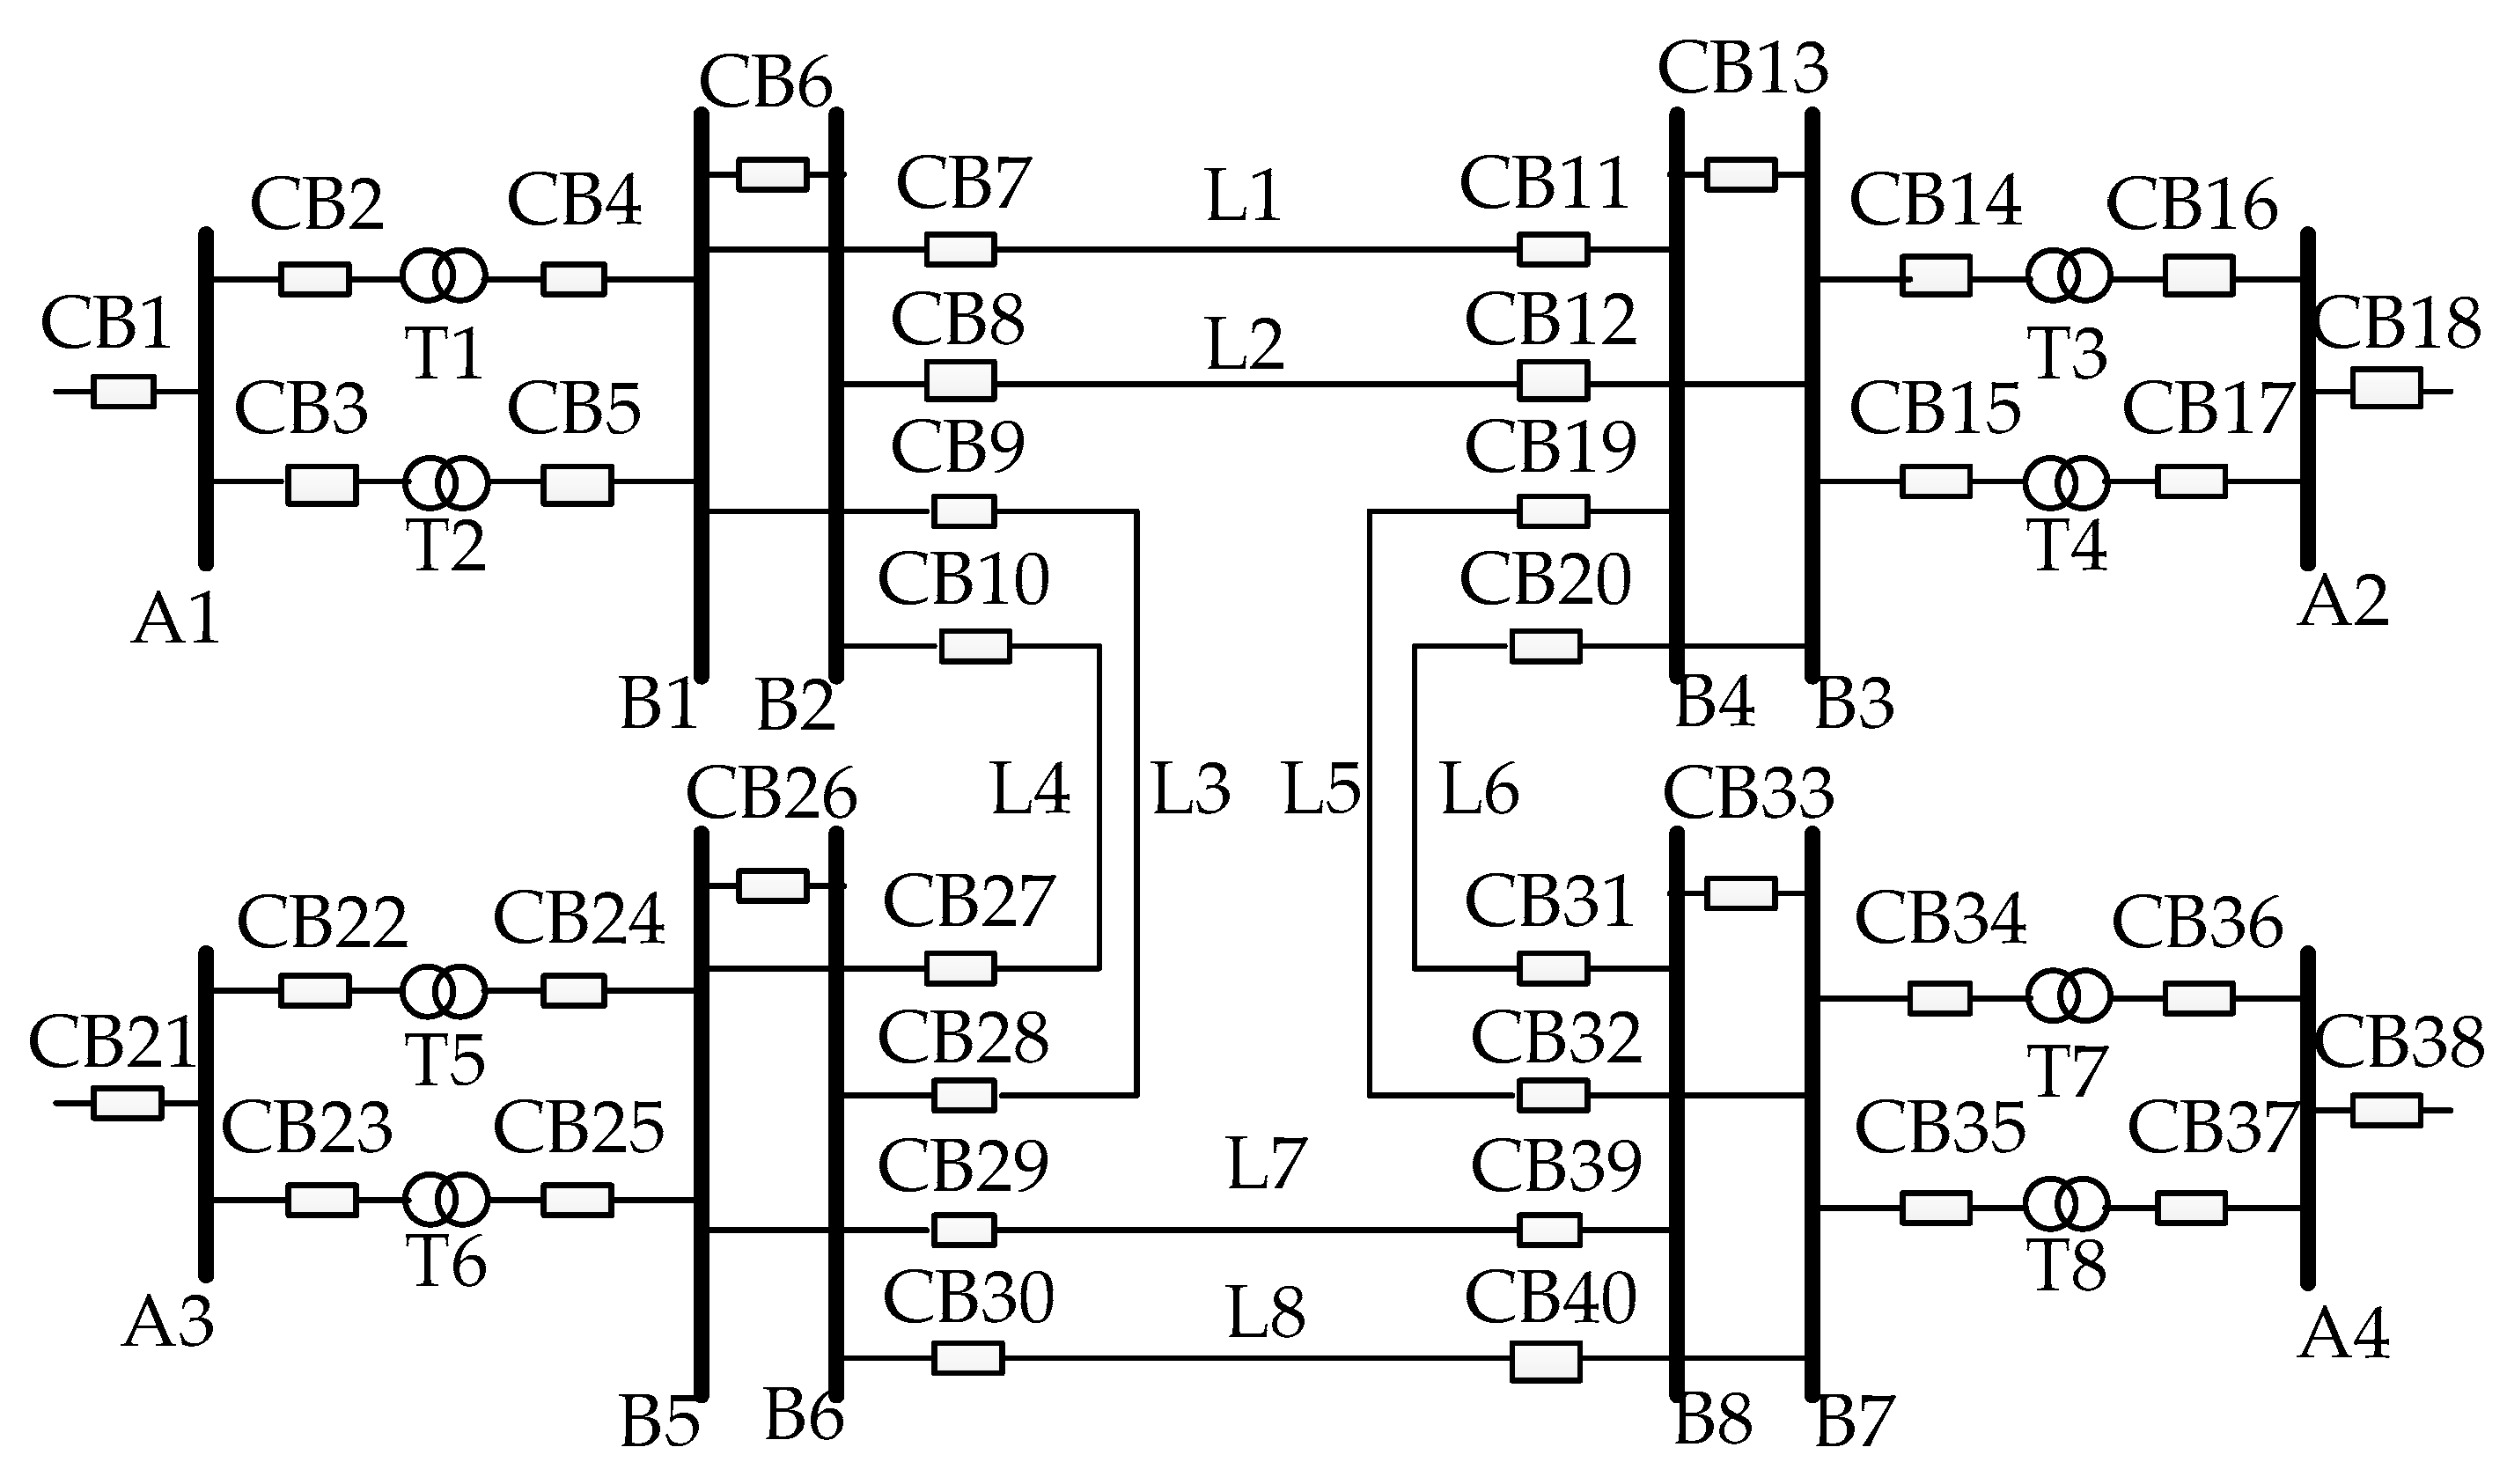
To further verify the effectiveness of the proposed method, the typical four-zone power system shown in Figure 7 [15] was also chosen to perform the case studies. The system consists of 12 buses, 8 lines, 8 transformers, and 40 circuit breakers. The protection configuration was similar with Figure 1, and the detailed protecting principle can be found in [15]. To describe the protections, the denotation “S” was used to represent the sending end of the line, which means the left or the upper side in Figure 7; similarly, the denotation “R” was used to represent the receiving end of the line, which means the right or the lower side. For example, the protection L2Rs represents the secondary backup protection at the receiving end of L2.
Considering that four virtual lines should be introduced to establish the topology description, the dimension of the incident matrices was determined as 12 × 20, and the topology modeling process was exactly the same as the sample system mentioned above.
Some of the tested scenarios are listed in Table 2, where cases 1 and 2 simulated the single-fault and multi-fault scenarios with malfunction of the protective devices. Furthermore, cases 3–6 are used to simulate the complex fault scenarios with both the malfunction of the protective devices and the error alarm signals. Taking case 1 in Table 2 as an example, the detailed process of fault diagnosis is illustrated as follows.
According to the received alarms, the set of candidate sections in the outage area can be determined as {B1, B2, L2, L4}, which is expressed as D = {d1, …, d4}. Correspondingly, it can be further analyzed that there are 26 protections and 21 circuit breakers associated with the candidate sections, which can be expressed as R = {B1m, B2m, L2Sm, L2Rm, L4Sm, L4Rm, L2Sp, L2Rp, L4Sp, L4Rp, T1Ss, T2Ss, L1Rs, L3Rs, L2Rs, L4Rs, T3Rs, T4Rs, L1Ss, L5Rs, L6Rs, T5Ss, T6Ss, L3Ss, L7Rs, L8Rs} = {r1,…, r26} and C = {CB4, CB5, CB6, CB7, CB8, CB9, CB10, CB12, CB27, CB2, CB3, CB11, CB28, CB16, CB17, CB31, CB32, CB22, CB23, CB39, CB40} = {c1,…, c21}, respectively. Since the alarm of L7Sm has no association with the candidate sections, it is judged to be mal-operated device.
According to the aforementioned analysis, the fault hypothesis can be established as X = {D, R, C} = {d1~d4, r1~r26, c1~c21}. Substituting the element in X into the topology matrices, and the objective function can be established according to Equations (15) and (16). Finally, the optimization problem was solved by the genetic algorithm, which can converge in the first 100 iterations, and the best solution is
X b e s t = { 1 B 1 000 1 B 1 m 0000000000000 11 L 2 Rs , L 4 Rs 0000000000 11 CB 4 , CB 5 0 CB 6 1 CB 7 0 1 CB 9 0 11 CB 12 , CB 27 000000000000 }
According to the best solution, it can be analyzed that only the section d1 was equal to 1, which means that the fault section was B1. Similarly, the real states of the corresponding protections and circuit breakers can be determined, from which we can identified that CB6 failed to operate in the fault removing process. The diagnosis process for other cases was similar, and the results of this method as well as some existing methods are shown in Table 2.

5. Discussion

From the testing results, it can be seen that the method proposed in [28] cannot effectively solve the problem of uncertainty, and may get wrong results if there are missed or misreported alarms accompanied with the fault scenario. However, by introducing the actual states of the protective devices into the fault hypothesis, the method in this paper can effectively deal with the problems such as the malfunctions of the protective devices or the communication errors of the alarm signals, and the correct fault diagnosis results can be obtained.
Although the method proposed in [34] can get the correct diagnosis results, it has to introduce additional variables to represent the malfunctions of the protective devices or the communication errors of the alarm signals, which can increase the calculating dimension and lead to contradictory hypothesis. Compared with the objective function established in this paper, this method takes more time to solve the optimization problem.
Besides, the methods in [28] and [34] need to analyze the relationship between the sections and the protective devices by traversal search, and the process includes the selection of the protected sections as well as the analysis of the cooperative relationship of protections. The objective function can be established only if all protective devices have been traversed. Therefore, the modeling process of these methods will require a lot of computing time, even greatly exceed the solving time by the intelligence algorithm. The proposed method in this paper is based on the topology description of power system, and it only uses simple matrix operations to establish the objective function, and the modeling efficiency is improved.
All the cases listed in Table 1 and Table 2 were performed in a personal computer with 2.3GHz dual-core processor and 2G memory, using MATLAB programming. Including the modeling process and the iterative solution, the average calculating time of the cases in Table 1 and Table 2 was no more than 10 s. However, if they are processed by the analytic models introduced in [28] and [34] with the same calculating environment and intelligence algorithm, the calculating time varies from one to three minutes according to the fault complexity, and most of the calculating time is used to generate the objective function online. Therefore, the proposed method has a clear advantage in fault diagnosis speed, and can meet the demand of the online application.
On the other hand, since the analytic model is constructed based on the topology description, it is easy to adapt to the topology changes of the power system. Taking the sample system shown in Figure 1 as an example, if L4 is out of service due to maintenance, the only change is to set the elements corresponding to L4 in the topology matrices (the non-zeros in the 4th column) to zero, and there is no need to adjust the modeling process and iterative solution.
In summary, the proposed method is suitable for both simple and complex fault scenarios, and the fault section can be identified correctly even under complex conditions, such as the malfunctions of the protective devices or the communication errors of the alarm signals. Compared with the existing methods, the proposed method has better fault tolerance and can get satisfying results, and the topology modeling-based analytic method can greatly improve the effectiveness and flexibility of fault diagnosis. Besides, the operating performance of the protective devices can be effectively evaluated according to the best solution.

6. Conclusions

A novel analytic method for power system fault diagnosis employing topology description is proposed in this paper. The topology description of the system is established based on the incident matrix, and the mapping transformation between the sections and the protective devices is studied by topological analysis. Based on these analyses, the expected state of the protective devices and the objective function of the analytic model can be automatically established by simple matrix operations. The optimization problem is then solved by the intelligent algorithm, and according to the best solution, the actual fault section can be identified and the operating performance of the protective devices can be evaluated. The case studies of the IEEE 14-bus system and the typical four-zone power system demonstrate the effectiveness and fault-tolerance of the proposed method.
In this paper, the typical genetic algorithm is used to solve the optimization problem and verify the effectiveness of the proposed method. Future research will focus on improving the efficiency of the algorithm, so as to further enhance the diagnosis performance. It should be noted that the topology-based modeling method proposed in this paper can also be applied to other kinds of fault diagnosis approaches, such as the expert system or the Petri nets-based methods.

Author Contributions

B.X., X.Y. and D.W. conceived and designed the research and case studies; B.X. performed the case studies and analyzed the results; B.X. and X.Y. contributed materials and analysis tools; B.X. and D.W. wrote and revised the paper; S.P. and Y.W. provided technical support.

Funding

This work was supported by the key project of smart grid technology and equipment of national key research and development plan of China under Grant 2017YFB0902900.

Conflicts of Interest

The authors declare no conflict of interest.

References

  1. Ferreira, V.H.; Zanghi, R.; Fortes, M.Z.; Sotelo, G.G.; Silva, R.B.M.; Souza, J.C.S.; Guimaraes, C.H.C.; Gomes, S. A survey on intelligent system application to fault diagnosis in electric power system transmission lines. Electr. Power Syst. Res. 2016, 136, 135–153. [Google Scholar] [CrossRef]
  2. Vale, Z.A.; Moura, A.M.E. An expert system with temporal reasoning for alarm processing in power system control centers. IEEE Trans. Power Syst. 1993, 8, 1307–1314. [Google Scholar] [CrossRef]
  3. Cho, H.J.; Park, J.K. An expert system for fault section diagnosis of power systems using fuzzy relations. IEEE Trans. Power Syst. 1997, 12, 342–347. [Google Scholar]
  4. Lee, H.J.; Park, D.Y.; Ahn, B.S.; Park, Y.M.; Park, J.K.; Venkata, S.S. A fuzzy expert system for the integrated fault diagnosis. IEEE Trans. Power Deliv. 2000, 15, 833–838. [Google Scholar] [Green Version]
  5. Bi, T.S.; Yan, Z.; Wen, F.S.; Ni, Y.X.; Shen, C.M.; Wu, F.F.; Yang, Q.X. On-line fault section estimation in power systems with radial basis function neural network. Int. J. Electr. Power Energy Syst. 2002, 24, 321–328. [Google Scholar] [CrossRef]
  6. Cardoso, G.; Rolim, J.G.; Zurn, H.H. Application of neural-network modules to electric power system fault section estimation. IEEE Trans. Power Deliv. 2004, 19, 1034–1041. [Google Scholar] [CrossRef]
  7. Thukaram, D.; Khincha, H.P.; Vijaynarasimha, H.P. Artificial neural network and support vector machine approach for locating faults in radial distribution systems. IEEE Trans. Power Deliv. 2005, 20, 710–721. [Google Scholar] [CrossRef]
  8. Min, S.W.; Sohn, J.M.; Park, J.K.; Kim, K.H. Adaptive fault section estimation using matrix representation with fuzzy relations. IEEE Trans. Power Syst. 2004, 19, 842–848. [Google Scholar] [CrossRef]
  9. Chen, W.H. Online Fault Diagnosis for Power Transmission Networks Using Fuzzy Digraph Models. IEEE Trans. Power Deliv. 2012, 27, 688–698. [Google Scholar] [CrossRef]
  10. Hor, C.L.; Crossley, P.A.; Watson, S.J. Building knowledge for substation-based decision support using rough sets. IEEE Trans. Power Deliv. 2007, 22, 1372–1379. [Google Scholar] [CrossRef]
  11. Rawat, S.; Patel, A.; Celestino, J.; dos Santos, A.L.M. A dominance based rough set classification system for fault diagnosis in electrical smart grid environments. Artif. Intell. Rev. 2016, 46, 389–411. [Google Scholar] [CrossRef]
  12. Zhu, Y.L.; Huo, L.M.; Lu, J.L. Bayesian networks-based approach for power systems fault diagnosis. IEEE Trans. Power Deliv. 2006, 21, 634–639. [Google Scholar]
  13. Ricks, B.; Mengshoel, O.J. Diagnosis for uncertain, dynamic and hybrid domains using Bayesian networks and arithmetic circuits. Int. J. Approx. Reason. 2014, 55, 1207–1234. [Google Scholar] [CrossRef]
  14. Lin, S.; Chen, X.Y.; Wang, Q. Fault diagnosis model based on Bayesian network considering information uncertainty and its application in traction power supply system. IEEJ Trans. Electr. Electron. Eng. 2018, 13, 671–680. [Google Scholar] [CrossRef]
  15. Sun, J.; Qin, S.Y.; Song, Y.H. Fault diagnosis of Electric Power Systems based on Fuzzy Petri Nets. IEEE Trans. Power Syst. 2004, 19, 2053–2059. [Google Scholar] [CrossRef]
  16. Xu, L.; Kezunovic, M. Implementing Fuzzy Reasoning Petri-Nets for Fault Section Estimation. IEEE Trans. Power Deliv. 2008, 23, 676–685. [Google Scholar]
  17. Zhang, X.; Yue, S.; Zha, X.B. Method of power grid fault diagnosis using intuitionistic fuzzy Petri nets. IET Gener. Transm. Distrib. 2018, 12, 295–302. [Google Scholar] [CrossRef]
  18. Wen, F.S.; Chang, C.S. Probabilistic approach for fault-section estimation in power systems based on a refined genetic algorithm. IEE Proc.-Gener. Transm. Distrib. 1997, 144, 160–168. [Google Scholar] [CrossRef]
  19. Wen, F.S.; Chang, C.S. A tabu search approach to fault section estimation in power systems. Electr. Power Syst. Res. 1997, 40, 63–73. [Google Scholar] [CrossRef]
  20. Wen, F.S.; Chang, C.S. Possibilistic-diagnosis theory for fault-section estimation and state identification of unobserved protective relays using tabu-search method. IEE Proc.-Gener. Transm. Distrib. 1998, 145, 722–730. [Google Scholar] [CrossRef]
  21. Wen, F.S.; Chang, C.S.; Fu, W.H. New approach to alarm processing in power systems based on the set covering theory and a refined genetic algorithm. Electr. Mach. Power Syst. 1998, 26, 53–67. [Google Scholar] [CrossRef]
  22. Liu, Y.; Li, Y.; Cao, Y.J.; Guo, C.X. Forward and backward models for fault diagnosis based on parallel genetic algorithms. J. Zhejiang Univ.-Sci. A 2008, 9, 1420–1425. [Google Scholar] [CrossRef]
  23. Chang, C.S.; Tian, L.; Wen, F.S. A new approach to fault section estimation in power systems using Ant system. Electr. Power Syst. Res. 1999, 49, 63–70. [Google Scholar] [CrossRef]
  24. Huang, S.J. Application of immune-based optimization method for fault-section estimation in a distribution system. IEEE Trans. Power Deliv. 2002, 17, 779–784. [Google Scholar] [CrossRef]
  25. Leao, F.B.; Pereira, R.A.F.; Mantovani, J.R.S. Fault section estimation in electric power systems using an optimization immune algorithm. Electr. Power Syst. Res. 2010, 80, 1341–1352. [Google Scholar] [CrossRef]
  26. Huang, S.J.; Liu, X.Z.; Su, W.F.; Ou, T.C. Application of Enhanced Honey-Bee Mating Optimization Algorithm to Fault Section Estimation in Power Systems. IEEE Trans. Power Deliv. 2013, 28, 1944–1951. [Google Scholar] [CrossRef]
  27. Xiong, G.J.; Shi, D.Y.; Zhang, J.; Zhang, Y. A binary coded brain storm optimization for fault section diagnosis of power systems. Electr. Power Syst. Res. 2018, 163, 441–451. [Google Scholar] [CrossRef]
  28. Lin, X.N.; Ke, S.H.; Li, Z.T.; Weng, H.L.; Han, X.H. A Fault Diagnosis Method of Power Systems Based on Improved Objective Function and Genetic Algorithm-Tabu Search. IEEE Trans. Power Deliv. 2010, 25, 1268–1274. [Google Scholar] [CrossRef]
  29. Guo, W.X.; Wen, F.S.; Ledwich, G.; Liao, Z.W.; He, X.Z.; Liang, J.H. An Analytic Model for Fault Diagnosis in Power Systems Considering Malfunctions of Protective Relays and Circuit Breakers. IEEE Trans. Power Deliv. 2010, 25, 1393–1401. [Google Scholar] [CrossRef]
  30. Liu, D.B.; Gu, X.; Li, H. A Complete Analytic Model for Fault Diagnosis of Power Systems. Proc. CSEE 2011, 31, 85–92. [Google Scholar]
  31. Li, Z.X.; Yin, X.G.; Zhang, Z.; He, Z.Q. Wide-Area Protection Fault Identification Algorithm Based on Multi-Information Fusion. IEEE Trans. Power Deliv. 2013, 28, 1348–1355. [Google Scholar]
  32. Guo, W.X.; Wen, F.S.; Liao, Z.W.; Wei, L.H.; Xin, J.B. An Analytic Model-Based Approach for Power System Alarm Processing Employing Temporal Constraint Network. IEEE Trans. Power Deliv. 2010, 25, 2435–2447. [Google Scholar] [CrossRef]
  33. Guo, W.X.; Wen, F.S.; Ledwich, G.; Liao, Z.W.; He, X.Z.; Huang, J.S. A new analytic approach for power system fault diagnosis employing the temporal information of alarm messages. Int. J. Electr. Power Energy Syst. 2012, 43, 1204–1212. [Google Scholar] [CrossRef]
  34. Zhang, Y.; Chung, C.Y.; Wen, F.H.; Zhong, J.Y. An Analytic Model for Fault Diagnosis in Power Systems Utilizing Redundancy and Temporal Information of Alarm Messages. IEEE Trans. Power Syst. 2016, 31, 4877–4886. [Google Scholar] [CrossRef]
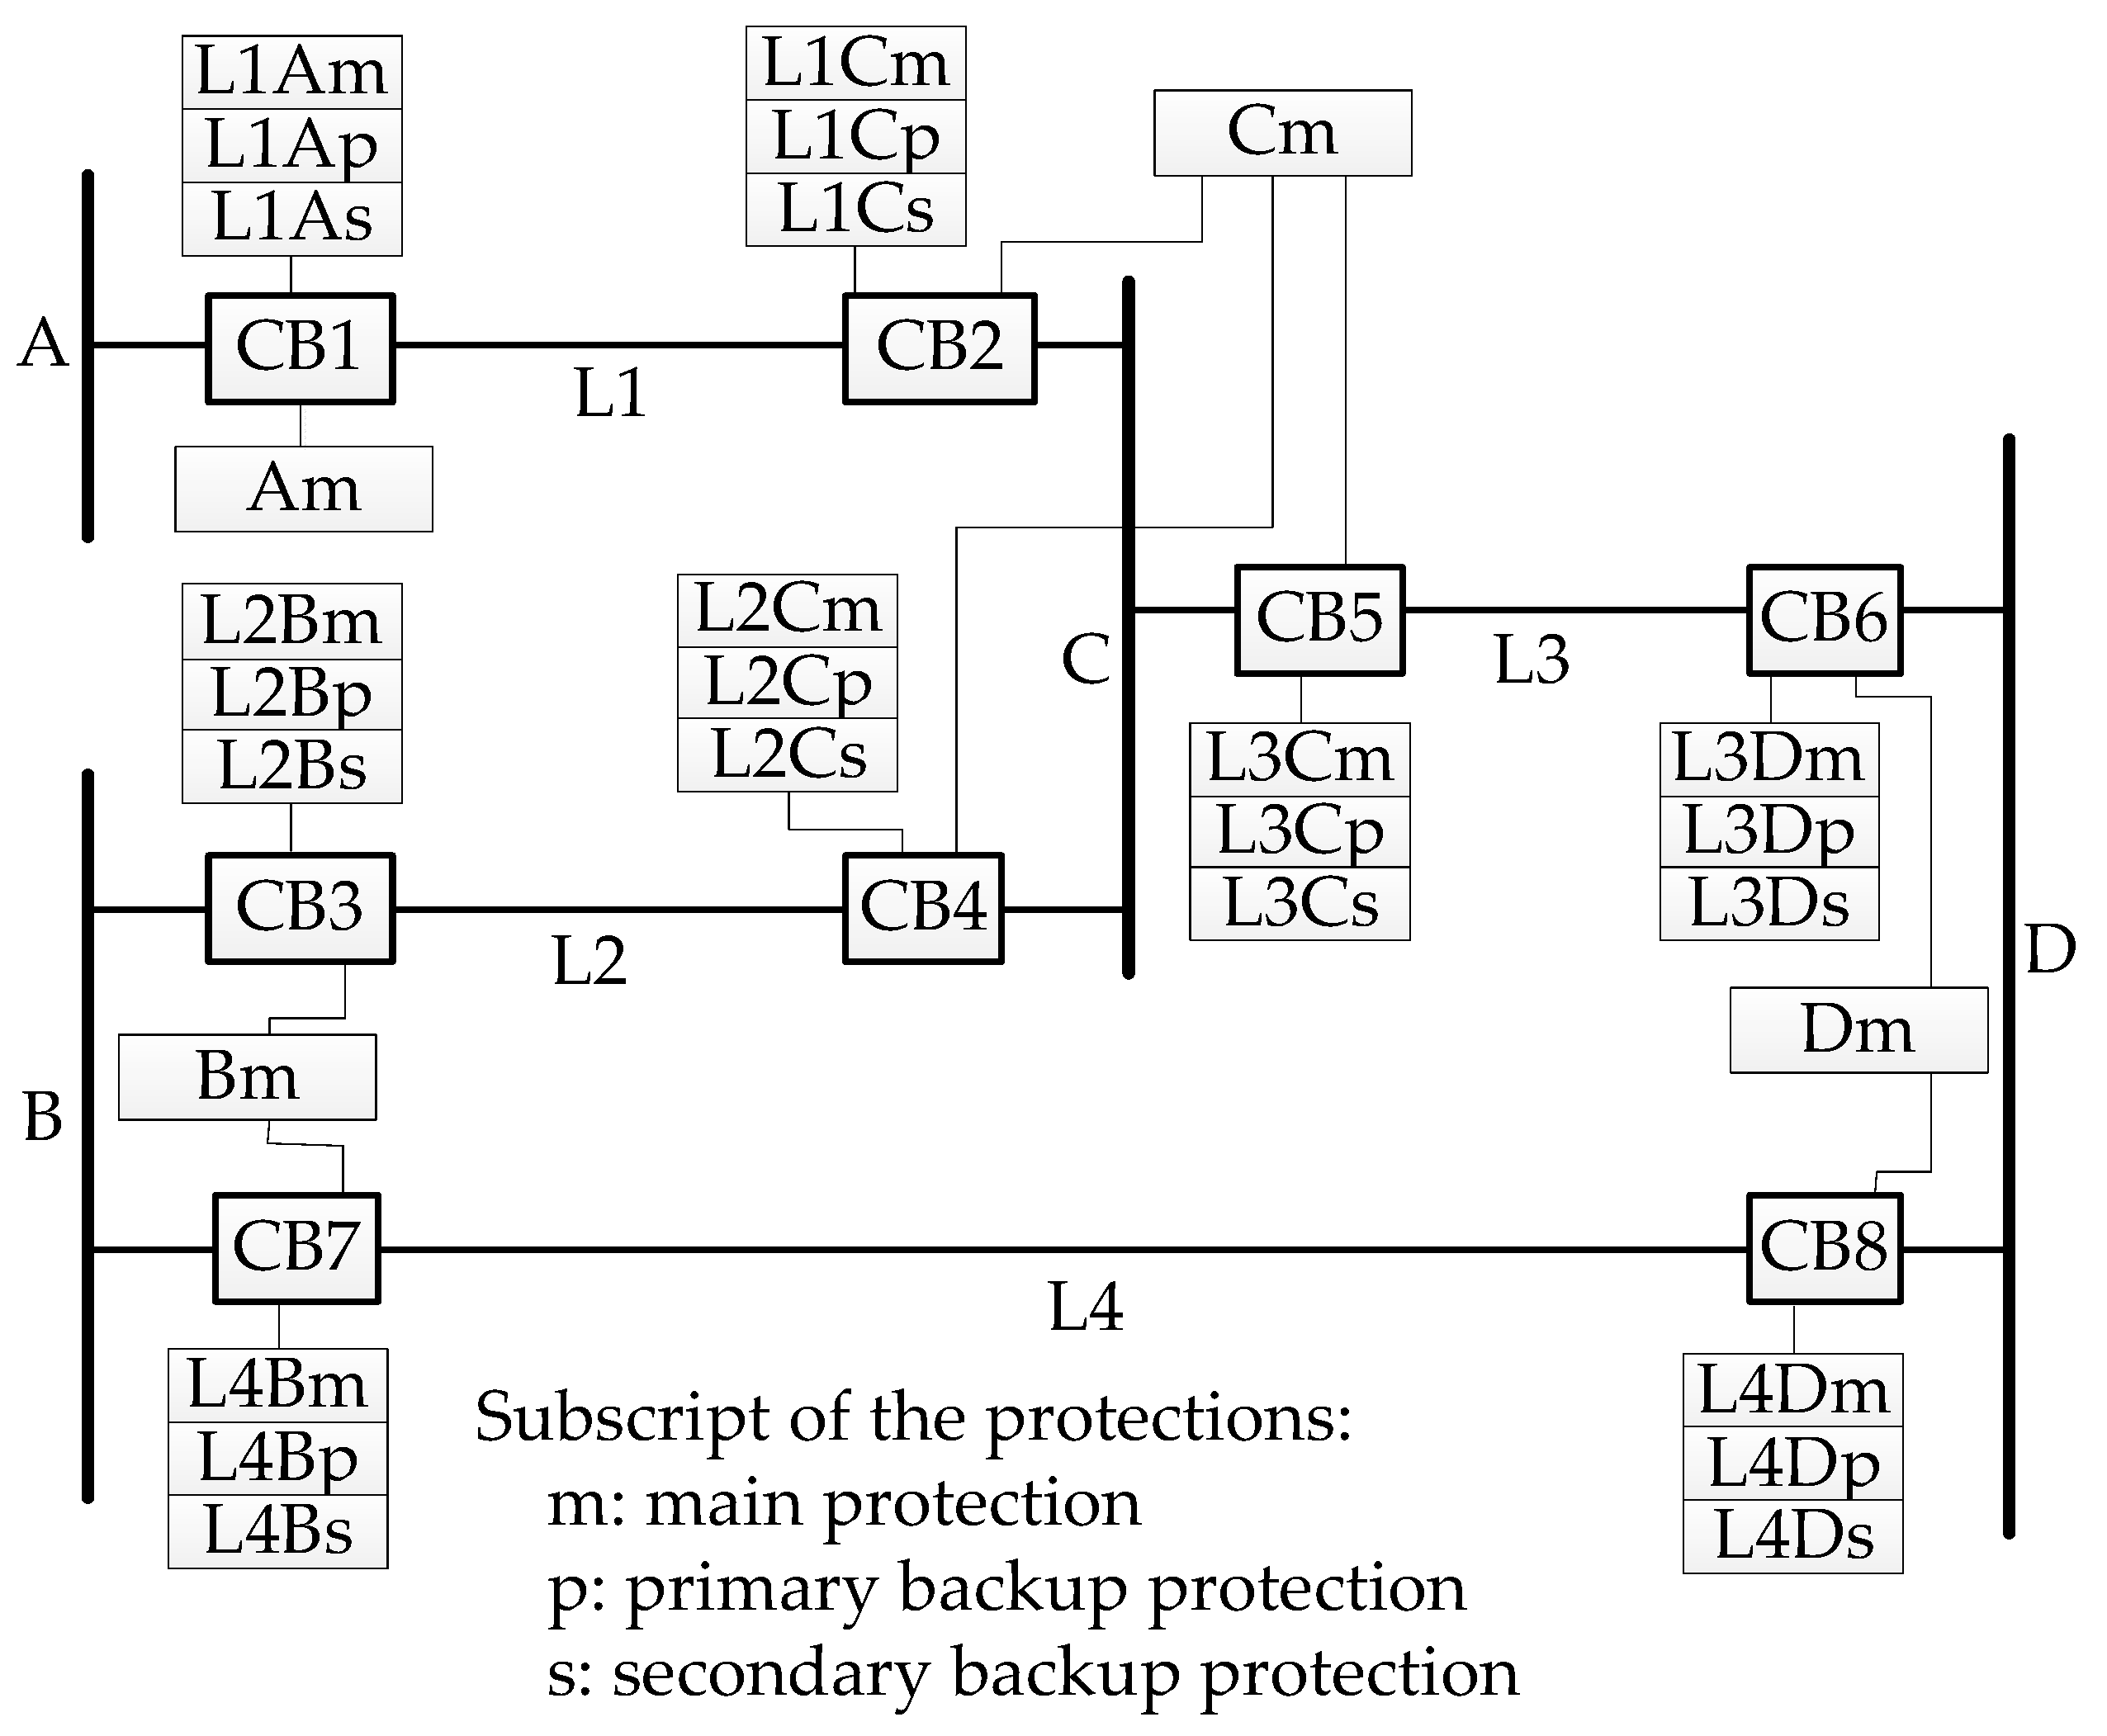
Figure 1. The sample power system and its protection configuration.
Energies 12 01770 g001
Figure 2. Topology description of the power system: (a) Incident matrix; (b) the circuit breaker matrix; (c) The bus protection matrix; (d) the main protection matrix; (e) the primary backup protection matrix; (f) the secondary backup protection matrix; (g) the bus matrix; (h) the transmission line matrix.
Energies 12 01770 g002
Figure 3. Schematic diagram for virtual line and virtual bus: (a) the virtual line; (b) the virtual bus.
Energies 12 01770 g003
Figure 4. Framework of the fault diagnosis method.
Energies 12 01770 g004
Figure 5. The tested IEEE 14-bus power system.
Energies 12 01770 g005
Figure 6. Convergence graphs of the iterative process of the cases in Table 1: (a) case 1; (b) case 2; (c) case 3; (d) case 4; (e) case 5; (f) case 6.
Energies 12 01770 g006
Figure 7. The tested four-zone power system.
Energies 12 01770 g007
Table 1. Case studies of the IEEE 14-bus system.
NO.Received AlarmsFault Diagnosis Result
min E ( X ) Fault SectionEvaluation
1B13m, CB1312, CB1306, CB13140B13Normal
2B13m, L1413p, CB1312, CB1306, CB13140.4B13L1413p (misreported)
3B07m, L1011m, L0611s, CB0704, CB0709, CB0708, CB1011, CB06110B07
L1110
L1110m (failed to operate)
L1110p (failed to operate)
4B07m, B10m, L1110s, CB0704, CB0709, CB0708, CB1110, CB1009, CB11061.2B07
B10
CB1011 (failed to operate)
CB1106 (mal-operated)
5B11m, L0204m, L0402m, L1011s, CB1106, CB1011, CB0204, CB04020.6B11
L0204
CB1110 (failed to operate)
6L1011m, L1110m, B14m, L1314s, CB1011, CB1409, CB13141.0B14
L1110
CB1110 (alarm missing)
CB1413 (failed to operate)
Table 2. Diagnosis results of the four-zone power system.
NO.Received AlarmsFault Section ofDiagnosis Result of This Paper
[28][34]Fault sectionEvaluation
1B1m, L2Rs, L4Rs, L7Sm, CB4, CB5, CB7, CB9, CB12, CB27, CB29B1B1B1CB6 (failed to operate)
L7Sm (mal-operated)
2T3p, L7Sp, L7Rp, CB14, CB16, CB29, CB39T3
L7
T3
L7
T3
L7
L7Sm (failed to operate)
L7Rm (failed to operate)
3B1m, B4m, L1Sp, L1Rm, CB4, CB5, CB6, CB7, CB9, CB11L1
B1
B4
L1
B1
L1
B1
L1Sm (failed to operate)
B4m (misreported)
4B2m, L1Sm, L1Rp, L2Rm, L2Sp, CB4, CB5, CB6, CB7, CB8, CB9, CB10, CB11, CB12B2
L1
L2
B1
B2
L1
L2
B1
B2
L1
L2
B1m (alarm missing)
L1Rm (failed to operate)
L2Sm (failed to operate)
5L1Sm, L1Rp, L2Sp, L2Rp, L7Sp, L7Rm, L8Rm, CB7, CB8, CB11, CB12, CB29, CB30, CB39, CB40L1
L2
L7
L1
L2
L7
L8
L1
L2
L7
L8
L1Rm (failed to operate)
L2Sm (failed to operate)
L2Rm (failed to operate)
L7Sm (failed to operate)
L8Sm (alarm missing)
6T7m, T8p, B7m, B8m, L5Sm, L5Rm, L8Sp, L8Rm, CB19, CB20, CB29, CB30, CB32, CB33, CB34, CB35, CB36, CB37, CB40L5
L8
B7
T7
T8
L5
L8
B7
B8
T7
T8
L5
L8
B7
B8
T7
T8
T8m (failed to operate)
L8Sm (failed to operate)
CB31 (failed to operate)
CB39 (failed to operate)
L6Ss (alarm missing)
L7Ss (alarm missing)