Abstract
The optimal planning of electric vehicle charging infrastructure has attracted extensive research interest in recent years. Most of the optimization problems were formulated by assuming that the configurations will be fixed at the optimal solution while overlooking the fact that the charging stations and the electric vehicles are “evolving” over time and have mutual impacts. On the other hand, little attention has been paid to evaluate the performance of the solutions in such a dynamic environment. Motivated by these gaps, this work develops a simulation model that captures the interactions between charging station configurations and electric vehicle population (and the preference of electric vehicles when choosing charging station). This modeling framework is then implemented to evaluate the performance of planned charging infrastructure in providing services to electric vehicles. Two indicators are calculated, i.e., usage rate and rejection rate. The former measures the “waste” due to abundant facilities installed; the latter measures the inadequacy of planned facilities, especially when the electric vehicle population is larger. The simulation results presented in this work validate the model and show the potential of the model not only to evaluate designs but also to be used for optimal planning in subsequent works.
1. Introduction
The infrastructure development for electric vehicle charging station (EVCS) networks has been urgently called for at the global scale to facilitate the transition towards a greener transportation system [1,2]. During this transition, the electric vehicle (EV) population is projected to grow significantly and compete with traditional internal combustion engine vehicles in terms of reduced emissions and enhanced performance [3]. In a typical EVCS network planning process, various aspects of the region under study have to be analyzed prudently such as the EV population and spatial distribution, the location of each EVCS along with its configurations (number of charging facilities, or CFs, and their types), any constraints to EVCS deployment, the operational plans that attract the EV owners’ use of EVCS for charging, and the growth of EV population as well as the modification of EVCS settings over the project lifetime. As discussed below, while most of these aspects have been studied intensively, the last two have received little attention in the literature.
The planning for EV charging station networks has been recently explored intensively in the literature by many researchers in both industry and academia from several viewpoints such as: (1) modeling the charging demands of the EVs [4,5,6,7,8,9,10,11]; (2) the considered planning targets and scenarios such as number of stations, locations and cost factors [12,13,14,15,16], and (3) in terms of the solution algorithms [17,18,19]. Here, we put together a brief review concerning the EVCS planning in terms of the main objectives and solution techniques (optimization methods) that have been used. In [20], Deb et al. introduced a voltage stability, reliability, and power loss (VRP) index and used the genetic algorithm (GA) to solve the optimization problem of placing EV charging stations in the distribution network. It was found that the VRP index can help obtaining the most suitable locations for EVCSs. Barzani et al. [21] also used GA to solve a mixed-integer nonlinear optimization problem (MINLP) to plan for EVCSs, with the main objective function being to find the optimal size and location of fast-charging stations on the urban roads while minimizing the total costs. They showed that the EV loss would become the dominant component of the cost if the EVCSs are not located optimally. Further applications of the GA when planning for EVCSs was performed by Hayajneh et al. [22]. Starting with initial potential candidates, the main objective function was to obtain the optimum number of EVCSs in terms of locations and configurations with the aim to minimize both the transportation energy losses (TEL) and EVCS investment and operation/maintenance costs. It was concluded that the method is applicable within any city borders for a given number of EVs. Dharmakeerthi et al. [23] found that the EVCS planning problem can be solved efficiently by applying the particle swarm optimization (PSO) as a modern heuristic technique for the objective function of identifying the maximum allowable charging load and its location through the planned EV charging infrastructure. A combination of GA and PSO (hybrid algorithm) was applied in [24] and [25] as the solution method for EVCS network planning to minimize the network power losses. It was concluded in [24] that applying the hybrid algorithm resulted in a better performance compared to employing only one of the algorithms in terms of the solution quality and with lesser number of iterations. In [25], the findings indicated that the hybrid algorithm is more advantageous in getting uniform answers with the minimum value of variances. The hybrid optimization method was evaluated to be able to find the optimum solution while planning for EVCSs.
Many other solution techniques have been used while planning for EVCSs. Zheng et al. [26] proposed a multistage planning model for EV charging stations associated with battery storage systems (BSS), an enhanced differential evolution (DE) by the fitness sharing technique was employed to reveal the global optimum solution. The general objective of that study was to maximize the economic profit as represented by the net present value (NPV) during the stations life cycle in the planned system. Iterative mixed-integer linear program (MILP), greedy approach, effective MILP, and chemical reaction optimization (CRO) are four different approaches introduced in [27] to tackle the nondeterministic polynomial-time problem of obtaining the finest locations to construct charging stations in a city. Within this study, the more focus in terms of EVCS placement was on the human factors than the technological ones. Quality of Service (QoS) was an index introduced in [28] to indicate the charging time wasted by EV users in order to complete planned trips; the objective function was to minimize the overall cost of installing the charging infrastructure while minimizing the wasted time, the findings of the study demonstrate that the optimization model is able to guarantee charging reliability. In [29], Liu et al. and with an objective function of minimizing the total cost associated with the planned EVCSs, developed a mathematical model for the optimal planning of EVCSs and obtained a solution by applying the method of modified primal-dual interior-point algorithm (MPDIPA), their solution method was able to achieve a sensible planning structure of EV charging stations, curtail the network losses and improve the voltage profile. Luo et al. [30] transformed scenario-based constraints and optimization models into a mixed-integer second-order cone programming (SOCP) problem and solved it by a proposed two-step equivalence method, the main objective was to minimize the total costs associated with the planned EVCSs network that utilizes multi-types of charging facilities (CF), it was determined that combining different types of CFs extends the options for EV owners and enhances the economic profits of EVCSs network by reducing the needless expenses for expensive CFs. In [31], Hajimiragha et al. developed a robust optimization planning problem to determine the optimal power grid potential that is capable of receiving more EV population at the EVCSs, the study identified uncertain parameters that influence the optimal solution and determined that such robust methodology was useful while demonstrated in a real case scenario.
However, the previous studies have only considered optimal planning of an EVCS or an EVCS network to achieve maximum technological and economic feasibility under certain constraints. Little attention has been paid to an important aspect: interaction between EVs and EVCSs. For instance, the better an EVCS serves some EV owners, the preference of the EV owners to choose the EVCS will increase; the better the EVCSs serve all EVs, more EV population growth will be stimulated; the change in EV population will also impact the performance of EVCSs, and the EVCSs need to periodically make and implement plans to change their configurations of charging facilities. These interactions between EVs and EVCSs are similar to the co-evolution of two species in ecology. This is what inspired this work on the development of a co-evolution framework to evaluate the designed EVCS networks. In this paper, we propose the simulation model to capture the essential aspects of the interactions between EVs and EVCSs and use the model to evaluate EVCS planning, more specifically, the CF’s usage rate and EV’s rejection rate. The former measures the “waste” due to abundant CFs planned; the latter characterizes the inadequacy of planned CFs, especially when the EV population is larger. Although the model can later be used for the optimal planning of EVCSs with the evaluation criteria as objective function, this work is not about formulating and solving an optimization problem for the planning of EVCS networks. The scope is limited to demonstrating an evaluation system that can help decision-makers (e.g., of a city or company) assess the performance of an EVCS planning solution over the lifetime of the project and compare different EVCS planning solutions. Each EVCS planning solution might be the result of some optimization problem, but we would like to examine a given EVCS planning solution to see how well it performs into the future, especially when circumstances are constantly changing.
2. Methodology
The objective of this work is to develop a modeling framework to examine the performance of planned EVCS networks using a novel, co-evolutionary approach. As indicated above, the existing EVCS planning methods define different types of objective functions and use various optimization techniques to find the “best” solutions under the specified constraints. However, the optimality of the EVCS planning may not be able to endure a dynamic environment in general. Therefore, if the optimal solution at the infrastructure planning phase only considers a static picture of the world, then it will be very likely that the design has to be substantially revised during the project lifetime, which is not the desired outcome. This work, in alignment with new ideas of “biomimetic” infrastructure design [32], aims to shed some light on these important issues.
In this section, we describe the main sequence of the simulation model and some technical details of the co-evolution scenarios. Again, we would like to clarify that the proposed simulation model does not intend to formulate or solve optimization problems to obtain optimal EVCS network planning solutions. Instead, as an input of the model, the information on the planned EVCS network with the location and configuration (e.g., the number of each type of CFs) of each EVCS is known. Then the model will simulate the EV charging activities and the EVCS operations over a period of time to generate indicators of the performance of the studied ECVS network.
To simulate a network of EVCSs that serves a population of EVs in a region, the initialization procedures are as follows: (i) set the location and configuration (i.e., number of CFs) of each EVCS and the number of EVs at the beginning of the first year; (ii) each EV has an initial label (−1 or 1) that represents its need to be charged or not, respectively; (iii) each EV has its own location initially which is required for the calculation of the distances to all EVCSs (in this work, we use Euclidean distance; with the help of geospatial information tool such as Google Map API, there is no theoretical barrier to extend to more realistic travel distances considering road network and traffic condition); (iv) each EV has its own preferences towards the EVCSs and the CFs, which are factors in addition to the distance and the CF availability when EVs choose which EVCS to go. In this paper, we consider three types of CFs: the fast CF which can charge an EV to full capacity in one hour, the medium CF which can charge an EV to full capacity in three hours, and the slow CF which can charge an EV to full capacity in eight hours. For simplicity, the number of hours it takes for an EV to be fully charged using each type of CFs is assumed to be constant, representing the estimate of the average number of hours taken.
After initialization, the simulation runs at a specified time step (one hour used in this work). As illustrated in Figure 1, at each time step, the algorithm updates: (a) the time to be fully charged for the EVs with label 0 are being charged (when the time reaches 0, then the EV label switches to 1); (b) the time to charge and the location for each EV with label 1 that does not need charging at the current time step (when the time reaches 0, then the EV label switches to −1); for the EVs with label −1, the process of EVCS selection will be initiated (if successful, then the EV label switches to 0 at the next time step; otherwise, the label is kept at −1 until a selection is made).
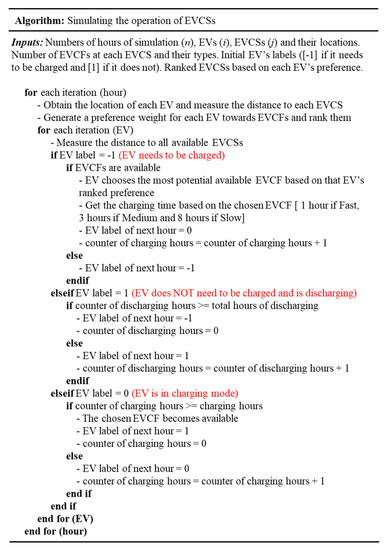
Figure 1.
Description of the update algorithm at each simulation step.
For each EV that needs charging, the EVCS selection process is outlined as follows: First, the combinations of EVCS and CF are ranked. The total number of combinations equals to three times the number of EVCSs. The primary criterion is the EV’s preference over CFs. For instance, if the EV’s preference of fast, medium and slow CFs are 0.5, 0.3, and 0.2, then the combinations with fast CFs will be on the top of the ranking list. The secondary criterion is the EV’s weighted distance to each EVCS. The weighted distance is calculated as the actual distance divided by the preference (the sum of preferences over all EVCSs is 1). For example, if the actual distance between the EV and an EVCS is 10 km and the preference of the EV for the EVCS is 0.1, then the weighted distance is 100 km. Following these two criteria, we will be able to rank all the combinations; in the cases that multiple combinations have the same ranking, the EV can randomly choose from them. Next, we choose the highest-ranked combination that has the most preferred CFs available. This means that the EV will have to use the combination with a less preferred CF if and only if none of the more preferred CFs are available at any EVCS. When a combination is selected, the available number of the specific CF at the chosen EVCS will be reduced by 1 at the next hour (similarly, when an EV completes charging, the CF numbers will be increased by 1). If no CF is available now, the EV has to try again during the next time step, and this counts as one rejection event.
The availability of CFs at each EVCS is related to the performance of the planned configurations in two ways. The statistics of the charging hours of each CF can be used to evaluate the usage of a designed EVCS network. On the other hand, the rejection rate of an EVCS is an indicator of the lack of CFs to meet the demand. These performance indicators will have implications for the co-evolving of the EV population and the EVCS configurations, the details of which will be discussed in the next section. Here we only provide a qualitative description of the basic co-evolutionary process. First, the performance of the EVCSs will affect the growth of the EV population (e.g., a rejection rate that is too high may discourage rapid EV increase). Second, each EV’s preference toward the EVCSs may subject to change (e.g., depending on prior experience of being served at the EVCSs). Additionally, the EVCS designs could also be adjusted to better meet the demand. For instance, the number of CFs at an EVCS may be increased if the past rejection rate here is high. Although not considered in this paper, the addition and elimination of EVCSs can also be determined based on the performance.
3. Results
In this section, we present the simulation results from the model described above. To start with, we consider one EVCS located in a square region and a fixed population of 100 EVs. The EVCS is configured with 10 fast CFs, 15 medium CFs, and 20 slow CFs. In Figure 2a, for various probabilities of EVs needing to be charged (label −1) at the beginning of the simulation, the usage of each type of CFs as the percentage of total CF-hours in one year (number of each type of CFs times 8760 h) is shown. It is reasonable that the initial probability, although possible to lead to some difference for a short period of time, has a very minor effect on the results of CF usage over a year. For all the initial probabilities, the average usage hours of all types of CFs is about 72,500 in one year. There are very few occasions of rejection (no available CFs), averaged 63 times only for one year. In the case of Figure 2a, the EVs’ preference toward the types of CFs is randomly generated at each time of EVCS selection. It can be seen that fast CFs have the highest usage (~31%), and slow CFs have the lowest usage (~11%). It is partly because there are fewer fast CFs than slow CFs and partly because the fast CFs are much more frequently made available than slow CFs.
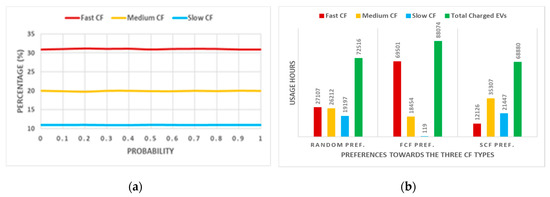
Figure 2.
(a) Dependence of the usage of each of the three types of CFs on the initial probability of EVs needing to be charged. (b) The usage hours of the CFs in three scenarios of different CF preferences for all EVs.
The effect of EV preference towards the CFs on the usage times of the CFs is shown in Figure 2b. The first scenario is the same as Figure 2a, namely, random preference. The second and third scenarios have the highest preference for fast CFs and slow CFs, respectively. It can be seen that if the EVs all prefer fast CFs, little usage of slow CFs will be expected. In contrast, when the EVs all favor slow CFs, while it can reduce the usage of fast CFs, it cannot increase the slow CF usage to a very large extent. This is because the long charging time of slow CFs makes them less available, which “forces” many EVs to select medium CFs as the next best option. Consequently, the usage of medium CFs in this scenario surges.
Next, we take into consideration the EV population growth. The simulation will be 10 years with other settings similar to before. In Figure 3a, there is 1 EVCS with 5 fast CFs, 10 medium CFs, and 15 slow CFs and the number of EVs is growing annually with a flat rate of 5% compared to the number at the previous year (100 EVs in the first year and 155 EVs in the last year). The usages of the three types of CFs are shown, which initially increases with the number of EVs and later reaches a saturation. Understandably, the relatively small number of CFs contributes to this situation. And a type of CFs cannot reach 100% usage because of the unavoidable mismatch between EVCS selection and CF availability. Since the usage in this case seems less informative, especially in later years, we instead look into an alternative indicator: rejection rate, i.e., the ratio of the number of rejection events and the number of needs-to-be-charged occasions. Surprisingly, the rejection rate grows from ~13% in Year 1 to ~80% in Year 10, an over 600% increase while the growth of EV population is below 60%. As suggested by Figure 3b, the natural solution to reduce rejection rate is to increase CF numbers. With each type of CFs increased by 5, the rejection rate in Year 10 remains well below 5%.
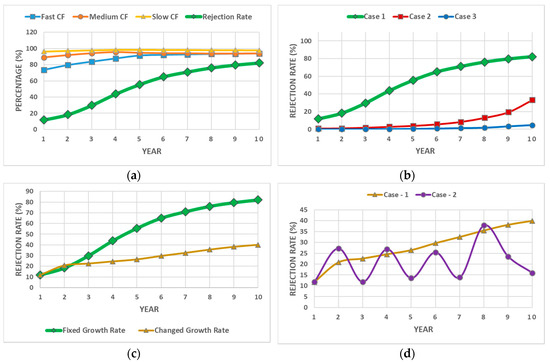
Figure 3.
(a) The usage of the fast, medium and slow CFs and the rejection rate of the EVCS over 10 years when the number of EVs is growing annually at 5%. (b) Comparison between three different configurations of the EVCS. Case 1 is with 5 fast, 10 medium, and 15 slow CFs (the same as the case in (a)); Case 2 is with 10 fast, 10 medium, and 15 slow CFs; Case 3 is with 10 fast, 15 medium, and 20 slow CFs. (c) Comparison between two scenarios. The first scenario has fixed EV growth at 5%, the same as the case in (a); the second considers a dynamic growth rate that depends on the rejection rate of the previous year. (d) The effect of EVCS expansion on rejection rate dynamics (case-1: no expansion, same as the second scenario in (c); case-2: with expansion).
So far, we have devoted our effort to validating and exploring the simulation model and not integrated any evolutionary concepts into the model. The first interaction between the EVCS and the EV population to be studied next is the effect of the rejection rate on the growth rate of the number of EVs. Figure 3c shows the rejection rates over 10 years under two scenarios of the annual growth rate of number of EVs. The first scenario is a fixed growth rate (5%) over the years, while the second scenario considers a dynamic growth rate that depends on the rejection rate of the previous year (6% if the rejection rate is below 20% and 1% if the rejection rate is over 20%). This might be somewhat exaggerated, but the results do indicate the effectiveness of the model in assessing the EVCS performance. For Year 2, the second scenario has a slightly higher rejection rate because the EV population growth rate is higher. In the subsequent years, since the rejection rate has increased to above 20%, the EV population growth slows down in the second scenario (the rejection rate still goes up, but much lower than the reference case). The second interaction between the EVCS and the EV population to be studied next is the effect of the rejection rate on the EVCS decision to increase the CFs. Figure 3d shows the rejection rate over 10 years under two cases, one being the same as the dynamic EV growth rate case which has no EVCS, the other including an annual expansion of the EVCS with a growth rate 10% for all CFs if the rejection rate is over 20% in the previous year. In the second scenario, the EV growth rate is 9% if the rejection rate is below 20% and 6% if the rejection rate is over 20%. Interestingly, the second case results in a fluctuating pattern of the rejection rate, which bears some similarity in the patterns in ecological systems (e.g., predator-prey dynamics). This is because the expansion of the EVCS will reduce the rejection rate, which will subsequently increase the EV population at higher rate. A fast-growing EV population then raises the rejection rate, which in turn can trigger the further expansion of the EVCS.
Now we extend the simulation to the case of two EVCSs. The simulation is also applicable to more than two EVCSs; however, in this work, for simplicity, we discuss two EVCSs. When there are multiple EVCSs, the third interaction between the EVCSs and the EV population to be studied next is the effect of the EVs’ preferences over each EVCS on the system performance. In Figure 4a, we present the simulation domain and indicate the locations of the EVCSs as well as the 100 EVs at the initial time step. Figure 4b shows the rejection rates of the two EVCSs (initially the CF numbers are three fast, five medium, eight slow for EVCS-1 and four fast, six medium, nine slow for EVCS-2) over 10 years. Both the number of EVs and the number of CFs are growing annually based on the rejection rate of the year before, as demonstrated in Figure 3d. The EV’s preference toward each EVCS only depends on the distance, i.e., equal preference. For both EVCSs, the rejection rate goes up as years pass; once the rejection rate at EVCS-1 exceeds 20%, both EVCSs start to increase CF numbers by 10% annually (and keep the increase afterward), and the rejection rate drops steadily. With the results as reference, in Figure 4c, results are presented for the case in which we randomly generate the preference of each EV over the two EVCSs and use it throughout the simulation. In the case of Figure 4c, the preference over EVCS-2 is higher than EVCS-1, which can be seen from the faster-increased rejection rate at EVCS-2. From Year 5 to Year 6, the decrease of EVCS-2 rejection rate comes with the increase of EVCS-1 rejection rate. This is also due to the fact that when EVCS-2 has increased CF numbers, it not only reduces its own rejection rate but also accommodates more EV charging demands that are rejected by EVCS-1. The interesting pattern of the two EVCSs’ rejection rates after Year 5 can be interpreted as some kind of “competition”, i.e., always one increasing (getting worse) as the other decreasing (getting better).
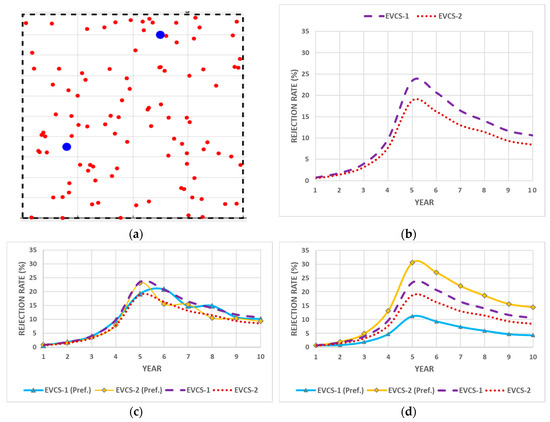
Figure 4.
(a) A hypothetical region that has two fixed-position EVCSs (blue dots) and an initial population of 100 EVs (red dots) within its borders. (b) The rejection rates of the two EVCSs over 10 years. Both the number of EVs and the number of CFs are growing annually based on the rejection rate of the year before. The EV’s preference toward each EVCS only depends on the distance, i.e., equal preference. (c) With equal preference results in (b) as reference, the effect of EV preference on the rejection rate dynamics. The preference of each EV is randomly generated and kept unchanged. (d) With equal preference results in (b) as reference, the effect of EV preference update on the rejection rate dynamics.
In Figure 4d, we show the effect of EV preference update on the rejection rate dynamics. Figure 4b is still used as a reference for comparison. For each EV, its preference toward the EVCSs is randomly generated at the beginning; at the end of each year, the EV will update the preference over an EVCS as the percentage of charging times at the EVCS. For instance, if in Year 1, the EV is charged at EVCS-1 for 60% of the times, then its preference for EVCS-1 (EVCS-2) in Year 2 will be 60% (40%). Different from the results of random preference which are mostly bounded between the equal preference curves (Figure 4c), in this case, the rejection rate curves are either above or below the two equal preference curves. This is something like a positive feedback or reinforcement process. When more EVs prefer EVCS-2 over EVCS-1, it is very likely that these EVs have both more charging times and higher rejection rates at EVCS-2. EVCS-1, in turn, can be maintained at lower rejection rates. This offers a preliminary explanation of the results presented in Figure 4d.
Finally, we test an assumption made in Section 2, which is that the number of hours an EV being charged at a CF is constant. In the results shown above, we have used 1 h for FCT, 3 h for MCT, and 8 h for SCT. In reality, the time varies because different EVs may have different charging demands for various reasons (e.g., battery capacity, time available for waiting, etc.). It would be interesting to show how the variations in the actual number of hours a CF is occupied would change the results. Figure 5 is presented for this purpose. Instead of a constant charging time, each time an EV will be randomly assigned the number of hours in the interval between 1 and the hours used previously. It is found that these random variations included have an obvious impact on the simulation results, but the results vary from simulation to simulation. Comparing the “Pref.” case in Figure 5 with that in Figure 4d, one can see that the sensitivity of charging times is relatively high. This seems to need more follow-up studies to tell if there is any statistical pattern of its effect.
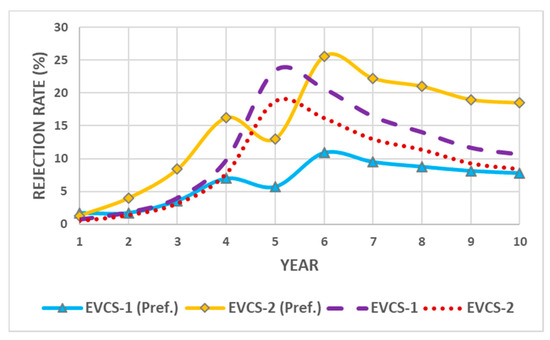
Figure 5.
With equal preference results in Figure 4b as reference, the effect of EV preference update on the rejection rate dynamics, now including the randomness of EV charging time using the CFs.
4. Conclusions
In summary, this work develops a modeling framework to evaluate EVCS planning solutions with consideration of multiple interactions between the EVCSs and the EV population they serve. The simulation results presented above demonstrate that, under those more realistic scenarios, the model is effective in assessing the performance of the EVCSs. More specifically, we implement and test three interactions: first, the adaptive growth rate of the EV population, i.e., the growth rate being negatively impacted by the rejection rate; second, the expansion of EVCSs as adaptation strategy to meet increasing EV charging demands; third, the updates of EV owner preference for EVCS selection according to prior experience, which captures some behavioral characteristics. Therefore, the model adopts a co-evolutionary framework that is capable of simulating various interactions between the EVCSs and the EVs.
As shown in Figure 3, if the EV population is growing by 5% annually, then within the EVCS project lifetime of 10 years, an initially adequate EVCS design can have the rejection rate increase 5–10 times; therefore the EVCS planning needs to consider the future growth in EV population by either deploying more than needed CFs from the beginning or making schedules for the EVCS expansion over the years. Another important aspect is the preference of EV charging. This is related to the behavior of EV owners as well as the EVCS operation strategies. There are some other interesting and complex results shown in Figure 3 and Figure 4 that are worth further investigations. The most important implication to the planning of EVCS networks is that projections of growth scenarios during the EVCS lifetime should be taken into consideration. If not, the planned infrastructure could cause unnecessary waste or need substantial rebuilding.
Subsequent studies have been ongoing to implement the model based on real-world scenarios instead of a hypothetical region and develop an optimal planning framework based on evaluating the EVCS performances. The novelty of the optimization is that the designs (e.g., the locations and configurations of the EVCSs) are no longer static but evolve and adapt to a changing environment.
Author Contributions
Conceptualization, H.S.H. and X.Z.; Methodology, X.Z.; Software, H.S.H.; Validation, H.S.H. and X.Z.; Manuscript Preparation, H.S.H. and X.Z.; Project Administration, X.Z. All authors have read and agreed to the published version of the manuscript.
Funding
This research received no external funding.
Conflicts of Interest
The authors declare no conflict of interest.
References
- Foley, A.M.; Winning, I.J.; Ó Gallachóir, B.P.Ó. State-of-the-art in electric vehicle charging infrastructure. In Proceedings of the 2010 IEEE Vehicle Power and Propulsion Conference, Lille, France, 1–3 September 2010; pp. 1–6. [Google Scholar]
- Hall, D.; Lutsey, N. Emerging Best Practices for Electric Vehicle Charging Infrastructure; The International Council on Clean Transportation (ICCT): Washington, DC, USA, 2017; p. 54. [Google Scholar]
- Energy Information Administration (EIA). Annual Energy Outlook 2018 with Projections to 2050 (AEO 2018); Energy Information Administration (EIA): Washington, DC, USA, 2018; p. 74. Available online: https://www.eia.gov/outlooks/aeo/pdf/AEO2018.pdf (accessed on 19 December 2019).
- Pazouki, S.; Mohsenzadeh, A.; Ardalan, S.; Haghifam, M.R. Simultaneous Planning of PEV Charging Stations and DGs Considering Financial, Technical, and Environmental Effects. Can. J. Electr. Comput. Eng. 2015, 38, 238–245. [Google Scholar] [CrossRef]
- Zhang, L.; Shaffer, B.; Brown, T.; Scott Samuelsen, G. The optimization of DC fast charging deployment in California. Appl. Energy 2015, 157, 111–122. [Google Scholar] [CrossRef]
- Islam, M.M.; Shareef, H.; Mohamed, A.; Wahyudie, A. A binary variant of lightning search algorithm: BLSA. Soft Comput. 2017, 21, 2971–2990. [Google Scholar] [CrossRef]
- Dharmakeerthi, C.H.; Mithulananthan, N.; Saha, T.K. A comprehensive planning framework for electric vehicle charging infrastructure deployment in the power grid with enhanced voltage stability. Int. Trans. Electr. Energy Syst. 2015, 25, 1022–1040. [Google Scholar] [CrossRef]
- Zhang, H.; Hu, Z.; Xu, Z.; Song, Y. An Integrated Planning Framework for Different Types of PEV Charging Facilities in Urban Area. IEEE Trans. Smart Grid 2016, 7, 2273–2284. [Google Scholar] [CrossRef]
- Zhang, H.; Hu, Z.; Xu, Z.; Song, Y. Optimal Planning of PEV Charging Station with Single Output Multiple Cables Charging Spots. IEEE Trans. Smart Grid 2017, 8, 2119–2128. [Google Scholar] [CrossRef]
- Dong, X.; Mu, Y.; Jia, H.; Wu, J.; Yu, X. Planning of Fast EV Charging Stations on a Round Freeway. IEEE Trans. Sustain. Energy 2016, 7, 1452–1461. [Google Scholar] [CrossRef]
- Zhang, H.; Tang, W.; Hu, Z.; Song, Y.; Xu, Z.; Wang, L. A method for forecasting the spatial and temporal distribution of PEV charging load. In Proceedings of the 2014 IEEE PES General Meeting|Conference Exposition, National Harbor, MD, USA, 27–31 July 2014; pp. 1–5. [Google Scholar]
- Sattarpour, T.; Farsadi, M. Parking lot allocation with maximum economic benefit in a distribution network. Int. Trans. Electr. Energy Syst. 2017, 27, e2234. [Google Scholar] [CrossRef]
- Lin, X.; Sun, J.; Ai, S.; Xiong, X.; Wan, Y.; Yang, D. Distribution network planning integrating charging stations of electric vehicle with V2G. Int. J. Electr. Power Energy Syst. 2014, 63, 507–512. [Google Scholar] [CrossRef]
- Xiang, Y.; Liu, J.; Li, R.; Li, F.; Gu, C.; Tang, S. Economic planning of electric vehicle charging stations considering traffic constraints and load profile templates. Appl. Energy 2016, 178, 647–659. [Google Scholar] [CrossRef]
- Yao, W.; Zhao, J.; Wen, F.; Dong, Z.; Xue, Y.; Xu, Y.; Meng, K. A Multi-Objective Collaborative Planning Strategy for Integrated Power Distribution and Electric Vehicle Charging Systems. IEEE Trans. Power Syst. 2014, 29, 1811–1821. [Google Scholar] [CrossRef]
- Deb, S.; Tammi, K.; Kalita, K.; Mahanta, P. Review of recent trends in charging infrastructure planning for electric vehicles. WIREs Energy Environ. 2018, 7, e306. [Google Scholar] [CrossRef]
- Kazemi, M.A.; Sedighizadeh, M.; Mirzaei, M.J.; Homaee, O. Optimal siting and sizing of distribution system operator owned EV parking lots. Appl. Energy 2016, 179, 1176–1184. [Google Scholar] [CrossRef]
- Shojaabadi, S.; Abapour, S.; Abapour, M.; Nahavandi, A. Optimal planning of plug-in hybrid electric vehicle charging station in distribution network considering demand response programs and uncertainties. IET Gener. Transm. Distrib. 2016, 10, 3330–3340. [Google Scholar] [CrossRef]
- Pazouki, S.; Mohsenzadeh, A.; Haghifam, M.R. Optimal planning of parking lots and DLC programs of Demand Response for enhancing distribution networks reliability. In Proceedings of the 2014 IEEE PES General Meeting | Conference & Exposition, National Harbor, MD, USA, 27–31 July 2014; pp. 1–5. [Google Scholar]
- Deb, S.; Tammi, K.; Kalita, K.; Mahanta, P. Impact of Electric Vehicle Charging Station Load on Distribution Network. Energies 2018, 11, 178. [Google Scholar] [CrossRef]
- Sadeghi-Barzani, P.; Rajabi-Ghahnavieh, A.; Kazemi-Karegar, H. Optimal fast charging station placing and sizing. Appl. Energy 2014, 125, 289–299. [Google Scholar] [CrossRef]
- Hayajneh, H.S.; Salim, M.N.B.; Bashetty, S.; Zhang, X. Optimal Planning of Battery-Powered Electric Vehicle Charging Station Networks. In Proceedings of the 2019 IEEE Green Technologies Conference (GreenTech), Lafayette, LA, USA, 3–6 April 2019; pp. 1–4. [Google Scholar]
- Dharmakeerthi, C.H.; Mithulananthan, N.; Saha, T.K. Planning of electric vehicle charging infrastructure. In Proceedings of the 2013 IEEE Power Energy Society General Meeting, Vancouver, BC, Canada, 21–25 July 2013; pp. 1–5. [Google Scholar]
- Awasthi, A.; Venkitusamy, K.; Padmanaban, S.; Selvamuthukumaran, R.; Blaabjerg, F.; Singh, A.K. Optimal planning of electric vehicle charging station at the distribution system using hybrid optimization algorithm. Energy 2017, 133, 70–78. [Google Scholar] [CrossRef]
- Moradi, M.H.; Abedini, M. A combination of genetic algorithm and particle swarm optimization for optimal DG location and sizing in distribution systems. Int. J. Electr. Power Energy Syst. 2012, 34, 66–74. [Google Scholar] [CrossRef]
- Zheng, Y.; Dong, Z.Y.; Xu, Y.; Meng, K.; Zhao, J.H.; Qiu, J. Electric Vehicle Battery Charging/Swap Stations in Distribution Systems: Comparison Study and Optimal Planning. IEEE Trans. Power Syst. 2014, 29, 221–229. [Google Scholar] [CrossRef]
- Lam, A.Y.S.; Leung, Y.; Chu, X. Electric Vehicle Charging Station Placement: Formulation, Complexity, and Solutions. IEEE Trans. Smart Grid 2014, 5, 2846–2856. [Google Scholar] [CrossRef]
- Davidov, S.; Pantoš, M. Planning of electric vehicle infrastructure based on charging reliability and quality of service. Energy 2017, 118, 1156–1167. [Google Scholar] [CrossRef]
- Liu, Z.; Wen, F.; Ledwich, G. Optimal Planning of Electric-Vehicle Charging Stations in Distribution Systems. IEEE Trans. Power Deliv. 2013, 28, 102–110. [Google Scholar] [CrossRef]
- Luo, L.; Gu, W.; Zhou, S.; Huang, H.; Gao, S.; Han, J.; Wu, Z.; Dou, X. Optimal planning of electric vehicle charging stations comprising multi-types of charging facilities. Appl. Energy 2018, 226, 1087–1099. [Google Scholar] [CrossRef]
- Hajimiragha, A.H.; Canizares, C.A.; Fowler, M.W.; Moazeni, S.; Elkamel, A. A Robust Optimization Approach for Planning the Transition to Plug-in Hybrid Electric Vehicles. IEEE Trans. Power Syst. 2011, 26, 2264–2274. [Google Scholar] [CrossRef]
- Kenny, J.; Desha, C.; Kumar, A.; Hargroves, C. Using biomimicry to inform urban infrastructure design that addresses 21st century needs. In Proceedings of the 1st International Conference on Urban Sustainability and Resilience, UCL London, London, UK, 5–6 November 2012; pp. 18–30. [Google Scholar]


© 2019 by the authors. Licensee MDPI, Basel, Switzerland. This article is an open access article distributed under the terms and conditions of the Creative Commons Attribution (CC BY) license (http://creativecommons.org/licenses/by/4.0/).