In this section, the authors collected and examined LCA studies applied to PV-based electricity systems.
The studies are divided for PV generations. All studies are described in order to identify and underline the energy and environmental impacts of the examined technologies, the environmental hotspots and methodological key issues.
3.1. Energy and Environmental Impacts of PV Solar Cells
3.1.1. First Generation Solar Cells Review
In the following, different LCA studies applied to the first generation PVs are described, focusing of the methodological assumptions and calculated environmental indicators and results.
Fukurozaki et al. [
26] examined a 1.2 kW
p sc-Si PV (efficiency of the cell of 15.3%) mounted on a rooftop, in Brazil. The authors considered separately all processes, from metallurgical silicon grade (MG-Si) production to panel fabrication, including transportation, installation, and operation. BOS (including supporting structure, inverter and cabling) was considered too. They excluded the decommissioning stage. The lifetime (LT) of the panel, structure, and cabling was 30 years, while the inverter LT was 15 years. The main results regarded cumulative energy demand (CED), energy pay Back Time (EPBT), Global Warming Potential (GWP) and CO
2 emission rate. CED was 1619 MJ/m
2 of panel area. The most energy intensive processes were the purification of MG-Si (3133 MJ), the mounting construction (2632 MJ) and the panel assembling (2468 MJ). GWP for the entire PV system life cycle was 843 kg CO
2eq; the main hotspots were the panel production phase (159 kg CO
2eq) and the construction phase (151 kg CO
2eq). The EPBT and CO
2 emission rate were calculated for different Brazilian locations, characterized by different latitudes and irradiations (from 1506 to 1935 kWh/m
2/year). The highest EPBT value was about 3.13 years while the lowest was 2.47 years; CO
2 emissions rate ranged from 14.54 kg/kWh to 18.68 kg/kWh.
Kim et al. [
27] evaluated the environmental performance of sc-Si and mc-Si panels with power conditioning system (PCS) and BOS, in Korea. The system boundaries were defined as pre-manufacturing, manufacturing, use and disposal stages. The authors considered two scenarios for the PV efficiency: a base scenario (efficiency: sc-Si 15.95%; mc-Si 14.91%) and a best scenario (efficiency: sc-Si 27.60%; mc-Si 20.40%). The results related to GWP in the base scenario showed that sc-Si and mc-Si systems emit 41.8 g CO
2eq and 31.5 g CO
2eq, respectively. The best efficiency case could reduce the GWP of the sc-Si and mc-Si systems by 34.3% and 20%. The major contributors in terms of CO
2eq (concerning only silicon module manufacturing phase) were the mc-Si and ingot manufacturing processes, due to the electricity required for the purification of mc-Si and for the crystallization process of the ingot. The EPBT of the sc-Si and mc-Si PV systems in the base efficiency case were 4.65 years and 3.68 years, while in the best efficiency case were 3.11 years and 2.97 years. Authors calculated fossil-fuel consumption and CO
2 payback time (CO
2PBT). The sc-Si and mc-Si PV systems in the base case consumed 0.56 MJ and 0.44 MJ of fossil fuels per kWh, while in the best case there was a reduction of 33% and 19.3%, respectively. CO
2PBT values for the base scenario were 2.53 years (sc-Si) and 1.91 (mc-Si), while for the best case were 1.66 years and 1.53 years, respectively. A sensitivity analysis regarding GWP was performed with different irradiations (1301.35–1700 kWh/m
2/years); the results showed that the increase of irradiation allowed a GWP reduction of 26% and 22% for base case, and a reduction of 22% and 24% for best case (for sc-Si and mc-Si, respectively).
Stylos and Koroneos [
28] estimated the GHG emissions caused during the life cycle of a large-scale grid connected PV system (PV modules, inverters, batteries, and steel foundation), using a cradle to use approach (from raw material extraction to module fabrication and use). They analyzed four different scenarios of manufacturing a mc-Si panel, with cell efficiency variable from 14% to 20%. The emissions obtained ranged from 12.28 to 58.81 g CO
2eq/kWh
e. In the end, a comparison with CO
2eq emissions of a diesel power station was made, showing that carbon footprints of PV systems were lower than diesel power station in every scenario.
Fu et al. [
29] performed a LCA for a PV system with mc-Si modules in China. They calculated EPBT and environmental impacts as GWP, acidification potential (AP), eutrophication potential (EP), ozone layer depletion potential (ODP), photochemical ozone creation potential (POCP), and human toxicity potential (HTP), from materials extraction to cell and module fabrication. The authors did not take into account the end-of-life (EoL), due to a lack of accurate data in China about the disposal phase and BOS. The total primary energy demand (PED) from renewable and non-renewable energy was calculated as 0.517 MJ/kWh (48.5% due to mc-Si production stage), while the worst EPBT was 6 years, considering different areas of China. The mean value was approximately 2 years. As concern environmental impacts, AP was 4.27 × 10
−4 kg SO
2eq/kWh (73.4% due to sulfur dioxide caused by electricity consumption) and EP was 4.23 × 10
−5 kg PO
43−eq/kWh (mainly due to emissions of nitrogen oxides and phosphate). The calculated GWP of the PV system was 5.09 × 10
−2 kg CO
2eq/kWh; the main contributor to GWP was the carbon dioxide (83.6%). HTP index was 17.76 × 10
−2 kg DCB
eq/kWh (dominated by the emissions on air and freshwater (FW)); ODP was 3.02 × 10
−9 kg R11
eq/kWh (dominated by Halon 1301/1211 and carbon tetrachloride) while POCP was 2.69 × 10
−5 kg C
2H
4eq/kWh (mostly caused by inorganic and organic emissions to air). Comparing the environmental impacts of each process, the authors found that the production of solar grade mc-Si contributed the most, accounting for about 52.4% of the total impacts. The next were the manufacturing processes of cells and modules, accounting for 20.1% and 18.6%, respectively. Moreover, a sensitivity analysis was conducted to find out the effects on the energy demand and environmental impacts of different factors (electricity and steam consumption during the production of solar grade mc-Si, glass consumption, and disposal during the process of wafer slicing, electricity consumption during the process of cells, aluminum and glass consumption during the modules assembly). It emerged that a 10% decrease in electricity consumption during solar grade mc-Si production would lead to a 3.37% drop in PED, 3.97% in AP, 3.81% in EP, 3.56% in GWP and 3.21% in POCP; a 10% reduction of aluminum consumption, during the module assembly phase, would lead to a 7.01% drop in ODP. A 10% decrease in glass consumption and disposal during wafer slicing process would lead to a decrease of 2.11% on HTP while a 10% decrease in steam consumption would lead to a decrease ranging from 0.46% (EP) to 1.06% (AP).
A work by Yang et al. [
30] for a mc-Si PV module in China focused on international trade, which played a significant role in the development of the Chinese PV industry, and distinguished domestic and imported raw materials. The authors underlined the importance of international trade because it causes the separation of consumption and production of PV products, which are two important phases with different environmental impacts. They considered three scenarios: scenario 1 (baseline), in which all materials were assumed to be produced in China and international trades were ignored; scenario 2, in which mc-silicon was imported as raw material, and scenario 3, that accounted for the market share of all raw materials from various sources. For a better comparison with other previously reported study, only the manufacturing phase was considered. The following impacts were calculated: GWP
100, abiotic depletion potential (ADP), AP, EP, HTP, freshwater aquatic eco-toxicity potential (FAEP), marine aquatic eco-toxicity potential (MAEP), terrestrial eco-toxicity potential (TETP), ODP and POCP. GWP was 2.91 × 10
+3 kg CO
2eq for scenario 1 and around 2.22 × 10
+3 kg CO
2eq for scenarios 2 and 3; the difference lie in the fact that imported mc-Si manufacturing requires less energy than local production. Mc-Si production was the GWP “hotspot” of the entire process. However, PV module packaging was also a major contributor to GWP. These processes accounted for 52% and 29% of GWP in scenario 1, 38% and 38% in scenario 2, and 39% and 38% in scenario 3. Other results of the first scenario are shown in
Table 4.
The manufacturing of PV modules in scenarios 2 and 3 allowed reducing impacts for 8 of 10 factors considered; in particular, scenario 2 was similar but never better than scenario 3. Scenario 1 was a better option for ADP and ODP, but the worst option for all other impacts compared to scenarios 2 and 3. Similar to GWP, the processes of mc-Si production and PV module packaging were the major hotspots for all impacts, except for MAEP and FAEP, in which heavy metals were also significant.
Hong et al. [
31] evaluated the life cycle environmental effects associated with PV cell (mc-Si) in China. System boundary was set by using a cradle to gate approach. The method used (IMPACT2002+) considered 15 mid-points impact categories, which are presented in
Table 5.
The production of mc-Si PV cell had a significant contribution to the impact scores in RI, GWP and non-renewable energy but represented a small role to the impact scores in CNG, NCG, and TETP. The contribution of mc-Si PV cell production in the remaining categories was negligible. The results of a sensitivity analysis showed that more than 25% of overall environmental burden could be reduced by improving energy efficiency, choosing secondary aluminum for mc-Si production, and reducing mc-Si wafer consumption for PV cell production.
Latunussa et al. [
32] analyzed an innovative process for the recycling of silicon PV panel, considering that this phase is generally neglected, and that disposal phase will become a relevant environmental issue in the future. The analysis followed a “gate to gate” approach, considering all the impacts from the delivery of the waste to the recycling plant, up to the sorting of the different recyclable materials and the disposal of residues. The impacts of the recycling process of 1000 kg of silicon PV waste are shown in
Table 6.
All these impacts were calculated excluding the credits derived from the energy recovery. The credits related to this energy recovery were significant (around 30%) for impact categories as ODP, IR (ecosystems), IR (HH), CC, AE and PM; CED could also be reduced from 3150 MJ to 2780 MJ. The results also highlighted that most of the impacts for the recycling process are due to the transport of the PV waste to the site, the plastic incineration, and the further treatment for the recovery of metals from the bottom ash.
Hou et al. [
33] investigated the environmental impacts of grid connected power generation from c-Si PVs. The authors included BOS and the fossil fuel burned in transportation and assembly. The results were expressed in terms of EPBT and GHG. EPBT ranged from 1.6 and 2.3 years while GHG ranged from 60.1 to 87.3 g CO
2eq/kWh; about 84% or even more of the energy consumption and total GHG emission derived from the PV manufacturing process. Also, authors underlined that an improvement in efficiency (from actual 16–18% to 22% or higher in the future) could be obtained for the examined c-Si by applying passivated emitter rear locally-diffused (PERL) or heterojunction with intrinsic thin layer (HIT) cell, and this could lead to a GHG emission of 47.5 g CO
2eq/kWh.
Akinyele et al. [
34] evaluated the life cycle impacts of a 1.5 kW solar PV system. In particular, they examined the life cycle emission rate (LCER), GWP, CED, EPBT, and net energy ratio (NER) of six different locations in Nigeria, one for each of the geo-political zones. The different results were dependent from the different radiations of the zones. LCER ranged from 37.3 to 72.2 g CO
2/kWh and CED from 380 to 8700 MJ
eq, GWP ranged from 1907 to 5819 kg CO
2eq, EPBT from 0.82 to 2.3 years and NER from 7.08 to 30.17.
Huang et al. [
35] considered the life cycle environmental impacts of an mc-PV system in China, with a particular focus on decommissioning and recycling phases. Recycling phase included the dismantling of the modules and the processes connected to main elements like glass (re-melting of glass), ethylene vinyl acetate (EVA) (thermal treatment of EVA), and the chemical treatment of aluminum, argentum, and silicon. The functional unit (FU) (The functional unit is the element of LCA to which all inputs and outputs of the studied system refer. Therefore, when comparing two different systems, the same functional unit must be used.) was a mc-Si PV module with a capacity of 1 kW, containing five 200 W
p modules. The authors calculated 14 midpoint environmental impacts, considering the production and recycling phases; they only excluded transportation and use phases from the analysis. The 14 environmental impacts were normalized for each process, and a comparison of two different scenarios (landfill and recycling) was made. Mc-Si production, cell processing, and module assembly were the phases with the highest environmental impacts. Focusing on the EoL, the recycling scenario showed fewer environmental impacts than the landfill scenario: even if dismantling of the modules and the treatment of the main elements in the recycling process had a certain environmental burden, their contribution was still lower than the landfill scenario.
Luo et al. [
36] made a comparative LCA of PV electricity generation in Singapore by three different mc-Si PV configurations. The FU was one 60-cell silicon PV module and the system boundary was from the mining of silica to the PV system installation. The indicators for evaluating the environmental impacts were EPBT and GHG emissions. The three different roof-integrated PVs consisted in: (1) an aluminum back surface field (Al-BSF) solar cells with a conventional module structure (i.e., glass/encapsulant/cell/encapsulant/back-sheet), (2) a passivated emitter and rear cell (PERC) device with a conventional module structure and (3) a PERC solar cell with a frameless double-glass module structure (i.e., glass/encapsulant/cell/encapsulant/glass). For the examined scenarios the EPBTs were 1.11, 1.08 and 1.01, respectively, while the GHG emissions were 30.2, 29.2, and 20.9 g CO
2eq/kWhe, respectively.
All main results, key-parameters (panel type, PV system, module size, geographical location, efficiency) and methodological aspect (FU, system boundaries and impacts assessment methods) of the above studies are summarized in
Table 7.
3.1.2. Second Generation Solar Cells Review
The second generation (or thin film PVs) includes low thickness solar cells manufactured by the deposition of semiconductor layers on solid and low-cost substrates of glass, plastic, or metal. The semiconductor layer can be made with a compound of different materials such cadmium, indium, gallium, tellurium, and copper. These materials are less expensive to manufacture than pure silicon, but geographically concentrated only in some areas and, in some cases, are hard to mine [
37].
Mohr et al. [
38] studied the environmental effects of the substitution of fossil electricity with solar electricity from PVs installed in Western Europe into the life cycle of two types of PV modules: a thin film GaInP/GaAs tandem module (efficiency 28.5%) and a classic mc-Si module (efficiency were 14.4%). The study considered two scenarios: scenario 0, in which the environmental impacts of each module were calculated using electricity generated by fossil fuel (hard and brown coal, industrial and natural gas, oil and peat) and scenario S, based on the assumption that the amount of fossil electricity needed in the life cycle of each modules was replaced with the electricity generated by the corresponding module. The authors found that, for both modules, the impact categories that had greater benefit from the substitution of fossil electricity with PV electricity were ADP, AP, GWP, MAEP and POCP. For the GaInP/GaAs module, the impact scores decrease up to a factor of 4.9 (GWP), while for the mc-Si module the impact scores decreased up to a factor of 2.5 (ADP and GWP). The impact categories connected with toxicity were smaller or negligible, comparing the two scenarios. In fact, there is the overlap of a benefit due to the reduction in the use of fossil fuels and of a negative aspect related to the increase in materials (chromium steel for GaInP/GaAs and aluminum for mc-Si module, in particular) for the production of additional PV modules to generate the necessary electricity.
Van der Meulen and Alsema [
39] focused on novel applications of nano-crystalline silicon (nc-Si) materials combined with a-Si devices. In this case, PV module operated in a grid-connected system and it was installed on a rooftop in Southern Europe. The authors examined the life cycle of a-Si and the environmental effects of adding nc-Si layer (this approach it is called “micromorph” technology); they also considered two different clean-processes (with SF
6 and NF
3) during the module manufacturing phase and two different efficiency values: micromorph module efficiency was 8.5%, while the best amorphous efficiency was 6.7%. Despite this high efficiency, the use of the new technology resulted in higher material (17–20-times higher) and total energy requirements (45% higher). GHG emissions for a-Si cells were lower than 40 g CO
2eq/kWh, while they were more than 70 g CO
2eq/kWh for nc-Si/a-Si cells (micromorph technology). Authors also considered improvement scenarios (most likely, optimistic and Oerlikon Solar process) that included an increase of process yield factor from 70% to 93%, a reduction of thickness bottom layer (from 2000 to 1300 nm). And an improvement in NF
3-gas utilization. In all scenarios, a-Si technology showed GHG lower than 30 g CO
2eq/kWh, while for the combination of nc-Si/a-Si cells, GHG emissions were always higher than 40 g CO
2eq/kWh except for optimistic and Oerlikon process with SF
6 clean processing. In conclusion, GHG emissions for the micromorph technology resulted in a 60–85% increase for NF
3 clean processing and 15–90% in SF
3 clean processing, compared to a-Si technology. In addition, the authors found that the use of NF
3 lead to higher GHG emissions in comparison with SF
6, in particular when production of NF
3 and cleaning process are applied to micromorph technology.
A study of environmental indicators and EPBT of CdTe PV systems was made by Held & Ilg [
40]. They considered a ground-mounted power plant in Europe, with an efficiency of 10.9%. The authors calculated GHG emissions and EPBT index. EPBT was from 0.7 to 1.1 years, while GHG emissions ranged from 19 to 30 g CO
2eq, depending on the location site. Through CML2001 method, another five impact indices were evaluated in this study: primary energy from resources (PE), AP, EP, GWP, and POCP. The results are shown in
Table 8.
Kim & Fthenakis [
41] made a comparative LCA about energy payback of two different technologies (multi-junction a-Si and nc-Si/a-Si modules). The authors used a cradle-to-gate approach, considering only the production phase (no recycling or disposal); they adopted an efficiency of 6.3% for the present, and 8% for future applications. Nc-Si/a-Si modules required an amount of energy between 750 to 1270 MJ/m
2, while triple-junction module required 860 MJ/m
2. EPBT (nc-Si and a-Si) was 0.7–0.9 years, while triple junction EPBT was 0.8 years.
Mohr et al. [
42] made a LCA study of tandem flexible solar cells composed of a-Si/nc-Si (10% efficiency). The authors also made a comparison between the a-Si/nc-Si PV system roof-integrated and the roof-mounted mc-Si PV system (14.4% efficiency), both in the Netherlands with an annual insulation of 1000 kWh/m
2. EPBT for a-Si/nc-Si PV system was 2.3 years and 3.4 for mc-Si system, while CED was 1.4 MJ/kWh for both systems. The authors calculated 18 midpoint indices and assessed endpoint level considering the damage to human health, to ecosystem and to resources depletion. The overall damage scores of the a-Si/nc-Si PV system and the mc-Si PV system were 0.012 and 0.010 Ecopoints/kWh, respectively; CC, HTP, PM formation, and FD contributed to 96% of the overall damage scores for both PV systems.
Kreiger et al. [
43] examined a process to reduce the consumption of silane during the manufacturing of two types of PV: a hydrogenated amorphous silicon (a-Si:H) based PV and a tandem (a-Si:H/µc-Si:H) with a thin film technology-based PV. The inventory data were based on US and European input data, while the approach used was “cradle to gate”. Then, a comparison between recycling and no recycling was made. By using a recycling process, the energy consumption decreased (per kg of silane used) from 1146 to 409 MJ for a-Si:H and to 397 MJ for the tandem module a-Si:H/µc-Si:H. The GHG emissions decreased (per kg raw silane) from 61.3 kg CO
2 to 22 kg CO
2 for a-Si:H and to 21.2 kg CO
2 for the tandem module a-Si:H/µc-Si:H.
Regarding the importance of the EoL phase, a LCA study of a new treatment based on mechanical process and recycling system, for TFSC, was performed by Giacchetta et al. [
44]. In this study, only the EoL phase of a CdTe module was taken into account. The analysis, based on Impact 2002+ methodology, allowed underlining the advantages of this recycling process that resulted in a reduction of all impacts categories compared with incineration, except for IR and LO. Mainly, advantages were connected to glass (the element mostly used in the realization of the PV module), cadmium telluride, and cadmium sulphide recovery, which contributed positively to the reduction of GWP and the consumption of non-renewable energy.
Collier et al. [
45] examined two new promising thin-film technologies: copper zinc tin sulphide (CZTS or CuZnSnS
4) and zinc phosphide (Zn
3P
2). The authors assumed an electricity mix from United States and an efficiency of 10% for both panels. The approach used was a “cradle to gate” and the life cycle impact assessment (LCIA) method was TRACI 2.1. For all four impacts studied (PED, GWP, FW use and eco-toxicity (Ex)), a comparison between the new thin-film PVs (Zn
3P
2 and CZTS), the “old” thin film PVs (a-Si, CdTe, CIGS), and the c-Si PVs (sc-Si and mc-Si) was made. The results are shown in
Table 9.
CdTe and Zn3P2 had similar impacts and outperformed CIGS and CZTS. The impacts from CdTe were slightly greater than that of Zn3P2, except for GWP. When compared with Si-based PV, all the four thin film technologies outperformed sc-Si and mc-Si on impacts as Ex and FW use. CdTe and Zn3P2 performed better for GWP and PED and had impacts similar to a-Si cell. Regarding the dominance analysis, the manufacturing phase was the biggest contributor for all the technologies.
Bergensen et al. [
46] performed a hybrid LCA to compare environmental, HH, and natural resource consequences of electricity generated by CIGS and CdTe technologies, in the United States. The authors developed two life cycle inventories for ground-mounted utility scales and roof-mounted distributed-scales PV systems. It was considered a present efficiency (2010) of 12% for CIGS and 11.6% for CdTe and a future improvement (for 2030) to 20.8% and 19%, respectively. In addition, a reduction of thickness was considered for the future scenario. The results showed that the impact categories were similar for both ground-mounted alternative, except LO (since roof-mounted PV use no land directly). The environmental impacts of U.S. thin-film PV technology was at least 90% lower than those of the U.S. grid mix in seven of 12 categories (AP, GHG, FD, respiratory effects, photochemical oxidation (POx), Ex and EP). In particular, CdTe and CIGS were estimated to emit 20 and 22 g of CO
2eq/kWh in the present scenario. Considering future scenario, life cycle GHG emissions from CdTe and CIGS were reduced by 69% compared to their 2010 estimates, to 6 and 7 g of CO
2eq/kWh, respectively.
Lunardi et al. [
47] made a comparative LCA of chalcogenide/Si tandem solar modules and they investigated the environmental performances of CIGS/Si, CZTS/Si and AZTS/Si tandem solar cells, compared with Si solar modules. The efficiency of these modules was 22% and a complete cradle to grave approach was used. The results are shown in
Table 10. Si and CIGS/Si presented the worst impacts for most of the examined categories.
In a recent study, Rajput et al. [
48] evaluated EPBT, energy production factor (EPF) and life cycle conversion factor (LCCE) of a 3.2 kW CdTe PV system in India. The efficiency of the cell was 11%. Results showed that EPBT was 3.6 years, EPF was 0.27 and LCCE was 0.0018. These results were compared with some of the studies discussed in this chapter [
27,
40], founding that EPBT was higher than the other cases. Anyway, all studies differed for location, total capacity installed and, only in two cases, the comparison regarded the same technology (CdTe).
All main results, key-parameters (panel type, PV system, module size, geographical location, efficiency), and methodological aspects (FU, system boundaries and impacts assessment methods) of the above studies are summarized in
Table 11.
3.1.3. 3rd Generation Solar Cells Review
The third generation PV refers to all the innovative non-silicon based solar cells that have been developed to overcome the dependency on traditional semiconductors for PV electricity generation. Furthermore, these technologies aim to achieve higher efficiency and reduce cost per watt peak, compared to previous generations [
49,
50]. Since third generation solar devices have proven their PV performances on the laboratory scale, or their functioning at prototype level only, most of the following studies are quite recent. In addition, many of these technologies have not yet reached the right technological maturity (in terms of efficiency and lifetime) for entering the PV market or diffusion on a wide scale.
The first two works analyzed in this section regarded organic solar cell. The first one [
51] was based on the LCA of a typical heterojunction organic cell (LT 15 years) on laboratory scale manufacturing. The analysis was quite complex, due to the fact that the authors analyzed every fabrication step in-depth and the life cycle of all different materials used in the various layers. The results were shown for module efficiency of 5% (efficiency for laboratory cells) and 10% (expected industrial efficiency in 2020). Calculated EPBT were four and two years, CO
2 emission factors were 109.94 g CO
2eq/kWh
e and 54.92 g CO
2eq/kWh
e, and ERF were 3.75 and 7.49, respectively, for the two efficiency values. The PE consumption for 1 m
2 of this organic solar module (90% active area) was 2800 MJ; more than 70% referred to direct process energy (in particular the energy for N
2 atmosphere maintenance) while 25% was attributable to embodied energy cell input materials (indium tin oxide (ITO) and nitrogen were the two main hotspots).
In the second study [
52] authors studied a single junction organic solar cell, using different active layers and various combinations of typical donor/acceptor materials, focusing in particular on the role of polymer (the donor material) and fullerene (electron acceptor molecule). The results showed that EPBT ranged from 0.3 to 0.7 while PE ranged from 4 to 7 MJ/W
p, depending on the active materials required. BOS was not considered in the calculations and no device degradation was assumed. Degradation factor is an important aspect of OPV studies, so this might cause an increasing of the calculated EPBT. ITO coated/PET showed a relative high embodied energy (63.45 MJ/m
2) compared to the other components (aluminum contacts and encapsulation, 0.048 MJ/m
2 and 43.5 MJ/m
2 respectively), while the embodied energy of fullerenes was strongly variable (from 65 to 495 GJ/kg depending on the production method and on fullerenes structure). The main difference between fullerene production techniques (pyrolysis and plasma) is attributable to the electricity and inert gas (argon and helium) required for plasma technique. For this reason, the authors suggested the use of this technique in low-cost electricity areas, or where there are limitations connected to the combustion by-products from the pyrolysis technique.
Sengul and Theis [
53] evaluated the environmental impacts of QD-PV considering raw materials acquisition, manufacturing, and use phases. The results of this analysis were compared with literature data of different types of PVs (ribbon mc-Si, mc-Si, sc-Si, CdTe, CIS, DSSC) and with other energy sources like coil, oil, lignite, natural gas, diesel, nuclear, wind, and hydropower. The authors calculated for QD-PV an EBPT (1.5 years), GWP (5 g CO
2eq/kWh), and CED (286 kWh
eq/m
2). The EBPT of QD-PV was shorter than the other PV types except for CdTe, while it was of the same order of EPBT of coal, natural gas, and nuclear, lower than the EPBT of lignite and higher than the EPBT of wind and hydropower. Regarding the GWP, considering an estimated efficiency of 14%, QD-PV modules had lower GWP than all PV types, coil, oil, lignite, natural gas and diesel, but higher than nuclear, wind and hydropower energy sources. In addition, QD-PV showed the lowest SO
x (≈25mg SO
x/kWh) and NO
x emissions (≈12 mg NO
x/kWh), with the exception of nuclear, wind, and hydropower, while heavy metal emissions were the highest compared to all other types of PV modules, and the lowest compared to the others energy sources. The main contributors to the energy requirement of QD-PV modules (including PV frame and BOS) were the encapsulation and protection of solar cells (42%), as well as the production of QD solar cells (33%) and BOS (21%). At last, hazardous waste disposal, ITO and aluminum foil production were the processes that highly contributed to heavy metal emissions for QD cells production.
Espinosa et al. [
54,
55], in two different works, made an LCA of flexible polymer solar cells prepared using the roll-to-roll method. Both assessments were based on a cradle to gate approach and the same functional unit (1 m
2 of processed surface). In the first work [
54], the analysis regarded a full roll-to-roll process for the fabrication of flexible polymer solar cell modules. Authors considered an organic solar module efficiency of 2% and 3%. Results were expressed in terms of EPBT that was 2.02 and 1.35 years, respectively; CO
2 emissions were 56.65 g CO
2eq/kWh
e and 37.77 g CO
2eq/kWh
e, while embodied CO
2 was 15.49 kg CO
2eq. The PE consumption of 1 m
2 of processed surface (active area 67%) was 379 MJ, distributed to direct process energy (77 MJ) and embodied energy of input materials (302 MJ); the main contributor to this value was ITO on PET substrate (87%). The authors also showed how EPBT and ERF changed with efficiency (from 1.25% to 10%) and active area (50%, 67%, 85%). When efficiency was increased from 1.25 to 10, EPBT decreased from 4.34 to 0.54 years (active area 50%), from 3.24 to 0.4 years (active area 67%), and from 2.55 to 0.32 years (active area 85%). In the same way, ERF increased from 3.36 to 27.66 (active area 50%), from 4.63 to 37.07 (active area 67%), and from 5.88 to 47.03 (active area 85%). The EPBT of the organic cell produced with this roll-to-roll process was in line with the EPBT of dye sensitized modules (0.74–2.1 years, 10% efficiency) but higher than flexible OPV (0.19 years, 5% efficiency). In the second work [
55], the authors analyzed a new process allowing for the replacement of the ITO electrode in organic modules. The main problem of ITO electrode is indium, a material that could represent a point of congestion for the future of OPV large-scale production. Recycling and EoL scenarios were excluded due to a lack of data, while BOS was not considered. The results showed an EPBT of 9.45 years (1% efficiency; active area 36.7%) but through efficiency optimization it was evaluated that EPBT could fall to 0.94 years (10% efficiency and 36.7% active area). Total equivalent PE consumption per FU (1 m
2 of processed surface) was 486 MJ, where only 55.6MJ was due to direct process energy (silver electrode printed and drying during deposition were the main hotspot); the embedded energy in materials was ten times higher than direct process energy (430.37 MJ). Again, authors showed how EPBT and ERF changed with two parameters (efficiency and active area): when efficiency changed from 1% to 10%, ERF increased from 1.59 to 15.88 (active area 36.7%), from 2.94 to 28.24 (active area 68.1%), and from 3.67 to 36.7 (85% active area); EPBT decreased from 5.31 years to 0.53 years (active area 68.1%) and from 4.09 years to 0.41 years (active area 85%). CO
2eq emission factors were 137.68 g CO
2eq/kWh
e (1% efficiency), 91.79 g CO
2eq/kWh
e (3% efficiency), and 55.07 g CO
2eq/kWh
e (5% efficiency), while embodied CO
2eq was 20.66 kg CO
2eq.
Anctil and Fthenakis [
56] analysed different processes and material for OPV. The main scope of this LCA was to compare CED of different OPV technologies (single junction small molecule, multi-junction and polymer PV) and to evaluate the impact of using different processing conditions (thermal treatments, interface layers, low bandgap polymer, type of heterojunction). The functional unit chosen was the production of a power of 1 watt-peak (W
p). The authors found that fullerenes were the most energy-intensive components of OPV. For this reason, polymer solar cells, that required a high quantity of large fullerenes, had on average a high CED (4.5–5.8 MJ/W
p) compared to the other OPV technologies. Processes and materials used in small molecule PV had a very low impact on CED, compared to polymer PV. In this case, the other components of the system were a hotspot and CED strictly depended on the efficiency and type of small molecule used (CED was 3.6 MJ/W
p for 5% efficiency and 5.9 MJ/W
p for 3% efficiency). Regarding multi-junction devices, the greater efficiency (6.5%) had no noticeable consequence on the CED/W
p that was higher, compared to polymer PV (5–6.1% efficiency), and slightly lower than small molecules PV with 3% efficiency. This result can be explained through the increase of complexity of the devices, as well as the need of additional materials and processes.
Parisi et al. [
57] made a comparison of different DSSC configurations, focusing on manufacturing phase. The following configurations (substrate/electrolyte/counter electrode/substrate) were analyzed:
- -
glass/iquid electrolyte (LE)/ carbon;
- -
glass/ionic liquid electrolyte (ILE)/cobalt sulfide (CoS) PET;
- -
PET/LE/Pt PET; PET/LE/Pt glass;
- -
steel/LE/Pt PET; steel/LE/Pt glass;
- -
glass/ILE/Pt glass; glass/LE/Pt glass.
The results showed that the substitution of glass with PET reduced the environmental burden in all impact categories (CC, HTP, LO, NLT, PM, FD); the use of steel (for the solar cell back contact) was a main contributor in most categories, especially FD and CC (HH). The authors also assessed that the replacement of the platinum cathode with a CoS contributed to lower environmental impacts. Finally, the authors calculated GWP100 and CED; these indices followed the same trend of previous results. In fact, the configuration with steel-LE-Pt glass was the worst for GWP100 (1.1 kg CO2eq) and CED (43 GJ) while PET-LE-Pt PET had the lowest values (GWP100 was 0.2–0.3 kg CO2eq and CED was 10 GJ).
Azzopardi and Mutale [
58] applied LCA to a hybrid QD based solar cell under development. The study was based on laboratory-scale production. Authors compared this solar cell with previous thin film through sustainability criteria results (EPBT, GHG emissions and NER), assuming a 10% efficiency and a LT of 25 years. They did not consider EoL and recycling due to a lack of data. The calculated EPBT was less than half than crystalline technology (1.51 years). Further, the CO
2eq/kWh was lower (2.89 g CO
2eq/kWh). NER was 20.82 for hybrid QD based solar cell (blend type) and 16.66 for hybrid QD based solar cell (variant type). At the end of the work, the authors conducted a sensitivity analysis regarding NER and CO
2eq/kWh, varying LT (from 1 to 10 years) and efficiency (from 1% to 10%). The results showed that lifetimes greater than one year and efficiency higher than 1% are needed for these systems to be less impactful from the energy and environmental points of view.
Espinosa and Krebs [
59] assessed the impacts related to an organic tandem solar cell and compared the architecture of this system with a simpler flexible single device. They found that a tandem device performed approximately 20% better than the single one. The authors considered three different efficiencies (1%, 3%, and 5%) and evaluated an EPBT from 0.24 to 0.3 years and a CED from 43.86 to 51.34 MJ
EPE/m
2. The mid-point categories calculated with CML2001 method were ADP, AP, EP, GWP
100, ODP, TETP, and POx. The environmental hotspots were silver, PET, and electricity. Silver was one of the major drivers of ADP, EP, and TETP, followed by PET and electricity mix. CED for PET and electricity was 16.5 MJ and 14 MJ, respectively.
Parisi et al. [
60] studied the evolution of the sensitized cells from Gratzel prototype to upscale solar application. The evaluated system was mounted on rooftop and the base efficiency considered was 8%. The performances of the PV system was calculated for different irradiations (corresponding to Nord, Centre and South Europe) with a cradle to gate approach, including the synthesis of main components, fabrication of module, and operational phase. During the study, 17 impact indices and CED index were calculated for three different types of dyes: the porphyrin dye YD2-o-C8, the ruthenium-based dye N719 and the organic metal-free dye D5 dye. The calculated mean values of CED were 224.4 MJ (for YD2-o-C8 dye), 111.2 MJ (for D5 dye) and 61.8 MJ (for N719 dye); the single score indicators were 2.08 points (for YD2-o-C8 dye), 0.81 points (for D5 dye) and 1.07 (for N719 dye). The major impact was due to the module support materials, that could be reduced by about of 35% changing from glass to polymeric substrate.
A study of a rooftop grid connected DSSC system was conducted by Parisi and Basosi [
61]. The main scope of the study was the assessment of NER, GWP
100, and EPBT indices. The authors used a cradle to gate approach (no recycling phase) and considered an efficiency of 8%. The results showed a NER of 12.67 (considering a LT of 20 years), an EPBT of 1.58 years and a GWP
100 of 22.29 CO
2eq/kWh. A sensitivity analysis was conducted for all these three parameters. EPBT ranged from 2.11 years to 0.97 years (with efficiency that ranged from 6% to 13%); NER minimum value was 7.30 (efficiency 6%; LT 15 years), while maximum value was 29.41 (efficiency 13%; LT 30 years). In the same way, the corresponding values for GWP
100 were 38.68 CO
2eq/kWh and 9.60 CO
2eq/kWh. The hotspots for the ten environmental indices (ADP, AP, EP, GWP
100, ODP, HTP, FAEP, MAEP, TE and POx) were the manufacturing of single cell (from 37% to 80%) and the electricity production (20% to 45%).
Tsang et al. [
62] examined the environmental impacts of two different OPV solar modules: a default OPV technology (OPV-D) with polymer-based bulk heterojunction with a fullerene derivative and a polymer in its layer, and a second all-polymer technology (OPV-PP), polymer acceptor-polymer donor. The authors wanted to examine how different production integrations, duration use, and disposal routes influenced the environmental impacts of OPV systems. For this reason, they considered two system scenarios, a solar rooftop array (S1) and a portable solar charger (S2), and two different EoL scenarios, namely landfill and incineration. Then, they compared the results with silicon PV technologies: in particular, OPV (D and PP) with mc-Si in S1 scenario (
Table 12) and OPV (D and PP) with a-Si in S2 scenario (
Table 13).
In S1 and S2, for both EoL scenarios, OPV-D and OPV-PP showed better results compared to mc-Si and a-Si results. Finally, a last comparison, concerning relative life cycle impacts, was made between OPV-D (S1 and S2) and m-Si. In S1, OPV-D (incineration) impacts ranged from 97% lower for TETP to 32% lower for AE; the only exception was MD that was 21% higher for OPV-D; in S2, OPV-D impacts ranged from 89% lower for urban LO to 39% lower for TETP.
Celik et al. [
63] performed a cradle to gate (from laboratory to fab) LCA for different PSC structures suitable for low-cost manufacturing (solution, vacuum and HTL-free). They considered an efficiency of 15% (best efficiency of 15.6%). EPBT for this system was 1–1.5 years, while GWP ranged from 100 to 150 g CO
2eq/kWh. Moreover, nine midpoint environmental impact categories were calculated with TRACI method. The environmental impacts of manufacturing processes are showed in
Figure 1 (the values expressed refer to HTL-free process).
For all impact categories, except Ex and ME, the electricity consumption during the manufacturing was a hotspot (50–90%); in particular, electricity consumption reached a contribution of 80% for GWP, HTP, PED, and FW use. The results were compared with some first and second generation devices: the total environmental impacts (when all impact categories were normalized to sc-Si ones) of perovskite devices were higher (solution and vacuum) or similar (HTL-free) to mc-Si solar cells, lower than sc-Si solar cells and quite higher than a-Si, CdTe, and CIS solar cells. Regarding electricity requirements, PSC had higher energy requirements than all other technologies. This result was probably influenced by the lack of data on the production of large-scale perovskite cells, and therefore could be subject to change in the future (the same should happen for the corresponding environmental impacts).
The study by Hengevoss et al. [
64] described an LCA and eco-efficiency analysis of prospective tandem OPV modules (new materials such as nano-sized zinc oxide, nano-sized silver and semiconductor polymer are used; a light management and a new flexible PET based encapsulation with organic and inorganic barriers). The authors considered a power conversion efficiency of 8% with LT scenarios of 15 and 20 years. The aim of the LCA was to calculate the environmental impacts of this prototype OPV, the EPBT, and GWP for the generated electricity, using two different types of modules (installed on roof top) as benchmark (mc-Si and CdTe). The results for OPV showed that CED was 108–112 MJ
eq/m
2, GWP was 5.7–6 kg CO
2eq/m
2, MD was 0.046–0.056
$/m
2 while Ex was 5.3–6.7 CTU/m
2. The OPV module had an EPBT of 1.6 and 2.5 months when exposed to a southern European irradiation value. Finally, considering CED, Ex, MD and EPBT of CdTe and m-Si, it resulted that 1 m
2 of OPV module represented only 3–10% of 1 m
2 of CdTe and mc-Si modules respectively; EPBT of OPV (installed at façade) was 18–55% of that of the benchmarks and GWP was 12–60% of that of the benchmarks. One of the most contributors to CED of the OPV was encapsulation (20%), followed by the PEDOT:PSS polymer (19%) and light management (13%). Including the whole system (module and BOS), the EPBT of OPV added up to 3.4 and 4.7 months. Considering an optimistic efficiency scenario for OPV (10% power conversion efficiency), GWP decreased by 20% (15 years LT) and by 19.7% (20 years LT) for 1000–1200 kWh/m
2y irradiation, while it decreased by 20% (15 years LT) and 19% (20 years LT) for 1800–2000 kWh/m
2y irradiation.
Zhang et al. [
65] made a comparison of life cycle environmental impacts of different PSC systems. The study focused on the cradle to grave impacts of five typical perovskite solar cells, developed with different materials and manufacturing processes namely: MASnI
3, MAPbI
3, FAPbI
3, CsPbBr
3, and MAPbI
2Cl. The results in terms of primary energy consumption to produce 1 cm
2 of active area of solar cells (process energy) and the embodied energy of materials (landfill scenario) are shown in
Table 14.
The 95% of the embodied energy was from system manufacturing in each solar cell system. The authors selected nine different environmental categories to evaluate the performances of each PSC. Following the previous order (MASnI3, MAPbI3, FAPbI3, CsPbBr3, MAPbI2Cl): ADP was 1.32 × 10⁻⁵, 1.28 × 10⁻⁵, 8.11 ×10⁻⁶, 7.13 × 10⁻⁶, and 8.72 × 10⁻⁶kg Sbeq, while GWP was 49.4, 67.2, 63.1, 41.6, and 49.5 g CO2eq. Other results were not expressed in absolute value but only in normalized graphic form; anyway, it emerged that the different environmental impacts obtained may be attributable to the amounts of organic solvents used in the fabrication of the devices and to the different efficiency values. Considering the manufacturing of 1 cm2 of cell as FU, MAPbI3 and FAPbI3 had the highest impacts, except than ADP; instead, considering the production of 1 kWh as FU, MASnI3 and CsPbBr3 had the highest impacts in all categories. This difference was attributable to the low power conversion efficiency of these cells (only 5.73% and 4.88%) compared to other cells (20% for MAPbI3, 15.56% for FAPbI3, 10.9% for MAPbI2Cl). The production of CO2eq (GWP) connected with the generation of 1 kWh (FU) of electricity was between 2.63 and 6.78 kg CO2eq, following an inverse trend than that of the efficiency of each cell. In addition, gold production made the largest impact contribution to PV systems, so the substitution of this material (with silver or aluminum) could reduce the total environmental impact score.
Lunardi et al. [
66] studied different perovskite/silicon (Si) tandem structure and compared them with three different single junctions PSC (Ag-Au-Al as back electrodes), a sc-Si and a HIT Si cells. They carried out a LCA to evaluate GWP, HTP, AE, FAEP, ADP impacts and the EPBT associated with the three perovskite tandem cells. The differences between these cells were in the materials and in structures. The first two cells used the same HIT Si solar cell for the bottom subcell and the same perovskite structure for the top sub-cell (efficiency of 20%). The third tandem structure used a more common lower cost p-n junction silicon solar cell (efficiency of 16%). All the following results for tandem PSC/Si were calculated in a scenario (20 years) where perovskite solar layer became opaque after 1-year LT, making it impossible for the bottom Si to generate power. Accordingly, it was hypothesized the substitution of materials for perovskite layer every year. The comparison between the environmental impacts of all cells is presented in
Figure 2.
For a different scenario, the most optimistic for perovskite life, the layer remained electrically conductive after one year and no substitution was required: in this case, all impacts categories related to tandem PSC/Si, except HTP (non-cancer effect), resulted in the same order or lower than that of HIT Si. The EPBT for Si p-n junction was 1.6 years, while for Si HIT was two years. The EPBT for perovskite and perovskite/Si tandem solar cell was lower (1.3–1.5 years), compared to both silicon cells.
Another work about PSC was performed by Maranghi et al. [
67]. The authors evaluated the environmental hotspots connected with lab scale fabrication of different PSC configurations, through the harmonization of previous LCA studies of this technology. The PSC configurations analyzed were:
FTO glass/TiO2/MAPbI3/Spiro-OMeTAD/Au and ITO glass/ZnO/MAPbI3/Spiro-OMeTAD/Ag (G1-G2);
FTO glass/TiO2/MAPbI3/Spiro-OMeTAD/Ag (E);
FTO glass/TiO2/MASnI3/Spiro-OMeTAD/Au (S);
FTO glass/TiO2 nanotube (TNT)/MAPbI3/Iodine LE/Pt glass (Z);
FTO glass/SnO2/MAPbI3/CuSCN/MoOx-Al solution and vacuum based (C1-C2);
FTO glass/SnO2/MAPbI3/C-Paste (HTL free) (C3);
FTO glass/TiO2/MAPbI3(Solvent)/Spiro-OMeTAD/Au with four different solvents (AB1-AB2-AB3-AB4).
Considering 1 cm2 as FU and only the manufacturing phase, which takes place in a European area for all cells, five of the above configurations (S, AB1-4) had higher impacts (results were expressed by points in a single score) compared to the others. Only six of 12 categories showed a percentage impact higher than 1%: HTP (cancer and no cancer effects), IR, FE, Freshwater Ex, and MD. S configuration had an impact of 22 mPt (milliPoints), while the impact of AB1–AB4 configurations was around 15 mPt. For the S configuration, the hotspot was the gold in the back contact (two orders of magnitude higher than other configurations) while for AB1–AB4, the hotspot was the direct emission of metallic zinc on water (HTP and FAEP). Then, a comparison of CED (calculated with CED-single score impact method) was made: S configuration was out of scale compared to the other configurations (CED 104 MJ); CED for Z configuration was 2.6 MJ while for E configuration was 1.2 MJ. All remaining configurations showed a CED equal to or less than 1 MJ.
All main results, key-parameters (panel type, PV system, module size, geographical location, efficiency), and methodological aspects (functional unit (FU), system boundaries and impacts assessment methods) of the above studies are summarized in
Table 15.
3.2. Key Parameters
Key parameters are all those elements of the analysis that affect and define a study. Their importance lies in the fact that the choice of these parameters influences the results of the analysis, both environmental burdens or benefits and energy indices. For this reason, it is necessary to carry out a critical analysis when evaluating these factors [
68,
69]. Furthermore, the key parameters allow for more coherent and realistic considerations of different analyses when comparing the results. In the case of PV LCA studies, the key parameters identified during this literature review are:
The importance of key parameters and the way they affect the results are discussed below.
- Efficiency
In the examined works, authors used different efficiencies to evaluate the results of the analysis, specifying if this parameter is measured (referred to commercial or laboratory scale) or estimated. In some cases, when the solar cells had not reached full maturity in terms of performance and efficiency, the authors considered different future scenarios [
33,
41,
46,
51,
54,
61,
63]. They hypothesized a performance improvement of the solar panels and calculated the environmental and energy costs arising from an increased efficiency. In other cases, different efficiency scenarios (base/best) were considered, in order to quantify the influence of this parameter on the results.
Generally, the improvements in the conversion efficiency of a PV system resulted in environmental benefits. This led, for example, to a reduction of GWP, CO
2 emission factor, CO
2PBT, EPBT, and NER. Varying the efficiency of a certain percentage caused the variation of energy and environmental indices, with the opposite sign. This was certainly verified if the other key parameters, such as the LT of module and annual insolation, were left unchanged. For example, considering Korea grid mix, an improvement of efficiency from 15.96% to 27% (for sc-Si and mc-Si) led to a reduction of GWP by 30% and 20%, respectively [
27]. Another example regarded CIGS and CdTe cells: considering a future increase in efficiency from 12% to 20% the reduction is expected to be around 28% for CC, 17% for CNG and 20% for MD. Anyway, when the efficiency improvement was obtained through the lowering of the bandgap (to absorb a maximum of photons in one layer) or using a multi-junction approach, the efficiency increased together with the complexity of devices, so additional processing steps and materials were required [
56]. It was demonstrated by van der Meulen and Anselma [
39] that the transition to a new and efficient technology (in that case from a-Si to micromorph module) does not always allows for a reduction of the environmental impacts. Therefore, it is important that the increase of efficiency significantly to compensate for the extra processing and material requirement, or with no significant changes in module manufacturing. For example, the efficiency of c-Si cells can be changed (from 16–18% to 20–22% or higher) by applying PERL/PERC and HIT, and this technology improvement could lead to a reduction of GHG emissions (3.3% reduction by switching from Al-BSF m-Si cell to PERC and 20–45% by switching from c-Si to HIT and PERL) thanks to the better power output per Watt [
33,
36,
66].
Therefore, a greater efficiency was equivalent to a greater energy produced and this positively influenced EPBT, ERF and other energy indices [
51,
54]. Similar considerations can be made taking into account the active area of the module: the improvement of the percentage of active area causes the reduction of EBPT and the increment of EPE and ERF [
54,
55]. Once again, the problem lies in how the growth of active area is achieved.
- Geographical location: annual insolation and local grid mix
The reference geographical location has consequences both on the irradiation, which influences the performance of the PV system, and on the energy production mix of the country itself, which affects the environmental impacts considered. Considering the annual insolation, many studies analyzed the performances of the PV panel in different sites of installation, assuming different national geographic conditions. These studies [
27,
29,
33,
34] allowed for the assessment of the impact of solar energy potential on the environmental performance of PV systems situated in different locations. Changes in irradiation directly influence the total amount of electricity generated during the life cycle, which is relevant for the energy and environmental impacts and payback time indices of PV systems. For example, Fu et al. [
29] showed how AP and EPBT changed for different peak sunshine hours: for PV systems located in first-class areas (1855.6–2100 peak sunshine hours), AP was 2.65 × 10
−4–3.0 × 10
−4 kg SO
2eq/kWh and EPBT was 2.22–2.52 years; in second-class areas (1625–1855.6 peak sunshine hours) AP was 3.0 × 10
−4–3.43 × 10
−4kg SO
2eq/kWh and EPBT was 2.87–3.36 years, while in fifth-class areas (772.2–1166.7 peak sunshine hours) AP was 4.77 × 10
−4–7.2 × 10
−4 kg SO
2eq/kWh and EPBT was 4–6.02 years. In this case, for the same PV system, the installation site strongly influenced its environmental impacts. Another example was made by Akinyele et al. [
34] that normalized Nigeria’s irradiation of six different areas (NE, NW, NC, SE, SW and SS) by conditions of 1700 and 1800 kWh/m
2/year. Since Nigeria is part of the sub-Saharan African region, most of these locations have a high solar irradiation (>2200 kWh/m
2/year). The results showed that system operating under the NE, NW, NC, SE and SW zones produced about 31, 27, 16, 5 and 12% more energy than under the solar irradiation of 1700 kWh/m
2/year, while the system in the SS zone generated 12% less than under insolation of 1700 kWh/m
2/year. Similarly, the systems in NE, NW, NC and SW produced 24%, 20%, 9%, and 6% more energy than under solar irradiation of 1800 kWh/m
2/year, while the system in the SS zone generates 17% less.
It emerged that locations with high solar radiation were, obviously, the most suitable for the installation of PV systems, especially if the transportation of PV modules did not contribute much to the total primary energy demand and environmental impacts [
29]. Finally, the use of different irradiations helps to understand the influence of this parameter on the performance of the panel and to contextualize the use phase of the device. In addition, it facilitates the comparison with other studies; in fact, this could be an easier way to compare the performances of various panels of different studies, in the same environmental conditions. The geographic location is a key parameter also when the manufacturing of solar devices is examined. The site of production of PV cells is connected with the electricity mix of the reference geographical location and, consequently, this influences the environmental impacts [
40]. For example, the impact related to the production of panels in countries that base their electricity mix on non-renewable energy sources is higher than the one related to countries using alternative renewable or nuclear sources. For this reason, in some of the examined studies, the authors estimated some changes on country’s mix (increase of electricity production from renewables, reduction in the use of fossil fuels, etc.) to assess how this factor affects the environmental and energy performance of the solar panel [
27,
31,
33,
40]. For example, Yang et al. [
30] reported that a 10% decrease of coal’s share in Chinese energy mix would reduce GWP by 8.93% while Kim et al. [
27] calculated that if 0.45% of the Korean grid mix was replaced with mc-Si PV systems (conversion efficiency of 20.30%) the net CO
2eq reduction would be 69.8 MtonCO
2eq.
The geographical position also influences the transport of materials and devices (e.g., transportation of PV modules from the producing area to operating area) [
29] and the way in which raw materials are procured (availability of materials, extraction and transport sites, international trades). In fact, the greater the distance between the place of extraction and processing of the raw material, the greater it will be the environmental burden connected to transport to the place of device production. The same applies to the transport from the production place to the place of use. A particular aspect of this regards the international trade of raw materials that cause the separation of environmental impacts among the countries involved in the trade. In this case, the assessment is more complex and only few studies have analyzed these aspects in detail. For example, Yang et al. [
30] found that increasing imports of silicon would improve the environmental performance of PV module manufacturing in China. In particular, a 10% increase in the Chinese market share of imported multi-crystalline silicon would reduce GWP by 1.86%. The reasons for these results can be explained by considering that the manufacturing of Si is an energy intensive process and China’s energy mix is mainly coal-based. They also calculated that 82.4% of GHG emissions were attributable to the export of PV modules to other countries. This has a beneficial effect on the energy production of the world (zero emissions for use phase) but caused a relevant environmental burden in China.
- The PV system: BOS
The PV cells are only a part of the whole PV system; in fact, to make a PV installation work properly, accessory elements to compound the modules and structures to support PV modules are essential.
BOS is the set of electrical equipment like cables, switches, inverters, control and measurement systems, batteries and panel fixing structures. In the analyzed studies, BOS is included or not in the assessment. In addition, depending on the specific case, it may be considered as a key element, or not. The impact associated with BOS can be negligible for the first generation PV because the impacts related to the production of the solar cells or modules were generally much higher: according to different studies, the impacts connected to BOS were lower in most of the impact categories. For example, considering GWP and CED [
26], BOS had an impact of 46 kg CO
2eq (≈5% of total GWP) and 750 MJ
eq (≈5% of total CED). In the work of Kim et al. [
27], GWP due to BOS was 5–7% (1.35–1.45 g CO
2eq/kWh) of the impact of PV module, and the same happened for the life cycle fossil fuel consumption. However, it is important to point out that, depending on the type of installation and the technology used (rooftop systems, and ground-mounted systems), to neglect the impact of the BOS could lead to underestimate significantly the environmental impacts. For example, if the BOS includes elements like batteries and power conditioning electronics, its impact on the carbon footprint of the PV system can be near 30% [
28]. When considering a PV power plant (CdTe modules), the relative contribution of the BOS on the total impacts can be around 35% to 45% [
40]. Moreover, BOS seems to have a large impact when associated with second and third generation PV systems [
64]. Tsang et al. [
62] showed that BOS components such as the mounting structure and inverter had a majority contribution to the impacts in some scenarios: for the scenario including incineration, the BOS contributed from 15% of the FW use impacts up to 87% of the agricultural LO. In detail, the BOS accounted for 54% and 57% of the CED and CC potential, respectively. In other works, the BOS contributed to nearly half of the energy required for a PV system having hybrid QD-based solar cells [
58], and about a third for DSSC [
60]. The impact associated with BOS can be reduced significantly by using building-integrated PV systems, alternative materials, and with efficiency improvement: Espinosa and Krebs [
59] underlined that, since lightweight and highly flexible OPV designs may be particularly well suited for building integration, BOS impact could be reduced significantly compared with other conventional PV technologies.
- PV typologies: materials used and recycled, manufacturing processes and lifetime
Many key elements are connected to the type of PV technology analyzed and, in particular, to the different materials used/recycled, and to the processes involved in the manufacturing of the cell/module. The differences here may relate to the use of different materials for the layers [
52,
60], different solar cells architectures [
36], different layers deposition times and temperatures [
41], different process times, and production processes [
33,
39,
47]. Some studies have focused on different manufacturing processes for the same type of module [
28,
35,
53,
67].
For the 1st generation PV, the main hotspot for most environmental indices was the silicon production, in particular the manufacturing of mc-silicon, the crystallization of the ingot for sc-Si (that required the maintenance of high temperature) or the metallurgical silicon process into purified silicon (MG-Si) [
27]. In fact, all these processes are energy intensive and electricity is one the major contributor to most categories (AP, EP, GWP, and POCP) especially when produced in countries with a coal-based energy mix. Solar grade Si manufacturing contribution was generally more than 40% in most impact categories (GWP, AP, EP, HTP, POCP), followed by the manufacturing of module and cell (both contributing for ≈ 20%). The only exception was ODP index, in which the manufacturing of modules is higher [
29], and FAEP and MAEP, in which the hotspot was the cell production [
30,
33]. Environment impacts not directly related to energy consumption can be attributed to materials such as aluminum and steel, for support and frame [
26].
For second generation, absorber materials seem to have a minor role on environmental burdens compared to first generation. In fact, all these technologies generally require a low number of thickness layers and consequently few materials. Further, the transition from raw material to absorber material is less energy intensive compared to silicon treatment. In anay case, electricity consumption during the manufacturing stage (film and contact deposition) had an important role, as well as the encapsulation step and materials [
41,
42,
45]. In some cases, the improvement in efficiency of second generation devices can be achieved through the addition of new layers. However, this entails the use of additional materials, a greater consumption of F-gas, such as SF
6 and NF
3, which causes a greenhouse effect of several orders greater than that of CO
2 [
39], and greater deposition times [
41]. Referring to efficiency and deposition times, Kim and Fthenakis [
41] estimated that a future 10% efficiency and a deposition rate of 2–3 nm/s could lead to an EPBT reduction of 30% (around 0.5 years or less) for multi-junction a-Si PV modules with a nc-Si bottom layer. Considering different layers, Lunardi et al. [
66] showed how tandem Si-based technologies such as CIGS/Si and CZTS/Si had worse impacts than Si (p-n) and Si (HIT) in most categories (GWP, HTP, FAEP, ADP). However, a high efficiency (30%) together with the replacing of CdS buffer layer with a non-toxic and more transparent material such AZTS, would lead to overturn these results (except ADP, which would remain more elevated than that of Si (p-n) and Si (HIT). Again, the increase in efficiency obtained must compensate for the extra materials and energy demand while deposition processes should be faster than the current ones before the full commercialization of these devices.
Focusing on third generation PV materials, most studies were characterized by a certain grade of uncertainty, because processes were made at the laboratory-scale, so it was difficult to predict how the transition to commercial production could influence the results. Probably, the commercial production may reduce the environmental burdens because laboratory production tends to be less efficient than commercial one. Referring to the specific technology, the environmental impacts of OPV technology seems strictly linked to fullerenes and fullerenes derivatives, especially for new generation devices. Indeed, fullerenes used as acceptor were the most energy-intensive components of organic-PV. The embodied energy of these materials ranged from 35 to 123 GJ/kg while the embodied energy of alternative acceptors such polymers and small molecules ranged from 1.96 to 5.85 GJ/kg and from 1.17 to 1.85 GJ/kg, respectively. In addition, ITO coated PVs demonstrated high embodied energy [
51,
52,
54], followed by the encapsulation of solar cells. LCA studies of QD based solar cells showed that these devices, compared to thin film, required very small amount of chemical compounds and this contributed to low environmental impacts, but the energy consumption for QD production was greater than the other absorbing material (semiconductor). This disadvantage was compensated by the small quantities of QD used in a PV cell, so they overall had less contribution, to certain parameters, such as CED (45%), compared to multi-crystalline (77%), single-crystalline (82%) and CIS solar cells (93%). Particular attention must be paid to the heavy metal emissions (nickel, mercury, arsenic, cadmium, chromium, lead) of these devices, which were the highest compared to other PV technologies (ribbon-Si, sc-Si, mc-Si, CdTe). The processes that contributed the most to heavy metal emissions were hazardous waste disposal, aluminum foil, 1-butanol, ITO, methanol and electricity production [
53]. DSSC technology resulted to have an embedded energy value, for laboratory cell production, much lower than the average value calculated for c-Si technologies and of the same order of magnitude of TFSCs. The manufacturing of DSSC was a hotspot (more than 50% contribution) for all impact categories (ADP, AP, EP, GWP
100, ODP, HTP, FAEP, MAEP, TETP, POCP), followed by electricity (30% contribution) [
60]. For possible configurations and materials, the substitution of glass with PET showed benefits in all impact categories, while the use of steel was still a problem, especially in fossil depletion and CC (HH) categories, such as the use of platinum [
60]. Regarding PSCs, the harmonization conducted by Maranghi et al. [
67] showed that materials had an important role on environmental categories (mainly HTP and FAEP) and CED. In particular, the use of gold (and other metals as silver and Pt) as back contact was the main hotspot, followed by conductive solar glass and electrolyte (mainly TiO
2 and TNT). Considering the different perovskite solar cells manufacturing processes, the back contact deposition, the electrolyte deposition and glass substrate preparation had the highest environmental impacts. Again, electricity consumption for the manufacturing process had a great impact on results, but the authors underlined that there is a good margin of improvement in the prevision of large-scale production, also considering that the research concerning this technology is progressing very rapidly.
The recycling phase also plays an important role on LCA of PV system and, for this reason, some works were dedicated to this phase [
27,
43,
44]. The reason lies in the fact that it becomes possible the recovery of precious or rare materials and materials that require a great use of energy for their manufacturing. For example, Giacchetta et al. [
44] found that the recovery of glass (for CdTe PV modules) led to environmental advantages. This is due to the fact that it is one of the most used and heavy components of PV module (95% mass of the total) and also the recovery of precious materials (CdTe and cadmium sulphide) involved environmental benefits in different categories: HH, Ecosystem quality, CC, GWP and consumption of non-renewable energy. The credits related to the energy recovery could also reach a 30% reduction for impact categories as ODP, IR (HH and ecosystem), CC, FAEP and PM while CED reduction could be of 11%.
In general, regarding the 1st generation PV, glass, aluminum frame and EVA were the most recyclable materials, with a percentage of recycling near to 70%, 10–18% and 2–5%, respectively. Also, in second generation PV, glass and aluminum recovery had a major role. This is an important aspect considering that glass and aluminum require a high electricity consumption. In the same way, the recycling of toxic elements (cadmium) as well as scare metals (indium) is very important to reduce the environmental impacts in most categories, especially ADP [
66]. It must be underlined that in almost all the studies on the PVs of the third generation, the only EoL scenario considered was the landfill, since there was a lack of specific data and information on the recycling processes connected with new technologies, or the recycling processes were not mature enough. However, in some cases, it was possible to assume that glass and metals were recycled offering reduction of mineral resources consumption; inorganic substances were disposed in landfills, potentially offering energy recovery while the rest of polymers and plastics were incinerated [
58,
61]. What emerges from all these studies is that recycling can be considered a fundamental step in reducing the life cycle burden, thanks to the recovery of materials (especially metal, glass and semiconductor metal recovery) and to net energy saving, compared to landfill. Future research could examine technology-specific recycling processes and investigate the recovery and releases of materials during the end of life stages of PV modules.
Another key element connected to the type of PV is the LT of the solar panel and the other components of the system. The importance of LT is that this parameter influences life cycle energy output or energy consumption and, consequently, some indices as EPBT and NER. In addition, a longer useful life means that, in general, the replacement of the device will be less frequent [
66] and the use of new materials and the costs connected to the recycling will be reduced. LT of Si-based technology is around 25–30 years, while for second and third generation devices, there is no reliable information. However, these devices still suffer from various problems, such as degradation due to temperature, moisture, light, and heat, which limit their duration to a few years [
44,
51,
63,
64,
65]. In some of the studies analyzed [
29,
32,
33] the estimated LT of the solar panel was the same (25–30 years), while the LT of the inverter was about half [
26]. Instead, some authors, due to the uncertainty concerning the LT of some types of solar cells, used different LTs in the same work (like 10 and 20 years) and demonstrated that longer LT of the systems will be the most effective to obtain a reduction of toxicity scores (in particular, FAEP). In other studies, especially those concerning the third-generation cells, it was also rightly considered a performance degradation over the years [
58]. For example, Held and Ilg [
40] assumed a LT of 30 years with an annual degradation of 0.5%/year. In some cases, a sensitivity analysis was conducted to evaluate the influence of LT on results. Pasini & Basosi [
61] found NER and GWP considering LT changing from 15 to 30 years: the results showed that shorter LT required a higher efficiency to have a high NER value and a low GWP value (at the same efficiency, the increase of NER with LT was 46% while the reduction of GWP was 46%). According to other studies [
34,
58,
61], solar PV systems NER increased with the increasing LT, while EPBT and CO
2eq/kWh decreased. Since PV installations do not release emissions during operational LT, the higher the operational LT of the system (that also means more produced energy during life cycle) the better the environmental profile would be. For these reasons, this parameter needs special attention, now and in future applications, because it can dramatically mitigate energy resources and raw materials exploitation [
28,
66].
3.3. Methodological Insights
Methodological insights regard all the aspects of the analysis that characterize in detail the LCA study. These aspects are directly linked to the results of the study and, above all, to the choices made by the analyst in order to achieve the scope of the analysis. These features are the system boundaries, the FU, the inventory data (i.e., primary and secondary data), the software used to conduct the assessment, the environmental impact categories and methods [
70], etc. Since every analyst is free to make their own choice, and there are multitudes of factors or approaches that affect the LCA studies applied to PV cells, a direct comparison among different studies is often quite difficult. For this reason, Fthenakis et al. [
71] developed the “Methodology Guidelines on Life-Cycle Assessment of Photovoltaic Electricity” within the International Energy Agency (IEA) photovoltaic power systems programme. The IEA guidelines represent a useful scheme to direct authors in the choices related to the key parameters of the analysis, to the input of the processes, to the methodological aspects, and to the communication of the results. Focusing on the examined studies, different aspects were identified, as follows:
- System boundaries
The system boundary defines which processes are included in the analyzed system and represent the limit between the system and the nature, or the system and other excluded systems. For many examined studies [
29,
30,
31,
41,
43,
45,
54,
57,
58,
61,
63] the system boundaries are limited to a “cradle to gate” approach, including raw materials supply and system manufacturing. The use phase is omitted in most of the cases because PV solar panels have zero emissions during this step. In any case, some studies considered a “cradle to use” approach [
26,
28,
33,
34,
36,
53,
55,
60]. The recycling phase is not considered in many works, due to lack of data (especially for the new PV panels, which are the most recent).
Moreover, many studies [
27,
35,
40,
42,
46,
47,
52,
62,
65,
66] have analyzed the entire life cycle (from “cradle to grave”) while there are few studies [
32,
44,
51,
56] focused on the analysis of a single stage (the recycling or the manufacturing phase) of the LCA. The number of works that used the same approach is reported in
Figure 3.
- Functional unit
The ISO 14,040 [
72] defines the functional unit as the “quantified performance of a product system for use as a reference unit”. In other words, FU is the parameter used to link incoming and outgoing flows of the system. Moreover, the FU is the basis on which different alternatives of the same product can be compared.
The studies investigated in this review selected different functional units, as described in the following:
kWh [
27,
28,
29,
33,
42,
45,
46,
47,
58,
60,
62,
63,
66];
m
2 [
39,
40,
41,
44,
54,
55,
57,
59,
64,
65,
67];
1000 kg of Si waste panels [
32];
One 60-cell silicon [
36].
The number of works that used the same FU is reported in
Figure 4.
With respect to these FUs, kWh was the most used for all three generations PV. This is explained by considering that this FU allows for the quantification of the environmental impacts of PV technologies in relation to the final purpose of these devices, namely the production of electricity. kW
p, differently from kWh, it is not ideal to compare the electricity output, since the electricity fed to the grid may differ between different systems analyzed and real operative conditions [
71]. The FU m
2 is a good option for devices, characterized by different layers or multiple junctions, since it allows estimating the environmental burdens associated with all materials, structure of a PV module (or cell in the case of cm
2) also considering the supporting structure. It is particularly indicative if used to compare the same technology with different materials in layers or different configurations, since it allows for a direct comparison of a portion of the module with the same base structural characteristics and similar production performances. The other FUs were used only for one or a few studies, depending on the scope and the peculiarity of the analysis. For example, 1 kg of silane [
43] and 1000 kg of Si waste panels [
32] were used because the two analyses focused on environmental impacts connected to the recycling phase.
- Data quality: primary and secondary data, uncertainty of data
Data used in a LCA study can be classified as primary and secondary data. Primary data are obtained through direct measurements or directly from the specific process or plant; secondary data are through literature studies, publications, LCA libraries and databases.
The analysis of LCA studies of PV panels showed a shortage of primary data on some manufacturing processes, on use phase and a lack of data on recycling phase. This aspect regards in particular the second and third generation solar cells [
38,
39,
41,
45,
47,
52,
59,
60,
61,
63,
65]. The lack of data for manufacturing processes is justified because second (in most cases) and third generations are still under research and development, in pilot-scale status [
32,
56,
66] or they are not yet in commercial production. Regarding the recycling phase, the lack of data is easily explained for the second and third generation, but it concerns the technologies of the first generation too [
28,
32]. In fact, the commercial success of first generation devices concerns the last few decades and, as mentioned, these devices have a useful life of 20–30 years. Consequently, information about the EoL phase is not widespread. In these cases, secondary data (from literature and databases) or estimations/assumptions on the EoL of the individual components are often used.
Many studies clearly expressed data information through tables or paragraphs dedicated to this purpose. These data collection information includes:
typology of data (primary or secondary; foreground or background, etc.);
data origin or source, if this information is obtained in-situ [
64], provided by manufacturing companies or laboratories of new technologies [
63] from software database, previous studies or literature [
29,
40];
information about temporal and geographical representativeness.
Rarely, an evaluation of data quality was made, as well as an estimation of the influence of missing data substitution [
27,
55,
60].
- Impact categories and assessment methods
Different impact assessment methodologies and impact categories were found in the literature analysis of PV solar systems. Each methodology allows for calculating several impact categories (i.e., GWP, AP, etc.) expressed with specific environmental indicators. Moreover, each method allows for the calculation of environmental indicators based on different assumptions (as regards pollutants and characterization factors) and this can cause uncertainty in the analyses, since all choices can be potentially correct [
73].
Some studies focused only on energy assessment through indices as EPBT, CED and NER. Regarding environmental impacts, GHG emissions or GWP are usually calculated for PV panel but also other indicators like AP, EP, OPD, and POCP, etc. In a few cases, categories such as damage to human health, damage to ecosystems, and damage due to resource depletion are evaluated. CED, EPBT, and GWP are the most used indices for PV studies.
The following impact assessment methodologies are used in the various analyses: CML 2000/2001, IMPACT2002+, ReCiPe, Eco-Indicator ’95/’99. IPCC, ILCD and TRACI. CML 2001 was the most used methodology for 1st generation PV and, in particular, in China. TRACI method is commonly used in the U.S. while other methods like ReCiPe, Ecoindicator and ILCD were more commonly used in Europe. In some works [
46,
57,
63], authors used a combination of two environmental methods. For example, the TRACI method is used to characterize the potential environmental impacts of emissions for categories such as: CC, HH, Ex, AP, and EP, etc. while the ReCiPe method is used to characterize natural resource consumption for its potential impacts on MD, FD, water, and land use (since these categories were not included in TRACI). In the same way, when the analysis suggested interesting findings about a particular environmental indicator (for example, if the use of toxic elements emerges, it could be necessary to consider damage to human health category, as well as the use of heavy metal is connected to ME or FE), the authors integrated an additional method to evaluate that particular category, if not evaluated previously. In few cases, authors used two different methods to calculate different categories at midpoint and endpoint level. For example, Espinosa and Krebs [
59] used CML2001 as a midpoint method and ReCiPe as an endpoint method. In any case, the above differences about the methods used and the fact that, in some cases, results were expressed only in normalized form, make it difficult to compare the results among the studies.


 ,
, 


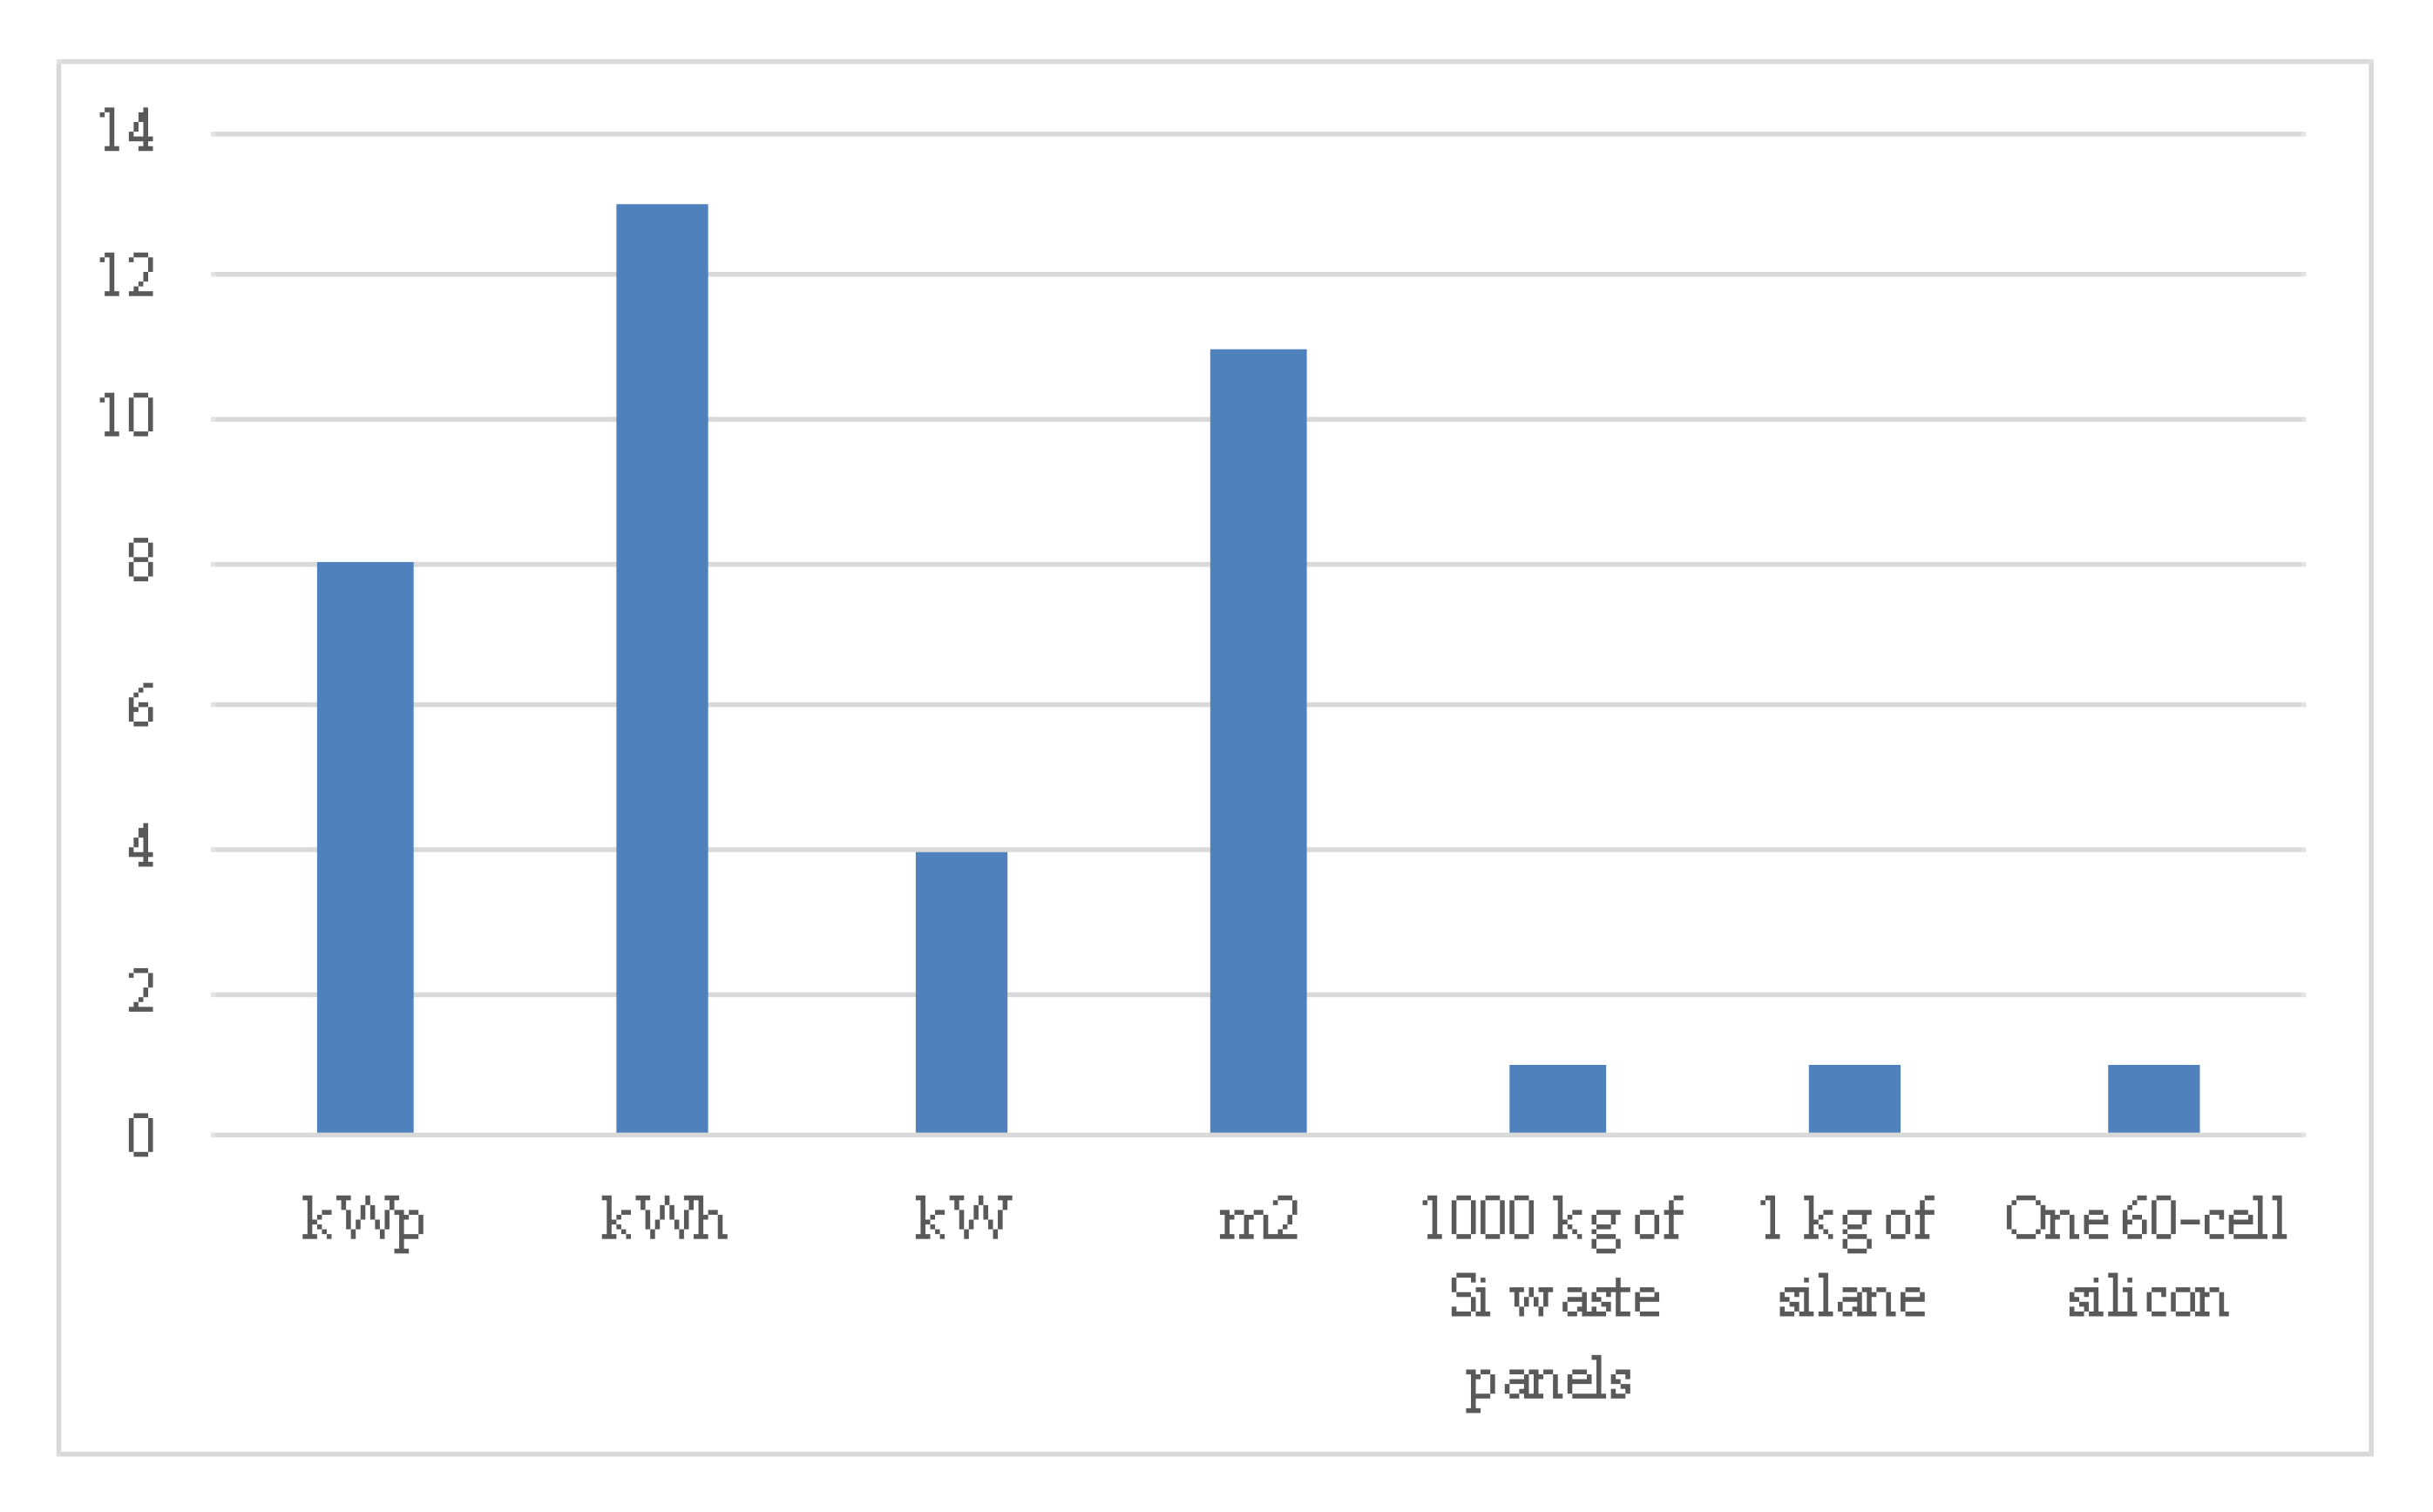
