HYRES: A Multi-Objective Optimization Tool for Proper Configuration of Renewable Hybrid Energy Systems


Abstract
:
1. Introduction
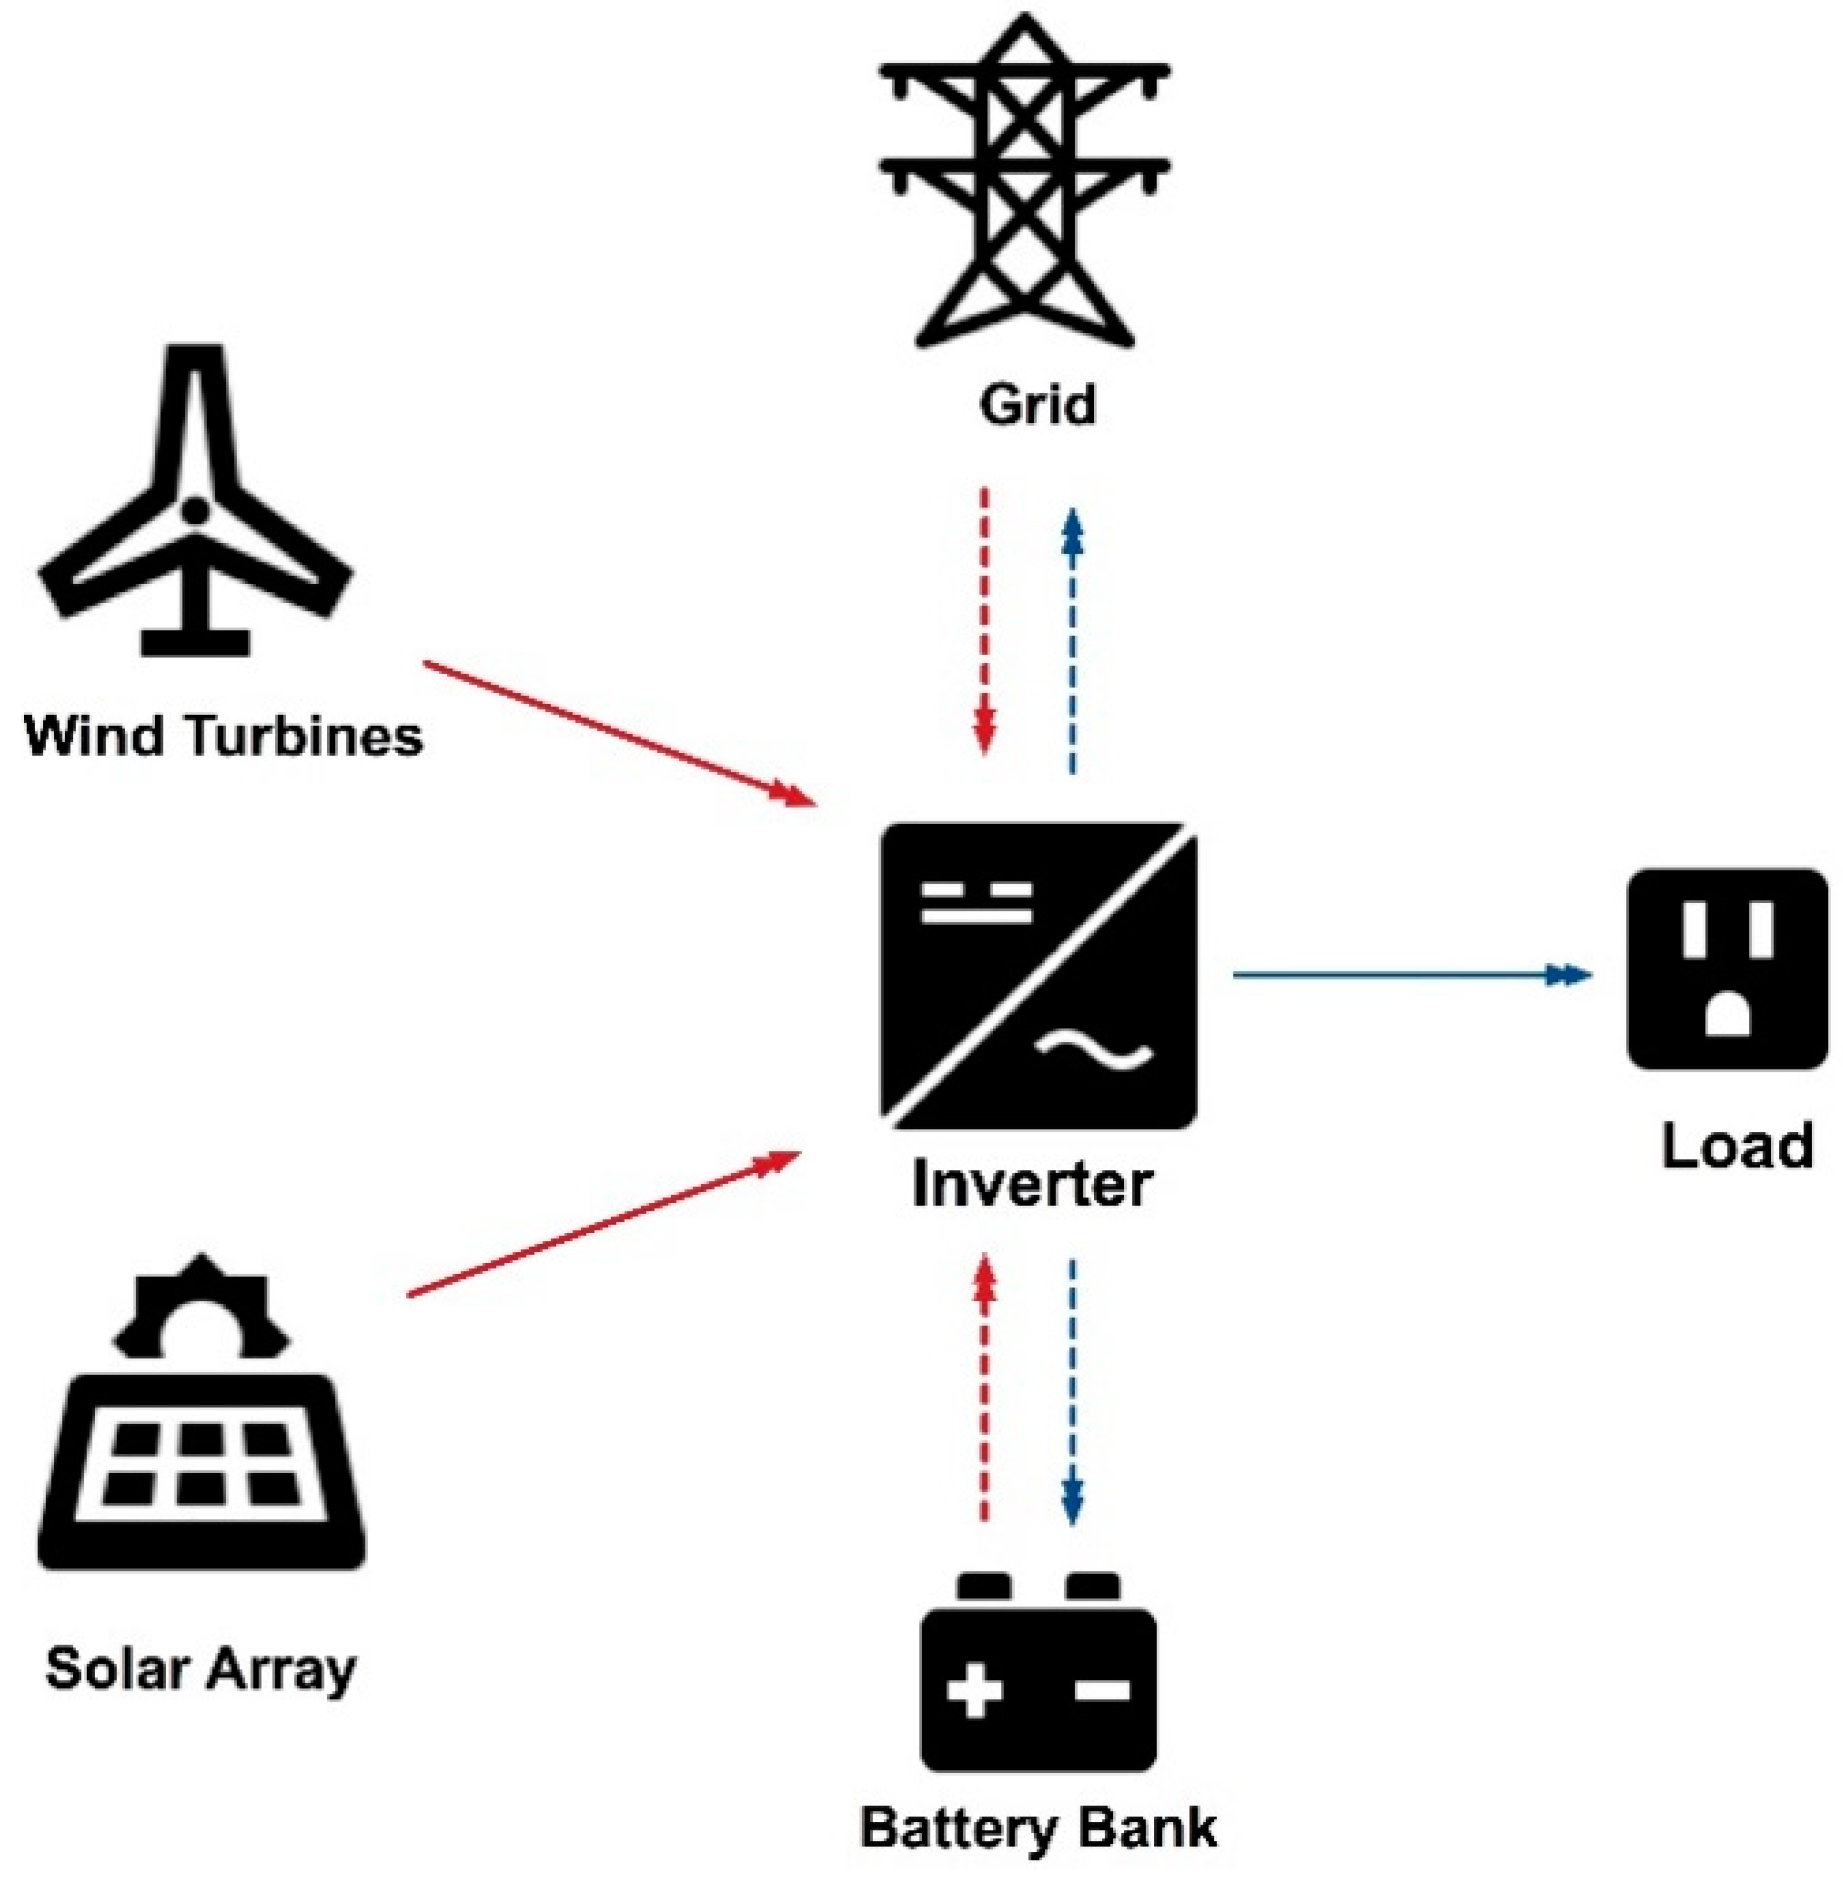
2. System Configuration
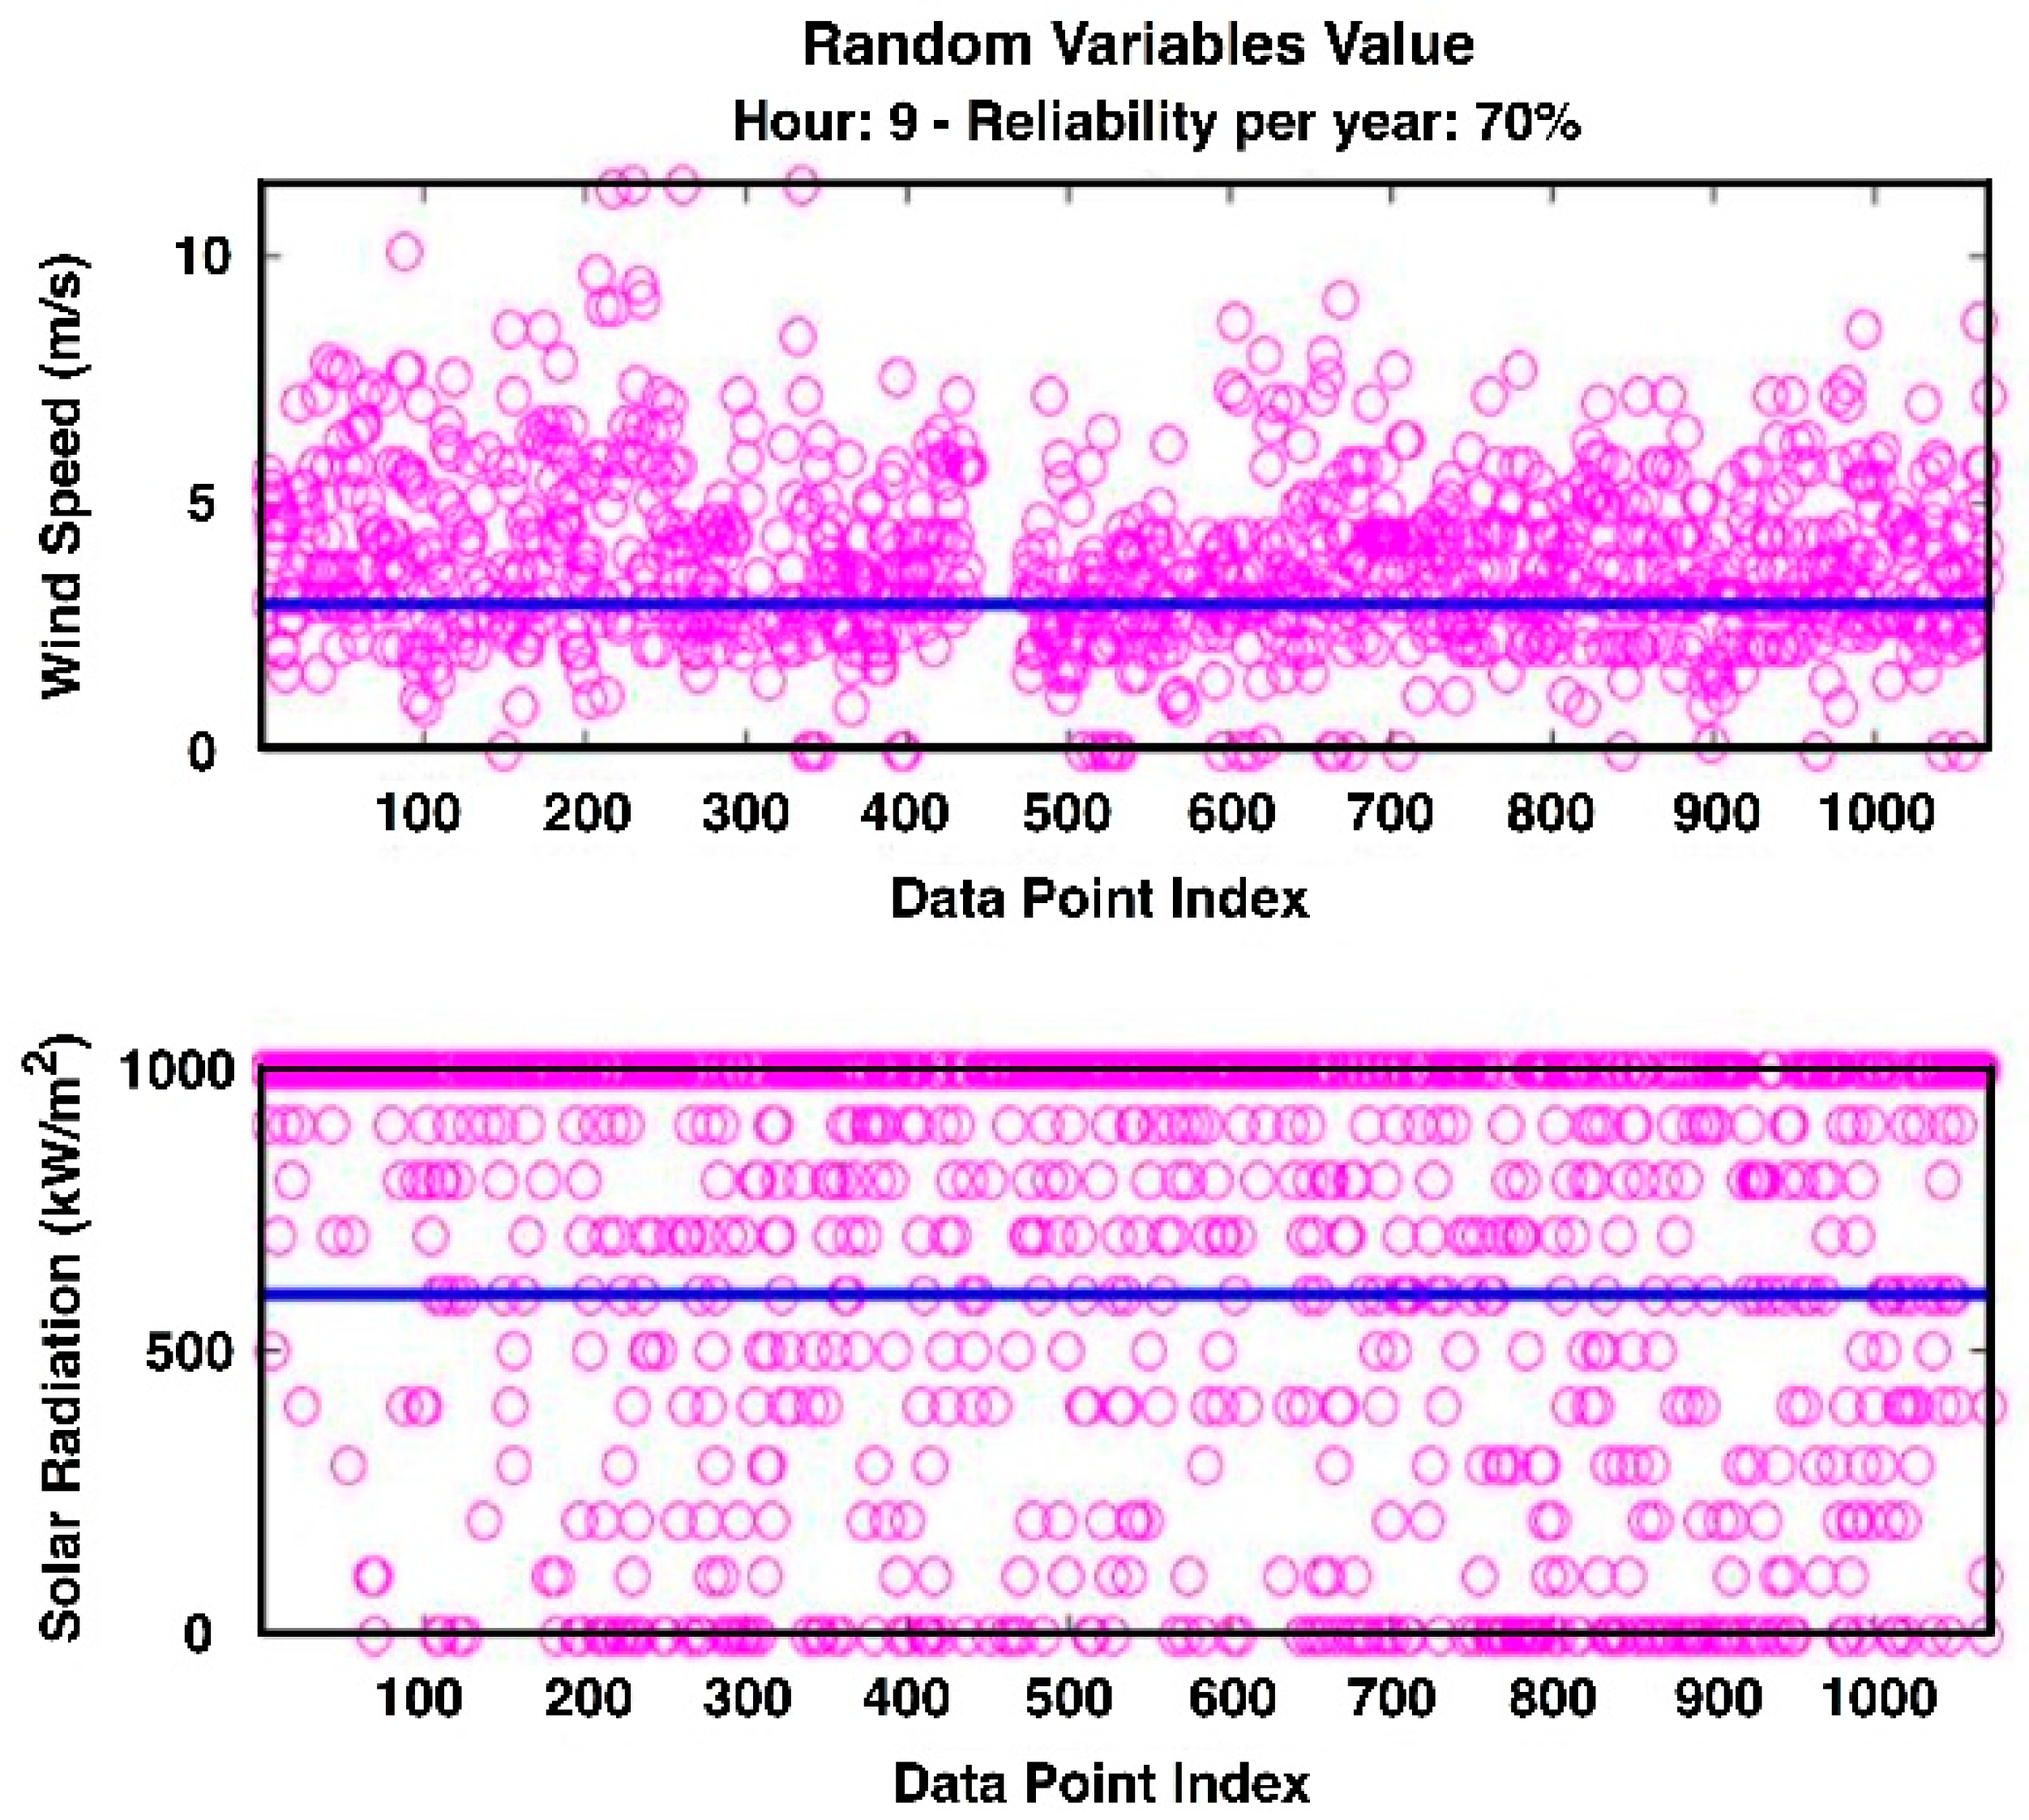
3. Statistical Analysis of Random Variables
4. Mathematical Models
4.1. Solar Panel
4.2. Wind Turbine
4.3. Battery
5. System Optimization and Programming
5.1. Loss of Power Supply Probability (LPSP)
5.2. Initial Capital Cost (ICC)
5.3. Life Cycle Cost (LCC)
5.4. Loss of Power Supply (LPS)
- BEGIN
- Read numerical variables
- Load; [Load power]
- Pspv, Pwp; [Power generated by solar panel-wind turbine]
- Np, Nwt, Nbatt; [Number of solar panels, wind turbines, batteries]
- SOCma; [Maximum value of power of one battery]
- DOD; [Maximum permissible depth of battery discharge]
- SOC_; [Initial State of Charge or battery bank]
- ro; [Self discharge rate of batteries]
- nbat; [battery efficiency at discharging]
- Pl=Load;
- Pg=Pspv.*Np+Pwp.*Nwt;
- P=Pg-Pl;
- SOCmax=SOCma*Nbatt;
- SOCmin=DOD*SOCmax;
- if P>0
- if (SOCmax-SOC_)*(2-nbat)>=P
- SOC=SOC_*(1-ro) + P*nbat;
- Ps=Pl;
- elseif (SOCmax-SOC_)*(2-nbat)<P
- SOC=SOCmax;
- Ps=Pl;
- end if
- elseif P<0
- If SOCmin-SOC_*(1-ro)<=P
- SOC=SOC_*(1-ro)+P;
- Ps=Pl;
- elseif SOCmin-SOC_*(1-ro)>P
- SOC=SOCmin;
- Ps=Pg+(SOC_*(1-ro)-SOC);
- if Ps<0
- Ps=0;
- end if
- end if
- else
- SOC=SOC_;
- Ps=Pg;
- end if
- END
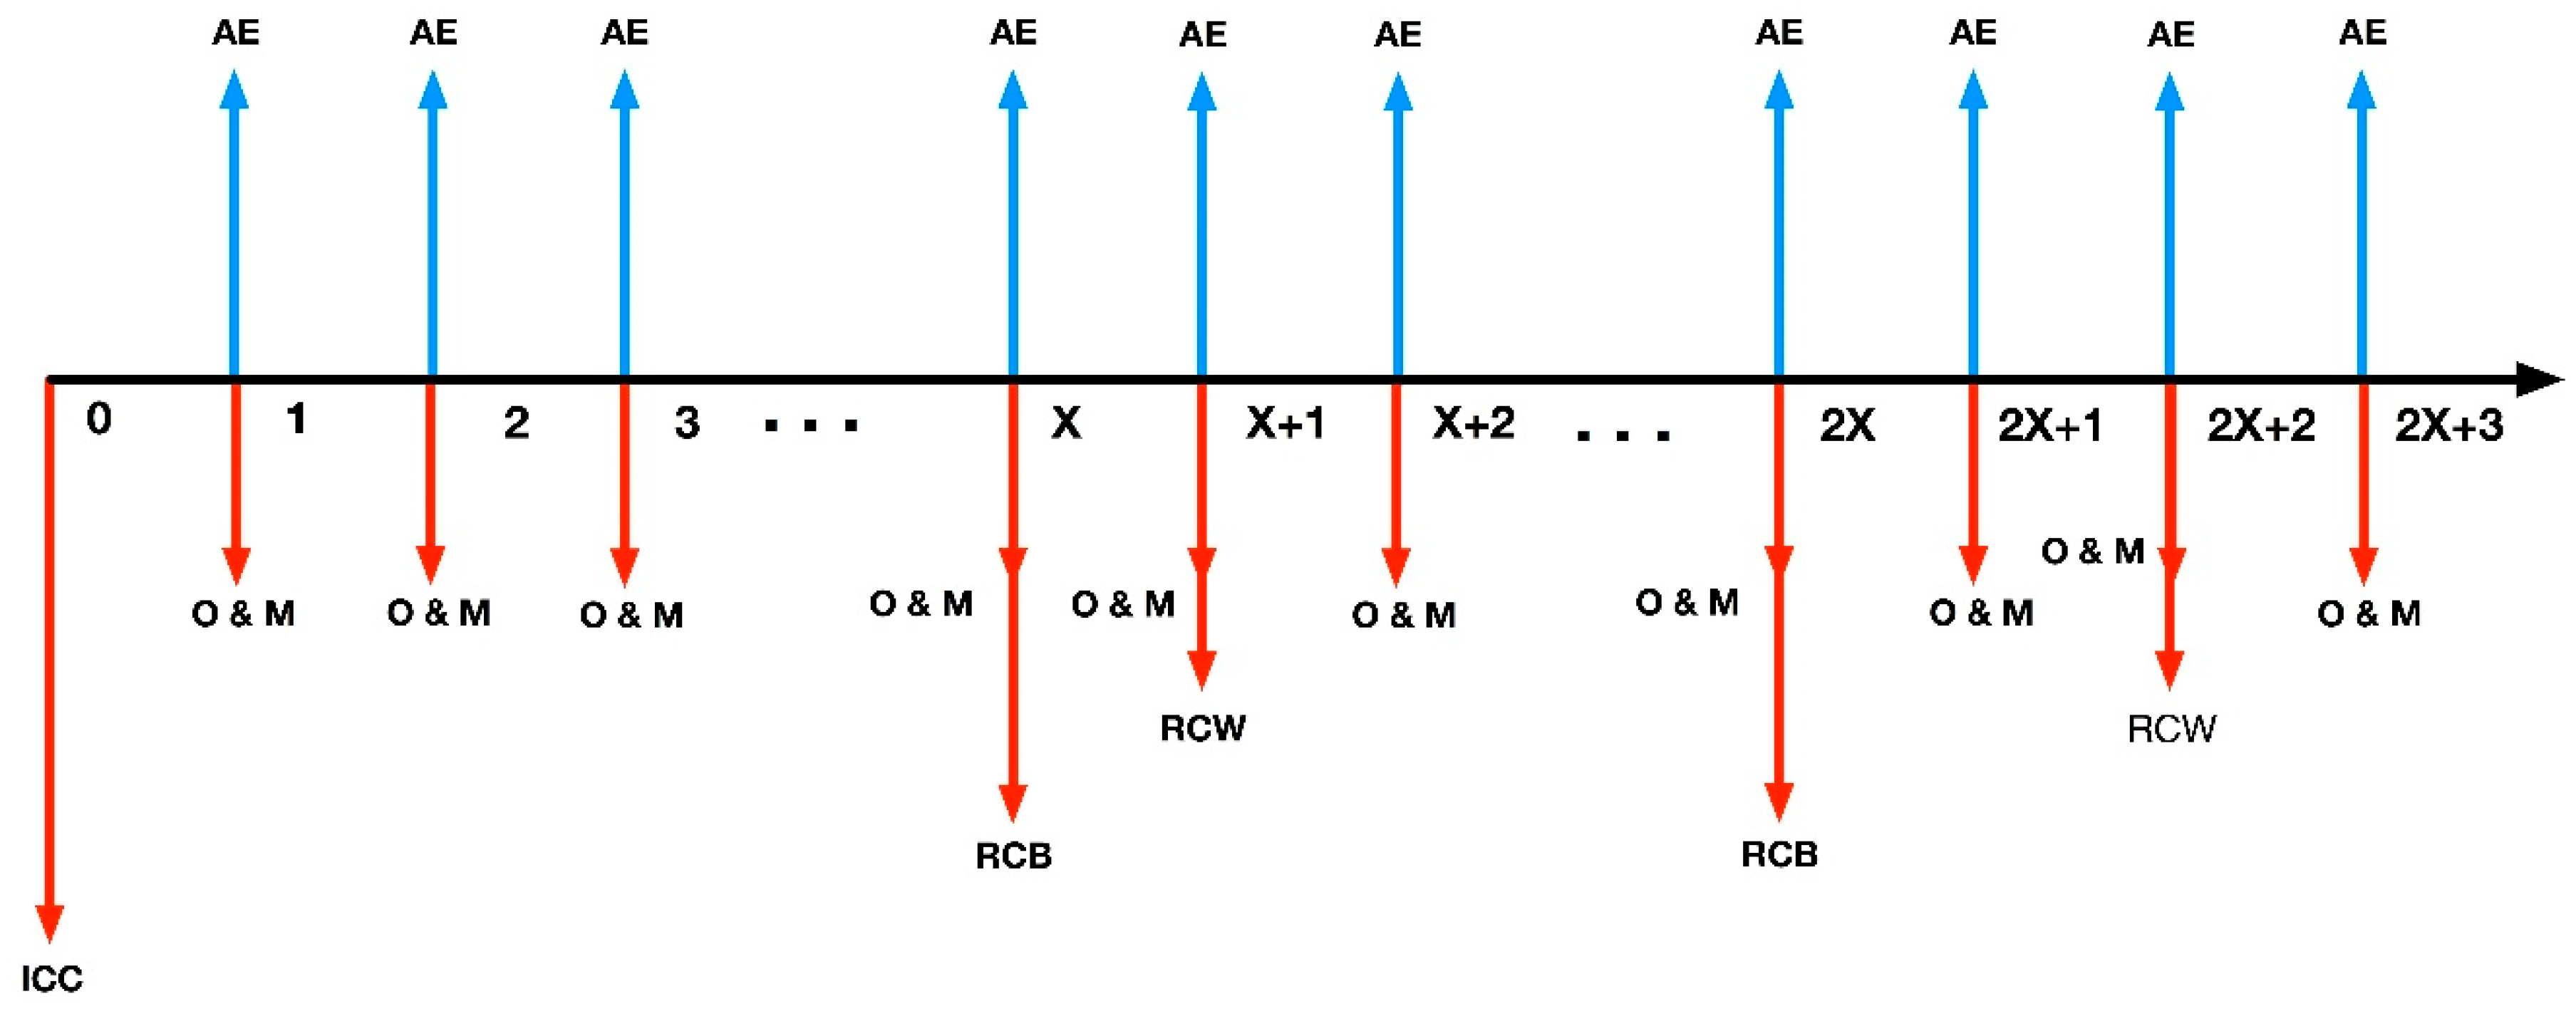
6. Economic Analysis
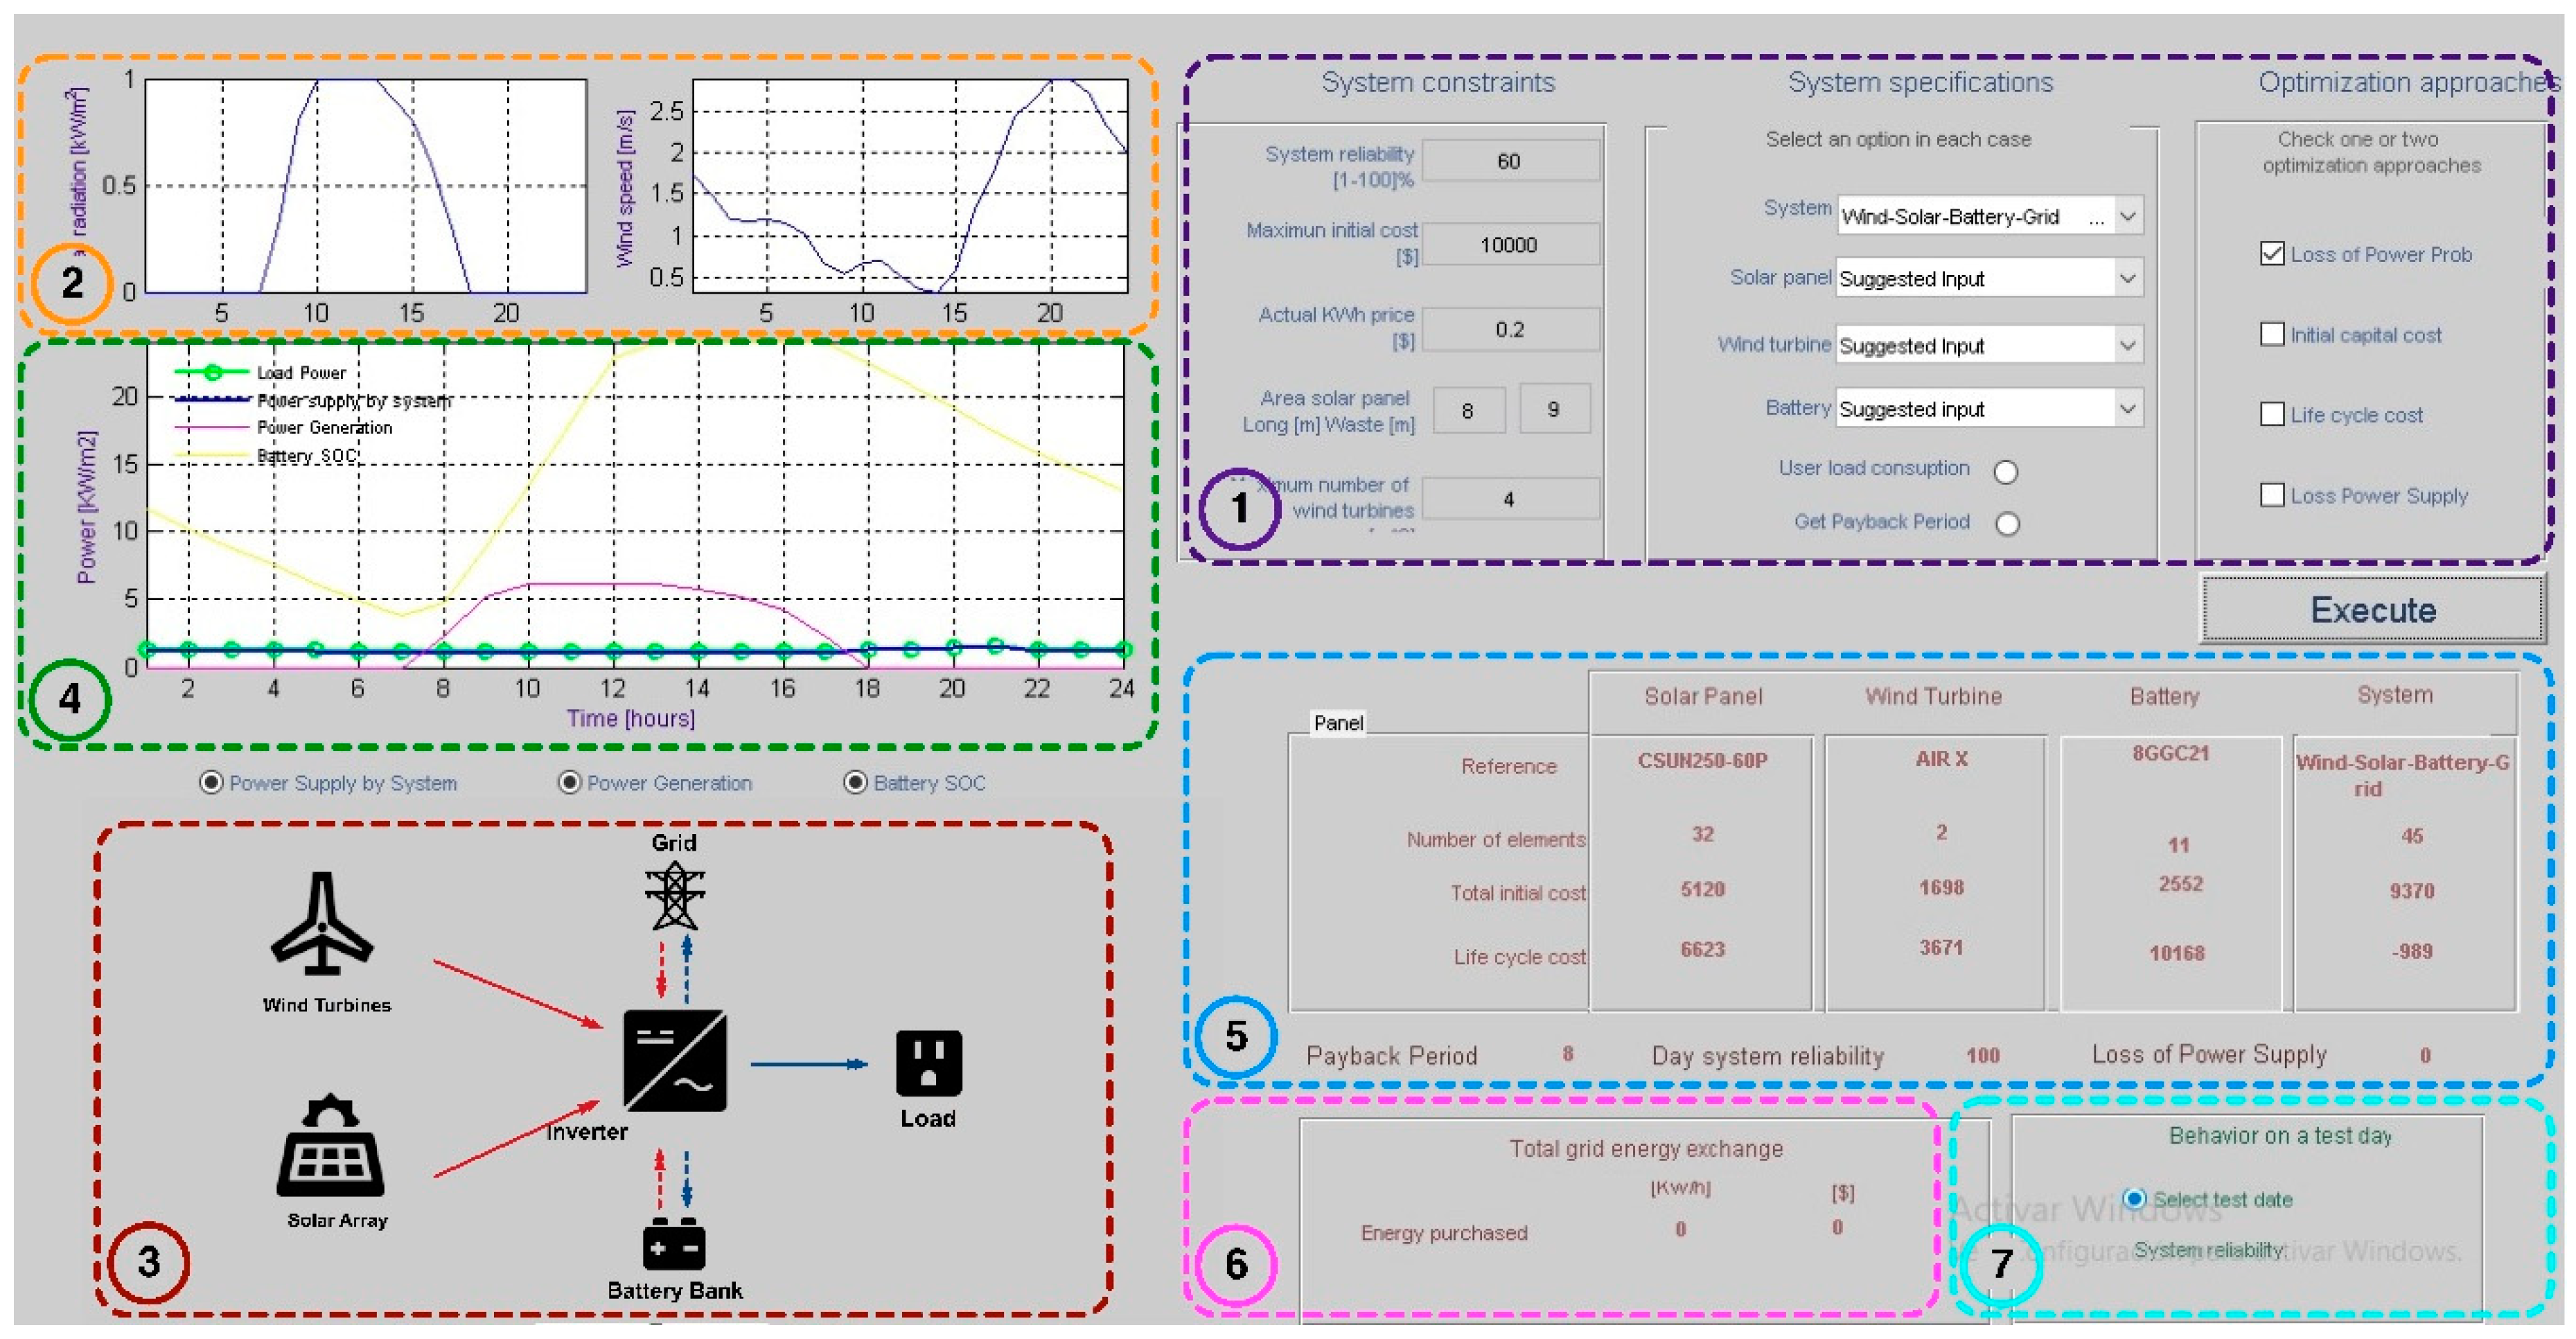
7. Developed Computational Tool: HYRES
8. Results and Discussion
- Variant Factors:
- Reliability: establishes the annual system reliability with values of 50% and 75%.
- Location: three different locations are defined: Miami-USA, Barranquilla-Colombia, and Fortaleza-Brazil. The three locations are due to data availability, different climate conditions, and time zones.
- System configuration: Configuration 1: Solar PV—Wind Turbines—Batteries—Grid connection (no possibility of selling energy to grid) and Configuration 2: Solar PV—Wind Turbines—Grid connection (possibility of selling energy to grid) of the system are selected.
- Constant Factors:
- -
- Currency: USD
- -
- Maximum initial cost: $15,000
- -
- kWh Cost: $0.2
- -
- Solar Area Panel: 72 m2—37 panels—11.8 kW
- -
- Number of Wind turbines: 4
- -
- Interest rate per year: 4.95%
- -
- O&M cost of solar panels: $10
- -
- O&M cost of wind turbines: $30
- -
- O&M cost of batteries: $10
- -
- Optimization approach: NPV
9. Conclusions and Future Work
Author Contributions
Funding
Conflicts of Interest
Nomenclature
| Npan | number of panels |
| Voc | open circuit voltage |
| Isc | short circuit current |
| ff | fill factor |
| Voc_stc | open voltage under standard test conditions |
| Isc_stc | short circuit under standard test conditions |
| kv | open voltage coefficient |
| ki | short circuit current coefficient |
| T | standard temperature |
| G | global solar radiation (W/m2) |
| Tamb | ambient temperature (°) |
| NOCT | Nominal Operating Cell Temperature |
| Pwt | power output of the wind turbine |
| Pwtmax | max. available output wind turbine power |
| Pr | nominal power generation |
| ro | air density |
| v | wind speed |
| Cp | efficiency of wind turbine |
| Nmec | mechanical components efficiency |
| A | area swept by the blades of the turbine |
| r | radio of blades |
| V | wind speed at reference data |
| Hmed | height of wind speed measurement |
| Ht | height of wind speed |
| Vci | wind speed cut in |
| Vra | wind speed rated power |
| Vco | wind speed cut out |
| SOC_ | initial value of the battery |
| SOCmax | maximum power of the battery |
| DOD | maximum permissible depth of battery |
| P | battery power, |
| Ro | self-discharging rate |
| nbat | battery bank efficiency at charging state |
| Cpan | cost of each solar panel |
| Npan | number of solar panels |
| Cwt | cost of each wind turbine |
| Nwt | number of wind turbines |
| Cbat | cost of each battery |
| Nbat | number of batteries |
| Cinv | cost of inverter |
| Clp | life cycle cost of solar panels |
| Clw | life cycle cost of wind turbines |
| Clb | life cycle cost of batteries |
| Clinv | life cycle cost of inverter |
| ε | inflation rate |
| r | real interest rate |
| αpo&m | maintenance rate per year |
| Ny | horizon of the project in years |
| Xw | number of replacement of wind turbines |
| lw | wind turbines lifetime |
| Xb | number of replacement time of batteries |
| lb | life cycle year of the battery |
| AE | annual profits generated |
| O&M | annual operation and maintenance cost |
References
- Bayod-Rújula, Á.A.; Haro-Larrodé, M.E.; Martínez-Gracia, A. Sizing criteria of hybrid photovoltaic—Wind systems with battery storage and self-consumption considering interaction with the grid. Sol. Energy 2013, 98, 582–591. [Google Scholar] [CrossRef]
- González, A.; Riba, J.-R.; Rius, A.; Puig, R. Optimal sizing of a hybrid grid-connected photovoltaic and wind power system. Appl. Energy 2015, 154, 752–762. [Google Scholar] [CrossRef] [Green Version]
- Sinha, S.; Chandel, S.S. Review of recent trends in optimization techniques for solar photovoltaic—Wind based hybrid energy systems. Renew. Sustain. Energy Rev. 2015, 50, 755–769. [Google Scholar] [CrossRef]
- Khare, V.; Nema, S.; Baredar, P. Solar-wind hybrid renewable energy system: A review. Renew. Sustain. Energy Rev. 2016, 58, 23–33. [Google Scholar] [CrossRef]
- Belmili, H.; Almi, M.F.; Bendib, B.; Bolouma, S. A computer program development for sizing stand-alone Photovoltaic-Wind hybrid systems. Energy Procedia 2013, 36, 546–557. [Google Scholar] [CrossRef] [Green Version]
- Ma, T.; Yang, H.; Lu, L. A feasibility study of a stand-alone hybrid solar-wind-battery system for a remote island. Appl. Energy 2014, 121, 149–158. [Google Scholar] [CrossRef]
- Al Busaidi, A.S.; Kazem, H.A.; Al-Badi, A.H.; Farooq Khan, M. A review of optimum sizing of hybrid PV-Wind renewable energy systems in oman. Renew. Sustain. Energy Rev. 2016, 53, 185–193. [Google Scholar] [CrossRef]
- Conti, P.; Lutzemberger, G.; Schito, E.; Poli, D.; Testi, D. Multi-Objective Optimization of Off-Grid Hybrid Renewable Energy Systems in Buildings with Prior Design-Variable Screening. Energies 2019, 12, 3026. [Google Scholar] [CrossRef] [Green Version]
- Xu, L.; Ruan, X.; Mao, C.; Zhang, B.; Luo, Y. An improved optimal sizing method for wind-solar-battery hybrid power system. IEEE Trans. Sustain. Energy 2013, 4, 774–785. [Google Scholar]
- Saharia, B.J.; Zaheeruddin; Manas, M.; Ganguly, A. Optimal sizing and cost assesment of hybrid Renewable Energy Systems for Assam Engineering College. In Proceedings of the 2015 Annual IEEE India Conference (INDICON), New Delhi, India, 17–20 December 2015; pp. 1–6. [Google Scholar]
- Faccio, M.; Gamberi, M.; Bortolini, M.; Nedaei, M. State-of-art review of the optimization methods to design the configuration of hybrid renewable energy systems (HRESs). Front. Energy 2018, 12, 591–622. [Google Scholar] [CrossRef]
- Siddaiah, R.; Saini, R.P. A review on planning, configurations, modeling and optimization techniques of hybrid renewable energy systems for off grid applications. Renew. Sustain. Energy Rev. 2016, 58, 376–396. [Google Scholar] [CrossRef]
- Abdmouleh, Z.; Gastli, A.; Ben-Brahim, L.; Haouari, M.; Al-Emadi, N.A. Review of optimization techniques applied for the integration of distributed generation from renewable energy sources. Renew. Energy 2017, 113, 266–280. [Google Scholar] [CrossRef]
- Waibel, C.; Wortmann, T.; Evins, R.; Carmeliet, J. Building energy optimization: An extensive benchmark of global search algorithms. Energy Build. 2019, 187, 218–240. [Google Scholar] [CrossRef]
- Maleki, A.; Pourfayaz, F.; Rosen, M.A. A novel framework for optimal design of hybrid renewable energy-based autonomous energy systems: A case study for Namin, Iran. Energy 2016, 98, 168–180. [Google Scholar] [CrossRef]
- Caballero, F.; Sauma, E.; Yanine, F. Business optimal design of a grid-connected hybrid PV (photovoltaic)-wind energy system without energy storage for an Easter Island’s block. Energy 2013, 61, 248–261. [Google Scholar] [CrossRef]
- Hosseinalizadeh, R.; Shakouri, G.H.; Amalnick, M.S.; Taghipour, P. Economic sizing of a hybrid (PV-WT-FC) renewable energy system (HRES) for stand-alone usages by an optimization-simulation model: Case study of Iran. Renew. Sustain. Energy Rev. 2016, 54, 139–150. [Google Scholar] [CrossRef] [Green Version]
- Katsigiannis, Y.A.; Georgilakis, P.S.; Karapidakis, E.S. Hybrid Simulated Annealing; Tabu Search Method for Optimal Sizing of Autonomous Power Systems with Renewables. IEEE Trans. Sustain. Energy 2012, 3, 330–338. [Google Scholar] [CrossRef]
- Pradhan, A.K.; Kar, S.K. Modeling, Simulation and Economic analysis of Offgrid Hybrid Renewable Power System for an UnElectrified Village in Odisha. In Proceedings of the 2015 International Conference on Electrical, Electronics, Signals, Communication and Optimization (EESCO), Visakhapatnam, India, 24–25 January 2015. [Google Scholar]
- Alsayed, M.; Cacciato, M.; Scarcella, G.; Scelba, G. Multicriteria optimal sizing of photovoltaic-wind turbine grid connected systems. IEEE Trans. Energy Convers. 2013, 28, 370–379. [Google Scholar] [CrossRef]
- Ould Bilal, B.; Sambou, V.; Ndiaye, P.A.; Kébé CM, F.; Ndongo, M. Multi-objective design of PV-wind-batteries hybrid systems by minimizing the annualized cost system and the loss of power supply probability (LPSP). In Proceedings of the 2013 IEEE International Conference on Industrial Technology (ICIT), Cape Town, South Africa, 25–28 February 2013; pp. 861–868. [Google Scholar]
- Shi, Z.; Wang, R.; Zhang, T. Multi-objective optimal design of hybrid renewable energy systems using preference-inspired coevolutionary approach. Sol. Energy 2015, 118, 96–106. [Google Scholar] [CrossRef]
- Zeng, J.; Li, M.; Liu, J.F.; Wu, J.; Ngan, H.W. Operational Optimization of a Stand-alone Hybrid Renewable Energy Generation System based on an Improved Genetic Algorithm. In Proceedings of the IEEE Power & Energy Society General Meeting, Providence, RI, USA, 25–29 July 2010; pp. 1–6. [Google Scholar]
- Ogunjuyigbe, A.S.O.; Ayodele, T.R.; Akinola, O.A. Optimal allocation and sizing of PV/Wind/Split-diesel/Battery hybrid energy system for minimizing life cycle cost, carbon emission and dump energy of remote residential building. Appl. Energy 2016, 171, 153–171. [Google Scholar] [CrossRef]
- Sharafi, M.; ElMekkawy, T.Y.; Bibeau, E.L. Optimal design of hybrid renewable energy systems in buildings with low to high renewable energy ratio. Renew. Energy 2015, 83, 1026–1042. [Google Scholar] [CrossRef]
- Kirthiga, M.V.; Daniel, S.A. Optimal sizing of hybrid generators for autonomous operation of a micro-grid. In Proceedings of the 2010 IEEE 26th Convention of Electrical and Electronics Engineers in Israel, Eliat, Israel, 17–20 November 2010; pp. 864–868. [Google Scholar]
- Wu, Z.; Tazvinga, H.; Xia, X. Demand side management of photovoltaic-battery hybrid system. Appl. Energy 2015, 148, 294–304. [Google Scholar] [CrossRef] [Green Version]
- MatWorks, I. MathWorks—Makers of MATLAB and Simulink. 2015. Available online: http://es.mathworks.com/index.html?s_tid=gn_logo (accessed on 24 April 2017).
- EDSS. Essa Norma Para el Cálculo y Diseño de Sistemas de Distribución. 2004, p. 165. Available online: https://www.essa.com.co/site/Portals/14/Docs/Norma%20tecnica/Norma%20T%C3%A9cnica%20ESSA.pdf (accessed on 19 December 2019).


| References | [16,17] | [18] | [19] | [20,21,22] | [23] | [24] | [25] | [26] | [3] | |
|---|---|---|---|---|---|---|---|---|---|---|
| Characteristics | ||||||||||
| Solar radiation | ✓ | ✓ | ✓ | ✓ | ✓ | ✓ | ✓ | ✓ | ✓ | |
| Surface area panel number | ✓ | ✓ | ✓ | ✓ | ✓ | ✓ | ✓ | |||
| Module temperature | ✓ | ✓ | ✓ | ✓ | ✓ | ✓ | ||||
| Ambient temperature | ✓ | ✓ | ✓ | ✓ | ✓ | ✓ | ||||
| Module efficiency | ✓ | ✓ | ✓ | ✓ | ✓ | |||||
| Fill Factor | ✓ | ✓ | ||||||||
| Derating factor | ✓ | |||||||||
| Vco(stc) | ✓ | ✓ | ||||||||
| Isc(stc) | ✓ | ✓ | ||||||||
| NOCT | ✓ | ✓ | ✓ | ✓ | ||||||
| Nominal power | ✓ | ✓ | ✓ | |||||||
| Others | ✓ | ✓ | ✓ | |||||||
| References | [16] | [17,24] | [18] | [3,19] | [20] | [21,23,26] | [25] | [27] | |
|---|---|---|---|---|---|---|---|---|---|
| Characteristics | |||||||||
| Wind speed | ✓ | ✓ | ✓ | ✓ | ✓ | ✓ | ✓ | ✓ | |
| Power Coefficient | ✓ | ✓ | ✓ | ✓ | ✓ | ||||
| Vci (Cut in speed) | ✓ | ✓ | ✓ | ✓ | ✓ | ||||
| Vr (rated speed) | ✓ | ✓ | ✓ | ✓ | ✓ | ||||
| Vco (cut off speed) | ✓ | ✓ | ✓ | ✓ | ✓ | ||||
| Generator rated power | ✓ | ✓ | ✓ | ✓ | |||||
| Area swept | ✓ | ✓ | ✓ | ✓ | ✓ | ✓ | |||
| High relation | ✓ | ✓ | ✓ | ||||||
| Efficiency gear box | ✓ | ✓ | ✓ | ||||||
| Turbine efficiency | ✓ | ✓ | ✓ | ✓ | |||||
| Others | ✓ | ✓ | |||||||
| References | [18] | [3,20,27] | [23] | [24] | [25] | |
|---|---|---|---|---|---|---|
| Characteristics | ||||||
| SOC before | ✓ | ✓ | ✓ | |||
| SOC minimum | ✓ | ✓ | ✓ | |||
| SOC maximum | ✓ | ✓ | ✓ | |||
| Efficiency | ✓ | ✓ | ✓ | |||
| σ | ✓ | |||||
| Power | ✓ | ✓ | ✓ | |||
| Voltage | ✓ | ✓ | ✓ | ✓ | ||
| Current | ✓ | |||||
| Depth of discharge | ✓ | ✓ | ✓ | |||
| Others | ✓ | |||||
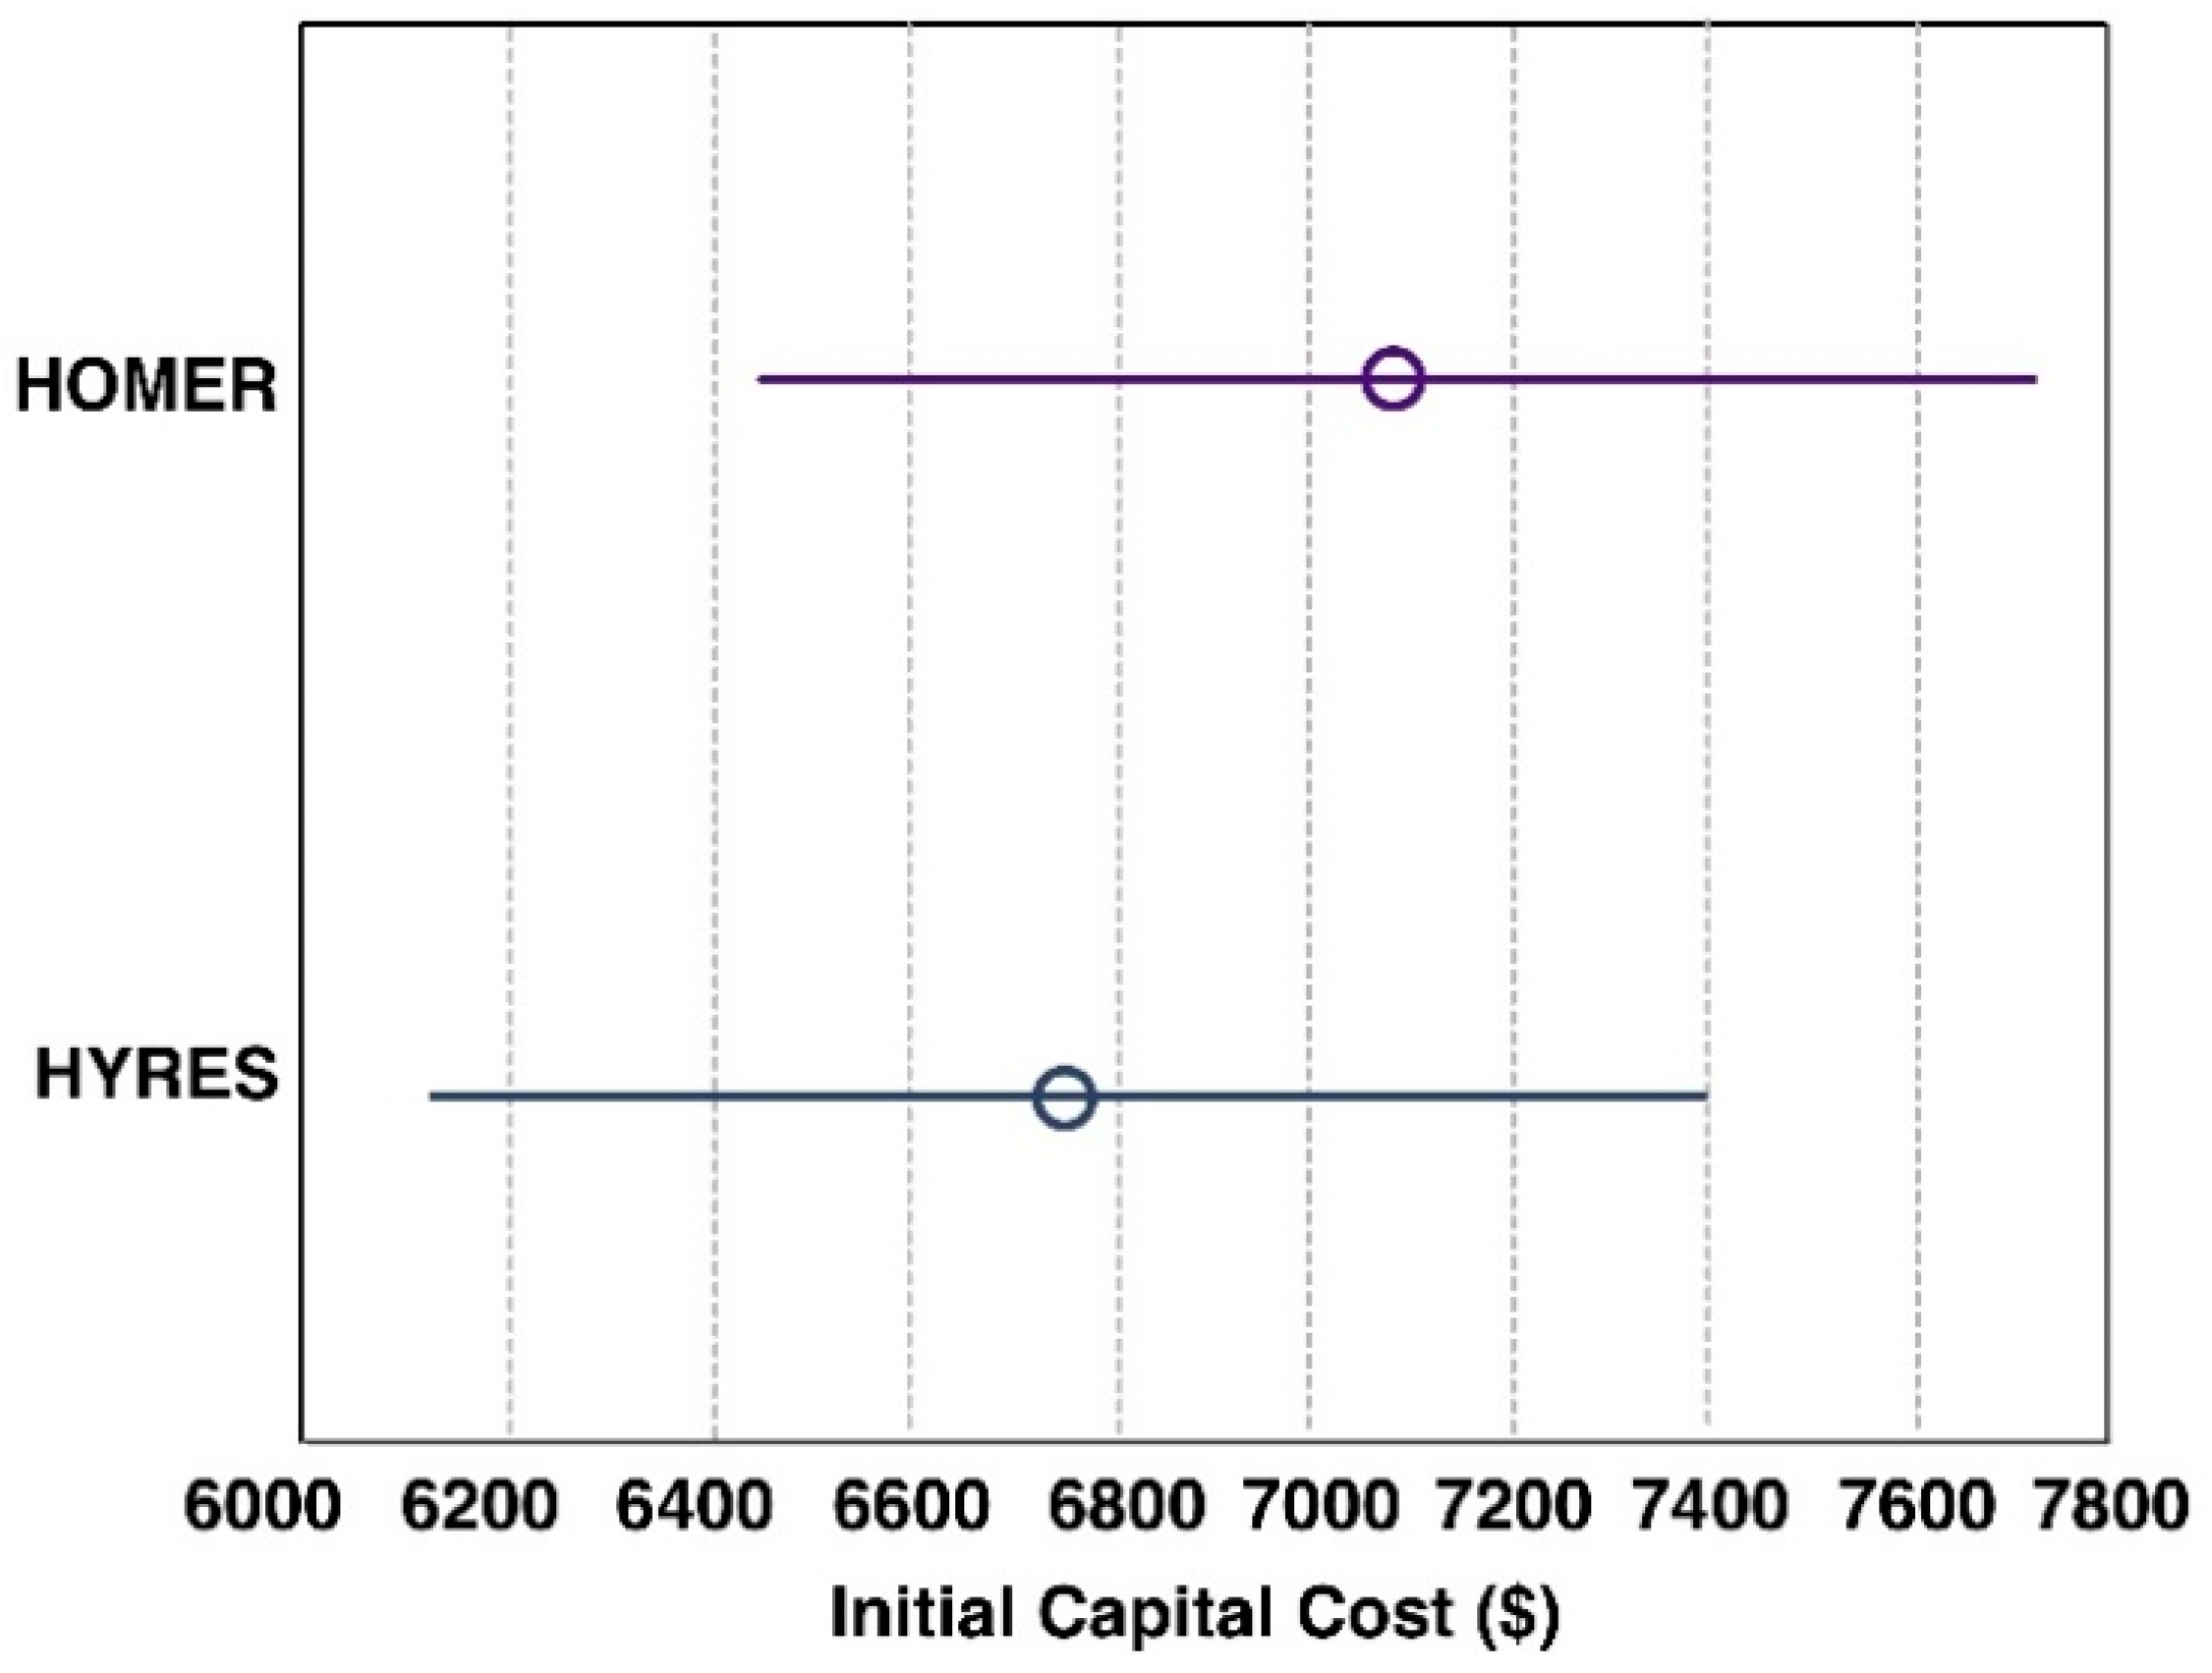
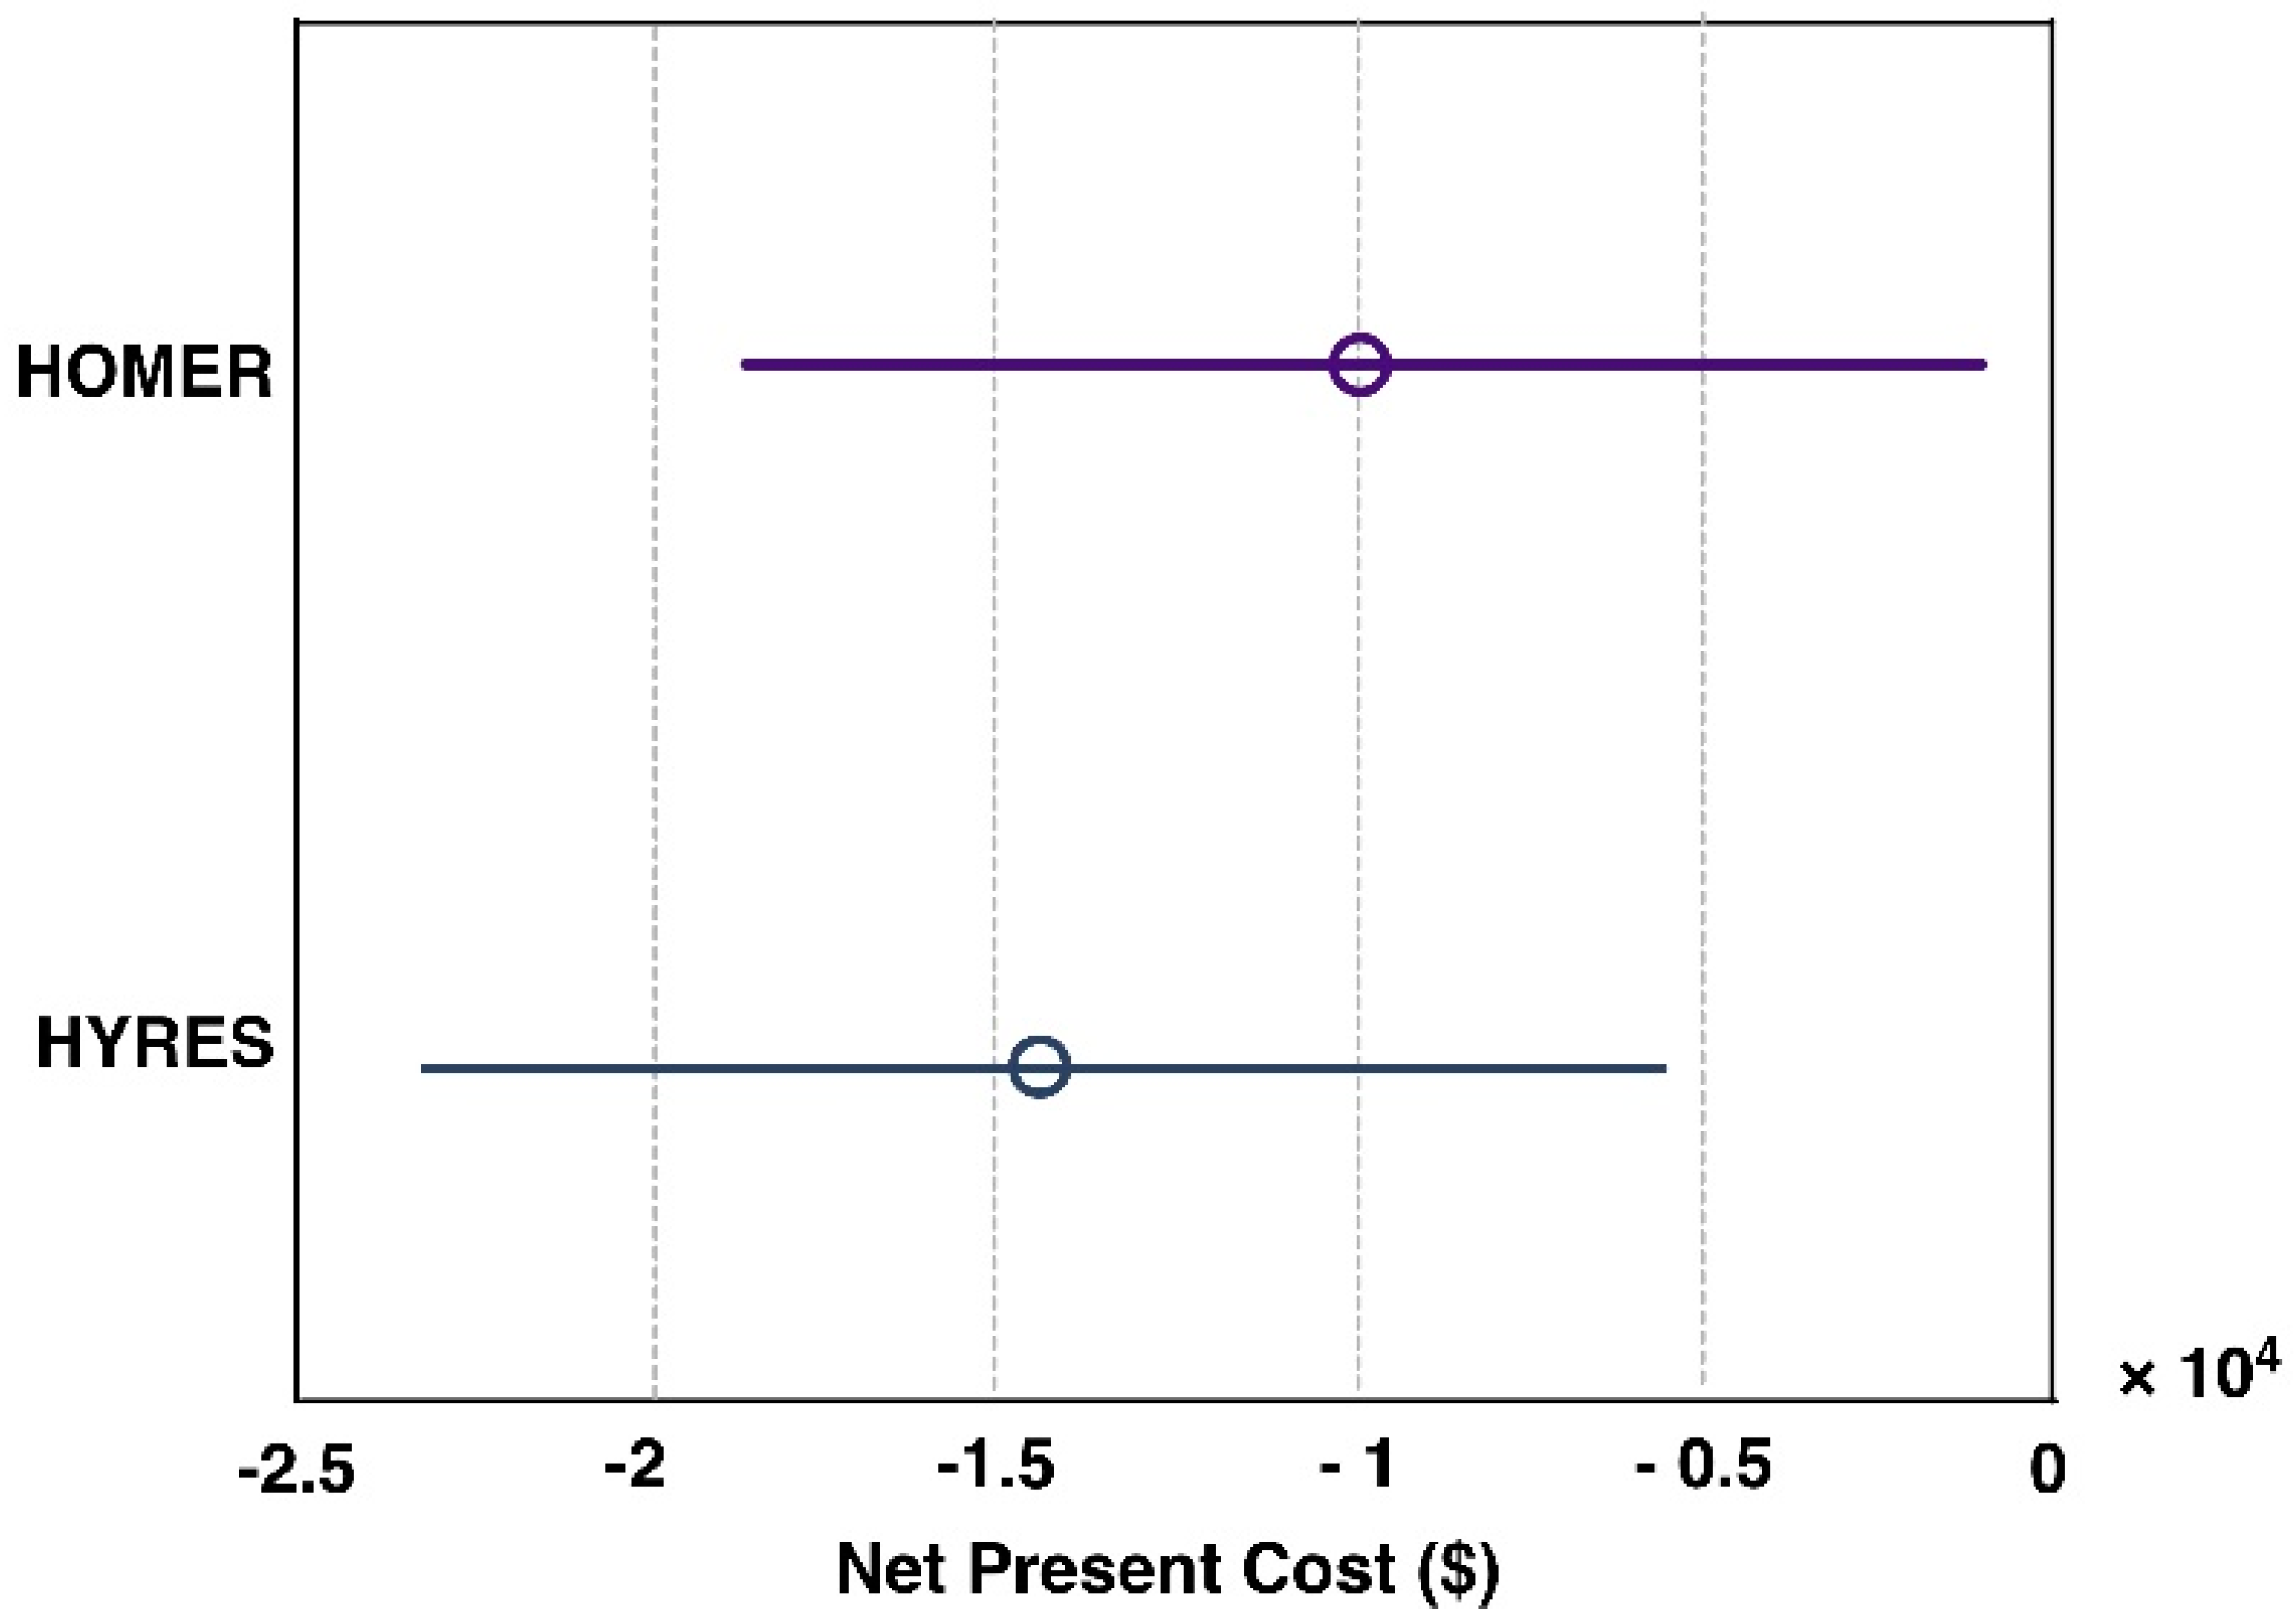
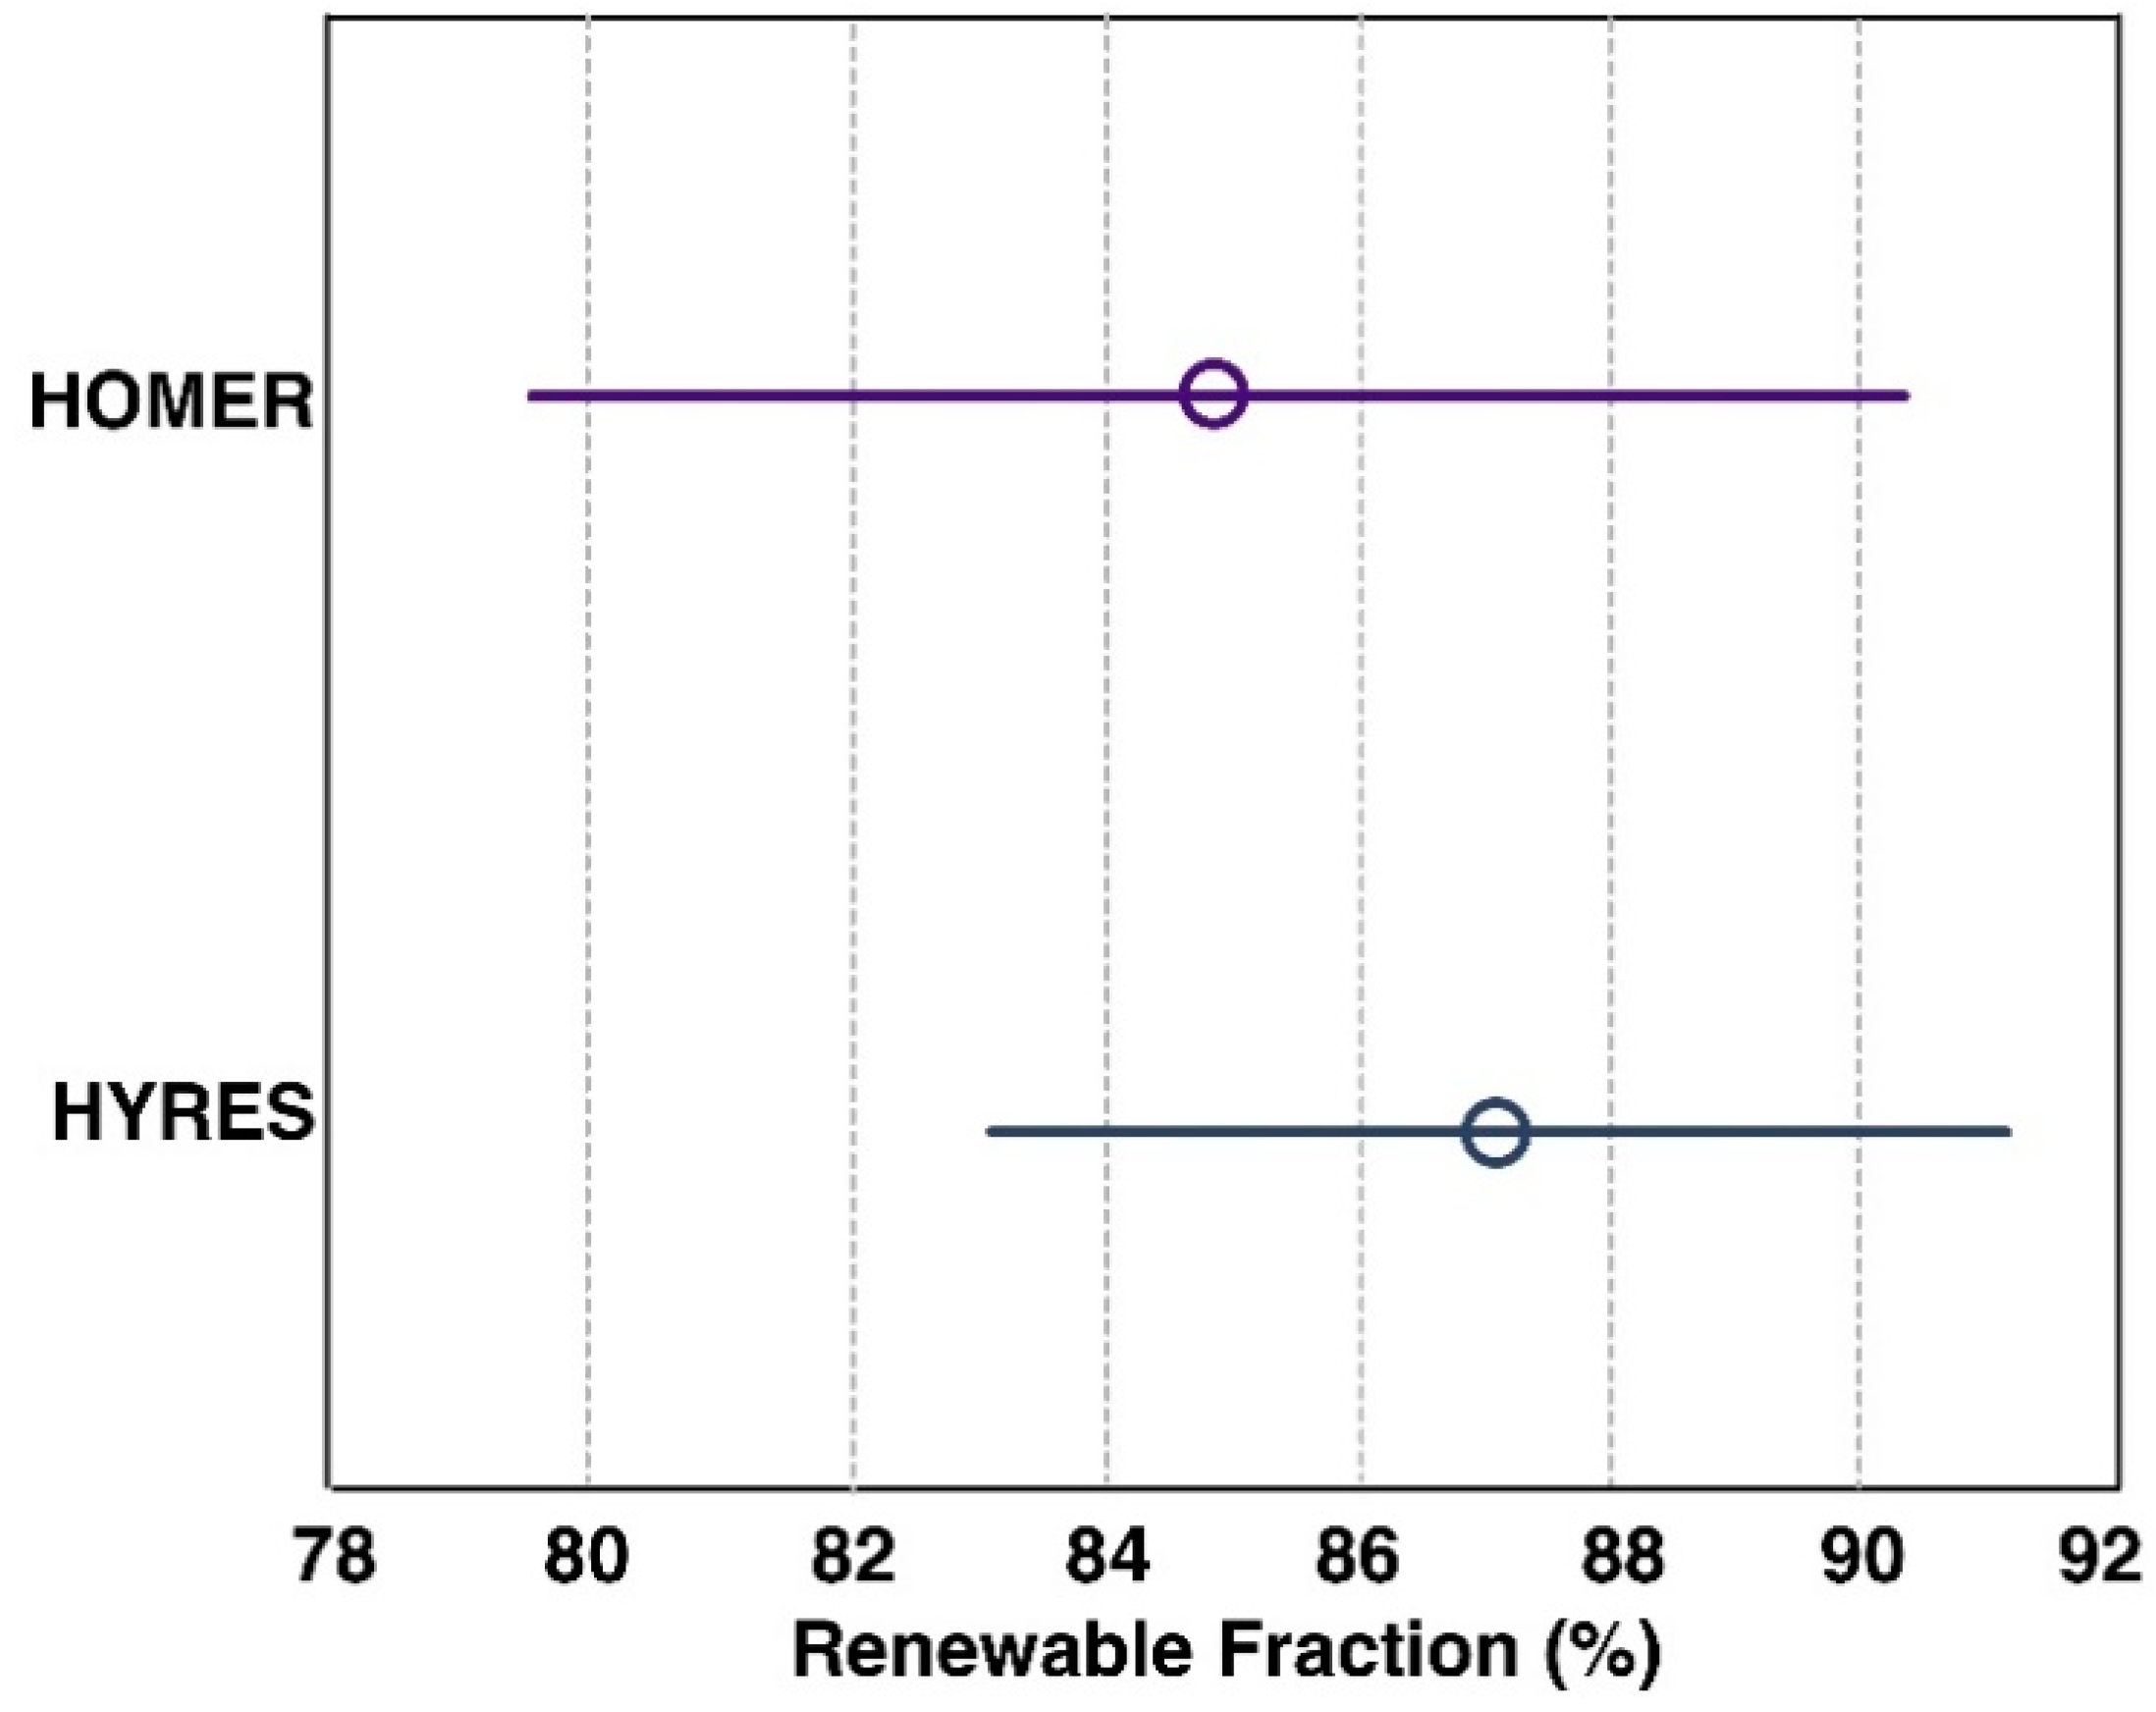
| CASE | Config | Location | User | Reliab. (%) | HOMER | HYRES | ||||||
|---|---|---|---|---|---|---|---|---|---|---|---|---|
| ICC $ | NPC US$ | RF % | P-WT-B | ICC $ | NPC US$ | RF % | P-WT-B | |||||
| Case1 | Config. 1 | Miami | User 1 | 50 | 2507 | 11,254 | 50 | 2.56-0-3 | 2236 | 11,720 | 51 | 8-0-3 |
| Case2 | Config. 1 | Miami | User 1 | 75 | 4774 | 11,409 | 76 | 3.31-0-8 | 4583 | 10,916 | 77 | 12-0-3 |
| Case3 | Config. 1 | Miami | User 2 | 50 | 3810 | 17,726 | 52 | 3.98-0-3 | 3560 | 18,342 | 50 | 14-0-1 |
| Case4 | Config. 1 | Miami | User 2 | 75 | 7359 | 17,918 | 76 | 5.63-0 | 7347 | 17,946 | 77 | 20-0-9 |
| Case5 | Config. 1 | Bquilla | User 1 | 50 | 4739 | 8577 | 98 | 2.46-0-10 | 4858 | 8541 | 100 | 7-0-11 |
| Case6 | Config. 1 | Bquilla | User 1 | 75 | 4739 | 8577 | 98 | 2.46-0-10 | 4858 | 8541 | 100 | 7-0-11 |
| Case7 | Config. 1 | Bquilla | User 2 | 50 | 7170 | 12,980 | 97 | 4.19-0-14 | 6968 | 12,570 | 98 | 11-0-15 |
| Case8 | Config. 1 | Bquilla | User 2 | 75 | 7170 | 12,980 | 97 | 4.19-0-14 | 6968 | 12,570 | 98 | 11-0-15 |
| Case9 | Config. 1 | Fortaleza | User 1 | 50 | 4124 | 7796 | 93 | 1.31-2-5 | 3099 | 6166 | 100 | 1-2-4 |
| Case10 | Config. 1 | Fortaleza | User 1 | 75 | 4124 | 7796 | 93 | 1.31-2-5 | 3099 | 6166 | 100 | 1-2-4 |
| Case11 | Config. 1 | Fortaleza | User 2 | 50 | 5175 | 19,358 | 53 | 3.16-3-1 | 5088 | 10,261 | 100 | 1-4-5 |
| Case12 | Config. 1 | Fortaleza | User 2 | 75 | 9587 | 20,771 | 75 | 5.62-4-7 | 5088 | 10,261 | 100 | 1-4-5 |
| Case13 | Config. 2 | Miami | User 1 | 50 | 8746 | −29,341 | 87 | 8.75-0-0 | 8743 | −15,728 | 85 | 37-0-0 |
| Case14 | Config. 2 | Miami | User 1 | 75 | 8746 | −29,341 | 87 | 11.8-0-0 | 8743 | −15,728 | 85 | 37-0-0 |
| Case15 | Config. 2 | Miami | User 2 | 50 | 8746 | −18,433 | 81 | 11.8-0-0 | 8743 | −12,322 | 78.7 | 37-0-0 |
| Case16 | Config. 2 | Miami | User 2 | 75 | 8746 | −18,433 | 81 | 11.8-0-0 | 8743 | −12,322 | 78.7 | 37-0-0 |
| Case17 | Config. 2 | Bquilla | User 1 | 50 | 8746 | −47,532 | 90 | 11.8-0-0 | 8743 | −65,279 | 92.5 | 37-0-0 |
| Case18 | Config. 2 | Bquilla | User 1 | 75 | 8746 | −47,532 | 90 | 11.8-0-0 | 8743 | −65,279 | 92.5 | 37-0-0 |
| Case19 | Config. 2 | Bquilla | User 2 | 50 | 8746 | −36,623 | 86 | 11.8-0-0 | 8743 | −50,241 | 87 | 37-0-0 |
| Case20 | Config. 2 | Bquilla | User 2 | 75 | 8746 | −36,623 | 86 | 11.8-0-0 | 8743 | −50,241 | 87 | 37-0-0 |
| Case21 | Config. 2 | Fortaleza | User 1 | 50 | 12,142 | −34,482 | 100 | 11.8-0-0 | 12,139 | −52,282 | 100 | 37-0-0 |
| Case22 | Config. 2 | Fortaleza | User 1 | 75 | 12,142 | −34,482 | 100 | 11.8-0-0 | 12,139 | −52,282 | 100 | 37-0-0 |
| Case23 | Config. 2 | Fortaleza | User 2 | 50 | 12,142 | −23,573 | 92 | 11.8-0-0 | 12,139 | −40,867 | 94 | 37-0-0 |
| Case24 | Config. 2 | Fortaleza | User 2 | 75 | 12,142 | −23,573 | 92 | 11.8-0-0 | 12,139 | −40,867 | 94 | 37-0-0 |
© 2019 by the authors. Licensee MDPI, Basel, Switzerland. This article is an open access article distributed under the terms and conditions of the Creative Commons Attribution (CC BY) license (http://creativecommons.org/licenses/by/4.0/).
Share and Cite
Donado, K.; Navarro, L.; Quintero M., C.G.; Pardo, M. HYRES: A Multi-Objective Optimization Tool for Proper Configuration of Renewable Hybrid Energy Systems. Energies 2020, 13, 26. https://doi.org/10.3390/en13010026
Donado K, Navarro L, Quintero M. CG, Pardo M. HYRES: A Multi-Objective Optimization Tool for Proper Configuration of Renewable Hybrid Energy Systems. Energies. 2020; 13(1):26. https://doi.org/10.3390/en13010026
Chicago/Turabian StyleDonado, Katheryn, Loraine Navarro, Christian G. Quintero M., and Mauricio Pardo. 2020. "HYRES: A Multi-Objective Optimization Tool for Proper Configuration of Renewable Hybrid Energy Systems" Energies 13, no. 1: 26. https://doi.org/10.3390/en13010026