Article

Belgian Energy Transition: What Are the Options?

by
Gauthier Limpens
1,2,*,
Hervé Jeanmart
1 and
Francois Maréchal
2
1
Institute of Mechanics, Materials and Civil Engineering, Université Catholique de Louvain, 1030 Louvain-la-neuve, Belgium
2
Industrial Process and Energy Systems Engineering (IPESE), École Polytechnique Fédérale de Lausanne, 1000 Lausanne, Switzerland
*
Author to whom correspondence should be addressed.
Energies 2020, 13(1), 261; https://doi.org/10.3390/en13010261
Submission received: 6 November 2019 / Revised: 23 December 2019 / Accepted: 27 December 2019 / Published: 4 January 2020
(This article belongs to the Section F: Electrical Engineering)

Abstract

:
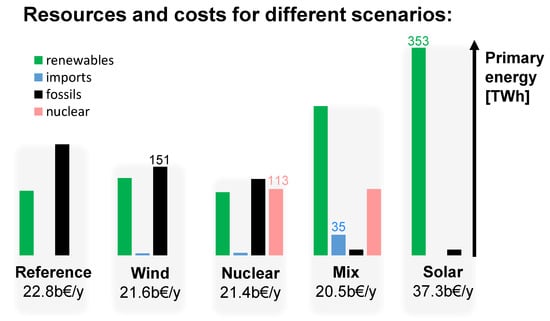
Different scenarios at different scales must be studied to help define long term policies to decarbonate our societies. In this work, we analyse the Belgian energy system in 2035 for different carbon emission targets, and accounting for electricity, heat, and mobility. To achieve this objective, we applied the EnergyScope Typical Days open source model, which optimises both the investment and the operation strategy of a complete energy system for a target year. The model includes 96 technologies and 24 resources that have to supply, hourly, the heat, electricity, mobility, and non-energy demands. In line with other research, we identify and quantify, with a merit order, different technological steps of the energy transition. The lack of endogenous resources in Belgium is highlighted and estimated at 275.6 TWh/y. It becomes obvious that additional potentials shall be obtained by importing renewable fuels and/or electricity, deploying geothermal energy, etc. Aside from a reduction of the energy demand, a mix of solutions is shown to be, by far, the most cost effective to reach low carbon emissions.

Graphical Abstract

1. Introduction

While it is widely accepted that the “energy transition” is urgent [1], it is often unclear what the best scenarios are to reach the set targets. Dangerman and Schellnhuber [2] explain theoretically, and show empirically, that it is very difficult to move away from unsustainable technologies. Moreover, Van Den Bergh [3] explains that a drastic change in investment would create a serious risk of economic instability. Policies to mitigate climate change have technical, economical, societal, and social aspects. As a result, policymakers suffer from a difficulty to define policies as they do not know precisely the shape of future societies and how to reach the objectives. To support their work, governmental and independent agencies, as well as academia, publish studies about regional energy transition where guidelines are proposed.
This paper focuses on the case of Belgium. In the literature, various techno-economic studies were published about the Belgian energy transition. Typically, these studies are commissioned by policymakers who rely heavily on them to make well-informed decisions when developing new legislation about energy. Different actors performed studies, in particular the European Commission (EC) and the Federal Planning Bureau (FPB) who studied the whole energy system with actual and future policies. The European Commission published in 2016 a report presenting, for each country, the reference scenario in 2016 and trends up to 2050 [4]. In this report, Belgium achieves less than 25% reduction of greenhouse gas (GHG) emissions in 2050 compared to 1990. The Federal Planning Bureau publishes each year “the Belgium energy framework with unchanged policies”, the latest study estimates that greenhouse gas emissions in Belgium decrease by less than 30% in 2050 compared to 1990 [5]. Other actors, such as academia and industries, perform different studies at a sector level, usually electricity. For the power grid sector, the transmission system operator (TSO) published a study focusing on the integration of stochastic renewable energy (RE) until 2050 [6]; Ref. [7] performed a technico-economic analysis of the storage demand on the power grid with a supply up to 50% of RE; the EnergyVille consortium analysed different scenarios and concluded that high fossil prices or nuclear extension can limit the GHG emissions of the power sector below the emissions of 2016 [8]. In a previous work, we performed a technical study based on the energy return on investment (EROI) metric to analyse the electricity storage needs for the electricity transition [9]. Finally, in 2013, the FPB with two regional energy institutes (VITO, in Flanders and ICEDD, in Wallonia) studied an energy system relying only on renewable energies in 2050 [10]. They concluded that the target is feasible and can be combined with economic growth; however, “the analysis leads to the undeniable observation that drastic changes in a multitude of areas throughout society are required to obtain the desired level of renewable energy penetration in 2050” [10].
In Table 1, we compare the different studies based on the following four criteria: (i) does the study include all sectors (electricity, heat and mobility)? (ii) does the study provide different scenarios with different CO2 emissions targets? (iii) does the study achieves low carbon society (or high share of renewable energy); (iv) are the model and data open source?
The analysis reveals that few studies include all sectors and reach low carbon societies, except two. Both are based on the TIMES/MARKAL model, which is a reference in scenario analysis. The model is open access [13]; however, the different versions for each country are not open. In addition, these studies do not share the data even if a part of them is enumerated in the reports [8,10]. As a consequence, these studies cannot be replicated and assumptions made are hidden. Evenmore, as the studies achieving low carbon society were published in 2013 and 2017 [10], the conclusions might not be longer relevant. Using models enables policy and decision makers to steer towards the best configuration. However, when the code is not available, the user is left with “what if” questions: what if the operating conditions (e.g., user demand) change; what if the social habits of the citizens change (e.g., better acceptability of public transportation); or what if the parameters (e.g., car efficiency) of the model are uncertain. All these questions can be answered when the code is made available and can be used by the sponsor of the study or by anyone.
Consequently, we use EnergyScope Typical Days (EnergyScope TD), a novel open source energy planning model, presented in [14]. The model optimises both the investments and the operation of the entire energy system accounting for all the energy flows within its boundaries, including electricity, heating, transportation and non energy use. This version of the model, including the mathematical formulation, documentation and data, is available in the Supplementary Material (the code and its latest documentation are available on the repository [15]). The model has been applied to the Belgian energy system in 2035 for different CO2 targets and under different assumptions. The year 2035 appears as a good trade-off between a long-term horizon where policies can still be implemented and a horizon short enough to be representative of tomorrow society with a toolbox of technologies already known. A special focus is given on stochastic renewable energy integration and storage technologies, as they represent a major challenge for the transition. Including these technologies requires an hourly resolution.
Through this paper, we aim at contributing to the scientific debate on the transition by: (i) a study showing, among others, the steps and technologies relevant in the Belgian energy transition; (ii) proposing a fully documented open source model (using an open source solver: GLPK) that represents the entire Belgian energy system; and (iii) an entire database with references for the Belgian energy system and technology potential (see Supplementary Material). Nevertheless, the model is not suitable for all applications and its limitations are developed in the discussion section.
In the following section, we first present the model and the key performance indicators used (Section 2). In Section 3, we present the case study and verify its consistency based on the actual state of the Belgian energy system in the known year 2015. In Section 4, the energy transition is detailed and analysed. Limitations are identified and alternative scenarios are proposed to phase out fossil fuels. In addition, we discuss the hypotheses and the results obtained from a critical perspective.

2. Methodology

In this paper, we use the open-source energy model EnergyScope TD [14], a linear programming (LP) model. In the literature review, the model appeared as a suitable open source energy model to optimise the entire energy system including high shares of renewable [14]. In fact, EnergyScope TD represents with the same level of detail the heating, mobility, and electricity sectors. The main features are: (i) satisfying the system end-use demand, accounting for electricity, heat and transport; (ii) optimizing both the design of the system and the operation by minimising its overall cost; (iii) an hourly resolution (time step) which makes the model suitable for analysing the integration of intermittent REs and storage; (iv) a short computational time (1–5 min) as a result of the use of typical days and a rebuilt method to represent a year with an hourly resolution. Hereafter, we introduce the energy model, the metrics and the energy transition approach implemented in the following sections. The exhaustive description of the methodology is described in [14]. The mathematical formulation and the data for the Belgium model are described in the Supplementary Material.

2.1. Conceptual Modelling Framework

The proposed modelling framework is a simplified representation of an energy system accounting for the energy flows within its boundaries. The system is considered to be a single cell with limited representation of the grids. As represented in Figure 1 (some icons in figures are from [16]), the energy system can be divided into three parts: resources, energy conversion, and demand. The resources account for the primary energy, which can be imported or locally produced. At the very end, the energy demand is imposed. The model primary objective is to satisfy the energy balance constraints, meaning that the demand is known and the supply has to meet it. Contrary to the modelling practice, we use the end-use demand (EUD) instead of the final energy consumption (FEC). The EUD is the real end user demand, whereas the FEC is the energy that a technology consumes to supply end user demands. As an example, the end user does not need gasoline for his car, instead he needs mobility passenger (which has the kilometre-passenger as units). The input for the proposed modelling framework is the EUD in energy services, represented as the sum of four components: electricity, heating, mobility and non-energy demand. Heat is divided into three end-use types (EUTs): high-temperature heat for industry demand, low temperature for space heating and low temperature for hot water. Mobility is divided into two EUTs: passenger mobility and freight (Passenger transport activity from aviation is accounted for in passenger mobility (excluding international extra-European Union (EU) aviation).). Non-energy demand is based on the International Energy Agency (IEA) definition, “fuels that are used as raw materials in the different sectors and are not consumed as a fuel or transformed into another fuel.” [17]. As examples, the European Commission includes as non-energy the following materials: “chemical feedstocks, lubricants and asphalt for road construction.” [4]. In between the resources and the demand, are the technologies that can convert an energy to another, such as a heat pump that transforms electricity to low temperature heat. The energy system encompasses all the energy conversion technologies needed to transform resources and supply EUD.
Figure 1 offers a conceptual illustration of such an energy system, where as an example of energy conversion chain, gas can be imported and used through CHP to produce electricity. This electricity can be stored in pumped hydro storage and later consumed by a train to supply mobility passenger, etc.
The model objective is to minimise the total annual system cost (or greenhouse gas emissions) while optimising its design over a year and operation with an hourly resolution. The model belongs to the “snapshot” category, in the sense that the energy systems is entirely rebuilt in a target year without relation with the existing one. An hour time scale resolution is required to verify how the system handles high shares of stochastic renewables, while a year horizon is necessary for operating a long term storage. However, as many days have similar profiles, such as solar, wind or electrical deman, they bring redundant information. Therefore, by matching the 365 days of the year with 12 typical days, the computational time can be reduced by three orders of magnitude while verifying a consistent accuracy [14].

2.2. Performance Indicators

In this work, we use as performance indicators the total yearly system cost, the RE share and the CO 2 emissions. The following equations are extracted from the Supplementary Material. The yearly system cost (1) is defined as the sum of the annualized ( τ ) investment cost of technologies ( τ C i n v ), the operating and maintenance cost of technologies ( C m a i n t ) and the operating cost of the resources ( C o p ).
C t o t = j T E C H τ ( j ) C i n v ( j ) + C maint ( j ) + i R E S C op ( i )
In Equation (2), the total yearly emissions of the system ( G W P t o t ) are defined as the emissions related to resources ( G W P o p ). It accounts for production, transport and combustion of resources. We motivate this metric as it is the one used by official agencies, such as the EC or the IEA. Table 2 summarizes the specific CO 2 emissions for each resource. Resources not present in the table, such as wind, geothermal, etc. are assumed to have negligible CO 2 emissions. Two values for the emissions are proposed: one accounting for the impact associated with production, transport, and combustion (based on GWP100a - IPCC2013 [18]) and the other accounting for combustion only (based on Quaschning [19]). Total emissions are used to assess the energy system emissions. Combustion only is used to calculate the direct CO 2 emissions that can be captured and used through a carbon capture technology (presented later).
GWP tot = i RES GWP op ( i )

3. Case Study: Belgium

The case study represents the real-world national energy system of Belgium; which has been partially studied in previous works [9,22]. In this section, we present an overview of the Belgian future energy system. Then, we demonstrate the performance of the tool by assessing whether the model can reproduce the state of the Belgian energy system in the year 2015. Finally, we present the critical input parameters for 2035, such as the renewable energy potential and the end-use demand.

3.1. Future Energy System Overview

Figure 2 shows the energy system implemented in the model: it includes 28 layers, 9 end-use demand types, and 96 technologies (from which new technologies, such as the production of synthetic fuels).
In the energy system, a distinction is made between biomass and waste. Waste accounts for all the fossil waste, such as plastics, whereas biomass is organic and assumed renewable. Biomass is split into two categories: one that can be easily digested by bacteria (wet biomass), such as banana peel; and one that cannot (woody biomass), such as wood. Hence, the organic waste generated by the municipalities is accounted for in wet biomass and not as fossil waste. The proposed system accounts for existing technologies and also for promising technologies including storage technologies or synthetic fuels. A special focus is given to synthetic fuels in Appendix A.1.

3.2. Demonstration for the Year 2015

Long-term planning models cannot be validated as they model an unknown future [23,24]. However, the performance and consistency of such models can be demonstrated by representing the past or present state of the system. Thus, we assess whether the model can reproduce the state of the Belgian energy system in the year 2015. The Belgian energy system in 2015 is a fossil-based system, with traditional fuels accounting for more than 93%. Besides fossil fuels, uranium (18.6%), waste (1.3%) and electricity imports (3.3%) are accounted for as traditional fuels (Following the IEA definition [17], we assume, for nuclear energy, that the primary energy equals the thermal production. This methodology is in line with Eurostat [25]).
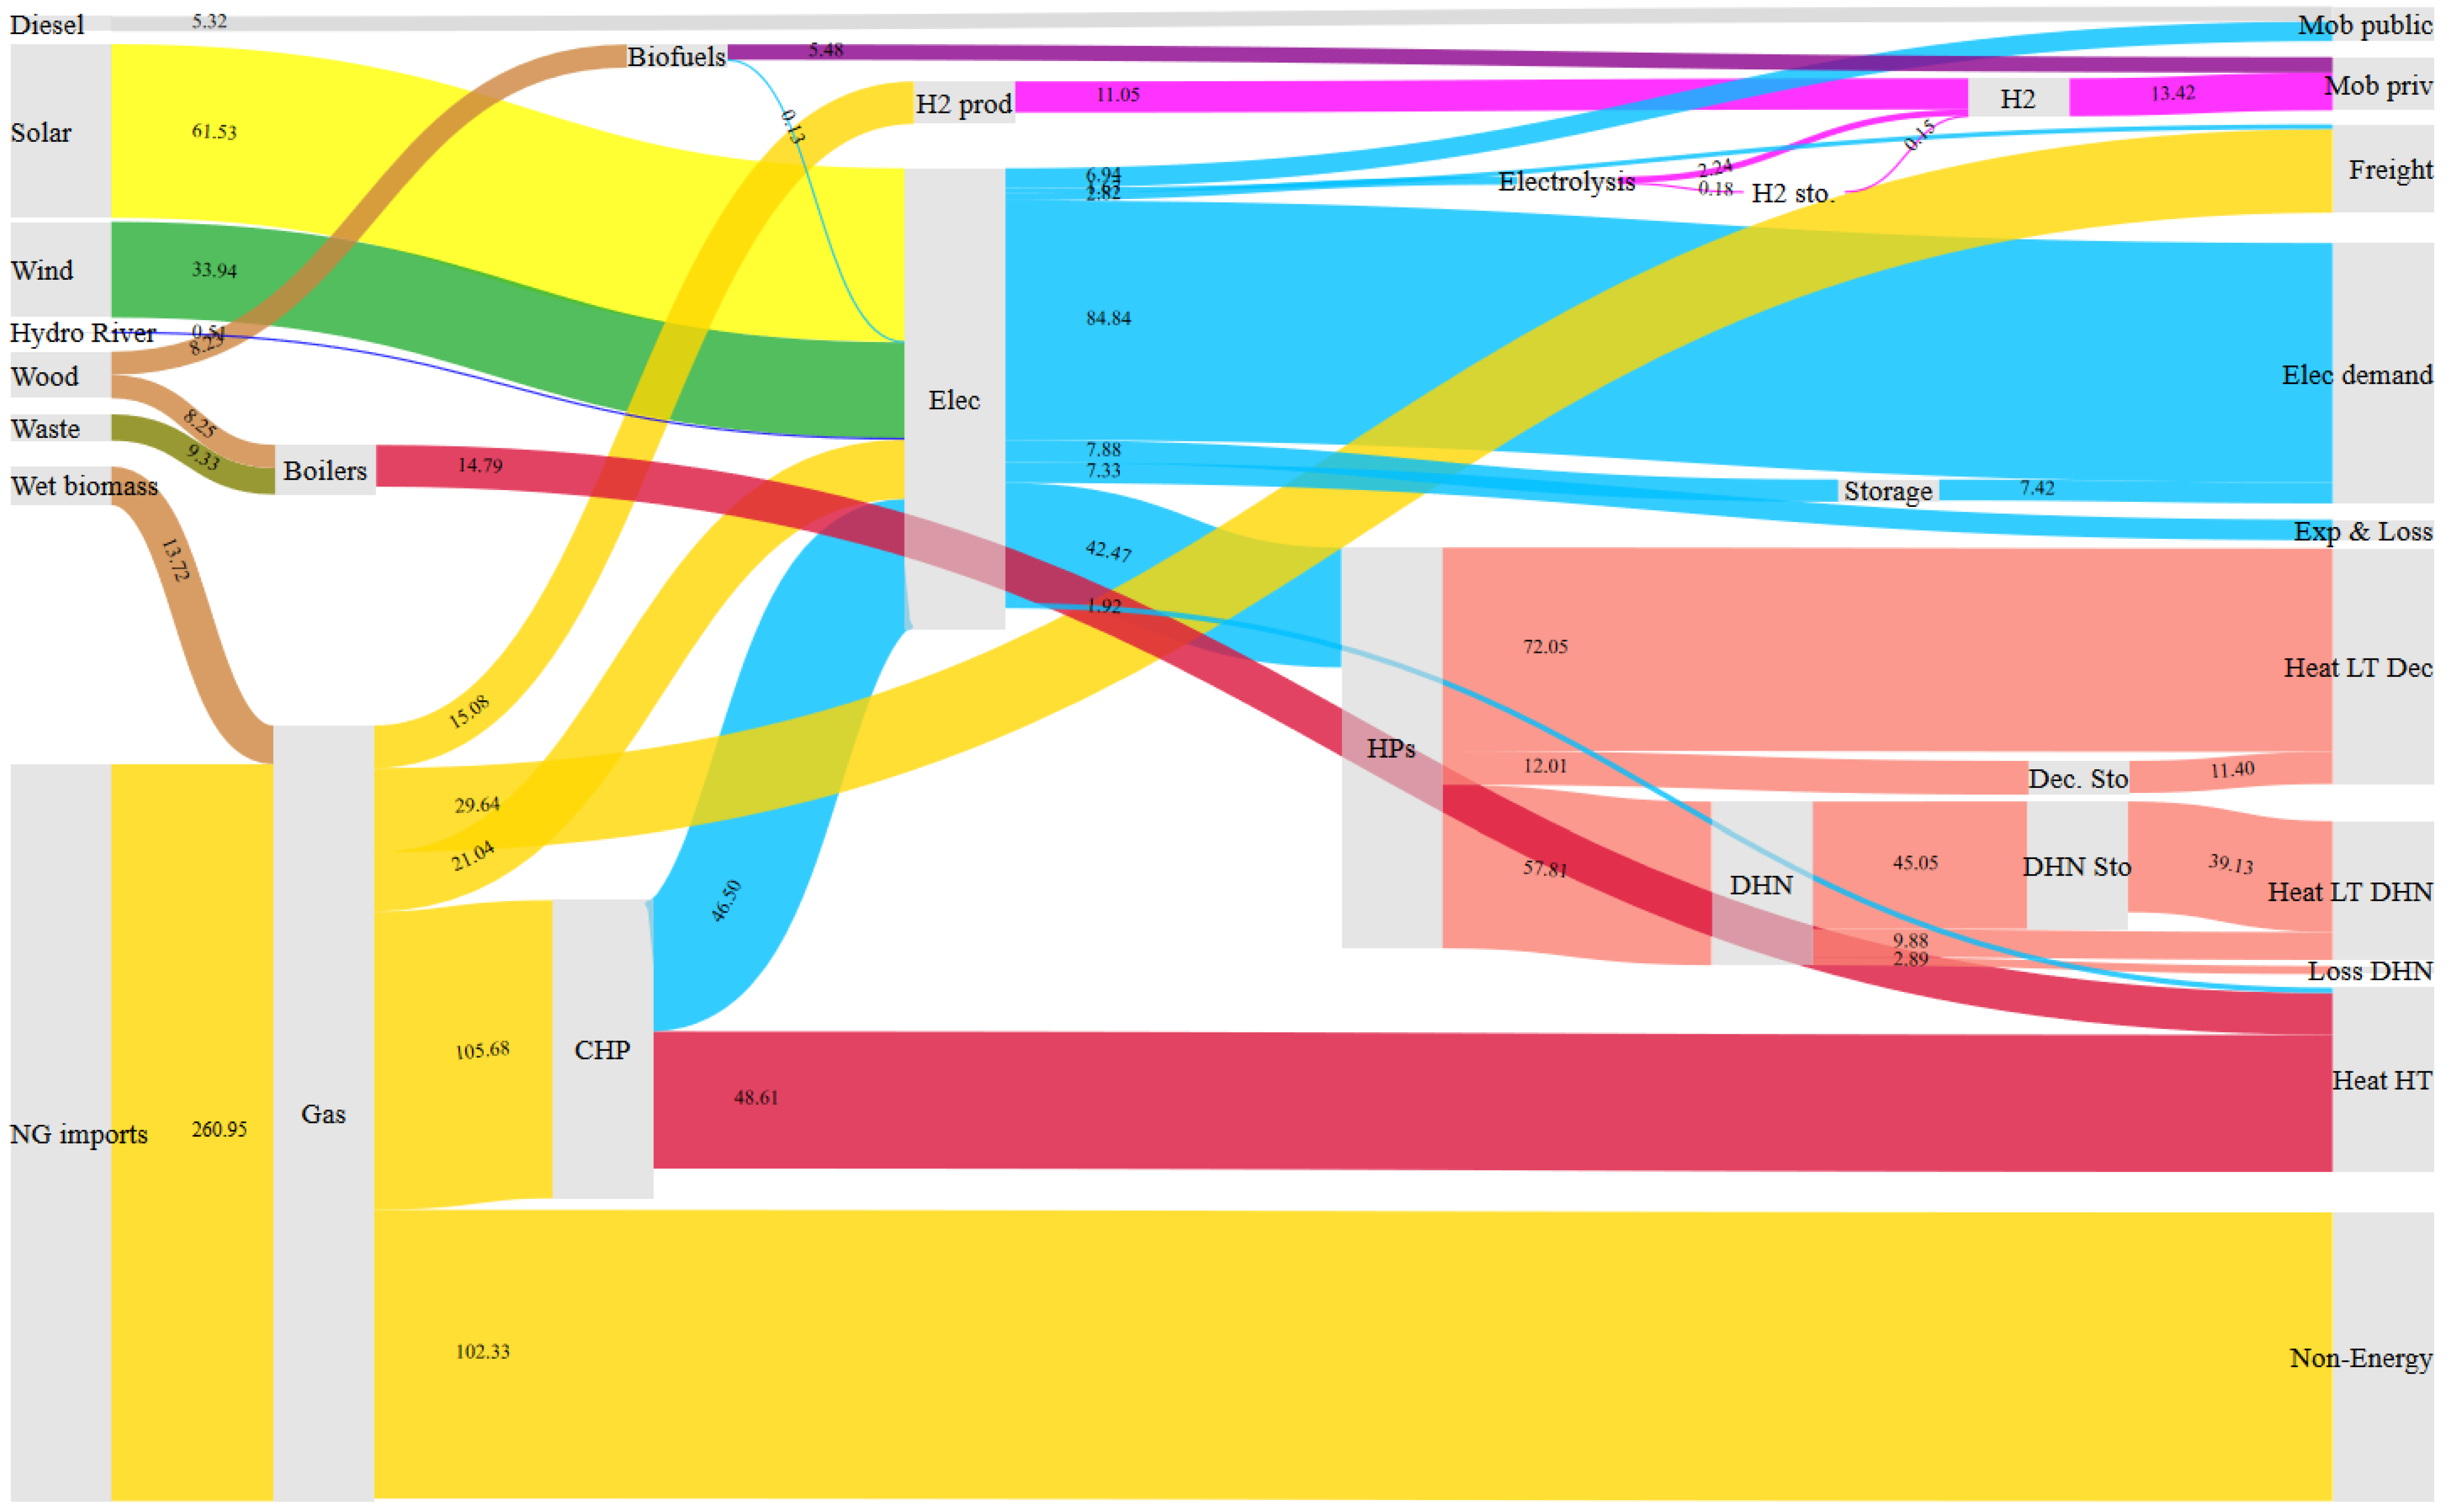
In terms of primary energy consumption, the model estimates 603.3 TWh/y which is similar to Eurostat (620.2 TWh/y) [26]. Similarly, in terms of CO 2 emissions related to the energy sectors, the model estimates 96.9 (MtCO2/y) where Eurostat and IEA calculated 92.5 and 97.8 (MtCO2/y), respectively. The computational method and the results are described in Appendix A.3, such as the Sankey diagram (Figure A12) which represents the annual energy balance. Overall, the EnergyScope TD model offers an accurate picture of the primary energy demand and greenhouse gas emissions of the Belgian energy system.

3.3. Scenario in 2035

The European commission, in line with the work of Belgian federal agencies, defines different scenarios for the country. As an example, the report “EU Reference Scenario 2016 - Energy, transport and GHG emissions - Trends to 2050” offers energy demand trends until 2050 [4]. This report is based on the PRIMES model, which aims to “simulate energy consumption and energy supply system”. Based on a partial equilibrium market, PRIMES computes a long-term forecast, with a 5 year time step, for the energy demand at a regional scale including all the European union countries (details about PRIMES model are available in its documentation [11] and official website: [27]).

3.3.1. Renewable Energy Potential

The energy transition relies on renewable energies, which makes their deployment potential a critical parameter. Table 3 and Table 4 summarise the installed capacity in 2015 (based on our results) and the renewable resource potential, respectively.
Wind, solar, and biomass are foreseen to be the main resources. No limit is assumed for PV (this assumption will be discussed in a next section). The hydro potential is very limited and almost fully exploited. Even if geothermal heat is used for heating through DHN since 1986 at Saint Ghislain [28], research about the geothermal potential in Belgium are at their early stages. In 2015, a new project started (the Balmatt project, VITO). Presently, the installation produces 1.5 MW of electricity (in 2019). The project is expected to scale up to 5 MW of electricity [29]. However, there is no large facility yet and the potential is not accurately estimated. A study performed by VITO evaluates the potential in Flanders to 3.1 GWe and they extend it to 4 GWe for the whole Belgian potential [10]. However, because of a lack of reliable sources about geothermal potential, we consider the potential as null in the reference scenario.

3.3.2. Energy Demand

The European Commission published a report offering an overview of numerical values of the future energy system, such as yearly final energy consumption or fuel used by sector in 2035 [4]. Based on the final energy consumption, we estimated the yearly end-use demand used as an input parameter in the model (the detailed calculation is proposed in Appendix A.2).
Table 5 summarises the differences between the EDU in 2015 and 2035. The demand is increasing except for the heating sectors. This growth is related to the increase in population (+19.2%) and gross domestic product (GDP) (+44.2%) in the same time period.
The resulting energy demand is an input parameter to the model and reducing the demand is not allowed. However, this representation will be discussed in Section 5.2.

3.3.3. Current Energy Policies

Based on the current policies, Belgium plans to phase out coal and nuclear. Hence, we suppose that the coal availability is limited to the one of 2015 (33.35 TWh) and that nuclear power plants are shut down in 2025, thus not available. In addition, governments encourage the deployment of renewable energies, hence we fix the minimum capacities of solar and wind to the existing ones of 2015.

4. Results—Belgian Energy Transition

In this section, we first analyse the Belgian energy transition without limiting the solar potential. Then, we criticise the amount of PV needed to achieve low CO 2 emissions and, by imposing a realistic limit, we focus on the CO 2 emissions optimum scenario. In conclusion, the RE potential is insufficient to answer the demand, we analyse various options to further decrease CO 2 emissions.

4.1. Transition without Solar Limitation

In the following, results are illustrated for different yearly CO 2 emissions targets. They are analysed from different perspectives. First, we will analyse the primary energy supply and see how it is consumed in the energy system. Then, through a bi-objective optimisation between the system cost and CO 2 emissions, we analyse the technologies deployed to achieve low CO 2 emissions.

4.1.1. Primary Energy

Figure 3 and Figure 4 show the primary energy supplied and use, respectively, for 2015 and different CO 2 emissions constraints in 2035. In Figure 3, the focus is on the resources, while in Figure 4 the focus is on the conversion, such as the amount of resources converted to electricity.
Without limitation on CO 2 emissions, coal and gas are the most used resources as they are the cheapest fuels (see Supplementary Material for sources). Coal has a limited availability ( 33 TWh which is the amount of coal used in 2015). To reduce the system emissions, at first, more efficient technologies are used. We deem a technology “efficient” if it consumes less primary energy for a similar or improved service than a traditional technology, such as a combined cycle gas turbine (CCGT) plant which consumes less gas for electricity production than a traditional coal power plant, or a HP which consumes less primary energy than a boiler to supply the same amount of heat.
By shifting to hear pumps in the low-temperature heat sectors and by gas combined heat and powers (CHPs) in the industrial sector; the heat can be produced at a lower cost and consume less primary energy. In parallel, technologies based on RE are deployed, first wind, then woody biomass, solar and renewable waste. In addition, non-RE wastes are used almost from the beginning. Once coal is phased out and all renewable potential—except solar—are exploited, the system relies on PV to reduce its NG consumption.
Compared to 2015, the mobility mainly relies on fuel cells and NG in all scenarios. This is a consequence of two phenomena. First, the gas price is almost 50% cheaper than gasoline or diesel. Second, the investment cost of passenger and freight transport technologies is not accounted for in the model. This latter choice is motivated as the investment cost is covered by the owner of the vehicle and that no reliable sources have been found for the cost of public mobility or infrastructures. As a consequence, only the resources used in mobility influences the choices of vehicles. Another difference between 2015 and 2035 is the LFO use. In 2035, LFO is replaced by coal and gas for heating and to gas for non-energy demand. Indeed, as there is a small cost difference between an oil or gas-based for boilers and CHP technologies, the fuel cost is more critical. As the LFO is 40% more expensive than other fuels, this fuel will be unused.
Both Figure 3 and Figure 4 show that the primary energy consumption decreases as we impose a reduction of CO 2 emissions in the system. In the first scenario (high CO 2 emissions), the system needs 561 TWh of primary energy. This is 7% less than in 2015 (based on Table A1, the primary energy consumption in 2015 is 603 TWh, accounting for 0.62 TWh of curtailment). This amount is reduced below 420 TWh between 80 and 60 MtCO2/y and then increases for lower CO 2 emissions. This primary energy reduction is achieved thanks to the integration of more efficient technologies.
At lower CO 2 emissions (≤55 MtCO2/y), the primary energy needed increases. This can be explained by two facts related to the difficulty to integrate a large PV production. First, the system relies more on storage technologies to provide flexibility to the system. Second, a flexible resource (NG) is exclusively replaced by an intermittent one (solar), hence production peaks are hard to absorb and are partially curtailed. As a consequence of these two facts, extra primary energy is needed to compensate these losses.
At 80 MtCO2/y, the system reaches the RE potential, except for solar. Hence, it deploys massively PV panels to reduce the NG consumption. However, the electricity EUD remains constant. This has three consequences. First, the amount of electricity produced increases. Second, this surplus is used in heating and mobility sectors through industrial direct electricity heating or H 2 production for mobility (we define direct electrical heating in opposition to heat pumps; it stands for a resistor based heating). Third, at low CO 2 emissions (≤70 MtCO2/y), the capacity of PV exceeds 60 GW and the production peaks are too expensive to be absorbed, and are thus curtailed.
Limited RE resources can be integrated in the heat and mobility sectors. In our work, the renewable resources for heat supply are biomass (woody and wet) and thermal solar. Thermal solar does not appear as a promising technology for two reasons. First, it has a negative correlation with heat demand. Indeed, when there is strong irradiation, there is usually a warmer ambient temperature and the heat demand is lower. Second, thermal solar needs to be backed up during lack of sun, which is normally done by fossil fuel boilers. Therefore, the electricity sector is the first one to achieve a high share of RE. Then, electrification through technologies, such as trains or direct electrical heating, allows heat and mobility sectors to use electricity from renewable sources.

4.1.2. Pareto Front and Integration of Technologies

In the following section, we propose analysing the previous results from a cost perspective, and more precisely, through a Pareto frontier graph. As linear programming problems have only one objective, the total annual cost of the energy system and the CO 2 emissions can be alternatively used as objectives to minimise. Then, the two objectives can be combined using the ε -constraint method [30]. This method seeks trade-off solutions by formulating a bi-objective problem in which one of the objectives is minimised, and the other is constrained by an upper value ε , which is set parametrically. As a result, the graph shows a front, which represents for each targeted CO 2 emissions, the cost of the optimal system. Hence the pareto graph shall stop at the lowest yearly system cost. However, here, we force the system to emit more CO 2 in order to get closer to the system in year 2015. Compare to the cost optimum scenario, emitting more CO 2 means consuming more fossil resources which results in an overall cost increase.
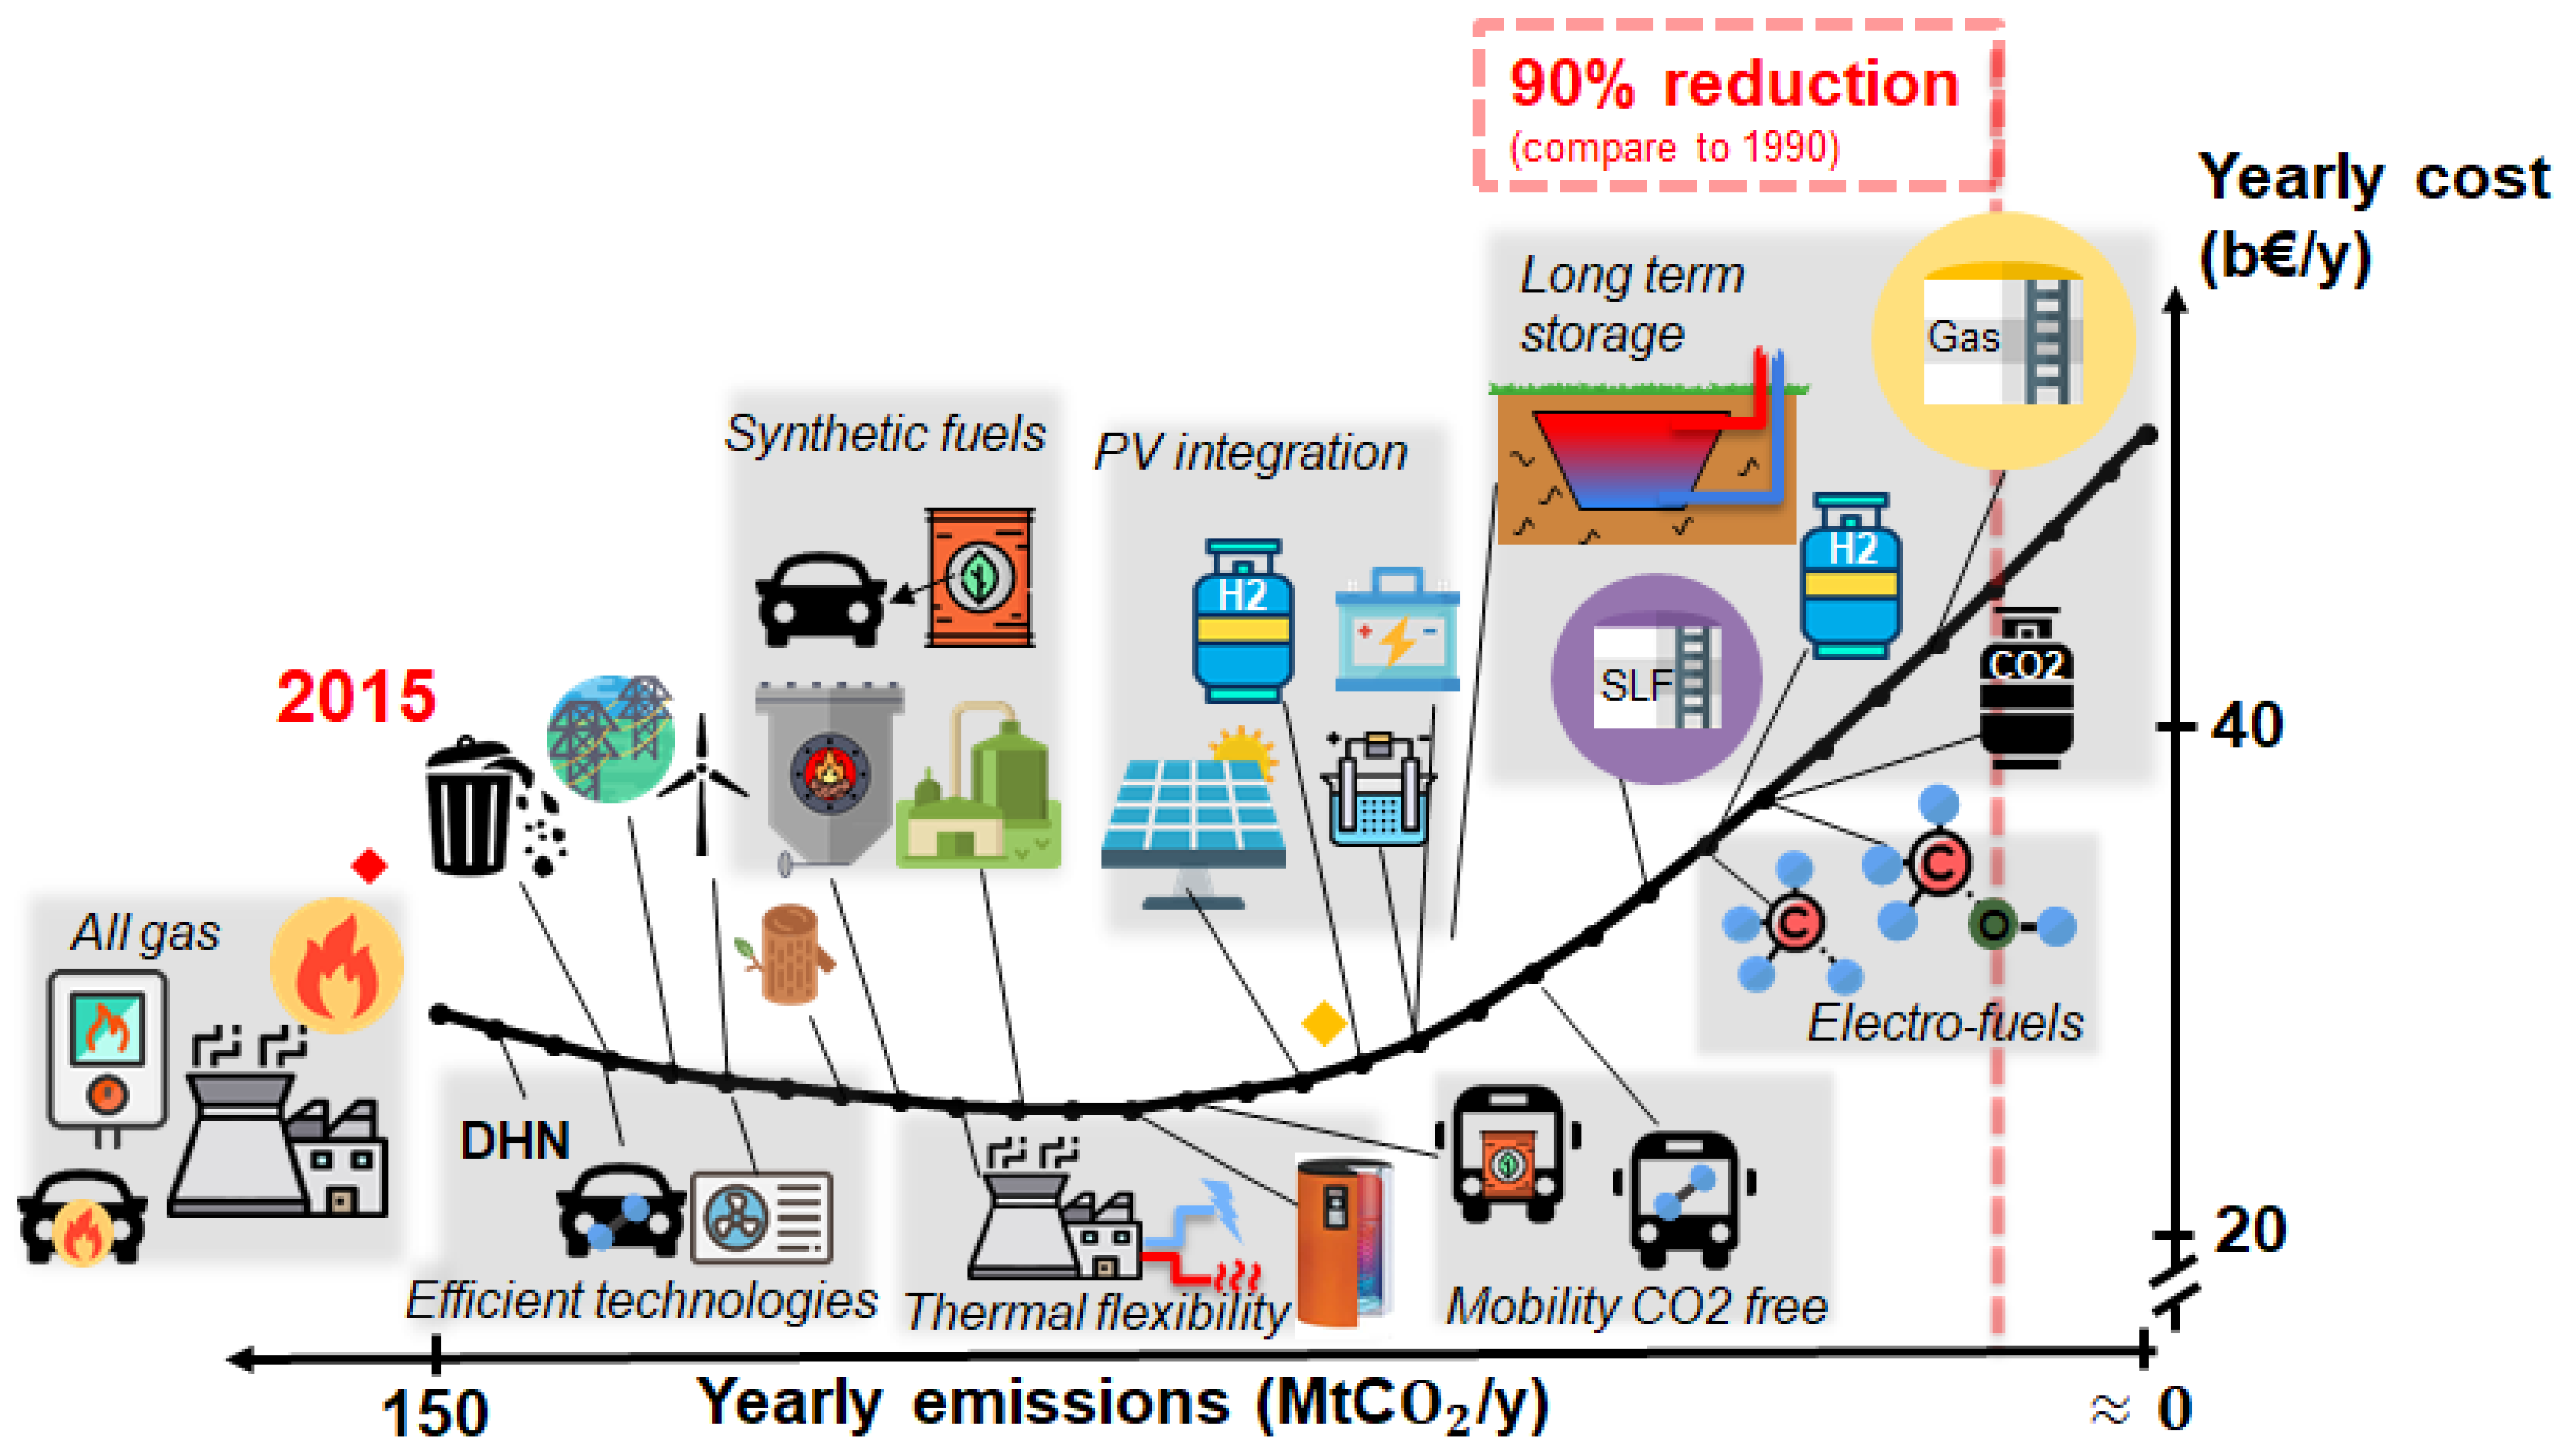
Figure 5 illustrates the system cost evolution during the energy transition. At first, the overall cost decreases. On the one hand, using less primary energy results in a lower cost for the resources which reduces the system operational expenditure (OPEX). On the other hand, more efficient technologies are more capital-intensive which leads to an increase in capital expenditure (CAPEX). However, the balance results in a decreasing yearly total cost.
At first (150 MtCO2/y), the electricity is produced by CCGTs power plants (104 TWh) and PV (4 TWh). The high and low temperature heat demands are exclusively supplied by coal boilers and gas boilers. District heating network (DHN) is at its minimum (2%). The fuels used in mobility are NG and electricity. NG mainly for freight and public mobility, and electricity for tramways and trains. In addition, H 2 is produced by NG reforming or electrolysis and later used for mobility. Appendix B.1 gives a closer look to the installed capacity for power and heat generation.
In Figure 5, the energy transition is split into six steps which can be logically grouped into two categories: efficiency and decarbonisation. First part is a transition to more efficient technologies as previously explained. Between 150 and 90 MtCO2/y included, renewables are integrated in the power production; gas boilers are replaced by HPs for low-temperature and by wood and waste boilers in high-temperature; hydrogen vehicles reduce the share of NG in private mobility. Below 105 MtCO2/y, wind, hydro, and HP are fully deployed. In addition, NG CHPs replace coal boilers and the system achieves its optimum cost at 95 MtCO2/y. Below, the integration of more efficient technologies increases the overall cost system. PV becomes significant (≈29 GW) and thermal flexibility is used to facilitate PV integration. Thermal flexibility comes from two sides, at a low-temperature level, HP are coupled with thermal storage and heat is produced during peaks (usually noon), stored and later used when electricity is lacking (usually nights). At a high-temperature level, the supply switches between direct electricity during excesses and CHPs during scarcity.
In between efficiency and decarbonisation parts, the synthetic fuels production appears, mostly from renewable wastes that are digested and converted to synthetic natural gas (SNG) (Appendix A.1 offers a special focus on synthetic fuels production technologies). Also, pyrolysis transforms woody biomass into synthetic liquid fuels (SLFs), later converted and used for private and public mobility.
At lower emissions than 80 MtCO2/y, PV is massively deployed and the decarbonisation part starts. The excesses were absorbed through power to heat (PtH) but now require also electrolysers and batteries. These latter are part of the PV integration step. At lower emissions, the amount of hydrogen produced by electrolysis becomes significant, and part of the mobility switches from synthetic fuels to H 2 . H 2 storage is deployed to smooth H 2 production and consequently downsize the electrolysers. At low emissions, DHN is fully deployed and uses thermal storage (TS) for long-term storage. In addition, the excesses of H 2 production in summer are converted into SLF or SNG and stored to supply mobility and gas CHP in winter, respectively. The role of storage technologies are detailed in Appendix B.2.2 (see Figure A7 and Figure A8).

4.2. Transition Accounting for Space Availabilities

Below 80 MtCO2/y, the system relies on a massive deployment of PV. Would the space availability be enough for the demanded deployment? The land availability for PV is highly speculative, we propose a simple approach to estimate an order of magnitude of this limit. Assuming that 250 km 2 of available well oriented roof exist today (which represents almost a hundredth of Belgium’s land area (28,635 km 2 )) [10] and that the efficiency in 2035 will be 23% [31] with an average daily total irradiation - similar to historical values - of 2820 Wh/m 2 in Belgium [32]. The upper limit becomes 59.2 GW of installed capacity. This limit is in line with a study done by the Belgian transmission system operator (TSO) which proposes 40 GW [6].
We define as the CO 2 optimum scenario, the scenario achieving the lowest emissions under the new constraint (represented by a yellow diamond in Figure 5). In this scenario, the system achieves 73 MtCO2/y at a cost similar to the results presented in Section 4.1 (≈8.8% higher). The system reaches the maximum potential of REs and relies on three fossil fuels, the ones with the lowest emissions (NG and non renewable waste) and a marginal use of diesel. The latter is used in hybrid diesel buses for public transportation. As the electrification of public mobility reaches its maximum (trams, trolleys, and trains), the remaining public mobility demand is supplied by buses. Due to the higher efficiency of Diesel buses the emissions are lower per kilometre passenger than those using NG. Additional results are given in Appendix B.2 and show how the system handles 59.2 GW of PV (for an average consumption of 10 GW) but also the annual energy balance and the energy stored over the year.
Based on the known RE potential and on the energy demand forecast by EC [25], the minimum amount of primary energy in 2035 would be 401.8 TWh. From which 31.4% are renewable (126.2 TWh) and 68.6% are fossil (275.6 TWh). This amount of primary energy is lower than the one presented in Figure 4. Indeed, the system relies on additional storage which results in two facts, the system has a higher cost but curtails less. At this stage, the following question arises: what are the possibilities to decrease even more the CO 2 emissions?

4.3. What Are the Options?

One will denote in the Sankey diagrams (Figure A12 and Figure A13) that non-energy EUD consumes more than 20% of the primary energy supplied. Indeed, Belgium has strong chemical and petrochemical industries that require hydrocarbons as an input. The solution to defossilising the petrochemical industries is to shift from fossil fuels to synthetic fuels and biomass. As the renewable potential in Belgium is limited, the resources required to synthesise must be imported (as it is today) or the petrochemical industry must be delocalised. Hence, in the following, we remove the non-energy demand. As a consequence, 102.3 TWh of fossil fuels are removed and it remains 173.3 TWh to phase out.

4.3.1. Alternative Scenarios

In addition, we propose to investigate different additional scenarios, hereafter enumerated:
  • Solar—abundant solar: we assume a potential of 2864 km 2 corresponding to 10% of Belgian land area (see Section 4.2).
  • Nuclear—nuclear extended: we assume that the 5.6 GWe of nuclear plants have their lifetime extended.
  • Geothermal—geothermal potential: we assume that Belgium has a geothermal potential that can produce 4 GW of electricity (according to [10], in line with the transmission system operator [6]) and another 4 GW of heat available for DHN.
  • Wind—extra territorial offshore: we assume that Belgium can access to an additional potential of 3.5 GW in the North Sea.
  • Elec.—electricity imports: we assume the capacity to double to 9 GW. In addition, the specific emissions of imported electricity is halved (241 kgCO 2 -eq./MWh).
  • RE-fuels—allow RE-fuel imports: we allow the importation of renewable fuels, including bioethanol, biodiesel, SNG, wood and H 2 . Their cost are 50% higher than equivalent fossil fuels.
  • Mix—mix between technologies: all the options are implemented.
No scenario with a decrease in demand has been investigated. Indeed, the simplest way to reduce our emissions is to reduce our EUD. However, this scenario will not be analysed as the amount of energy that can be reduced is controversial and requires a dedicated study. Instead, as explained in Section 3.3.2, we use the forecasts made by the EC [4].

4.3.2. Analysis of the Alternative Scenarios

A cost comparison between the alternative scenarios is proposed in a Pareto frontier graph, see Figure 6. They are compared to the reference scenario. The reference scenario is defined as the one presented in the previous sections where the non energy demand has been removed and with limited solar to a realistic value.
In Table 6, we compare the scenarios in terms of: (i) extra capacity and production; (ii) the CO 2 optimum case; (iii) the cost optimum case. As expected, the overall system cost is decreased compared to the reference case. Surprisingly, increasing the import capacity (Elec.) does not help to decrease emissions. This result can be explained when reminded of two hypotheses: (i) the CO 2 emissions of the electricity imported are accounted for; (ii) The later is assumed to be half of the European average CO 2 emissions for the electricity mix in 2015. As a consequence, the electricity imported emits more CO 2 than the one produced by a CCGT (this assumption is controversial; on the one hand, if Belgium decarbonates, its neighbours will too, and as a result, the imported electricity shall emits less CO 2 ; on the other hand, Belgium needs to import when there is no wind and solar. The neighbouring countries will face the same issue and the imported electricity will mostly rely on neighbour fossil fuel power plants and/or large scale storage. As a consequence, we assume that the electricity import cost and emissions are relatively high).
Two scenarios, Solar and RE-fuels do not reduce the system cost but achieve low CO 2 emissions. RE-fuels appears as a more affordable solution than Solar. Instead, by allowing other technologies, as proposed in scenarios (Wind, Nuclear, and Geothermal), the system cost is lowered. In addition, these scenarios can decarbonate a little more the system compared to the reference case. However, they cannot reach emissions lower than 35 MtCO2/y. By allowing all the technologies, as proposed in Mix, the system cost decreases and reach an optimum at 40 MtCO2/y.

4.3.3. Analysis of the Mixed Scenario

As none of the technologies (except solar) can bridge the gap, we propose to analyse the Mix scenario which has two benefits. First, it achieves low CO 2 emissions at an affordable cost. Second, it appears as the cheapest option at any stage, in other words, the system does not rely on one cheap technology, instead it takes advantage of the synergies between technologies to supply the EUD at a cheaper cost.
As with Figure 3, Figure 7 represents the resources used during the transition. We observe similar trends, such as the coal and gas used at high emissions. By crossing the information of Figure 6 and Figure 7, we learn that nuclear, geothermal and wind power plants can decrease the system cost while decreasing the emissions (in order to compare technologies without bias, the cost of nuclear reflects the construction cost in 2035 rather than an extension of existing power plants). Indeed, the cost optimum is reached after full deployment of wind (offshore and onshore), geothermal and nuclear. When the CO 2 emissions are lower than 50 MtCO2/y, renewables represent more than 50% of the electricity production and their intermittency becomes an issue. The latter is faced by using CCGT during electricity scarcity and electrolysers and/or curtailment during excesses. At lower CO 2 emissions, solar, wet biomass, waste, and woody biomass are used. In addition, synthetic fuels are imported. At first, 1–2 TWh of H 2 are imported and used in fuel cells for passenger mobility (buses and cars). Then, when the CO 2 emissions are lower than 15 MtCO2/y, SNG is imported. The overall gas available, coming from imports and biomethanation, represents up to 28 TWh. An eighth of it is used for freight mobility. 33% is used in industrial gas boilers and the rest is used in CCGT to compensate the scarcity of intermittent renewables.

5. Discussion

In this section, we highlight the learnings and trends of the previous sections. First, we discuss about how to decarbonate the different sectors. Then, the limitations of the study are enumerated.

5.1. The Role of Electrification

In 2015, the system was fossil-based, with traditional fuels accounting for more than 93%. The primary energy is transformed to supply end-use demand. Most of the primary energy goes for heating and industrial processes (260 TWh), whereas electricity is the second sector (156 TWh), non-energy the third one (98 TWh), and mobility the last one (88 TWh).
To achieve the decarbonisation of the society, renewables will be implemented in the different sectors. However, the potential in Belgium is mainly based on wind and solar, that exclusively produce electricity. Hence, the electricity sector is the easiest sector to decarbonate. Other sectors are harder to decarbonate. For heating and mobility applications, biomass can be used, but its potential is one order of magnitude lower than the energy demand. As a consequence, the electrification of the other sectors appears as a way to decarbonate them. Indeed, the electricity becomes less CO 2 intensive. In addition, technologies relying on electricity are usually more efficient, such as heat pumps instead of gas boilers. Another advantage of the electrification is that it brings flexible consumers who helps the integration of stochastic renewables into the power system.
Nevertheless, only the low-temperature sectors can be fully electrified at an affordable cost (through HPs). For the following three sectors, the electrification is neither affordable nor possible: for high-temperature heating, the processes are assumed to run at base load and require electricity during the night. This makes it unaffordable and the system prefers a solution relying on CHP or boilers during the night. For mobility, we assume that only part of the public mobility and freight can be electrified (trains, trams, and metro). Hence, fuels are required for the trucks and buses. For the non-energy sector, fuels are required as part of the processes are based on hydrocarbon chains (e.g., petrochemical products).

5.2. Limits of the Study

The study is based on several assumptions that must be discussed. In the following, we challenge the fixed energy demand, CO 2 metric, the scenario approach, the reliability of inputs and other assumptions.
The energy demand is based on the prediction of the European Commission in 2035 and assumed as an input parameter (data from [4]). However, economic taught us that the demand and supply are related. An increase in the system cost, thus in the end use energy prices, results in a decrease of the end use energy demand; and a new equilibrium will be reached. However, estimating the elasticity of the supply-demand curve is highly controversial and we decided to fix the demand as constant.
As introduced in Section 2.2, only the CO 2 emissions related to the resources are accounted for, whereas the emissions related to the construction and end-of-life of the energy conversion technologies are not accounted for. RE detractors criticise the high emissions of wind turbines construction or the emissions related to PV manufacturing. However, this metric is the one used in countries reports (such as in [4] or [33]) to estimate the energy sector territorial emissions. In addition, the embodied emissions of goods related to imports and exports trades are not accounted for, a study done by Federal Planning Bureau estimated that Belgium is a net importer of GHG emissions and the amount represented an extra 14% GHG emissions in the period 2003–2007 [34].
In the paper, we called energy transition the decrease of CO 2 emissions between scenarios. This has two limitations. First, it does not account for today energy system design. Second, the link between the steps are sometime irrelevant, such as building new CCGTs and then replacing them by gas CHPs (as shown in Figure A2). The overall pathway shall be accounted as it is done in [35].
In this work, some simplifications have been required to represent complex sectors or demand, and also some technologies have been aggregated together. The major simplifications are the following: (i) the industrial processes were summarised to an electricity, a high-temperature hourly demand and a non-energy demand; (ii) the non-energy demand has been simplified to a hydrocarbon energy demand (oil- and gas-based); (iii) the aviation demand has been simplified to mobility demand and the extra-EU aviation mobility is not accounted for; (iv) the cost of mobility infrastructures and technologies are not accounted for; (v) the synthetic fuels production is aggregated in three molecules: H 2 , methane and methanol, however ammonia, dimethyl-ether or ethanol are good candidates.
Finally, the uncertainty of the input parameters are consequent. Hence, the numerical values are approximate but the trends are valid. In order to let the interested reader form their own opinion, all the parameters are detailed in the Supplementary Material with the associated sources for the numerical values. The code is also available [15].

6. Conclusions

We applied the EnergyScope TD model to the Belgian energy system. The mathematical model formulation and data used are given in the Supplementary Material (the code is freely available at [15]). The model optimises the investment and hourly operation of the Belgian energy system accounting for all the energy flows within its boundaries. The case study consistency has been verified by applying the methodology to the national Belgian energy system for a known year (2015). The model is used to analyse Belgium in 2035 with different CO 2 emissions reduction targets.
On the basis of the energy demand foreseen by the European Commission [4] in 2035, the model needs a minimum of 401.8 TWh/y of primary energy; of which 102.3 TWh/y are used for non energy demand (plastic, fertilizer, etc.). However, the endogenous renewable potential of Belgium is estimated at 126.2 TWh/y (from which biomass (30.2 TWh/y), wind (33.9 TWh/y), solar (61.5 TWh) and hydro (0.5 TWh/y)), and can be supplemented by 9.3 TWh/y of non-renewable waste. In a nutshell, by excluding the non energy sector, the lack of renewable is estimated at 173.3 TWh/y. In other words, Belgium can sustainably supply 42% of its own primary energy consumption.
What are the options to achieve lower emissions? We analysed additional scenarios where the endogenous renewable potential is speculatively increased, such as additional offshore wind concessions or geothermal potential, or scenarios where the existing nuclear power plants have an extended life. We observe that each solution alone cannot replace the remaining fossil demand. Instead, a mix of these solutions can result in a very low-carbon society with a competitive cost over fossil-based solutions.
We investigated additional options where we allowed imports of renewable fuels (hydrogen, biogas, bio-fuels…) or increased electrical interconnections. We set a 50% higher price for renewable fuels than their fossil competitors. Solutions appear more expensive than if we produce energy locally. Except at very low emissions, where the import of synthetic fuels becomes competitive to phase out fossil fuels in the mobility sector.
However, can one speculate on the fact that the renewable potential in Belgium can be considerably increased? or can we bet that other countries can completely decarbonise and, in addition, produce renewable fuels at an affordable cost for export? Otherwise, two options remain for Belgium: an expensive energy system, or a reduced end-use demand.
In future works, we will address the two main weaknesses of the model: uncertainty about input parameters and the energy transition pathway. In addition, key economic performance indicators, such as the marginal carbon price, the Belgian electricity price or the cost of integrating stochastic renewables will be estimated.

Supplementary Materials

The following are available online at https://www.mdpi.com/1996-1073/13/1/261/s1.

Author Contributions

The model development, the case study and the paper writing have been done by G.L. H.J. supported and challenged him during the work. With F.M., they performed extensive reviews of the paper. All authors have read and agreed to the published version of the manuscript.

Funding

This research received no external funding.

Conflicts of Interest

The authors declare no conflict of interest.

Abbreviations

The following abbreviations are used in this manuscript:
BEVbattery electric vehicle
CAPEXcapital expenditure
CCGTcombined cycle gas turbine
CHPcombined heat and power
CO2carbon dioxide
DHNdistrict heating network
EnergyScope TDEnergyScope Typical Days
EROIenergy return on investment
EUEuropean Union
EUDend-use demand
EUTend-use type
FECfinal energy consumption
FPBFederal Planning Bureau
GDPgross domestic product
GHGgreenhouse gas
GWPglobal warming potential
H2hydrogen
HPheat pump
IEAInternational Energy Agency
IGCCintegrated gasification combined cycle
LFOlight fuel oil
LPlinear programming
NGnatural gas
OPEXoperational expenditure
PHEVplug-in hybrid electric vehicle
PHSpumped hydro storage
PVphotovoltaic
RErenewable energy
SLFsynthetic liquid fuel
SNGsynthetic natural gas
TDtypical day
TSthermal storage
TSOtransmission system operator

Appendix A. Methodology and Demonstration Details

In this appendix, a deeper explanation about the synthetic fuels sector (Appendix A.1) and the energy end-use demand calculation (Appendix A.2) are first detailed. Then, the application of the model to represent the year 2015 is proposed. By comparing our results with the data from International Energy Agency and Eurostats, we verify the consistency of the model.

Appendix A.1. Technologies Related to Synthetic Fuels

Synthetic fuels are expected to play a key role to phase out fossil fuels [36]. Figure A1 offers an overview of the technology related to synthetic fuels, including the carbon dioxide layers. Synthetic fuels can be imported (Bio-ethanol, Bio-Diesel, H 2 , SNG or SLF) or produced by converting biomass and/or electricity. The wet biomass - usually organic waste - can be converted through the biogas plant technology to SNG. This technology combines anaerobic digestion and cleaning processes. Woody biomass can be used to produce H 2 through gasification, SLF through pyrolysis or SNG through gasification to SNG. The synthetic liquid fuel can later be converted into LFO, gasoline or diesel. The other processes to produce synthetic fuels are based on the water electrolysis, where the electrolysers convert electricity to H 2 . Then, the H 2 can be combined with CO 2 and upgraded to SNG through the methanation technology, or methanol through methanolation technology. For these latter, the processes require CO 2 . It can either be captured from large scale emitters, such as the industries and centralised heat technologies, or directly captured from the air but at a higher energetic and financial cost.
The characteristics of each technology with their numerical values and sources can be found in the Supplementary Materials.
Figure A1. Illustration of the technologies and processes to produce synthetic fuels. For clarity, only the most relevant flows are drawn (Figure 2 includes all the flows).
Energies 13 00261 g0a1

Appendix A.2. Energy Demand Calculation

In our model, we use the end-use demand which represents the real need of energy. As an example for a gas boiler, the EUD is the amount of heat produced whereas the final energy consumption is the amount of gas consumed. We assume that the EUD is constant rather than the FEC that can vary depending on the technologies. In [4], the FEC is given for heating and electricity. However, the FEC is always greater than the EUD (except for HP). Hence, when no indication was given, we estimated the EUD based on the FEC. See Supplementary Material for detailed calculations.
Table 5 summarises the differences between the EUD in 2015 and 2035. The demand is increasing except for the heating sectors. This growth is related to the increase in population (+19.2%) and GDP (+44.2%) in the same time period. If the demand growth is below the population growth, it reflects the benefit of energy efficiency measures. We deem a technology “efficient” if it consumes less primary energy for a similar or improved service than a traditional technology, such as a CCGT plant which consumes less gas for electricity production than a traditional coal power plant, or a HP which consumes less primary energy than a boiler to supply the same quantity of heat. Instead, if the growth is higher, it reflects a higher consumption, such as in the mobility passenger and freight demand. The latter has the strongest increase (+48.5%). The following four EUD benefit from an increase in efficiency: electricity sector, low-temperature heat, high-temperature heat and non-energy demand. This trend reflects the expected impact of policies to increase the energy efficiency faster than the additional demand due to the population growth. These policies target dwellings insulation, improving industrial process heating, etc.
The implementation of more efficient technologies at the end user side reduces the demand. However, it has a cost. In our scenarios, as the demand is fixed, the cost of efficiencies measures is also fixed and accounted for at a fix cost.
The resulting energy demand is an input parameter to the model and reducing the demand is not allowed. This representation has been discussed in Section 5.2.

Appendix A.3. Comparison for the Year 2015

Long-term planning models cannot be validated as they model an unknown future [23,24]. However, the performance and consistency of such models can be demonstrated by representing the past or present state of the system.
Thus, we assess whether the model can reproduce the state of the Belgian energy system in the year 2015. The Belgian energy system in 2015 is a fossil-based system, with traditional fuels accounting for more than 93% of the primary energy, with low electrification of heat (6.6%) and transport (1.3%) and with marginal deployment of promising technologies such as district heating network (2%) and heat pumps (≈0%) (data from Eurostat [26] and heat roadmap Belgium [37]). Besides fossil fuels, uranium (18.6%), waste (1.3%) and electricity imports (3.3%) are accounted for as traditional fuels (following the IEA definition [17], we assume, for nuclear energy, that the primary energy equals the thermal production. This methodology is in line with Eurostat [25]). As the Belgian energy system in 2015 is non optimal, additional constraints are added and some parameters are changed to the model to force the 2015 configuration: (i) the end-use demand values are those from 2015; (ii) the relative annual production share of the different technologies for each type of end-use demand are fixed, e.g., 20% of low temperature centralised heat provided by CHPs; (iii) the shares of public mobility (%Public), train and boat in freight (%Freight) and centralised heat production (%DHN) are those from 2015; (iv) the fuel efficiency of mobility are those from 2015; (v) three additional technologies were added, which are oil turbine, incinerator and woody biomass power plant. These technologies will not be implemented in 2035 as they will not be relevant. Indeed, at least one other proposed technology is more efficient and cheaper.
In Table A1, we compare the model outputs with the reported values for the year 2015, from Eurostat [26], based on the following two indicators: (i) primary energy consumption, global and per type of fuel; (ii) global GHG emissions. In addition, a Sankey diagram of the energy flows during the year 2015 is proposed in Figure A12.
In terms of energy consumption, the model offers an accurate approximation of the reported 2015 values. ESTD slightly underestimates primary energy consumption. This is due to the fact that for electricity, heat and CHP technologies, the conversion efficiencies used for the year 2035 are also used for the validation. The other little variations can come from minor contributions not accounted for or differences in the accounting method. The difference in coal comes from the supply to non-energy demand, which is not allowed in EnergyScope TD. The gas supply is overestimated for two reasons. First, an additional quantity is required to supply the lack of coal in non-energy demand. Second, the use of coal in some industries (coke-oven and blast-furnace) produces gas (9.54 TWh of gas in 2015 [25]). This gas is usually recovered in CHP. As a consequence in EnergyScope TD, the amount of gas is overestimated. The total GHG emissions from fuel combustion in 2015 were between 92.5 (IEA [38]) and 97.8 MtCO2 (Eurostat [26]). The fuel combustion emissions are accurately estimated by the model (96.9 MtCO2). However, as explained previously, we propose to follow the IPCC2013- GWP100a metric to measure CO 2 emissions. This metric accounts for emissions related to fuel production and transportation. Thus, the Belgian emissions increase up to 156 MtCO2/y.
Overall, the ESTD model offers an accurate picture of the primary energy demand and GHG emissions of the Belgian energy system. An illustration of the 2015 energy balance picture is proposed in a Sankey diagram (see Figure A12) and compared to a CO 2 optimised system in 2035 (see Figure A13).
Table A1. Model verification: model outputs vs. actual 2015 values for the Belgian energy system. Δ r e l . stands for the relative difference. Abbreviations: non-energy (N.E.), electricity imports (Elec. Imp.).
2015Model Δ Δ rel .
Primary
energy
consumption
(TWh)
Gasoline 22.16
Diesel 59.91
Oil 110.01
N.E. oil84.8484.65
Total Oil280.93276.72−4.2−1.5%
Gas150.56153.02
N.E. gas11.4513.78
Total Gas162.02166.84.782.95%
Coal34.533.35
N.E. coal2.49
Total Coal36.9833.35−3.63−9.81%
Nuclear78.1165.78 a−12.32−15.78%
Elec. Imp.20.9420.970.030.13%
Solar PV3.053.380.3310.86%
Solar th0.260.270.015.37%
Wind5.565.01−0.55−9.9%
Hydro0.320.370.0515.06%
Geothermal0.040.03−0.01−18.58%
Wood15.3416.120.775.05%
Biogas2.662.53−0.12−4.58%
Biofuels3.333−0.33−9.95%
Total RE30.5530.710.160.51%
RE.4.39
non RE.6.32
Total Waste10.718.97−1.74−16.28%
Total Energy620.24603.31−16.94−2.73%
GHG emissions b (MtCO2/y)92.597.8 c96.911.761.85%
a An efficiency of ≈ 37% is expected in 2035 compared to ≈33% in 2015 [26]. b GHG emissions associated to combustion of fuels only. Thus, fuels used in non-energy sectors are not accounted for. c Sources: [26,38].

Appendix B. Additional Results

In this appendix, the reference scenarios (see Section 3) are first presented in terms of installed capacities for the different CO 2 emissions. Then, we focus on the scenario where the solar potential is limited to a realistic value (59.2 GW as presented in Section 4.2), later called “optimum CO 2 scenario”. Finally, a general picture of the yearly energy balance is proposed for the optimum CO 2 scenario in 2035 and compared to the same picture for the real energy system in 2015.

Appendix B.1. Technologies Deployment in the Reference Scenarios

Section 4 focused on the primary energy. In the following, we illustrate the capacity production for electricity (Figure A2), decentralised low temperature heat (Figure A3), centralised low temperature heat (Figure A4), high temperature heat (Figure A5), infrastructure for synthetic fuels production (Figure A6), storage capacity (Figure A7) and the energy stored (Figure A8).
Figure A2. Installed capacity for electricity production for different scenarios (installed capacities greater than 15 GW are not shown).
Energies 13 00261 g0a2
Figure A2 shows how the all gas solution at high emissions shifts to wind, then solar and finally to industrial gas CHP. At low CO 2 emissions, the model relies only on PV and wind for electricity production. In addition, batteries support the renewables in order to supply the demand.
Figure A2 shows a typical behaviour of linear programming models: two solutions are equivalent at high emissions: relying on DHN gas CHP or CCGT for electricity production.
Figure A3. Installed capacity for decentralised low temperature heat production for different scenarios.
Energies 13 00261 g0a3
Figure A4. Installed capacity for centralised low temperature heat production for different scenarios.
Energies 13 00261 g0a4
For the low temperature heating sectors, by reducing the emissions, the heat pumps replace the gas-based technologies (Figure A3 and Figure A4). In the decentralised layer, the installed capacity equals the peak demand. In the DHN layer, the install capacity is downsized thanks to the long term storage capacity.
Figure A5. Installed capacity for industrial heat production for different scenarios.
Energies 13 00261 g0a5
The behaviour is more complex for industrial process heating. At first, coal and gas boilers are used, as they rely on cheap fuels. By limiting the emissions, gas CHP replace gas boilers. At lower emissions, a solution relying on direct electricity combined with gas CHP and waste or wood boilers appear as the best option. Indeed, during the days the electricity production is greater than the electricity consumption. By consequence, direct electricity in heating process is an interesting way to consume these excesses. However, during the night, boilers are required. Gas CHPs can also be used during the night when there is electricity scarcity.
Figure A6. Installed capacity for synthetic gas production for different scenarios (installed capacities greater than 15 GW are not shown).
Energies 13 00261 g0a6
Infrastructures capacities are represented in Figure A6. Electrolysers are used to absorb excesses of PV production. As H 2 storage is expensive and energy consuming, H 2 is upgraded to SNG or SLF through synthetic methanation or synthetic methanolation. In addition, biogas plants and pyrolysis are used to convert biomass into synthetic fuels. An overall picture of the synthetic fuels technologies and links is proposed in Figure A1.
Figure A7. Installed storage capacity for different scenarios.
Energies 13 00261 g0a7
Figure A8. Energy stored for different scenarios.
Energies 13 00261 g0a8
The energy storage can be analysed in terms of installed capacity or energy stored during the year (Figure A7 and Figure A8, respectively). We verify that long term storages, such as DHN thermal storage or gas storage, have a large reservoir (tens of TWh) but perform less than 10 cycles per year. Instead, short term storages, such as H 2 storage, batteries or decentralised thermal storage have a smaller capacity (less than 1 TWh) but perform almost one cycle a day. As a consequence, the amount of energy stored in short term technologies is greater than for long term.

Appendix B.2. CO2 Optimum Scenario with Limited Solar

In this section, we aim at illustrating how high shares of stochastic renewables (mainly solar and wind) are integrated in the energy system. Then we illustrate the state of charge of the different storage technologies in order to understand how they support the system.

Appendix B.2.1. CO2 Optimum—Hourly Integration of Stochastic Renewable Energy
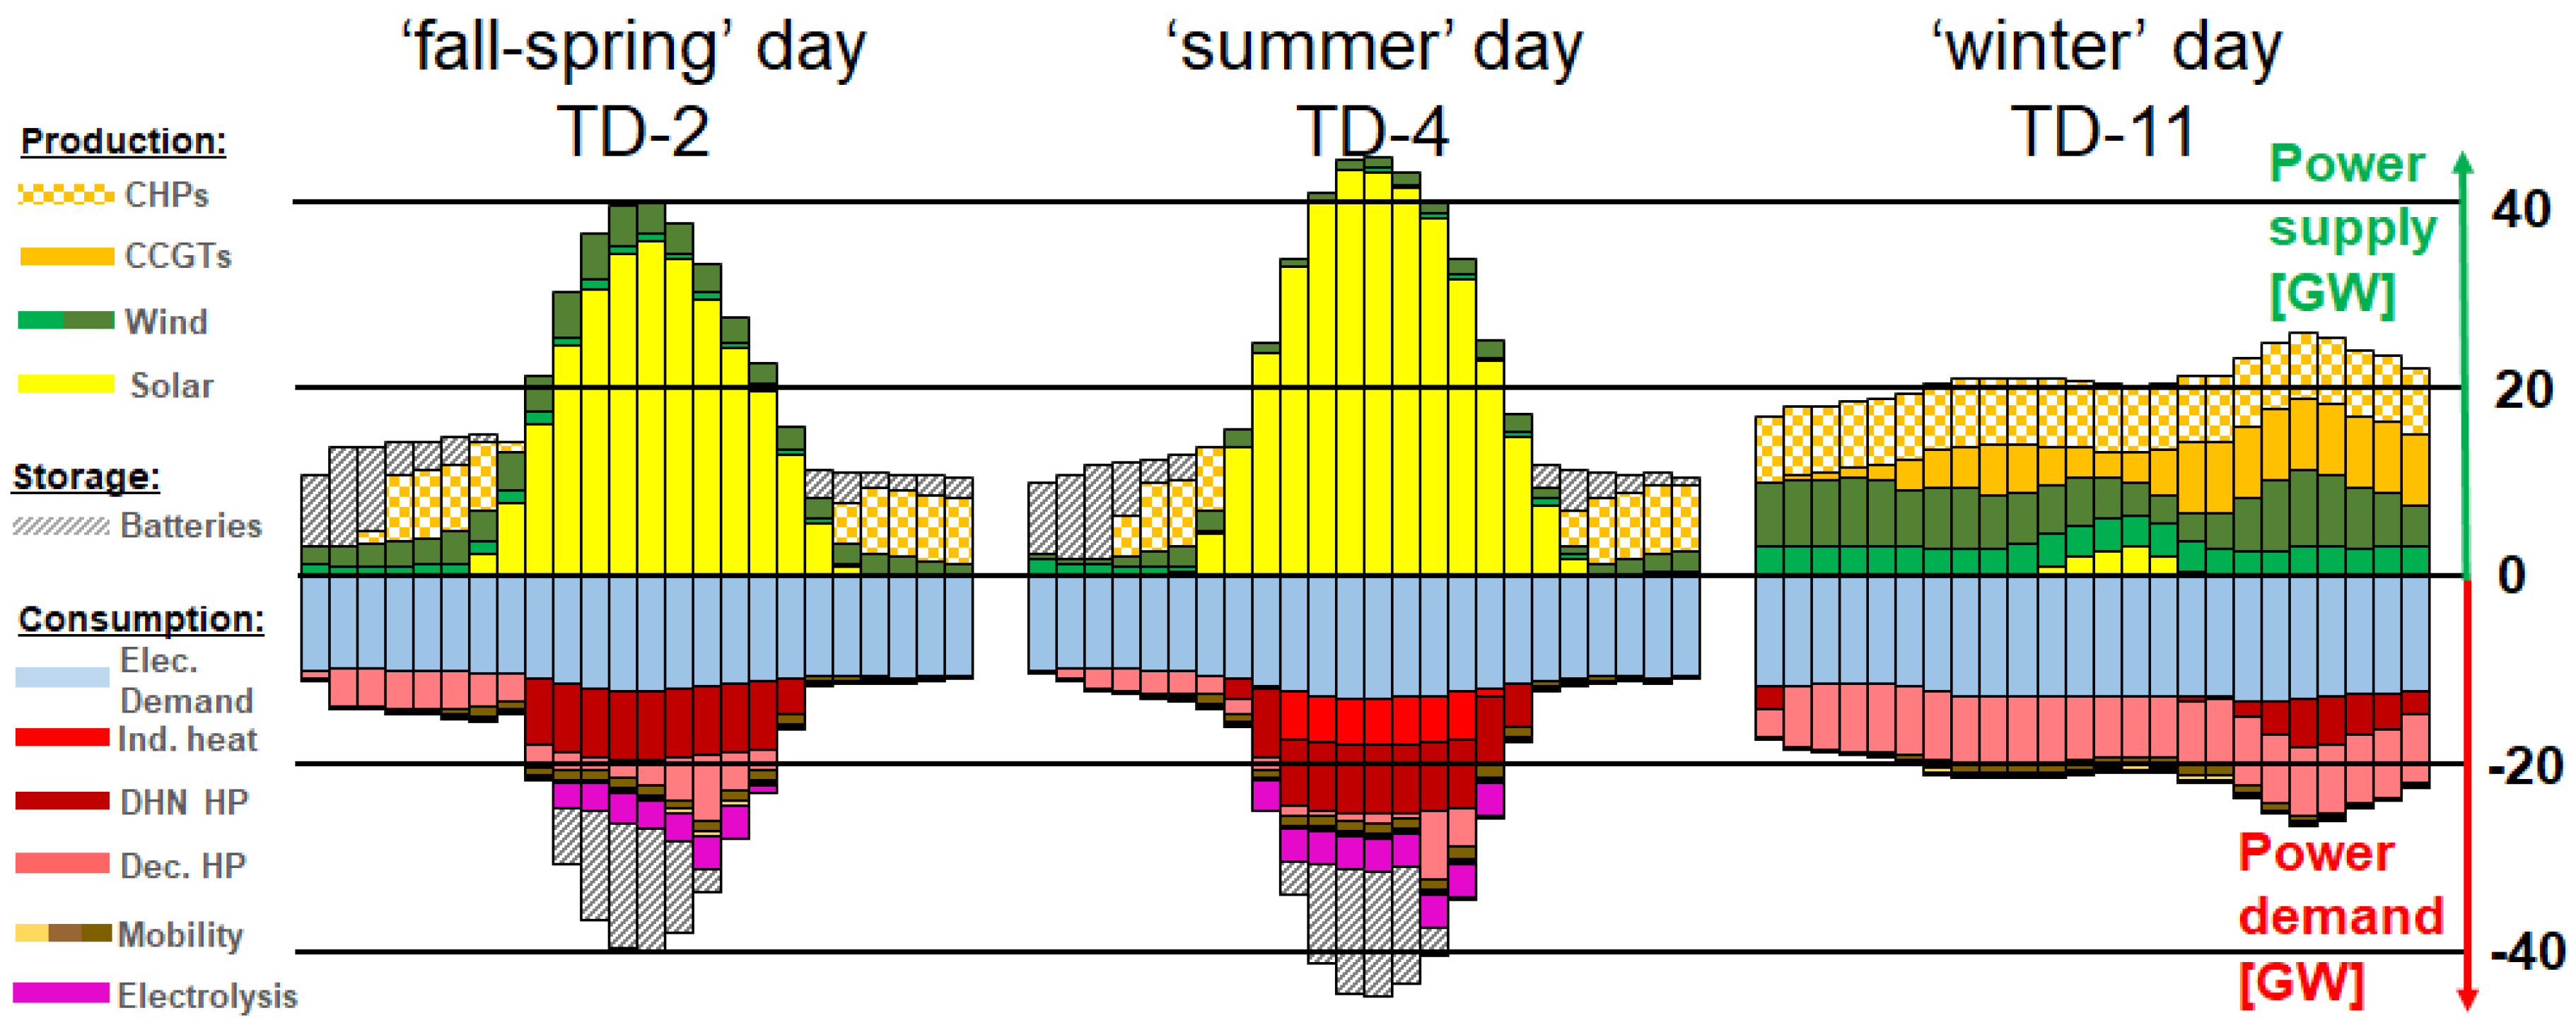
To understand how the system operates to handle the high share of stochastic REs, Figure A9 shows the hourly power flows in the electricity layer for three typical days. This time scale is necessary to understand how storage technologies combine with stochastic RE and how critical it is to rely on only one technology.
Figure A9. Hourly electricity power balance for the CO 2 optimum scenario. Three days over the 12 typical days (TDs) are represented. Typical Day 2 (TD-2) is a typical inter-season (fall-spring) sunny day; TD-4 is a sunny day, TD-11 is a winter cloudy but windy day. Only the active technologies are represented in the legend (left part) and the power supply (positive) has to compensate the power demand (negative). Stripes represent energy storage.
Energies 13 00261 g0a9
The average electricity EUD is around 10.5 GW, whereas the average electricity supply is almost 20 GW. As previously studied in [14,39] for Switzerland, the electrification of the heating sectors is key for the energy transition. On the one hand, it facilitates the integration of efficient technologies. On the other hand, these other sectors are more flexible and can behave as flexible consumers. As an example, TS combined with HP can buffer the electricity consumption while satisfying the heat demand.
Mainly because of PV, the electricity production peaks just below 50 GW, similarly to TD 4 in Figure A9. To absorb these peaks, three tools are used: (i) power to heat, (ii) electrolysers and (iii) storage. Power to heat allows industry to shift from CHP to direct electricity heating during peak hours. For low-temperature heat, power to heat is used to produce heat, when electricity is available, and then turn off the installation during scarcity hours. Similarly to industries, electrolysers replace NG reforming during peak hours to produce H 2 . Hence, a capacity of 3.0 GW is used during peak production hours with a load factor of around 9.1%. Storage technologies, mainly batteries, thermal storage, PHS and hydrogen, are used at a day to week scale (batteries and decentralised thermal storage perform 140 and 152 cycles a year, respectively) to shift the excesses from the solar peak to the night. Finally, if all these options are not enough, the excesses are curtailed.

Appendix B.2.2. The Role of Storage

Storage plays a key role to integrate stochastic renewables. At a seasonal scale, winter presents a peak in demand and a lack in PV. Hence, seasonal storage (Figure A10) is used to shift the excesses of electricity production, later converted to heat, to winter. SLF storage is also daily used to downsize the production process and use it at a base load. Ones will see that SLF storage is used also for seasonal application. Indeed, the production process has a capacity factor of 85% and its maintenance is preferred in summer. As the implemented technology produces a very tiny amount of electricity, there is a tiny advantage to use the technology in winter rather than in summer.
At a day scale, Figure A11 shows the state of charge of the daily storage for the same Typical days than in the previous figure. Batteries are used especially during sunny days to absorb the peaks of PV. In addition decentralised thermal storage is used to provide heat during the day. Indeed, even during warm days when there is no space heating demand, it remains 72 GWh of daily heat to supply for hot water demand. Hydrogen storage is mainly used to smooth the production of hydrogen between days. It is mainly used at a day to week scale (with 50 cycles a year). Finally, PHS is almost unused. As observed in previous studies [9,14], PHS is competing with batteries. Once large capacities of batteries are deployed (140 GWh), PHS will be used after full charge of batteries. This is a consequence of the better efficiency of batteries.
Figure A10. Hourly profile of stored energy for seasonal technologies over a year.
Energies 13 00261 g0a10
Figure A11. Hourly profile of stored energy for short term storage technologies over typical day 10.
Energies 13 00261 g0a11

Appendix B.3. Yearly Energy Balances
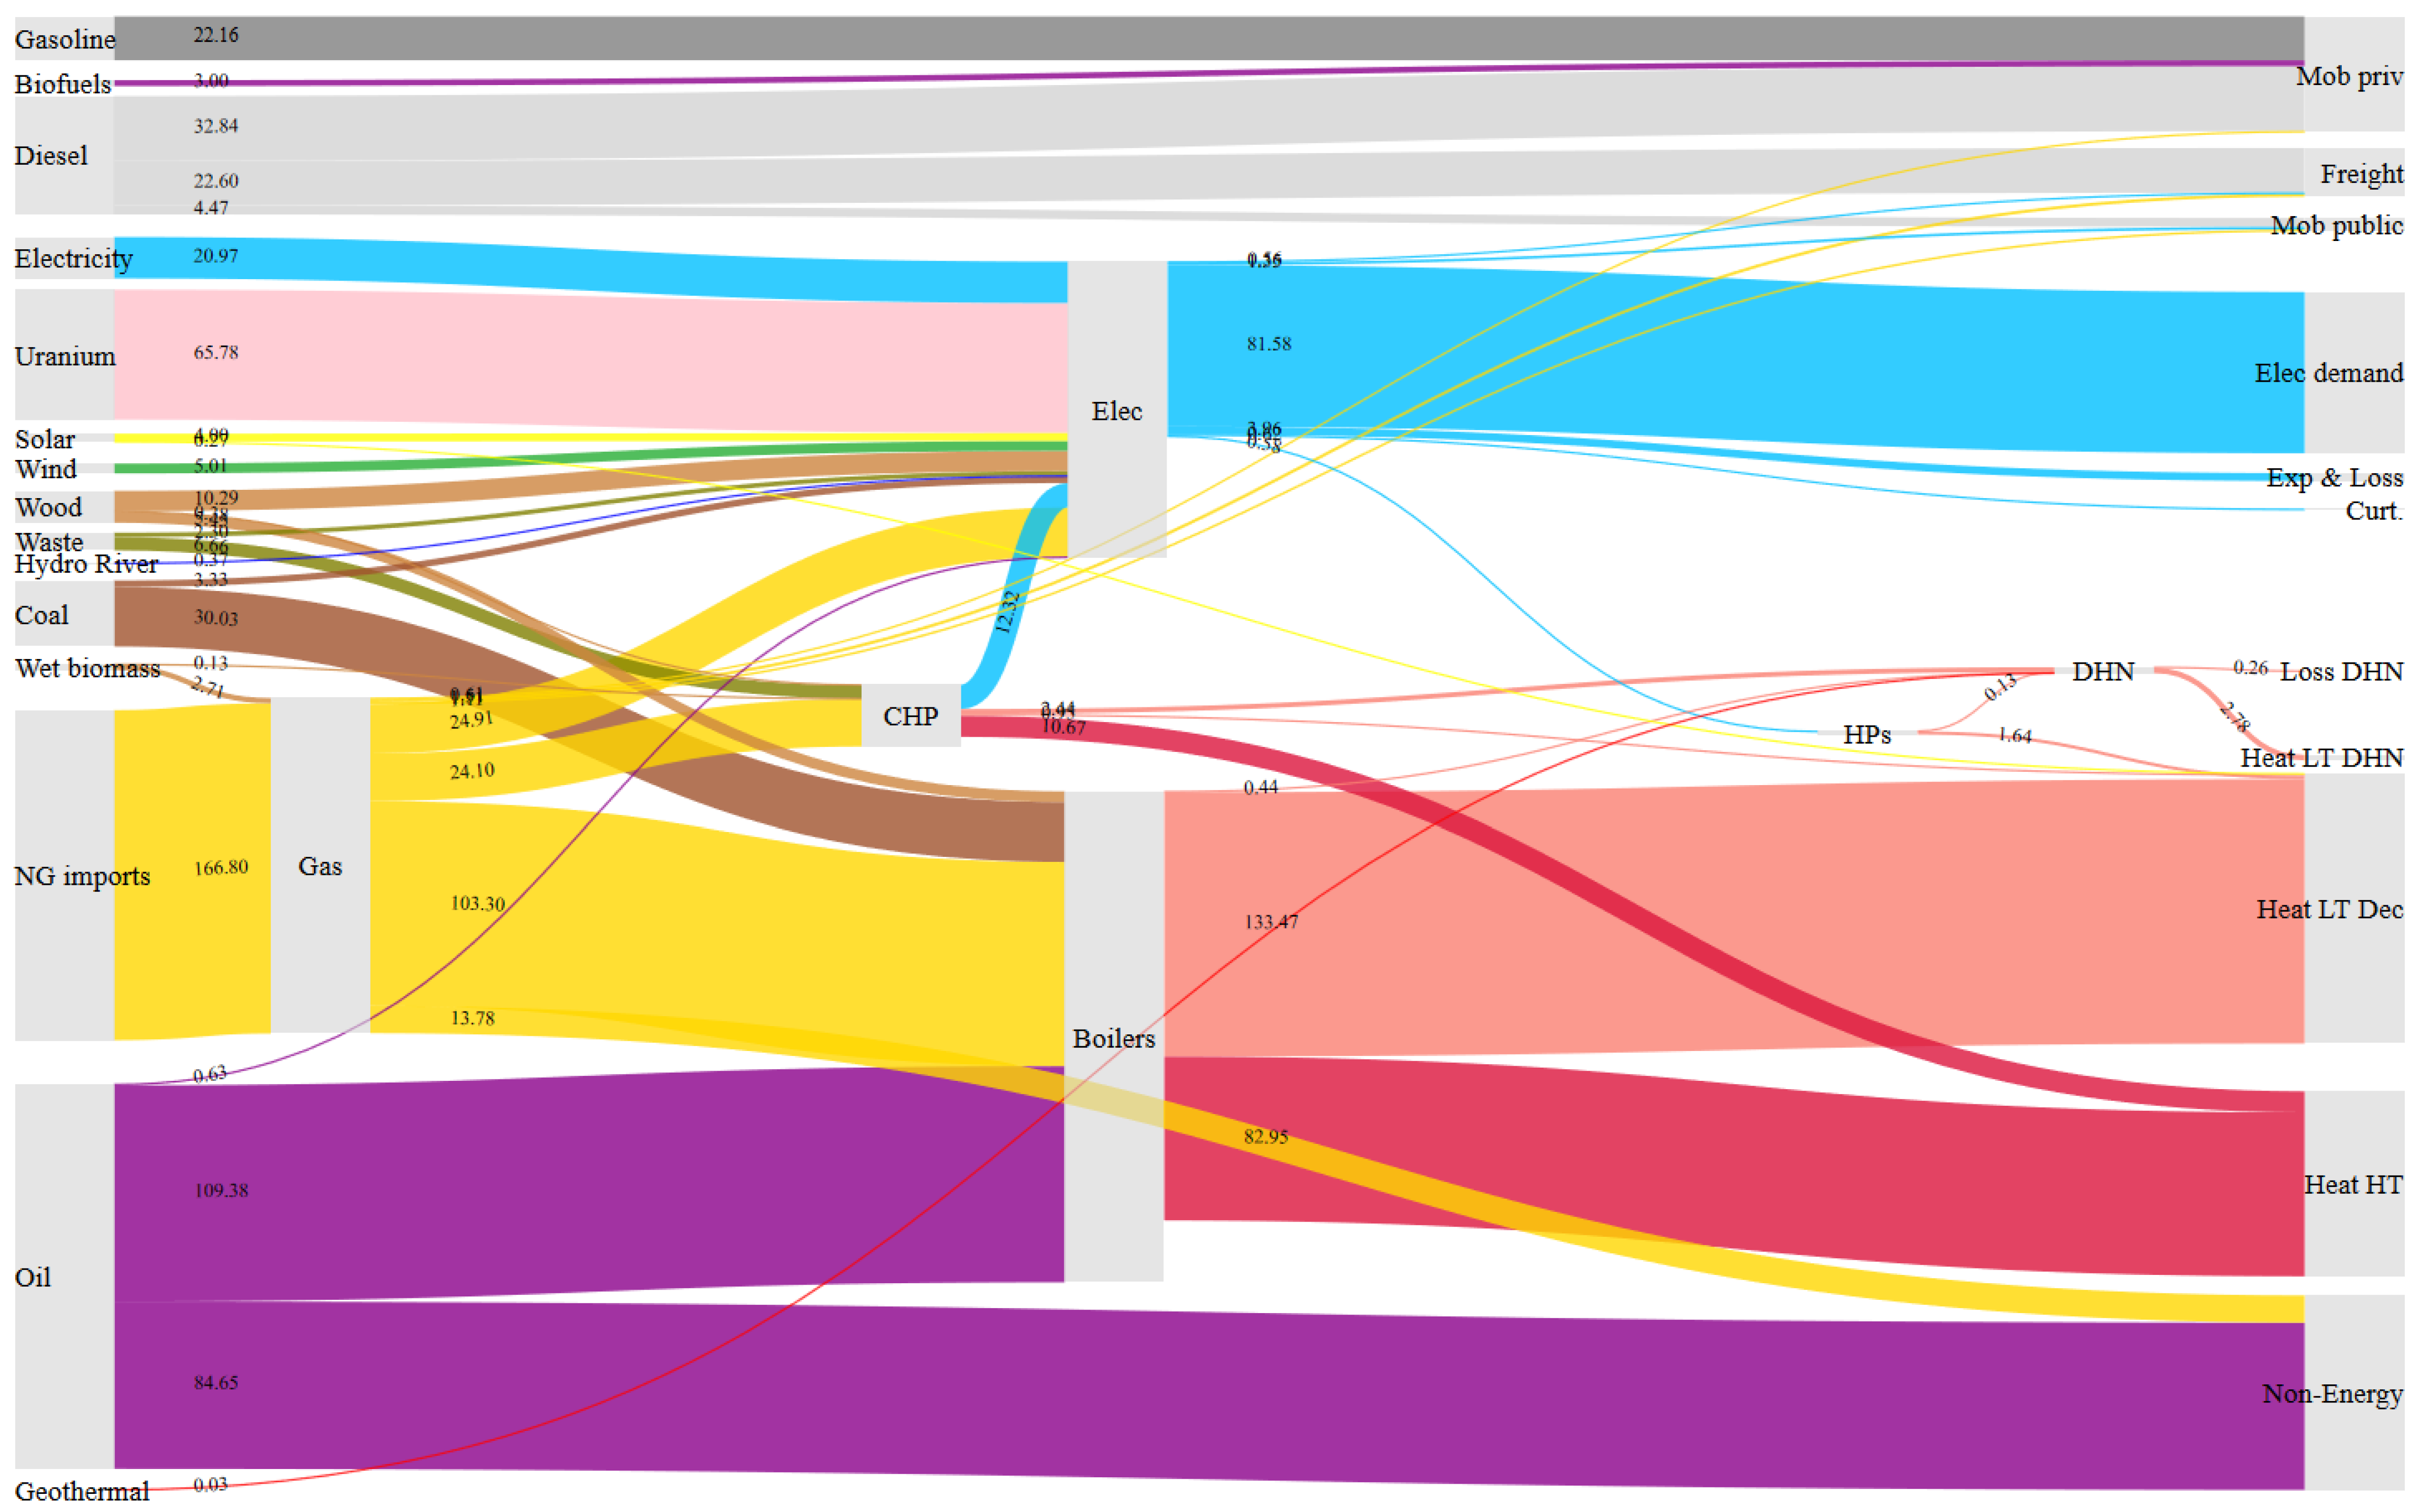
Figure A12 and Figure A13 represent the energy balances for years 2015 and 2035, respectively. The CO 2 optimum scenario with solar limited (250 km 2 ) is presented as the reference scenario in 2035.
Figure A12. Energy flows in a scenario representing the Belgian energy system in 2015. Left side gathers all the resources and right side gathers the final energy consumption. In between, the conversion technologies. Abbreviations: mobility (mob), private (priv), exports and losses (Exp & Loss), storage (sto.), electricity (Elec), low temperature (LT), high temperature (HT).
Energies 13 00261 g0a12
Figure A13. Energy flows in a scenario representing the Belgian energy system in 2035 for the CO 2 optimal scenario in 2035 with limited solar potential. Left side gathers all the resources and right side gathers the final energy consumption. In between, the conversion technologies. Abbreviations: mobility (mob), private (priv), exports and losses (Exp & Loss), storage (sto.), electricity (Elec), low temperature (LT), high temperature (HT).
Energies 13 00261 g0a13

References

  1. Beveridge, R.; Kern, K. The ‘ Energiewende ’ in Germany: Background, Development and Future Challenges. Renew. Energy Law Policy Rev. 2013, 4, 3–12. [Google Scholar]
  2. Dangerman, A.T.; Schellnhuber, H.J. Energy systems transformation. Proc. Natl. Acad. Sci. USA 2013, 110, 549–558. [Google Scholar] [CrossRef] [PubMed] [Green Version]
  3. Van Den Bergh, J.C. Policies to enhance economic feasibility of a sustainable energy transition. Proc. Natl. Acad. Sci. USA 2013. [Google Scholar] [CrossRef] [PubMed] [Green Version]
  4. European Commission. EU Reference Scenario 2016—Energy, Transport and GHG Emissions—Trends to 2050; European Commission: Brussels, Belgium, 2016; p. 220. [Google Scholar] [CrossRef]
  5. Gusbin, D.; Devogelaer, D. Le Paysage Énergétique Belge à L’horizon 2050: Perspectives à Politique Inchangée. Available online: https://www.plan.be/publications/publication-1728-fr-le+paysage+energetique+belge+a+l+horizon+2050+perspectives+a+politique+inchangee (accessed on 3 January 2020).
  6. Elia System Operator. Electricity Scenarios for Belgium towards 2050; 2017; p. 152. Available online: https://www.elia.be/en/publications/studies-and-reports (accessed on 3 January 2020).
  7. Van Stiphout, A.; De Vos, K.; Deconinck, G. Operational flexibility provided by storage in generation expansion planning with high shares of renewables. In Proceedings of the International Conference on the European Energy Market (EEM), Lisbon, Portugal, 19–22 May 2015. [Google Scholar] [CrossRef]
  8. Meinke-Hubeny, F.; De Oliveira, L.P.N.; Duerinck, J. Energy Transition in Belgium—Choices and Costs. 2017. Available online: https://www.energyville.be/energy-transition-belgium-choices-and-costs (accessed on 3 January 2020).
  9. Limpens, G.; Jeanmart, H. Electricity storage needs for the energy transition: An EROI based analysis illustrated by the case of Belgium. Energy 2018, 152, 5–8. [Google Scholar] [CrossRef]
  10. Devogelaer, D.; Duerinck, J.; Gusbin, D.; Marenne, Y.; Nijs, W.; Orsini, M.; Pairon, M. Towards 100% Renewable Energy in Belgium by 2050. Technical report. 2013. Available online: https://energie.wallonie.be/servlet/Repository/130419-backcasting-finalreport.pdf?ID=28161 (accessed on 3 January 2020).
  11. E3MLab. PRIMES Model—Detailed Model Description; E3MLab/ICCS at National Technical University of Athens: Athens, Greece, 2014; p. 155. [Google Scholar]
  12. Lund, H. EnergyPLAN Advanced Energy System Analysis Model. 2007. Available online: https://www.energyplan.eu/ (accessed on 3 January 2020).
  13. Fishbone, L.G.; Abilock, H. Markal, a linear-programming model for energy systems analysis: Technical description of the bnl version. Int. J. Energy Res. 1981, 5, 353–375. [Google Scholar] [CrossRef]
  14. Limpens, G.; Moret, S.; Jeanmart, H.; Maréchal, F. EnergyScope TD: A novel open-source model for regional energy systems. Appl. Energy 2019, 255, 113729. [Google Scholar] [CrossRef]
  15. Limpens, G. Belgian EnergyScope TD Model. Available online: https://github.com/energyscope/EnergyScope/tree/Limpens_Belgian_2020_code (accessed on 3 January 2020).
  16. Flaticon. Available online: https://www.flaticon.com/ (accessed on 3 January 2020).
  17. International Energy Agency. Definitions. Available online: https://www.iea.org/ (accessed on 3 January 2020).
  18. Moret, S. Strategic Energy Planning under Uncertainty. Ph.D. Thesis, EPFL, Lausanne, Switzerland, 2017. [Google Scholar] [CrossRef]
  19. Quaschning, V. Regenerative Energiesysteme: Technologie-Berechnung-Simulation; Carl Hanser Verlag GmbH Co KG: Munich, Germany, 2015; pp. 1–12. [Google Scholar] [CrossRef]
  20. Moro, A.; Lonza, L. Electricity carbon intensity in European Member States: Impacts on GHG emissions of electric vehicles. Transp. Res. Part D Transp. Environ. 2018, 64, 5–14. [Google Scholar] [CrossRef] [PubMed]
  21. Weidema, B.P.; Bauer, C.; Hischier, R.; Mutel, C.; Nemecek, T.; Reinhard, J.; Vadenbo, C.O.; Wernet, G. Overview and Methodology. Data Quality Guideline for the Ecoinvent Database Version 3. Ecoinvent Report 1(v3); Technical Report 1; The Ecoinvent Centre: St. Gallen, Switzerland, 2013. [Google Scholar]
  22. Limpens, G.; Jeanmart, H. Quantification of electricity storage needs for Belgium energy transition: A sensitivity analysis based on EROI. In Proceedings of the 31st International Conference on Efficiency, Cost, Optimization, Simulation and Environmental Impact of Energy Systems 2018, Guimarães, Portugal, 17–22 June 2018; pp. 5–8. [Google Scholar]
  23. Hodges, J.; Dewar, J. Is It You or Your Model Talking? A Framework for Model Validation; Technical report; Rand: Santa Monica, CA, USA, 1992. [Google Scholar]
  24. Craig, P.P.; Gadgil, A.; Koomey, J.G. W HAT C AN H ISTORY T EACH U S ? A Retrospective Examination of Long-Term Energy Forecasts for the United States. Annu. Rev. Energy Environ. 2002, 27, 83–118. [Google Scholar] [CrossRef] [Green Version]
  25. European Commission - Eurostat. Energy Balance Sheets—2016 Data—2018 Edition; European Commission - Eurostat: Brussels, Belgium, 2018. [Google Scholar] [CrossRef]
  26. Eurostat. Energy Balance Sheets—2015 DATA; European Commission - Eurostat: Brussels, Belgium, 2017; pp. 52–53. [Google Scholar] [CrossRef]
  27. European Commission. Modelling Tools for EU Analysis. Available online: https://ec.europa.eu/clima/policies/strategies/analysis/models_en (accessed on 3 January 2020).
  28. Delmer, A.; Rorive, A.; Stenmans, V. Dix ans de geothermie en Hainaut. Bull. Soc. Belg. De Geol. 1997, 105, 77–85. [Google Scholar]
  29. Vlaamse Instelling voor Technologisch Onderzoek. VITO Website. Available online: https://vito.be/nl/diepe-geothermie/balmatt-site (accessed on 3 January 2020).
  30. Haimes Yv, Y.; Lasdon, L.S.; Wismer Da, D. On a bicriterion formation of the problems of integrated system identification and system optimization. IEEE Trans. Syst. Man Cybernetics 1971, SMC-1, 296–297. [Google Scholar] [CrossRef]
  31. Danish Energy Agency. Technology Data for Energy Plants for Electricity and District Heating Generation—February 2019; Danish Energy Agency: København, Denmark, 2019. [Google Scholar]
  32. Institut Royal Météorologique. Available online: https://www.meteo.be/fr/climat/atlas-climatique/cartes-climatiques/rayonnement-solaire/rayonnement-solaire-global/annuel (accessed on 3 January 2020).
  33. European Commission—Eurostat. Statistical Pocketbook 2017; Publications Office of the European Union: Luxembourg, 2017; Volume 31, pp. 474–478. [Google Scholar] [CrossRef]
  34. Hambÿe, C.; Hertveldt, B.; Michel, B. Belgium’s Carbon Footprint - Calculations Based on a National Accounts Consistent Global Multi-Regional Input-Output Table; Technical Report; Federal Planning Bureau, Belgium: Brussels, Belgium, September 2017. [Google Scholar]
  35. Prina, M.G.; Lionetti, M.; Manzolini, G.; Sparber, W.; Moser, D. Transition pathways optimization methodology through EnergyPLAN software for long-term energy planning. Appl. Energy 2019, 235, 356–368. [Google Scholar] [CrossRef]
  36. Rosa, R. The Role of Synthetic Fuels for a Carbon Neutral Economy. J. Carbon Res. 2017, 3, 11. [Google Scholar] [CrossRef] [Green Version]
  37. Paardekooper, S.; Lund, R.S.; Mathiesen, B.V.; Chang, M.; Petersen, U.R.; Grundahl, L.; David, A.; Dahlbaek, J.; Kapetanakis, L.A.; Lund, H.; et al. Heat Roadmap Belgium. Available online: https://vbn.aau.dk/en/publications/heat-roadmap-belgium-quantifying-the-impact-of-low-carbon-heating (accessed on 3 January 2020).
  38. International Energy Agency. CO2 Emissions from Fuel Combustion 2017—Highlights. Int. Energy Agency 2017, 1, 1–162. [Google Scholar] [CrossRef]
  39. Limpens, G.; Moret, S.; Guidati, G.; Li, X.; Maréchal, F.; Jeanmart, H. The role of storage in the Swiss energy transition. In Proceedings of the ECOS 2019—The 32nd International Conference on Efficiency, Cost, Optimization, Simulation and Environmental Impact of Energy Systems, Weoclaw, Poland, 23–28 June 2019; pp. 761–774. [Google Scholar]
Figure 1. Conceptual example of an energy system with three resources, eight technologies (of which two are storage and one is infrastructure) and four end use demands (of which one is loss). Abbreviations: pumped hydro storage (PHS), electrical heat pump (eHP), combined heat and power (CHP), compressed natural gas (CNG). This figure was adapted from [14].
Energies 13 00261 g001
Figure 2. Application of the LP modelling framework to the Belgian energy system. Technologies (in bold) represent groups of technologies with different energy inputs (e.g., Boilers include gas boilers, oil boilers…). “Decent.” represents the group of thermal storage for each decentralised heat production technology. Abbreviations: synthetic liquid fuel (SLF), Atm. (atmospheric), hydrogen (H 2 ), photovoltaic (PV), integrated gasification combined cycle (IGCC), combined cycle gas turbine (CCGT), carbon capture and storage (CCS), combined heat and power (CHP), heat pump (HP), natural gas (NG), plug-in hybrid electric vehicle (PHEV), district heating network (DHN), battery electric vehicle (BEV), pumped hydro storage (PHS), power to gas (PtG), CC (carbon capture), methan. (methanation), onshore (on.), offshore (off.), decentralised (decent.).
Energies 13 00261 g002
Figure 3. Primary energy supply for different scenarios. The grey box represents the results for 2015 (presented in Section 3.2), the rest represents scenarios in 2035 for different yearly CO 2 missions targets.
Energies 13 00261 g003
Figure 4. Use of Primary energy for different scenarios. Primary energy can either be fossil (black), renewable (green), renewable and curtailed (hatched grey). The total electricity yearly produced (without curtailment) is represented by blue stripes and its share of renewable by green stripes. The grey box represents the results for 2015 presented in Section 3.2, the rest are results for 2035 for different yearly CO 2 emissions targets.
Energies 13 00261 g004
Figure 5. Cost—CO 2 emissions optima and technologies implementation. Grey boxes represent group of technologies with the same characteristics. Red diamond represents the result obtained for the year 2015. Yellow diamond represents the result with a cap on the solar potential (see Section 4.2), which is 2.3 b€/y above the Pareto.
Energies 13 00261 g005
Figure 6. Cost—CO 2 emissions optima and technologies for the alternative scenarios. Only the Mix scenario achieves nearly 0 emissions (only emissions from uranium, wood and wet biomass remain, for a total of 1.75 MtCO2/y).
Energies 13 00261 g006
Figure 7. Primary energy supply for the Mix scenarios. At the lowest emissions, only emissions from uranium, waste and biomass remain, for a total of 2.2 MtCO2/y.
Energies 13 00261 g007
Table 1. Comparison of existing studies about the Belgian energy system transition. Legend: criterion satisfied; criterion partially satisfied; criterion not satisfied. Abbreviations: KULeuven (KUL), EnergyVille (EV), UCLouvain (UCL).
Multi-Multi-REOpen
Study FocusAuthorsSectorsScenariiSharesAccess
EU ref. scenario [4]EC17.5% a b
Unchanged policies [5]FPB20% a b
Electricity scenarios [6]ELIA80%elec. c - d
Electricity storage [7]KUL50%elec. c d
Energy transition [8]EV50%elec. e f
Electricity storage [9]UCL100%elec. c - d
100% renewable [10]group g h 100% f
a RE sources in gross final energy consumed. b The model used is PRIMES [11], which is not sold to third parties [12]. Data used are partially shared. c Studies achieved high RE penetration in the electricity sector only: ELIA (80%), [7] (50%) and Limpens and Jeanmart [9] (100%). d Model not specified or shared. Data not fully open access. e Electricity imported is considered fossil. In the reference scenario, they achieve 14% of RE in the final energy consumption. However no similar data is given for scenarios including more renewables. f The model used is TIMES [13]. The model has been adapted to the Belgian case and is not available. In addition data are not open access. g Consortium of 3 institutions: the FPB and each regional energy institutes (VITO, in Flanders and ICEDD, in Wallonia). h Five scenarios are proposed in 2050 with 100% RE share. They are compared with a reference fossil-based scenario. Intermediary results in 2030 are discussed but not presented.
Table 2. The CO 2 equivalent emissions for different fuels and metrics. The emissions are given for the impact of the resources Combustion only (Based on Quaschning [19]) or for the Overall impact of the production, transport and combustion of the resources.
CombustionOverall
Resources(kgCO 2 -eq./MWhfuel)
Elec. Import0 a 482 b , c
Gasoline250345 b
Diesel270315 b
light fuel oil (LFO)280311 b
natural gas (NG)200267 b
Waste250 d 150
Uranium03.9 e
Coal340 f 401 e
Biomass (All) g 011.8
a CO 2 emissions related to electricity imported are accounted for in the country producing. b Based on GWP100a—IPCC2013 [18]. c Average emissions for EU 28 electricity production mix. Results in line with other study [20]. d Own calculations. e From [21]. f Assimilated to hard coal. g No difference is made between woody and wet biomass.
Table 3. Comparison of installed capacity of technologies using renewable energy in 2015 and their potentials in the model. Abbreviations: centralised (cen.), decentralised (dec.), maximum (max.).
Technology2015 a max. PotentialUnits
Electricity
production
photovoltaic3.85(no limit)(GW)
onshore wind1.1810 b (GW)
offshore wind b 0.693.5 b (GW)
hydro river0.11 c 0.120(GW)
geothermal0≈0 d (GW)
Heat
production
geothermal≈0≈0(GW)
cen. solar th.0(no limit)(GW)
dec. solar th.≈0(no limit)(GW)
a Data from Section 3.2 and Appendix A.3. b From [9]. In line with [6] which estimated 9 GW for onshore and 8 GW for offshore. c In 2015, the production was 360 GWh [4] with an installed capacity of around 110 MW [10]. No important development is foreseen [6,10]. d A prototype (Balmatt project) started in 2019 and produces 4–5 MW [29].
Table 4. Renewable resources in 2015 and their potential.
Sources2015max. PotentialUnits
Imported
synthetic
fuels
bioethanol0.21 a 0(TWh)
biodiesel≈ 00(TWh)
SNG00(TWh)
H 2 00(TWh)
Biomasswoody13.916.48 b (TWh)
wet11.57 c 13.72 b (TWh)
Waste (non RE)7.879.33(TWh)
a Bioethanol also accounts for other bio-fuels except biodiesel. b The shares of biomass, biofuels and waste are mixed in [4]. The shares of woody and wet biomass of 2015 from [26] are used in 2035. c Belgium production of bioethanol, biomethanol, biogas and biodiesel is accounted for as wet biomass.
Table 5. Comparison of EDU for the years 2015 and 2035. Abbreviations: temperature (Temp.), passenger (pass.), billion (b), tons (t).
Units20152035 Δ
PopulationMpers.11.2413.42.2
GDPb€2013385531146
End
use
demand
ElectricityTWh81.691.910.3
Heat High-Temp. a TWh84.765.3−19.4
Heat Low-Temp. a TWh136.2132.5−3.7
Mobility pass.Mpass.-km15819436
FreightMt-km669832
Non-EnergyTWh98.4102.33.9
a In [4], the FEC is given instead of the EUD, hence we performed our own calculations to estimate these values.
Table 6. Model results for the different scenarios. The extra capacity is expressed in terms of power installed and yearly production. Two cases per scenario: the CO 2 optimum and Cost optimum, are detailed in terms of yearly emissions (Emissions), yearly cost (Cost) and the remaining amount of fossil used per year, excluding waste and uranium (Fossils).
Ref.Sol.Nuc.Geo.WindElec.FuelsMixUnits
Capa. extra-6785.64+4 a 3.54.5--(GW)
Prod. extra-67041.7 b 59.9 c 23.5 b 39.4 b 300 d -(TWh/y)
CO 2 optimum:
Emissions501.8 e353540451.8 e2.2 e(MtCO2/y)
Cost22.837.321.421.921.622.829.920.5 e(b€/y)
Fossils179.70120.3122.6141.5165.4 f 00(TWh/y)
Cost optimum:
Emissions7575606065707035(MtCO2/y)
Cost20.920.919.720.319.920.920.918.6(b€/y)
Fossils254.2254.2195.8197.7217.3241.4 g 234.9108.2(TWh/y)
a 4 GW of electricity and 4 GW of heat produced by geothermal energy. b TWh of electricity. c Half of electricity, half of heat. d 50 TWh of bioethanol, biodiesel, SNG, woody biomass, H 2 and SLF. e The remaining emissions are related to uranium (0.4 MtCO2/y), waste (1.4 MtCO2/y) and biomass (0.4 MtCO2/y). f From which 45 TWh are electricity imported. g From which 13 TWh are electricity imported.