Article

Research on Energy Storage Optimization for Large-Scale PV Power Stations under Given Long-Distance Delivery Mode

1
State Key Laboratory of Hydraulic Engineering Simulation and Safety, Tianjin University, Tianjin 300072, China
2
School of Civil Engineering, Tianjin University, Tianjin 300072, China
*
Author to whom correspondence should be addressed.
Energies 2020, 13(1), 27; https://doi.org/10.3390/en13010027
Submission received: 16 November 2019 / Revised: 5 December 2019 / Accepted: 18 December 2019 / Published: 19 December 2019
(This article belongs to the Section D: Energy Storage and Application)

Abstract

:
Western China has good conditions for constructing large-scale photovoltaic (PV) power stations; however, such power plants with large fluctuations and strong randomness suffer from the long-distance power transmission problem, which needs to be solved. For large-scale PV power stations that do not have the conditions for simultaneous hydropower and PV power, this study examined long-distance delivery mode and energy storage optimization. The objective was to realize the long-distance transmission of electrical energy and maximize the economic value of the energy storage and PV power storage. For a large-scale PV power station, the energy storage optimization was modelled under a given long-distance delivery mode, and the economic evaluation system quantified using the net present value (NPV) of the battery was based on the energy dispatch optimization model. By contrast, a lithium battery performance model was developed. Therefore, further analysis of the economics of the energy storage and obtaining the best capacity of the energy storage battery and corresponding replacement cycle considered battery degradation. The case study of Qinghai Gonghe 100 MWp demonstration base PV power station showed that the optimal energy storage capacity was 5 MWh, and the optimal replacement period was 2 years. Therefore, the annual abandoned electricity was reduced by 3.051 × 10 4 MWh compared with no energy storage. The utilization rate of both the PV power station and quality of the delivered electricity were modelled to realize a long-distance transmission to the grid net. This will have an important guiding significance to develop and construct large-scale single PV power stations.

Graphical Abstract

1. Introduction

With the shortage of chemical resources and the increasingly serious environmental pollution, the development and efficient utilization of renewable energy sources, represented by solar energy, have gained attention worldwide [1,2,3,4,5,6]. The cumulative installed capacities of solar energy in the world and China are shown in Figure 1. They indicate that the decade-long trend of strong increase in solar energy installed capacity continued in 2018, with global additions of 94.8 GW and a 24.2% rise compared to that in 2017. Globally, the total solar energy generation capacity reached 485.8 GW at the end of 2018 [7]. In recent years, the photovoltaic (PV) installed capacity of China has developed at a high growth rate, reaching 175 GW in 2018, accounting for nearly 36.03% of the total installed capacity of the world [8]. The continuous increase in PV installed capacity plays a unique role in developing clean energy and reducing environmental pollution.
China is one of the countries with abundant solar energy resources [9]. Over two-thirds of the total area in China receiving annual sunshine hours of more than 2000 h with annual radiation exceeding 5000 MJ/m2 is available for solar energy resource development [10]. Figure 2 presents the distribution of solar energy in China, exhibiting that the solar resources are unevenly distributed. Specifically, the western regions have more abundant solar reserves than other regions, with the former having annual radiation ranging from 6700 to 8370 MJ/m2, which is equivalent to the energy produced from continuously burning 230 kg of coal. In comparison, the annual radiation in the southeast regions such as the Sichuan and Guizhou provinces is scarce, being less than 4200 MJ/m2 [11]. Owing to the concentration of abundant solar energy resources in western China, in recent years, some large-scale centralized PV power stations have been constructed to fully utilize the solar energy there. For example, a > 10 million kilowatt-class PV station has been established in Gonghe County, Qinghai province [12]. However, the power loads in western regions are relatively low so that it is insufficient to absorb all the electric energy generated by the large-scale PV stations. In fact, excess electric energy needs to be transported to the eastern load centre through long-distance (more than 2000 km) and ultra-high voltage (UHV) (such as 800 kV DC) transmission lines. Owing to the characteristics of the solar energy distribution in China, a mode with “large-scale development and UHV transmission” and long-distance “west-to-east power transmission” is the only available approach to completely utilize the solar energy resources in the west [13].
With uncontrollable influence factors that arise from the day and night alternation and unstable meteorology conditions, the PV power output inevitably exhibits intermittent, volatile, and strong nonlinear characteristics [14]. These dramatically increase the difficulty for the grid connection of a PV power station. The delivery line in a “large-scale and UHV transmission” mode has a large impedance. Due to this, randomness characteristics of the PV power station will aggravate the peaking pressure of a solar power generation system and cause fluctuations in the output power with the increase in its capacity. Therefore, it is difficult to achieve long-distance transport and grid connection when the power quality is not conducive for safe and stable operation [15]. Ensuring the power satisfies the quality demand of UHV transmission under the specific delivery mode accepted by the grid net is a prerequisite for a large-scale PV power station with a long-distance grid connection, which is significant to research [16]. Recent studies and practices have shown that complementary energies, such as energy storage and hydropower, are effective measures to reduce the output fluctuation of a PV power plant and achieve complementary output to meet the grid connection requirements. Hydropower is the most reliable complementary energy because of its low cost, high installed capacity, good regulation performance, and high reservoir storage capacity [17,18,19,20,21]. However, hydropower stations have higher requirements on the construction sites and environmental factors, such as abundant water sources, rich precipitation, good geological foundation, and large difference in elevation. Thus, not all PV power stations can support them to be complemented by hydropower stations nearby. Compared with hydropower stations, the constructions of energy storage batteries are more easy and convenient. Energy storage batteries have strong charging and discharging abilities and power regulation features, but the costs are relatively high. However, with the rapid development of technology, the cost of batteries has shown a trend of rapid decline. The International Renewable Energy Agency (IRENA) reported that the cost of lithium-ion batteries has decreased by 65% since 2010 [22]. In recent years, some unique subsidies have been implemented to encourage battery development [23]. Intense price competition leads manufacturers to develop new chemistries and reduce production costs. From Blooming New Energy Finance (BNEF), annual lithium-ion battery observed prices and forecast prices are shown in Figure 3 [24]. Therefore, with the decrease in the cost of batteries, energy storage will also become an effective measure to realize grid connection of large-scale PV power stations [25].
Complementing PV power stations with energy storage can realize energy transfer on the time axis, control power effectively, improve the quality of electric energy, and enhance the planning tracking ability [26]. Recently, the complementary operation patterns of energy storage and PV power stations have been researched, which are generally classified into two categories: smoothening the output of PV power stations and achieving electrical energy transfer. Ma et al. [27] proposed that because an energy storage system can absorb and release electricity instantly, it could be used for suppressing the output fluctuation and improving the power quality of PV power stations. Ibrahim et al. [28] suggested that an energy storage system could realize the transfer of energy on the time axis, by storing the electricity of the PV power station during the low-power-load periods such as morning and evening. The stored electricity could then be discharged to meet the load demand during the peak hours around 18:00. Engels et al. [29] introduced the peak-shaving abilities of a battery energy storage system, and Jones et al. [30] adopted an energy storage system instead of a thermal power plant to operate only during the peak period to reduce greenhouse gas emissions. Akbari et al. [31] suggested that energy storage batteries could store electricity at low demands and low power generation costs or when intermittent energy sources are present. They could in turn release the electricity at a high demand and high power generation cost or when other power generation is unavailable. Lucas et al. [32] applied energy storage to both peak-shaving and planned-tracking modes.
Energy storage systems are mainly of two categories: high power storage (HPS) and high energy storage (HES) [33]. HPS systems include supercapacitors (SC), flywheels, and superconducting magnetic energy storage (SMES), which are suitable for smoothing out high-frequency fluctuations, owing to their rapid response. However, the high cost of HPS systems restricts their large-scale application. HES systems with relatively lower costs have high storage capacities and are suitable for smoothing out low-frequency fluctuations. They include pumped hydro, compressed air, vanadium redox flow batteries (VRBs), sodium–sulphur cells, lead–acid cells (PbAc), lithium-ion batteries, and fuel cells (FCs) [34]. In practical applications, the type of energy storage battery can be determined based on its characteristics and the needs. Some studies also adopted various combinations of energy storage systems to maximize the utilization [35,36,37,38].
Currently, there are three main methods for optimizing the capacity configuration of an energy storage battery: (1) establishing objective functions based on the stabilizing effect of energy storage: Chen et al. [39] established an energy storage capacity optimization model for smoothing wind power generation. They also proposed management strategies based on the variable characteristics between the state of charge (SOC) and the terminal voltage of the battery, so that the fluctuation of the wind farm output could be smoothed rapidly and effectively. Yu et al. [40] considered the influence of the continuous hours of wind power generation and determined the energy storage capacity of a wind farm based on the distribution law of the wind power generation, regarding average power as the expected value. Khaki et al. [41] proposed some indices for measuring the fluctuation of the total active power, considering the influence of different energy storage capacities. (2) Establishing objective functions aimed at minimizing the energy storage capacity. Varshosaz et al. [42] adopted the saturation control theory to calculate the minimum energy storage capacity to keep the system stable. The authors of [43,44] used the discrete Fourier transform for analyzing the spectrum of renewable energy to determine the compensation range of energy storage, and then proposed a capacity determination method that satisfied the requirements. (3) Establishing objective functions with the objective of minimizing the cost. In [45,46,47], the minimum sums of the investment costs, maintenance costs, and pollution costs were used as the objective functions. The authors of [48,49,50] aimed at the lowest cost and considered the power output and SOC constraints of a hybrid energy storage. Ban et al. [51] constructed an energy storage capacity optimization model aiming at minimizing the operating costs, considering the abandoned electricity rate and loss of energy storage.
The limitation of the first two above methods is that the capacity configuration of energy storage is only considered from a technical perspective, without accounting for the impact of the current high energy storage costs on the economies of PV systems. The shortcoming of the last method is that it failed to consider the cost of replacing and maintaining equipment and equipment failures throughout the life cycle when calculating the cost of energy storage. Therefore, energy storage optimization also needs to include economic feasibility. Hoppmann et al. [52] summarized the main parameters of electric power costs including the PV installed capacity, energy storage battery capacity, technical costs, subsidies and electricity prices, and financial indicators such as the net present value (NPV), payback period (PB), and internal rate of return (IRR). Beltran et al. [53] constructed a multi-factor economic evaluation model of an energy storage system using energy storage to reduce the risk of wind power dispatching. Zhang et al. [54] optimized the energy storage capacity with the objective of maximizing the benefit, considering different control modes. De et al. [55] analyzed the optimization ratio technologies from economic and technical aspects.
In this investigation, the Qinghai Gonghe 100 MWp PV power station in China was taken as a case study. To realize long-distance grid connection of large-scale PV power stations while maximizing the benefits, the aim of the research was to develop a storage capacity optimization method that considers three factors, including technology, economy, and energy storage battery characteristics. The remainder of the paper is structured as follows: Section 2 explains the method of energy storage optimization, including the long-distance delivery mode and energy storage optimization model. The energy storage optimization model was composed of an energy dispatch optimization model, a lithium battery performance model, and an economic evaluation system. Section 3 presented the results and discussion, including the abandoned electricity and alternative energy storage capacity analysis, optimal energy storage capacity, battery attenuation variation law, and replacement cycle. Section 4 summarizes the conclusions of this study, which has important reference applications for the development and construction of large-scale PV power stations.

2. Methodologies

2.1. Long-Distance Delivery Mode

UHV transmission has high requirements for power stability; however, the output of a PV power station exhibits volatile and randomness characteristics, owing to the natural meteorological conditions. To improve the stability of power grid operation and UHV transmission power, it is necessary to adopt a multi-stage delivery mode in which the power is stable for each time segment [56], which means that the PV power station’s power generation time is divided into several time segments, and the grid-connected power of each time segment depends on the capacity of energy storage and actual output of the PV power station.
Based on randomness characteristics of PV power station output and high requirements of power quality for long-distance UHV transmission to ensure the frequency and voltage stability of power grid systems, in this study, a five-segment line delivery mode was selected to realize long-distance UHV transmission, as shown in Figure 4.

2.2. Energy Storage Optimization Model

Figure 5 presents the frame of the energy storage optimization model. In the case study, 1, 5, 10, 15, 20, 25, and 30 MWh are regarded as the alternative capacities for energy storage batteries. In this study, a lithium battery was taken as an example because it has strong power regulation characteristics, declining prices, and a long service life.
The research objective of the model was to select the optimal capacity to maximize the NPV during the full life cycle. The NPV can be calculated by the economic evaluation system considering factors such as the initial investment cost, maintenance cost, electric sales revenue, and maintenance operation investment cost, as proposed in this paper. The initial investment cost and maintenance cost are related to the alternative capacities of the lithium battery and unit prices. Electric sales revenue is obtained by the annual abandoned electricity, which relies on the daily abandoned energies and ratios of the weather types. Further, the daily abandoned energies can be calculated by the energy dispatch model established in this study. Finally, the maintenance operation investment costs are related to the life loss of batteries, which can be obtained by the lithium battery performance model built in this study.

2.2.1. Energy Dispatch Optimization Model

Figure 6 displays a schematic of the PV-energy storage system including large-scale PV power stations and energy storage batteries that are connected to the electric grid. The charging/discharging response of each battery is assumed to be practically instantaneous, so that energy from it may be dispatched “on demand”. This assumption is justified because the response time of a Li-ion type battery is 0 ms, and the energy dispatch from each battery was modelled in 5-min intervals. Each battery is treated as a black box within the model, implying that its charging and discharging efficiencies do not depend on the charge/discharge power, P b e s s . Further, P b e s s can take any values within the specified limits of a nominal battery performance.
The schemes for long-distance UHV transmission are determined by the capacity of energy storage and output feature of the PV power station. According to the actual output of the large-scale PV power station and the long-distance delivery mode proposed in the previous subsection, a mathematical model was established for minimizing the daily abandoned electricity of a PV power station under different capacities of an energy storage battery, respectively. Genetic algorithm (GA) is an optimization algorithm inspired by the natural selection process, which belongs to an evolutionary algorithm. Compared with traditional optimization algorithms, GA has the advantages of quick computing speed and high convergence accuracy. Therefore, the model was formulated as a GA optimization problem in this study and the model is explained in the following subsections.
(1) Objective function
Minimizing the daily abandoned electricity of PV power station is taken as the objective function.
(2) Decision variables
The power values P d i (i = 1, 2, ⋯, 5) of each time segment of the PV-energy storage battery system are taken as decision variables.
(3) Constraints
The model is subject to constraints including power balance constraint, energy conservation constraint, overcharge and overdischarge constraints.
min { f ( P d 1 , P d 2 , P d 3 , P d 4 , P d 5 , E R ) } = t = 1 N E _ a b g t ,
Such that
P g t = P p v t P b t ,
E b t = E b t 1 + P b t ω c Δ t ,   while   P g t < P p v t ,
E b t = E b t 1 + P b t Δ t / ω d ,   while   P g t > P p v t ,
E b min E b t E b max   or   S O C b min S O C b t S O C b max ,
P b min < P b t < P b max .
In Equations (1)–(6), E and P are energy and power. Variables with subscript b are related to the energy storage battery, subscript pv is related to the PV power output, and subscript g refers to the PV-energy storage battery grid-connected power. Integer superscript t is the current timestep, Δ t is the timestep size, and N denotes the maximum number of time steps in the scheduling range (e.g., N = 288 for a 24-h scheduling horizon at a 5 min sampling rate). Superscripts min and max indicate the performance limits of the battery (i.e., maximum and minimum capacity or charging/discharging rate).
Equation (1) minimizes the net PV-energy storage battery system abandoned energy, E _ a b g . In Equation (1), f is an objective function (or cost function) that corresponds to the energy storage alternative capacity, E R , and the five characteristic values in the five-segment send mode.
Equation (2) expresses the power balance constraint (i.e., the grid-connected power should be equal to the combined output of the PV-energy storage systems at any time). In Equation (2), P g t is the grid-connected power of the PV-energy storage power system, P pv t is the actual power output of the PV power station, and P b t denotes the charging and discharging power of the energy storage battery. P b t is positive when the energy storage battery is charged and a negative value when it is discharged.
Equations (3) and (4) express the energy conservation (Kirchhoff’s law). The energy storage battery is charged under the condition: P g t < P p v t , whereas it is discharged under the condition: P g t > P p v t . Equations (3) and (4) denote the remaining capacity of the energy storage battery, E b t , which should be enforced as equality constraints in the model, where ω c and ω d are the charging and discharging efficiencies, respectively.
Equation (5) requires that the energy stored in the battery be bounded within the capacity of the battery. SOC is the ratio of the energy stored in the battery to the rated capacity of battery. SOC min and SOC max are the minimum and maximum SOC of the battery, respectively. Equation (6) constrains the battery charging and discharging rate within the specified limits of the battery performance. Equations (5) and (6) are modelled as inequality constraints to avoid overcharge and overdischarge. The GA optimization model is solved in MATLAB.

2.2.2. Lithium Battery Performance Model

From an electrochemical perspective, as the number of charge and discharge cycles increases, internal factors such as the electrolyte decomposition and electrode oxidation cause a slow decline in the battery capacity and are irreversible. A reduction in the rated capacity of the energy storage battery will result in a decrease in its annual storage capacity, and concurrently, the annual abandoned electricity rate of the PV power station will increase. The energy storage battery needs to be updated when it reaches its full life cycle, i.e., it is attenuated to a certain extent and cannot meet the energy storage requirements of the PV power station.
The lithium battery life is the number of continuous charge and discharge cycles for which the storage capacity retention rate is not lower than the specified capacity in a given ambient temperature and charge and discharge modes. Battery performance degradation includes the life loss caused by the deterioration of the battery material and change in the battery working state, which is closely related to the battery service time, charging and discharging states, and temperature.
The battery life loss rate is divided into static loss and dynamic loss, expressed as the percentage loss of life, which can be expressed as Equation (7).
X = X S + X D .
In Equation (7), X S is the static loss and X D is the dynamic loss.
(1) Static loss
Static loss is the loss caused by the deterioration of the functional characteristics of the energy storage battery material. This part of the loss is independent of the operating conditions and only linearly related to the battery standing duration. The annual static loss is calculated from Equation (8).
X S = 100 % T .
In Equation (8), T is the shelf life of the battery, in years. In this paper, the shelf life of the lithium battery is selected as T = 15 years according to the nominal life defined by the manufacturer.
(2) Dynamic loss
Dynamic loss is the loss caused by the change in the operating state of the energy storage battery, including the depth and rate of charge and discharge, corresponding to the dynamic process of its charging and discharging. As the actual working condition is a nonperiodic charging and discharging process, the resulting life loss is also nonlinear. The dynamic loss must be calculated in combination with the actual working conditions. The dynamic loss is calculated from Equation (9).
X D = i = 1 n 1 / N D .
In Equation (9), N D indicates the maximum number of cycles allowed for the actual capacity (i.e., actual remaining capacity) of the energy storage battery corresponding to its discharge depth remaining between 60% and 100% of the nominal capacity (i.e., rated capacity shown on the nameplate) within a certain charge and discharge interval.
The main influence factor of N D is the depth of discharge (DOD). According to international regulations including the cycle life test conditions and requirements of lithium batteries, the energy storage battery should be charged and discharged at a constant current and constant voltage mode 1C charging system at the room temperature of 20 ± 5 °C. An 80% discharge depth is the indicator of each charge and discharge cycle, and the cycle life of the lithium battery is the number of cycles in which the actual capacity is maintained at 60% of the nominal capacity. According to the performance of lithium battery shown in Table 1, the lithium battery can be charged and discharged for 10,000 cycles when the discharge depth is 10%, but only for 400 cycles when the discharge depth is 100%.
The relationship between the discharge depth and cycle life is approximately e-exponential. The function relationship: N D = f ( D O D ) can be obtained by exponentially fitting the measured data of the cycle life and DOD. It can represent the relationship between the DOD of the energy storage battery and the maximum number of cycles allowed when its actual capacity is 60%–100% of the nominal capacity.
Based on e-exponential fitting, the functional relationship between the maximum cycle number, N D , and DOD of the lithium battery is described as Equation (10). The corresponding fitting curve for 95% confidence interval is presented in Figure 7.
N D = 18696 × e 6.3 DOD + 42.98 × e 2.21 D O D .
In summary, the annual life loss of the energy storage battery is calculated from Equation (11).
X = X S + X D = 1 T + i = 1 n 1 N D = 1 T + i = 1 n 1 18696 × e 6.3 D b e s s , i + 42.98 × e 2.21 D b e s s , i ,
where n is the total number of charge and discharge cycles of the energy storage battery in one year. The energy storage battery will reach the retirement condition when the process of the energy storage operating life loss will become 100%, which is expressed as Equation (12).
i = 1 N X ( i ) = 100 % .
In Equation (12), N is the annual operating cycles of the energy storage battery.
Considering an irreversible decay of the energy storage battery capacity, the actual capacity of the energy storage at the end of the previous year is taken as its rated capacity for the next year. Moreover, the performance loss of the energy storage battery for the next year will be calculated accordingly. During the operation period of the energy storage battery, its actual capacity can be calculated by Equation (13).
{ E = E R i = 1 E ( i ) =   E R × i = 2 N [ ( 1 X ( i 1 ) ] i 2 ,
where i represents the ith year of the energy storage battery operation, E R is its rated capacity, E is the actual capacity of the energy storage battery, and X is the loss rate of the energy storage life.
In summary, we can analyze the relationship between the number of cycles of the lithium battery ( N D ) and depth of discharge (DOD) to obtain the function relationship: N D = f ( D O D ) . Then, the life loss of the energy storage battery is calculated in any of its charging and discharging intervals under the actual working conditions with the lithium battery performance model.

2.2.3. Economic Evaluation System

The NPV is taken as the index of the economic evaluation system, considering the aspects of the electricity sales revenue, maintenance operation investment cost, operating investment cost, maintenance cost, and initial investment cost.
In this study, the life cycle of the energy storage battery is unified for five years. The energy storage loss cost is used as the maintenance operation investment of the energy storage batteries. In comparison, the cost of purchasing energy storage batteries is distributed over the whole life cycle, in terms of the operating loss costs, to eliminate the influencing factors of the different service lives.
(1) Electricity sales revenue.
The revenue from the energy storage batteries is mainly achieved by the sale of electricity. Under the five-segment-line sending mode, the application of an energy storage battery can effectively reduce the amount of abandoned electricity of the PV power station compared with that without the energy storage. The reduced abandoned electricity by the application of energy storage is the source of electricity sales revenue, which can be calculated by Equation (14).
I e ( i ) = I g × [ r ( i ) r ( 0 ) ] × Q ( i ) ,
where i represents the ith year during the life cycle of the energy storage battery, I e is the total annual electricity sales revenue, I g represents the unit price for the on-grid electricity, r is the annual abandoned electricity rate of the PV power station, r ( 0 ) is the annual abandoned electricity rate of the PV power station when there is no energy storage under the same delivery mode, and Q is the annual generation of the PV power station.
(2) Maintenance operation investment cost.
For a large-scale PV power station under given long-distance delivery mode, the storage batteries of different capacities are different in both cycles and depths of charge and discharge during operations, which results in different life cycles of energy storage batteries with different storage capacities. The life cycles of energy storage batteries with different capacities are unified to five years in this paper, the energy storage loss costs are taken as the maintenance operation investment costs of energy storage batteries, and the purchase cost of energy storage batteries is distributed into the life cycle in terms of operating loss cost, so as to eliminate the influence factors of different service lifespans.
Maintenance operation investment cost is the quantitative measurement of the investment cost incurred by the energy storage battery life loss, which can be calculated by Equation (15).
I c ( i ) = X ( i ) × ϖ × E ( i ) .
In Equation (15), X is battery annual life loss rate, E is the actual capacity of the energy storage battery, which can be calculated in Equation (13), and ϖ is the unit price of the energy storage battery.
(3) Maintenance cost.
The energy storage battery needs to be maintained once it is under operation. The annual maintenance cost is calculated by Equation (16).
I m ( i ) = × ϖ × E ( i ) ,
where I m is the annual maintenance cost and is the proportion of the maintenance cost in the unit price of the energy storage battery. As the technology of energy storage batteries is getting better and the battery costs are gradually decreasing, the maintenance costs also tend to decrease. According to a lithium battery manufacturer in China, the unit price of lithium batteries is 2000 RMB/kWh while the annual maintenance cost is 200 RMB/kWh, that is, the annual maintenance cost is 10% of the unit price. Assuming that the proportion of the maintenance cost in the unit price of the energy storage battery is constant, the maintenance costs of batteries related to different unit prices can be better predicted in future, taking = 10 % in this study.
(4) Initial investment cost.
The initial investment of the energy storage power station mainly refers to the construction cost of the energy storage battery, which is expressed in Equation (17).
I s = ϖ × E R ,
where I s is the initial investment cost, which is a one-time construction cost, and E R is the initial capacity of the installed energy storage battery.
The NPV of the energy storage battery life cycle is estimated from Equation (18).
N P V = i = 1 N I e ( i ) I m ( i ) I c ( i ) ( 1 + I ) i I s ,
where N is the life cycle of the energy storage battery and I is the discount rate.

3. Results and Discussion

3.1. Energy Dispatch Optimization Model Output

The daily grid-connected dispatching scheme for the PV-energy storage power station under each alternative energy storage capacity can be optimized by the energy dispatch optimization model, described in Section 2.2.1. The grid-connected schemes of the alternative energy storage capacities, in a typical sunny, rainy, and cloudy day in May 2018, are shown in Figure 8.

3.2. Capacity-Abandoned Electricity Analysis

When there is no energy storage, the daily grid-connected schemes of the PV power station mainly depend on its output, and the output above the dispatch line has to be abandoned. Therefore, different weather patterns have different effects on the abandoned electricity rate of a PV power station. Under the same long-distance delivery mode, the daily abandoned electricity rate without the energy storage in different typical weather patterns is listed in Table 2. For the daily abandoned electricity rate of a PV power station, the relationship between the different weather patterns obtained from Table 2 is sunny day < rainy day < cloudy day.
Compared with the determination of the PV power station, the abandoned energy is mainly from the following two aspects: (1) the power loss caused by the charging and discharging efficiencies of the energy storage battery; (2) these is a condition that the actual output of the PV station is larger than that of the power of the grid-connected ( P g t < P p v t ) case. The latter occurs when the energy storage battery reaches its maximum allowable capacity, so that the power has to be abandoned. The daily abandoned electricity rate can be calculated from the energy dispatch optimization model.
The annual abandoned electricity of a PV power station depends on the daily abandoned electricity, local ratios of the weather patterns in a year, energy storage capacity, and delivery mode. Among them, the ratios of the weather patterns are affected by the local geographical conditions and climatic factors (e.g., the proportion of the different weathers in the case study, as presented in Figure 9).
In the case study, the actual annual generation of the PV power station is 2.2598 × 10 5 MWh. When there is no energy storage station, the annual abandoned electricity of the PV power station is 6.0437 × 10 4 MW, so that the annual abandoned electricity rate reaches 26.74%. Under the delivery mode, the annual abandoned electricity rates of the PV power station with different energy storage capacities are shown in Figure 10.
Figure 10 shows that with the increase in the energy storage capacity, the annual abandoned electricity rate gradually decreases; it decreases from 26.74% when there is no energy storage to 3.42% when the energy storage capacity is 30 MWh. Therefore, the application of energy storage batteries is of tremendous significance for reducing the abandonment of electricity and improving the utilization rate of PV power stations. The relationship between the annual abandoned electricity rate and energy storage capacity is satisfied by a polynomial fitting to Equation (19).
r a b = ( 0.0001 x c 3 0.0024 x c 2 0.0354 x c + 0.2595 ) × 100 %       x c [ 1 , 30 ] .
In Equation (19), x c is the energy storage capacity and r a b is the corresponding annual abandoned electricity rate of the PV power station.

3.3. Optimal Energy Storage Capacity

According to the economic evaluation system, which is described in Section 2.2.3, when the on-grid price is 0.50 RMB per kWh and the full life cycles of energy storage batteries with different capacities are uniformly assumed to be five years, the NPV in the same life cycle (i.e., five years) of energy storage batteries with different unit prices and different capacities is shown in Figure 11.
In Figure 11, with the increase in the energy storage capacity configuration, the NPV of the energy storage battery in the entire life cycle presents a tendency that first increases and then decreases. When the energy storage capacity is low, the initial investment is less, whereas when the annual abandoned electricity rate is high, and the energy storage battery is mostly in a deep charge and deep discharge state, the battery life loss is large. When the energy storage capacity increases, the annual abandoned electricity rate decreases, but the initial investment increases.
For the same unit price of energy storage, the energy storage capacity corresponding to the maximum value of the NPV of the entire life cycle is the optimal energy storage capacity with the energy storage unit price ω : (1) when 1000 ω 1100 RMB per kWh, the optimal energy storage capacity is 10 MWh, which is 10% of the installed capacity of the PV power station; (2) when 1200 ω 1600 RMB per kWh, the optimal energy storage capacity is 5 MWh, equaling 5% of the installed capacity of the PV power station. According to the current market price of lithium batteries, under the given delivery mode, in the case study, the optimal energy storage capacity is 5 MWh.
When the optimal energy storage battery is configured, the annual abandoned electricity of the PV power station is reduced by 3.051 × 10 4 MWh compared with the initial annual abandoned electricity when there is no energy storage, which equals 6.0437 × 10 4 MWh. According to the thermal power consumption of a 305-g standard coal per kWh, a total of 9305.5 t of standard coal can be saved in a year. Moreover, the production process does not produce any waste gas, waste water, waste liquid, and waste solid. According to the emission standards of a thermal power station (the dust is 1.8 g/kWh, sulphur dioxide is 6.2 g/kWh, carbon dioxide is 814 g/kWh, nitrogen oxides are 2.1 g/kWh, ash is 119.45 g/kWh), the total emission of smoke can be reduced by approximately 54.92 t/a. Sulphur dioxide is about 189.16 t/a, carbon dioxide is about 24,835.14 t/a, nitrogen oxide is approximately 64.07 t/a, and ash is about 3644.42 t/a. Therefore, the utilization of energy storage can make a major contribution to the optimization and transformation of the local environment.

3.4. Battery Attenuation Variation Law and Replacement Cycle

For a large-scale PV power station under given long-distance delivery mode, the storage batteries of different capacities are different in both cycles and depths of charge and discharge during operations, which results in different life cycles of energy storage batteries with different storage capacities. The full life cycles of energy storage batteries with different capacities are all assumed to be five years in Section 3.3, which cannot represent the real replacement cycles of energy storage batteries with different capacities during actual operations. Therefore, the battery real replacement cycle, i.e., the actual operation life cycle of the battery, should be determined based on its performance degradation during the actual operation period and by its corresponding annual abandoned electricity rate.
It should be noted that “the battery replacement cycle” mentioned here does not represent the scrap cycle, that is, after a period of operation, when the battery performance decays to a certain degree and the costs become great, the battery cannot meet the demand for a large-scale PV power station connected to the grid under given long-distance delivery mode. Thus, the battery should be functionalized under another set of conditions such as smooth fluctuations of PV power output to warrant its continued use.
There is only one-year operating data at the PV power station in the case study. Therefore, it is assumed that the output and the grid connection scheme of this PV power station in future are same as this one-year data. The rated capacity attenuation of the energy storage battery during operation and the corresponding annual abandoned electricity rate under different energy storage capacities are listed in Table 3.
In Table 3, C a is the actual capacity of the energy battery storage that is attenuated in the operation periods, and R a is annual abandoned electricity rate of the PV power station with the actual capacity of energy storage battery. The capacity of the energy storage battery is attenuated yearly with the increase in the running time, and the attenuation speed is gradually decreased. When the battery is attenuated to a certain extent, the annual abandoned electricity rate is extremely high, which means the benefits cannot support the maintenance cost of the battery, and the battery needs to be replaced.
In the case study, when PV power station’s annual electricity rate is more than 25%, the benefits are insufficient to support its maintenance cost, and the batteries should be replaced. Table 3 indicates that the attenuation processes are various with different capacities of energy storage batteries. The replacement cycles of different energy storage capacities are shown in Figure 12. In the case study, the energy storage battery with optimal capacity proposed in Section 3.3 (i.e., 5 MWh) should be replaced one time in two years.
As electrical energy demand is generally rising, the technologies of energy storage batteries are getting better, battery lifetime is increasing, and the costs are decreasing. At present, there are many categories of energy storage batteries and the properties of energy storage batteries are various in different types of batteries. This paper only focused on lithium batteries, which cannot represent all types of future energy storage batteries. However, the method proposed in the paper can be applied to all batteries according to the performance of batteries. The calculation results such as optimal capacity, NPV of full life cycle and replaced cycle of energy storage are various with different battery categories. By this method, more types of batteries can be examined, so as to choose the most suitable type of battery with optimal capacity and replace cycle.

4. Conclusions

In order to realize long-distance transmission to the grid net, this paper proposed a methodology for optimizing the energy storage capacities for large-scale PV power stations, which provided a reference for the application of energy storage batteries in large-scale photovoltaic power stations. The main conclusions were summarized as follows:
(1)
Five-segment long-distance delivery mode was proposed to meet the power stability requirements for UHV transmission of large-scale PV power stations.
(2)
Energy storage capacity optimization system included energy dispatch optimization model, lithium battery performance model, and economic evaluation system, considering technology, economy, and energy storage battery performance.
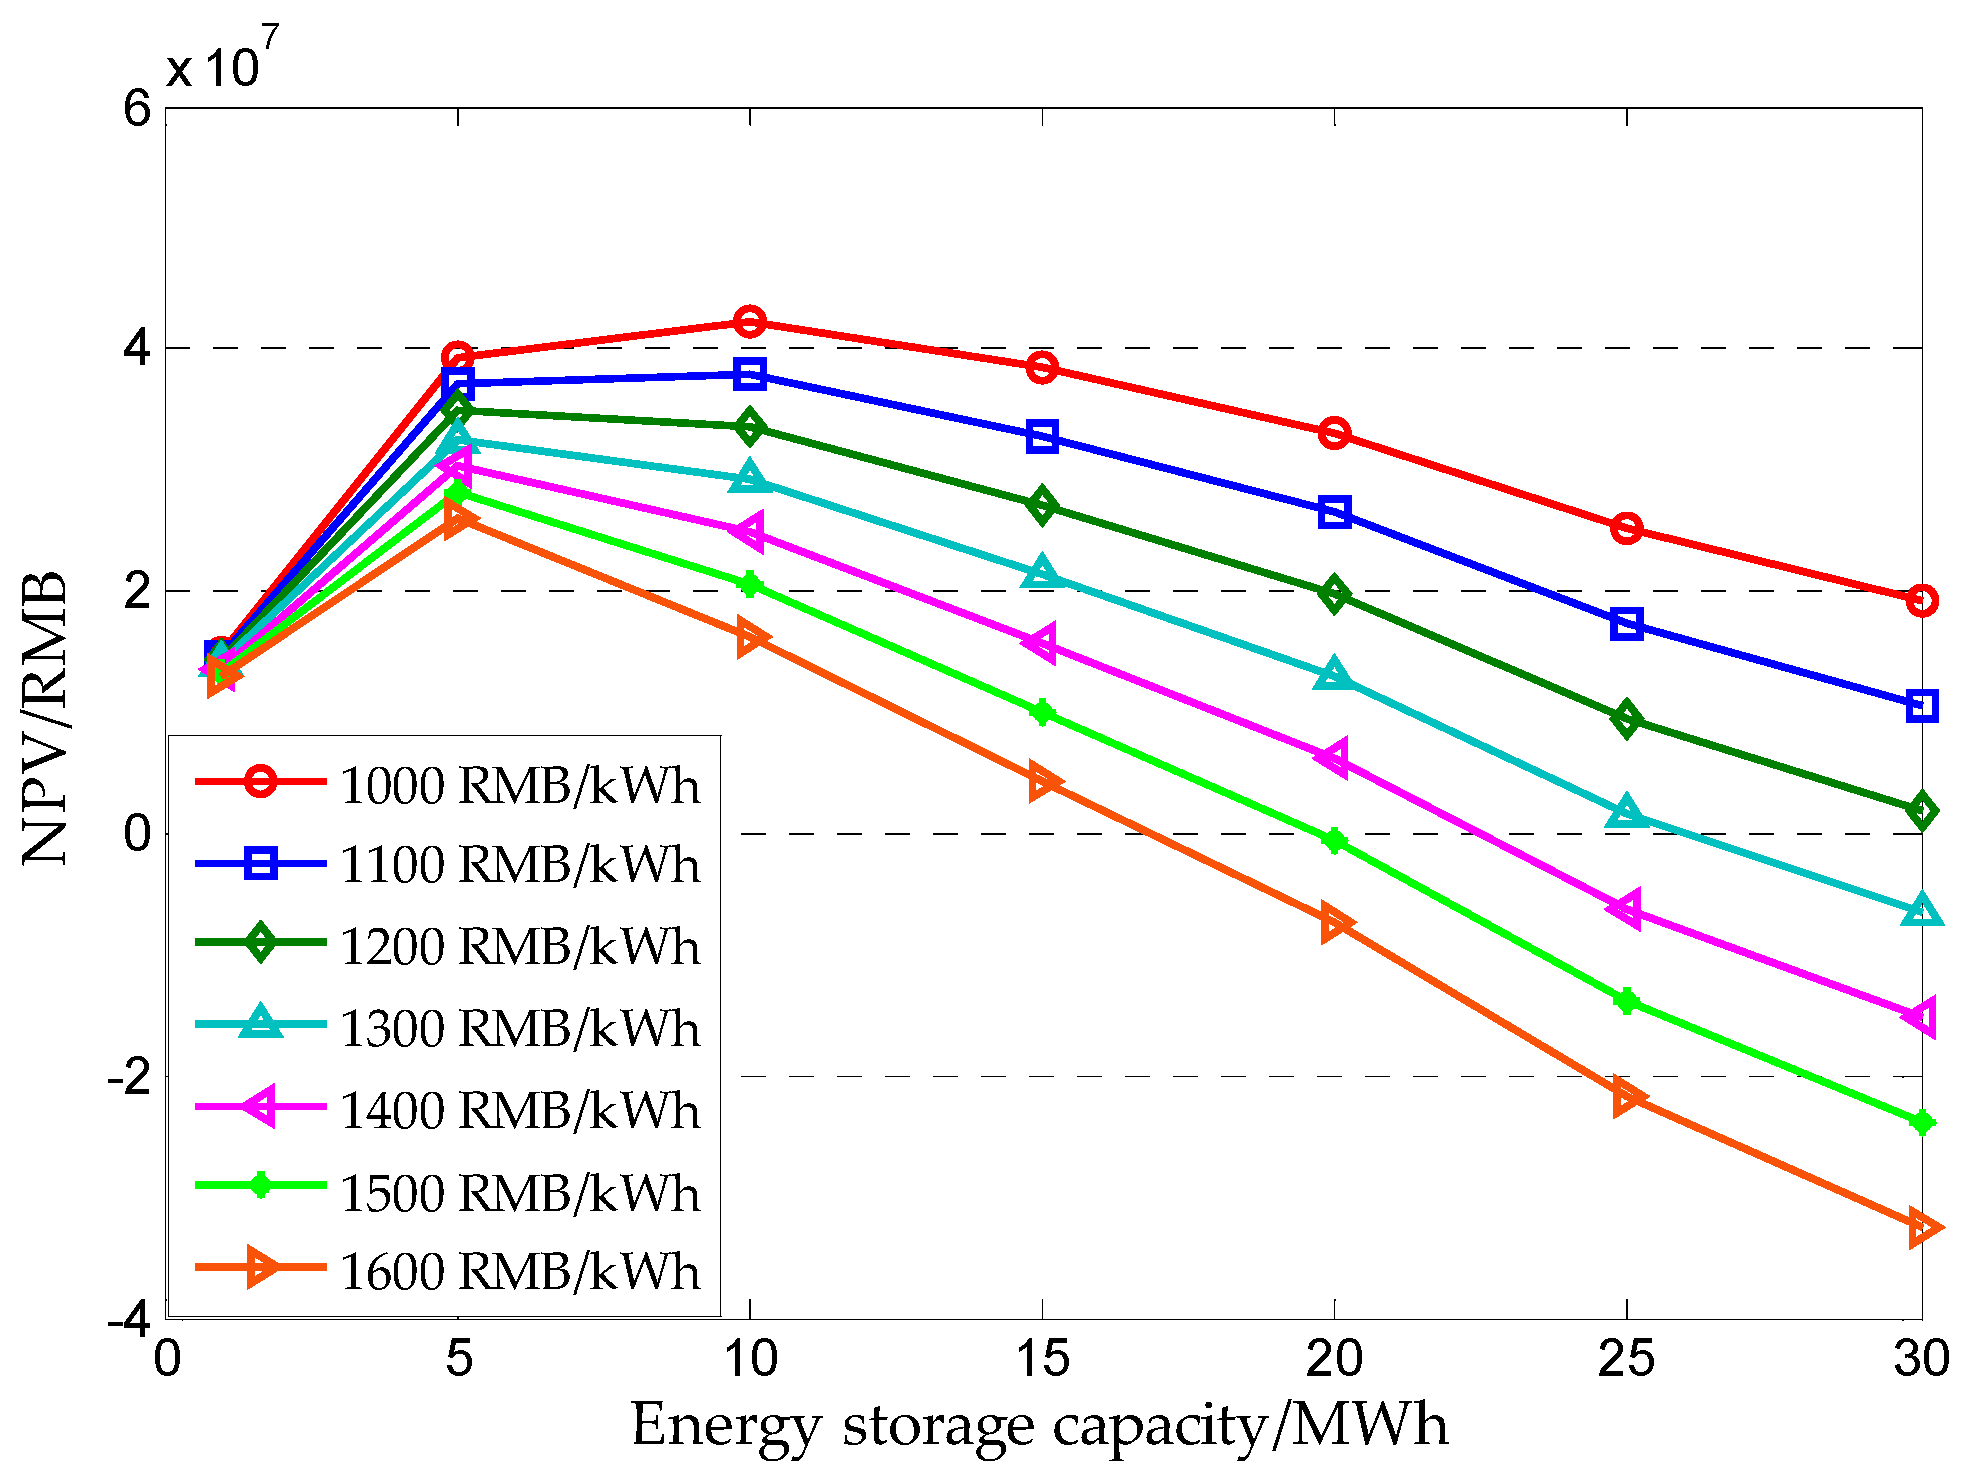
(3)
The optimal capacity of energy storage was 5 MWh in the case study, according to the values of NPV in the unified life cycle (i.e., five years) with different unit prices and capacities of energy storage battery.
(4)
Based on attenuation variation law and annual abandoned electricity rate during the actual operation period, actual replacement cycle of the battery was proposed.
(5)
In the case study, the energy storage battery with the optimal capacity (i.e., 5 MWh) was suggested to be replaced once in two years.
Specially, three factors were considered in this methodology, including weather factors, output characteristics, and power requirements for long-distance power transmission of large-scale PV power stations. Owing to its good performance in the case study, this methodology could be considered as an objective reference for determining the optimal capacity of energy storage for large-scale PV power stations. More sizes and kinds of energy storage batteries configured for large-scale PV power stations will be compared in future study.

Author Contributions

Conceptualization, C.M.; methodology, C.M., Y.Y. and C.L.; formal analysis, Y.Y., C.M. and Y.Z.; software, Y.Y. and Y.Z.; resources, Y.Y. and C.M.; data curation, Y.Y.; writing—original draft preparation, Y.Y.; writing—review and editing, C.M., C.L. and Y.Z.; supervision, C.M.; validation, C.M.; funding acquisition, C.M. and Y.Y. All authors have read and agreed to the published version of the manuscript.

Funding

This research was supported by the Fund for National Natural Science Foundation of China (grant number 51722906) and Program of Introducing Talents of Discipline to Universities (grant number B14012).

Conflicts of Interest

The authors declare no conflict of interest.

Abbreviations

PVphotovoltaic
UHVultra-high voltage
NPVnet present value
SOCstate of charge
DODdepth of discharge

References

  1. Khatib, T.; Mohamed, A.; Sopian, K. Optimal sizing of hybrid pv/wind systems for malaysia using loss of load probability. Energy Sources Part A 2015, 37, 687–695. [Google Scholar] [CrossRef]
  2. Dujardin, J.; Kahl, A.; Kruyt, B. Interplay between photovoltaic, wind energy and storage hydropower in a fully renewable Switzerland. Energy 2017, 135, 513–525. [Google Scholar] [CrossRef]
  3. Zhou, S.; Wang, Y.; Zhou, Y. Roles of wind and solar energy in China’s power sector: Implications of intermittency constraints. Appl. Energy 2018, 213, 22–30. [Google Scholar] [CrossRef]
  4. Heide, D.; Von Bremen, L.; Greiner, M. Seasonal optimal mix of wind and solar power in a future, highly renewable Europe. Renew. Energy 2010, 35, 2483–2489. [Google Scholar] [CrossRef]
  5. Heide, D.; Greiner, M.; Von Bremen, L. Reduced storage and balancing needs in a fully renewable European power system with excess wind and solar power generation. Renew. Energy 2011, 36, 2515–2523. [Google Scholar] [CrossRef] [Green Version]
  6. Ataei, A.; Nedaei, M.; Rashidi, R. Optimum design of an off-grid hybrid renewable energy system for an office building. J. Renew. Sustain. Energy 2015, 7, 053123. [Google Scholar] [CrossRef]
  7. International Renewable Energy Agency. 2018. Available online: https://www.irena.org/ (accessed on 4 December 2018).
  8. Sun, H.; Zhi, Q.; Wang, Y. China’s solar photovoltaic industry development: The status quo, problems and approaches. Appl. Energy 2014, 118, 221–230. [Google Scholar] [CrossRef]
  9. Hua, Y.; Oliphant, M.; Hu, E.J. Development of renewable energy in Australia and China: A comparison of policies and status. Renew. Energy 2016, 85, 1044–1051. [Google Scholar] [CrossRef]
  10. Liu, L.Q.; Wang, Z.X.; Zhang, H.Q. Solar energy development in China—A review. Renew. Sustain. Energy Rev. 2010, 14, 301–311. [Google Scholar] [CrossRef]
  11. Zhang, S.F. Analysis of DSPV (distributed solar PV) power policy in China. Energy 2016, 98, 92–100. [Google Scholar] [CrossRef]
  12. Ge, X.; Jiang, Z.; Li, C. Social and ecological effects of biomass utilization and the willingness to use clean energy in the eastern Qinghai–Tibet plateau. Energy Policy 2012, 51, 828–833. [Google Scholar]
  13. Zeng, M.; Li, H.; Mingjuan, M. Review on transaction status and relevant policies of southern route in China’s West–East Power Transmission. Renew. Energy 2013, 60, 454–461. [Google Scholar]
  14. Jamal, T.; Urmee, T.; Calais, M. Technical challenges of PV deployment into remote Australian electricity networks: A review. Renew. Sustain. Energy Rev. 2017, 77, 1309–1325. [Google Scholar] [CrossRef]
  15. Lin, S.; Li, C.; Xu, F. Risk identification and analysis for new energy power system in China based on D numbers and decision-making trial and evaluation laboratory (DEMATEL). J. Clean. Prod. 2018, 180, 81–96. [Google Scholar] [CrossRef]
  16. Shu, Y.; Chen, W. Research and application of UHV power transmission in China. High Volt. 2018, 3, 1–13. [Google Scholar] [CrossRef]
  17. Jurasz, J.; Ciapała, B. Solar–hydro hybrid power station as a way to smooth power output and increase water retention. Sol. Energy 2018, 173, 675–690. [Google Scholar] [CrossRef]
  18. Haghi, E.; Farshidian, B.; Saboohi, Y. Developing a model for optimal sizing of a small hydropower/PV hybrid system for electrification. In Proceedings of the IEEE International Conference on Smart Energy Grid Engineering (SEGE), Oshawa, ON, Canada, 14–17 August 2017; pp. 170–176. [Google Scholar]
  19. Zhang, Y.; Ma, C.; Lian, J. Optimal photovoltaic capacity of large-scale hydrophotovoltaic complementary systems considering electricity delivery demand and reservoir characteristics. Energy Convers. Manag. 2019, 195, 597–608. [Google Scholar] [CrossRef]
  20. Lata-García, J.; Reyes-Lopez, C.; Jurado, F. Sizing optimization of a small hydro/photovoltaic hybrid system for electricity generation in Santay Island, Ecuador by two methods. In Proceedings of the 2017 CHILEAN Conference on Electrical, Electronics Engineering, Information and Communication Technologies (CHILECON), Pucon, Chile, 18–20 October 2017; pp. 1–6. [Google Scholar]
  21. Apostolopoulou, D.; Mcculloch, M. Optimal Short-term Operation of a Cascaded Hydro-Solar Hybrid System: A Case Study in Kenya. IEEE Trans. Sustain. Energy 2018, 10, 1878–1889. [Google Scholar] [CrossRef]
  22. Overland, I.; Reischl, G. A place in the Sun? IRENA’s position in the global energy governance landscape. Int. Environ. Agreem. 2018, 18, 335–350. [Google Scholar] [CrossRef] [Green Version]
  23. Wei, M.; Smith, S.J.; Sohn, M.D. Experience curve development and cost reduction disaggregation for fuel cell markets in Japan and the US. Appl. Energy 2017, 191, 346–357. [Google Scholar] [CrossRef] [Green Version]
  24. Agudosi, E.S.; Abdullah, E.C.; Numan, A. A Review of the Graphene Synthesis Routes and its Applications in Electrochemical Energy Storage. Crit. Rev. Solid State Mater. Sci. 2019, 1–39. [Google Scholar] [CrossRef]
  25. Bloomberg New Energy Finance. New Energy Outlook 2018; Bloomberg New Energy Finance (BNEF): New York, NY, USA, 2018. [Google Scholar]
  26. Zhang, D.; Guo, J.; Li, J. Coordinated control strategy of hybrid energy storage to improve accommodating ability of PV. J. Eng. 2017, 2017, 1555–1559. [Google Scholar] [CrossRef]
  27. Ma, W.; Wang, W.; Wu, X. Control Strategy of a Hybrid Energy Storage System to Smooth PV Power Fluctuations Considering PV Output Power Curtailment. Sustainability 2019, 11, 1324. [Google Scholar] [CrossRef] [Green Version]
  28. Ibrahim, H.; Beguenane, R.; Merabet, A. Technical and financial benefits of electrical energy storage. In Proceedings of the 2012 IEEE Electrical Power and Energy Conference, London, ON, Canada, 10–12 October 2012; pp. 86–91. [Google Scholar]
  29. Lehmann, C.; Weeber, M.; Böhner, J. Techno-economical analysis of photovoltaic-battery storage systems for peak-shaving applications and self-consumption optimization in existing production plants. Procedia CIRP 2016, 48, 313–318. [Google Scholar] [CrossRef] [Green Version]
  30. Jones, R.; Haley, B.; Kwok, G. Electrification and the Future of Electricity Markets: Transitioning to a Low-Carbon Energy System. IEEE Power Energy Mag. 2018, 16, 79–89. [Google Scholar] [CrossRef]
  31. Akbari, H.; Browne, M.C.; Ortega, A. Efficient energy storage technologies for photovoltaic systems. Sol. Energy 2018, 192, 144–168. [Google Scholar] [CrossRef]
  32. Lucas, A.; Chondrogiannis, S. Smart grid energy storage controller for frequency regulation and peak shaving, using a vanadium redox flow battery. Int. J. Electr. Power Energy Syst. 2016, 80, 26–36. [Google Scholar] [CrossRef]
  33. Rodrigues, E.M.G.; Godina, R.; Santos, S.F. Energy storage systems supporting increased penetration of renewables in islanded systems. Energy 2014, 75, 265–280. [Google Scholar] [CrossRef]
  34. Hajiaghasi, S.; Salemnia, A.; Hamzeh, M. Hybrid energy storage system for microgrids applications: A review. J. Energy Storage 2019, 21, 543–570. [Google Scholar] [CrossRef]
  35. Zhao, Z.; Xiao, H.; Yang, Y. Improved coordinated control strategy of hybrid energy storages in PV Power Smoothing. Energy Procedia 2018, 145, 151–156. [Google Scholar] [CrossRef]
  36. Aktas, A.; Erhan, K.; Ozdemir, S. Experimental investigation of a new smart energy management algorithm for a hybrid energy storage system in smart grid applications. Electr. Power Syst. Res. 2017, 144, 185–196. [Google Scholar] [CrossRef]
  37. Li, B.; Roche, R.; Paire, D. Sizing of a stand-alone microgrid considering electric power, cooling/heating, hydrogen loads and hydrogen storage degradation. Appl. Energy 2017, 205, 1244–1259. [Google Scholar] [CrossRef] [Green Version]
  38. Ma, C.; Dong, S.; Lian, J. Multi-Objective Sizing of Hybrid Energy Storage System for Large-Scale Photovoltaic Power Generation System. Sustainability 2019, 11, 5441. [Google Scholar] [CrossRef] [Green Version]
  39. Chen, H.; Xin, J.; Yu, Y. Optimization of energy storage system capacity for wind farms based on cost-benefit analysis. In Proceedings of the 2016 IEEE PES Asia-Pacific Power and Energy Engineering Conference (APPEEC), Xi’an, China, 25–28 October 2016; pp. 1513–1517. [Google Scholar]
  40. Yu, M.; Huang, W.; Tai, N. Optimal reserve provision regulation for wind farms equipped with energy storage systems. Int. Trans. Electr. Energy Syst. 2019, 29, e2718. [Google Scholar] [CrossRef]
  41. Khaki, B.; Das, P. Sizing and Placement of Battery Energy Storage Systems and Wind Turbines by Minimizing Costs and System Losses. arXiv 2019, arXiv:1903.12029. [Google Scholar]
  42. Varshosaz, F.; Moazzami, M.; Fani, B. Day-Ahead Capacity Estimation and Power Management of a Charging Station based on Queuing Theory. IEEE Trans. Ind. Inform. 2019, 15, 5561–5574. [Google Scholar] [CrossRef]
  43. Muttaqi, K.M.; Islam, M.R.; Sutanto, D. Future Power Distribution Grids: Integration of Renewable Energy, Energy Storage, Electric Vehicles, Superconductor, and Magnetic Bus. IEEE Trans. Appl. Supercond. 2019, 29, 1–5. [Google Scholar] [CrossRef] [Green Version]
  44. Engels, J.; Claessens, B.; Deconinck, G. Techno-Economic Analysis and Optimal Control of Battery Storage for Frequency Control Services, Applied to the German Market. Appl. Energy 2019, 242, 1036–1049. [Google Scholar] [CrossRef] [Green Version]
  45. Liu, K.; Neathery, J.K.; Remias, J.E. Method for Energy Storage to Utilize Intermittent Renewable Energy and Low-Value Electricity for CO2 Capture and Utilization. U.S. Patent No. 9,285,112, 15 March 2016. [Google Scholar]
  46. Hong, N.N.; Nakanishi, Y. Optimal Scheduling of an Isolated Wind-Diesel-Energy Storage System Considering Fast Frequency Response and Forecast Error. Energies 2019, 12, 843. [Google Scholar] [CrossRef] [Green Version]
  47. Mohamed, M.A.; Eltamaly, A.M. Modeling of Hybrid Renewable Energy System. Modeling and Simulation of Smart Grid Integrated with Hybrid Renewable Energy Systems; Springer: Berlin/Heidelberg, Germany, 2018. [Google Scholar]
  48. Ban, M.; Jilai, Y.U.; Shahidehpour, M. Optimal sizing of PV and battery-based energy storage in an off-grid nanogrid supplying batteries to a battery swapping station. J. Mod. Power Syst. Clean Energy 2019, 7, 309–320. [Google Scholar] [CrossRef] [Green Version]
  49. Lu, X.; Chen, Y.; Fu, M. Multi-Objective Optimization-Based Real-Time Control Strategy for Battery/Ultracapacitor Hybrid Energy Management Systems. IEEE Access 2019, 7, 11640–11650. [Google Scholar] [CrossRef]
  50. Peng, K.; Feng, G.; Guan, X. Stochastic predictive control of battery energy storage for wind farm dispatching: Using probabilistic wind power forecasts. Renew. Energy 2015, 80, 286–300. [Google Scholar]
  51. Zhu, J.; Zhang, Y.; Chen, H.B. A frequency and duration analysis method for probabilistic optimal power flow with wind farms. IEEJ Trans. Electr. Electron. Eng. 2019, 14, 680–693. [Google Scholar] [CrossRef]
  52. Hoppmann, J.; Volland, J.; Schmidt, T.S. The economic viability of battery storage for residential solar PV systems—A review and a simulation model. Renew. Sustain. Energy Rev. 2014, 39, 1101–1118. [Google Scholar] [CrossRef]
  53. Beltran, H.; Perez, E.; Aparicio, N. Daily Solar Energy Estimation for Minimizing Energy Storage Requirements in PV Power Plants. IEEE Trans. Sustain. Energy 2013, 4, 474–481. [Google Scholar] [CrossRef] [Green Version]
  54. Zhang, Y.; Jian, L.; Liao, X. Multi-objective hydro-thermal-wind coordination scheduling integrated with large-scale electric vehicles using IMOPSO. Renew. Energy 2018, 128, 91–107. [Google Scholar] [CrossRef]
  55. De, R.K.; Ganguly, A. Energy, Exergy and Economic Analysis of a Solar Hybrid Power System Integrated Double-Effect Vapor Absorption System-Based Cold Storage. Int. J. Air-Cond. Refrig. 2019, 27, 115–124. [Google Scholar] [CrossRef] [Green Version]
  56. Liu, Z. China Needs Prompt Construction of a Strong National Power Grid (Excerption). Electricity 2005, 16, 5–8. [Google Scholar]
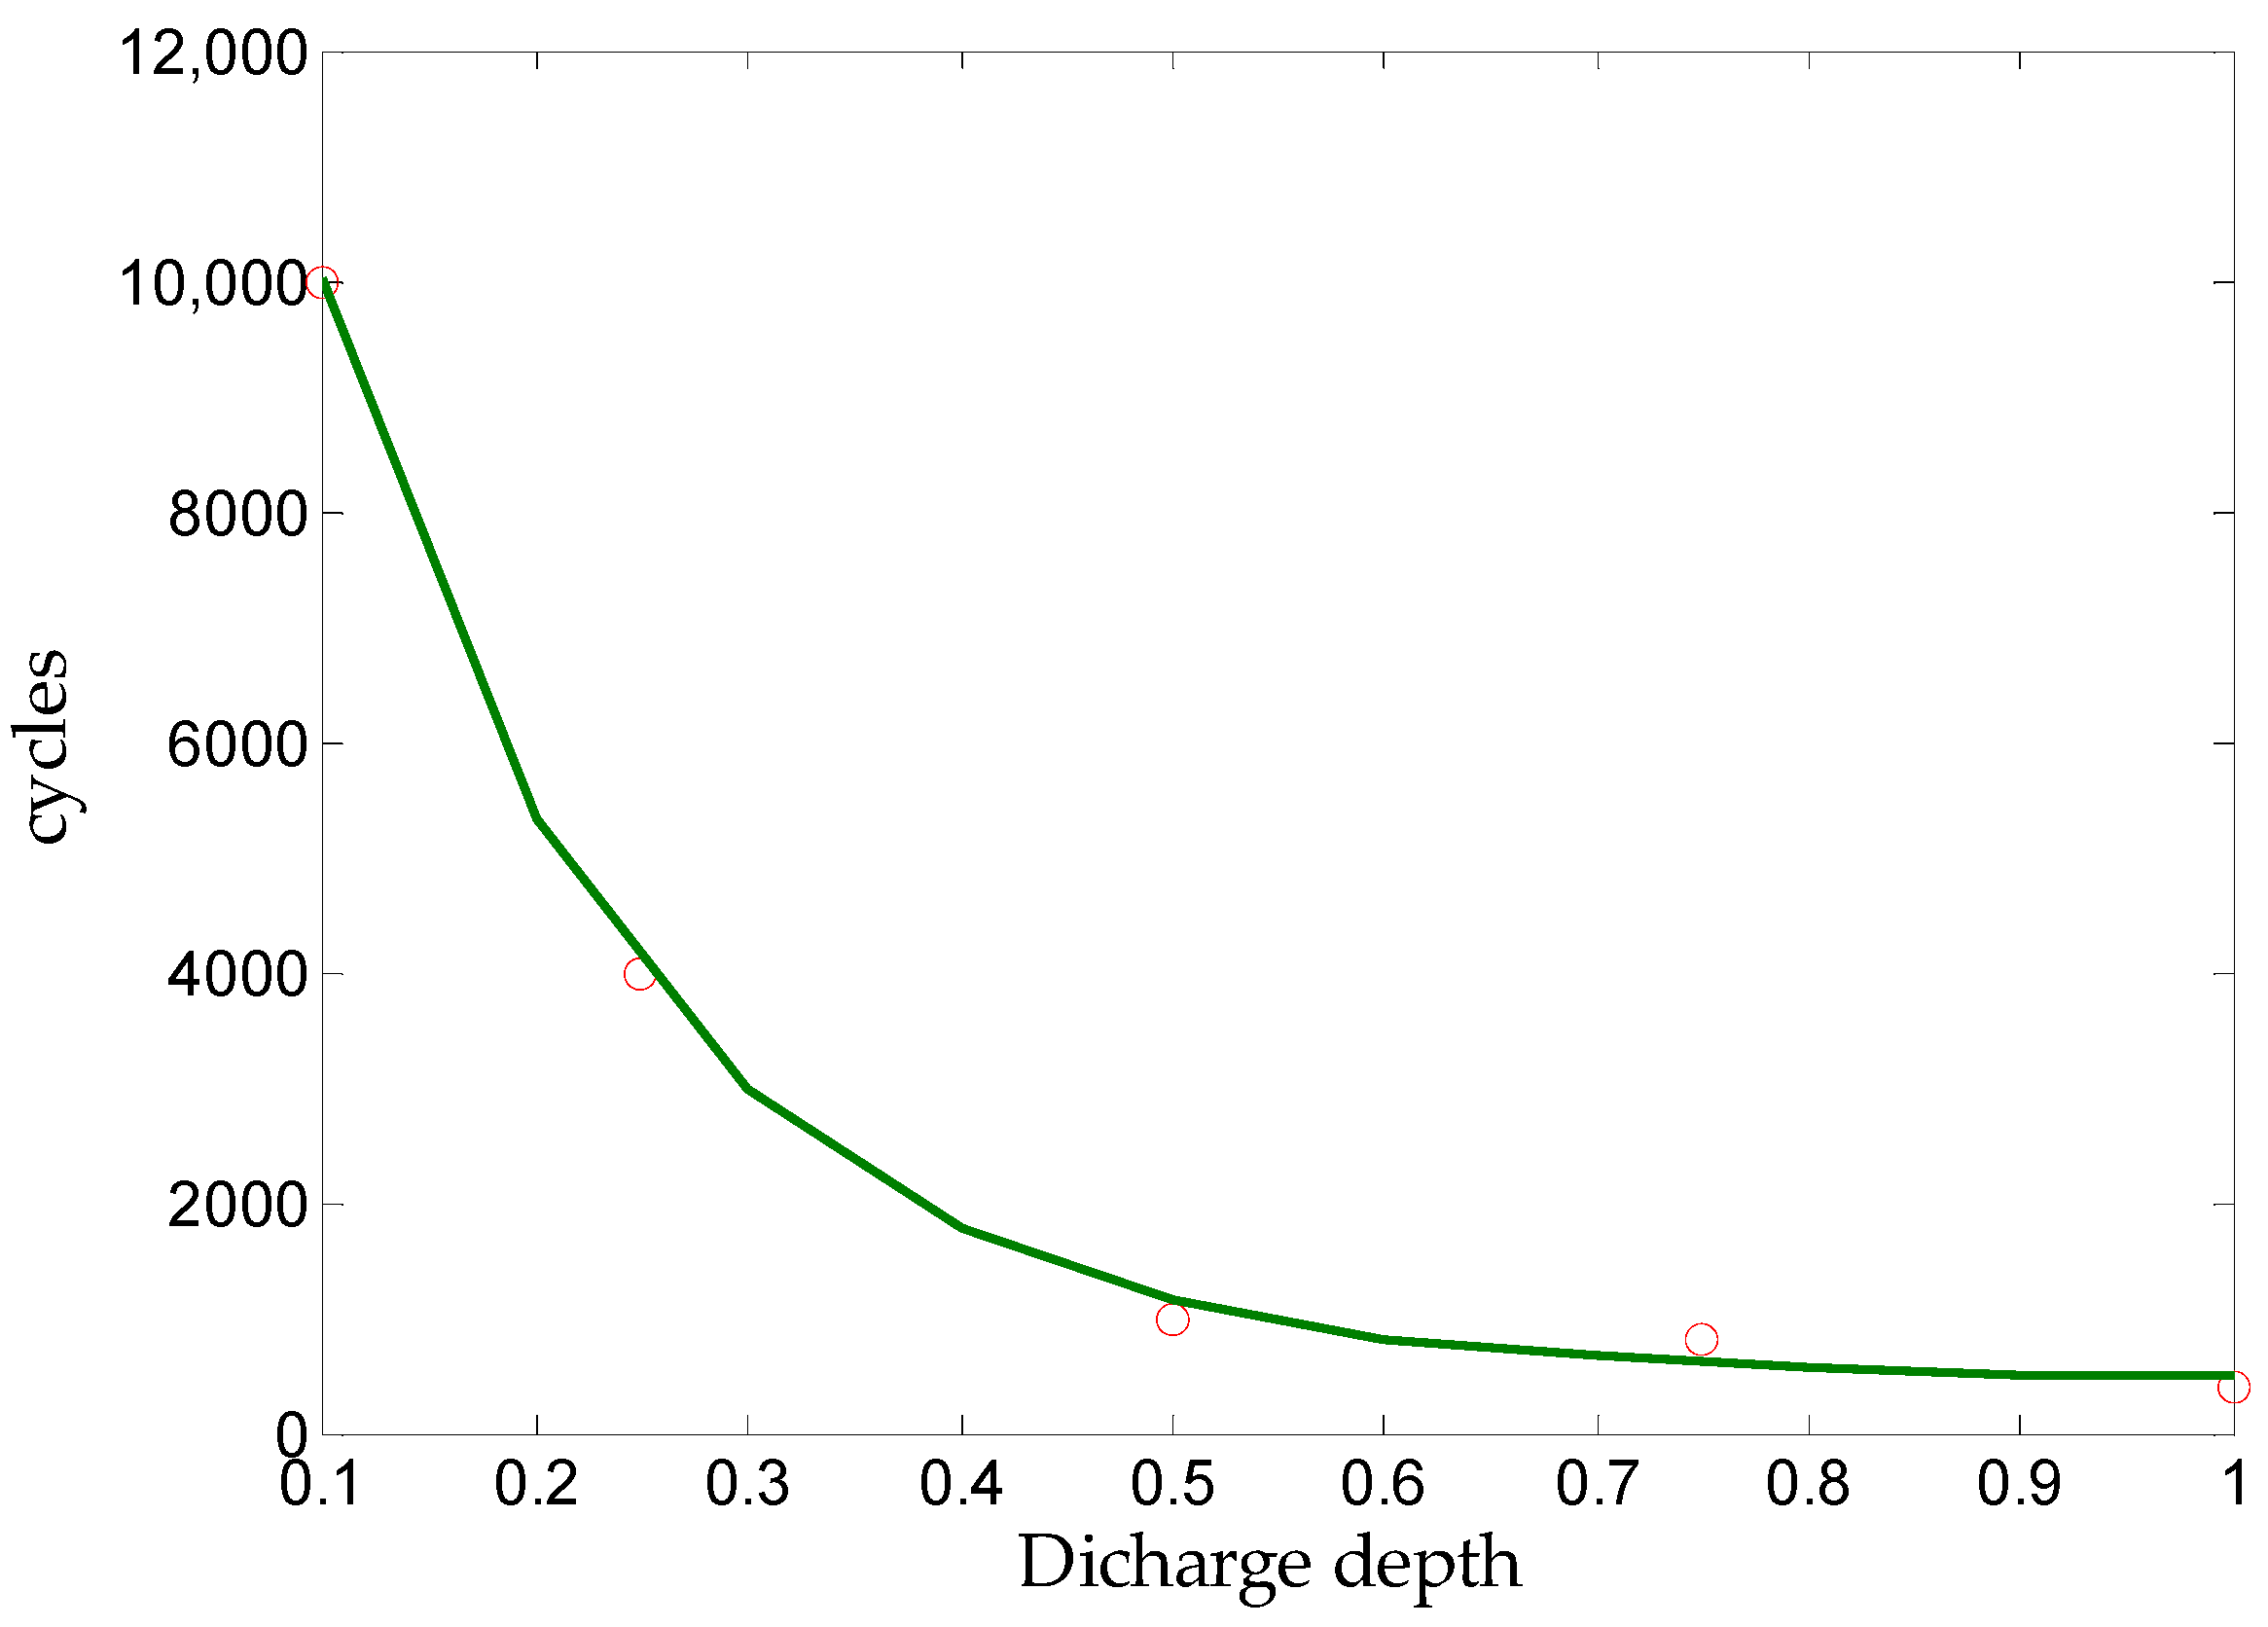
Figure 1. Cumulative installed capacity of the solar energy source from 2010 to 2018: (a) worldwide; (b) in China.
Energies 13 00027 g001
Figure 2. Distribution of solar energy in China ( MJ / m 2 ).
Energies 13 00027 g002
Figure 3. Annual lithium-ion battery observed prices and forecast prices from Blooming New Energy Finance (BNEF).
Energies 13 00027 g003
Figure 4. Five-segment delivery mode for long-distance ultra-high voltage (UHV) transmission ( P d 1 , P d 2 , P d 3 , P d 4 , and P d 5 are the grid-connected power values for the five segments, respectively).
Energies 13 00027 g004
Figure 5. Frame of the energy storage optimization model.
Energies 13 00027 g005
Figure 6. Schematic of the system model illustrating the important components and power flows; the PV-energy storage system is delineated by a dashed line. Positive and negative symbols indicate sign conventions for the active power flows.
Energies 13 00027 g006
Figure 7. Relationship between the number of cycles ( N D ) and discharge depth of the lithium battery (DOD).
Energies 13 00027 g007
Figure 8. Grid-connected schemes on the typical days of the different energy storage capacities. (a) sunny day; (b) cloudy day; (c) rainy day.
Energies 13 00027 g008
Figure 9. Weather ratios in the case study.
Energies 13 00027 g009
Figure 10. Annual abandoned electricity rates of the PV power station with different energy storage capacities.
Energies 13 00027 g010
Figure 11. Net present value (NPV) of the energy storage battery in a full life cycle.
Energies 13 00027 g011
Figure 12. Replacement cycles of the different energy storage capacities.
Energies 13 00027 g012
Table 1. Lithium battery performance.
Discharge Depth0.10.250.50.751
Cycles1000040001000800400
Table 2. Daily abandoned electricity rate without energy storage in the typical weather patterns.
Typical DaysSunny DayCloudy DayRainy Day
Daily Abandoned Electricity Rate/%16.5737.8329.83
Table 3. Attenuation of the energy storage battery and annual abandoned electricity rate.
Operation Time C a / MWh R a / % C a / MWh R a / % C a / MWh R a / % C a / MWh R a / %
1st year122.66513.24107.81155.67
2nd year0.5025.791.3021.412.6717.316.0511.69
3rd year————0.5925.130.8323.611.5120.83
4th year————————0.3726.620.6824.30
5th year————————————0.2926.70
Operation Time C a /MWh R a /% C a /MWh R a /% C a /MWh R a /%
1st year204.46253.86303.42
2nd year10.147.7014.195.9418.964.65
3rd year2.6917.285.7112.019.298.23
4th year0.8423.481.3821.122.2018.72
5th year0.4326.590.6025.130.8323.61
6th year————————0.4326.59

