Abstract
The integration of Distributed Energy Resources (DERs) introduces a non-conventional two-way power flow which cannot be captured well by traditional model-based techniques. This brings an unprecedented challenge in terms of the accurate localization of faults and proper actions of the protection system. In this paper, we propose a data-driven fault localization strategy based on multi-level system regionalization and the quantification of fault detection results in all subsystems/subregions. This strategy relies on the tree segmentation criterion to divide the entire system under study into several subregions, and then combines Support Vector Data Description (SVDD) and Kernel Density Estimation (KDE) to find the confidence level of fault detection in each subregion in terms of their corresponding p-values. By comparing the p-values, one can accurately localize the faults. Experiments demonstrate that the proposed data-driven fault localization can greatly improve the accuracy of fault localization for distribution systems with high DER penetration.
1. Introduction
Fast and accurate fault detection and localization are extremely important. They prevent power system equipments, devices and major components from being damaged due to the high fault current, and reduce the enormous economic loss caused by prolonged power outage during the peak load period [1,2]. Hence, fault detection and localization are crucial for safe operation of distribution systems. However, as more and more Distributed Energy Resources (DERs) are introduced into the grid, the conventional model-based protection schemes suffer from high mal-operation and miss-trip rates [3] due to the more complicated power flow patterns that are highly volatile and cannot be captured by existing models [4,5,6].
Given the new challenges brought by DERs and the limitation of conventional model-based protection schemes, there has been a substantial body of literature exploring advanced operating strategies for fault localization in modern power systems under DER penetration. Generally, according to the review paper [7], existing approaches can be generally divided into several categories, namely impedance-based methods [8,9,10], traveling wave-based methods [11,12,13], and knowledge-based/data-driven methods [14,15,16,17]. The basic rule of impedance-based methods is to use the impedance values as seen from the measurement nodes as the indicator for fault localization. For example, in [10], the authors developed an approach using a new formulation of the impedance-based method to first identify several possible fault location candidates. From those candidates, the exact fault location is then identified by matching the measured voltage at the substation bus and each DER unit bus with the results calculated from the system model. Though the impedance-based method is simple and easy to use, the accuracy is largely determined by the accuracy of the system model such as line parameters, line characteristics and load parameters, which can be compromised due to various factors such as system non-homogeneity, multiple laterals, measurement error in line parameters, inaccurate relay measurements and effects of fault resistance. Therefore, it is inherently not suitable for systems with lots of DERs which are difficult to model accurately due to the high complexity. Traveling wave-based methods use the transmission and reflection of the traveling waves between the line terminal and the fault location to estimate the approximate fault location. However, this method is more suitable for transmission lines instead of distribution systems equipped with multiple laterals [17]. Due to the complexity of distribution systems with DERs that are difficult to deal with using conventional model-based techniques, more and more researchers turn to data-driven approaches that can readily capture various uncertainty factors. For instance, [16] presents a fault localization method using multilayer perceptron (MLP), and others [18] use data-driven methods such as support vector machine (SVM), artificial neural network (ANN) to diagnose and locate faults. However, existing data-driven methods in the literature often entail a large amount of training data obtained under various fault conditions. This may not be available in practical applications since, most of the time, the power system operates under normal conditions. Therefore it is impractical, if not impossible, to find datasets covering all possible types of faults at all possible locations in the system.
These being said, among the many options mentioned above, the data-driven approach is still the most promising to handle the high complexity entailed by the DERs and provide accurate fault diagnosis and fault localization in dynamic systems [19]. Considering that the data available for power systems are those collected under its normal operations, it would be more suitable to apply one-class classifier to detect the fault instead of using other classifiers involved with multi-class datasets. In our recent work [3], we have proposed a data-driven method using the support vector data descriptor (SVDD) to detect faults in power systems that only requires training data collected under normal operations and hence overcomes the limitations of most existing data-driven approaches. As a matter of fact, there has been a substantial body of work successfully applying SVDD for fault detection and isolation in different kinds of systems [20]. For example, very recently, a fault diagnosis method for rolling bearing based on semi-supervised clustering and SVDD is presented in [21]. And in [22], A hybrid method combing model-based diagnosis and SVDD-based anomaly detector is proposed to identify unknown faults and also classify multiple-faults in an internal combustion engine using only single-fault training data. In [23], a method for power electronic circuits fault classification is proposed based on the SVDD classifier.
However, even though in our previous work [3], it has been shown that the proposed method can effectively detect faults in the system, it still cannot accurately localize the fault detected. Intuitively, one may think that fault localization can be achieved by applying fault detectors in all different regions of the system and checking which region reports fault. However, in practice, when a fault takes place, the current and power flow in multiple regions of the system would be simultaneously affected and faults may be reported in more than one regions. The hard decisions (0 or 1) provided by the fault detectors would not be able to provide sufficient information to localize faults in distribution systems. Therefore, in this paper, we continue to study the more challenging problem of how to accurately locate faults after they are detected. Firstly, to address the issue of simultaneous fault detection in multiple regions for a single fault, we develop a more accurate and reliable fault localization framework by resorting to probability density estimation and p-values. With this framework, one can accurately localize the fault with a desirable resolution by appropriately regionalizing the system with different hierarchical topologies and comparing the p-values among them. Secondly, to better regionalize the entire system, we also provide a general criterion for segmentation of distribution systems in this paper.
Specifically, the main contributions of this paper are as follows:
- (1)
- To conduct fault localization based upon fault detection in different subregions, one needs to regionalize the system in an appropriate manner. This paper provides a general criterion for system regionalization based upon the division of the network tree to facilitate the hierarchical search of the fault location.
- (2)
- Rather than hard decisions, we soften them by properly combining SVDD and kernel density estimator (KDE) to obtain quantified confidence levels of decisions, i.e., the p-values. The confidence level will guide one to localize the faulty node with desirable resolution.
- (3)
- Experimental simulations conducted under the IEEE-123 node test feeder show that the data-driven fault localization strategy proposed in this paper significantly outperforms the conventional fault localization methods based upon relay operations.
The remainder of this paper is organized as follows. Section 2 firstly gives an overview of the proposed fault localization strategy, and then introduces the SVDD and KDE which jointly build the foundation for our proposed method. In Section 3, a general system partition criterion and details of the fault localization strategy are given. Experimental comparisons between the proposed data-driven approach and the conventional relay operations are shown in Section 4. Finally, concluding remarks are presented in Section 5.
2. Methodology
In this section, we first illustrate the incompetency of the existing classifier-based approaches for localizing faults in distribution systems with DERs and present the problem formulation of our proposed fault localization strategy. Then, we give a brief introduction of SVDD and KDE, which serve as the foundation of our proposed fault localization algorithm.
2.1. Problem Formulation
In general, a fault taking place on a line or a node will cause the currents in the system rise or drop in a conventional single-supply distribution system [24]. Specifically, overcurrent occurs in the line directly connected to the fault on the near-supply side, while other lines around the fault are affected by the short circuit with suppressed voltage and suppressed current. Due to this property, in conventional relay-based protection schemes, relay operates in response to overcurrents to isolate faults. A typical traditional overcurrent relay depends upon a local current threshold to determine if a fault has occurred. Basically, operation of relays under traditional protection heavily relies on the modeling of the distribution system and the pre-calculation of the normal currents under full load and the currents under various types of faults at different locations [19]. If the system is accurately modeled, usually the multiple relays within the system can coordinate well to trip the line to clear the fault with minimum customers affected.
However, when DERs are integrated into the system, they introduce highly complex bidirectional current flows that cannot be well captured by most traditional modeling techniques. As a result, it is difficult to calculate the normal and faulty current values and coordinate the operation of multiple relays in a system. This first leads to inaccurate fault detection in the system as reported in our previous work [3]. Furthermore, even when faults are correctly detected, the overcurrent relays might still work in an undesirable manner if the faults are not well located, leading to trippings of more lines (i.e., mal-operations) than necessary to clear a fault, hence more customers will be affected by the fault.
The above-mentioned typical traditional relay makes hard decisions (i.e., “no fault” or “with fault”) by comparing the current measurement with the pre-calculated current threshold. This can be viewed as a simple two-class classifier. Actually these classifier based protection schemes all report simple hard decisions of faults withoutgiving any quantified confidence levels of fault occurrence. For example, in our previous work [3], we have applied SVDD to improve the accuracy of fault detection in distribution systems with DERs. Intuitively, the proposed detection method could be applied to many different subregions of a system in order to detect whether a fault occurs in that region or not, or equivalently localize the fault in the subregion. However, the subregions are interconnected and hence a fault might affect the currents and voltages of multiple subregions simultaneously. In this case, multiple subregions would report positive fault detection results for a single fault. As shown in Figure 1, SVDD in each subregion reports to claim whether faults are present in that subregion, where or 1, with denoting the subregion.
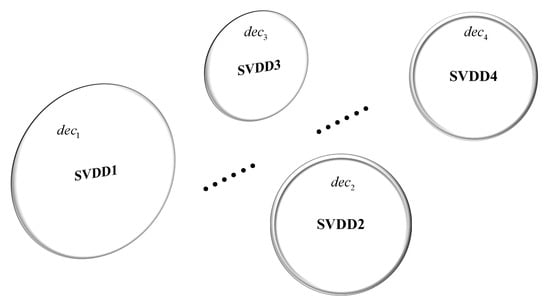
Figure 1.
Fault localization by Support Vector Data Description (SVDD) in each subregion.
Therefore, protection schemes with hard decisions (0 or 1) cannot be well applied to accurately locate the fault. In this paper, instead of the hard decisions reported by SVDD, we further develop a fault localization framework that resorts to the p-value as an indicator of the confidence level of fault detection in each partition of the system, as shown in Figure 2. In this manner, all the SVDD classifiers’ outputs are under the same scale (between 0 and 1) and one can further localize the fault by comparing the p-values. These corresponding p-values are calculated via KDE introduced later in this section. Specifically, as shown in Figure 3, firstly the entire system is divided into N subregions according to the procedure presented in Section 3 and collect the data under normal operations in each subregion. With those data, an SVDD one-class classifier is trained offline for each subregion using the method proposed in [3] with the distribution of the normal data estimated by KDE. Then, during the system operation, the SVDD for each subregion will evaluate the measurement data in its region and produce a fault detection result with a p-value which indicates the confidence level of fault detection. It should be noted that these p-values are all normalized to the same range (from 0 to 1) and hence are comparable. Since it is rare that two faults happen exactly at the same time, the subregion corresponding to the smallest p-value is most likely to be the region where the fault is. Hence by comparing the p-values, we can finally locate the subregion where the fault is located. For example, in Figure 3, if we obtain subregion 2 has the smallest p-value among the p-values reported by the N subregion SVDDs, then we will say the fault locates on the subregion 2.
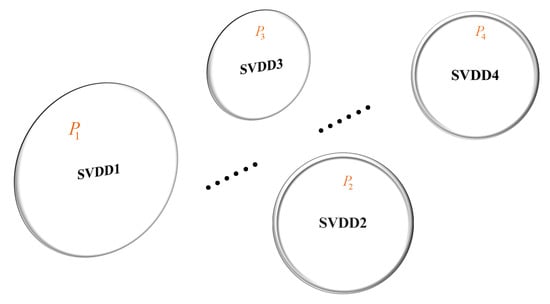
Figure 2.
Fault localization by SVDD in each subregion with confidence level.
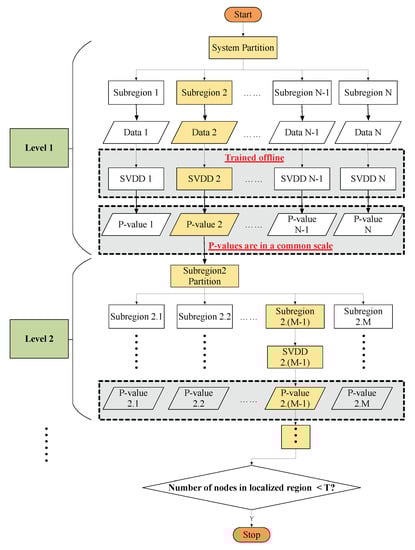
Figure 3.
Overview of the proposed fault localization strategy.
Next, subregion 2 can be further divided into M subregions from 2.1 to 2.M in the same manner. Using SVDD and KDE on these partitions, one can further narrow down the range of the faulty line. One could continue these steps until the fault has been found and the algorithm will not stop until the number of nodes in the localized region are less than a specific threshold T.
It should be noted that the time complexity of the proposed fault localization method is , where is the number of user node in the system. Furthermore, the parameter optimization and training of each SVDD classifier can be conducted offline as shown in [3] and only simple linear operations in the test phase are involved during its online application. Therefore, the complexity is low for the practical application of the proposed fault localization framework.
Before we go to Section 3 for more details, in the following we will first briefly review SVDD and KDE.
2.2. Support Vector Data Description
SVDD is a data-domain description method originally proposed by Tax and Duin [25]. It aims to construct a hyperspherical boundary of a one-class data to discriminate outliers. If the data are outside the boundary of the hypersphere, they will be declared as anomaly while the data inside the boundary will be accepted as normal data. Mathematically, SVDD can be formulated as the following optimization problem:
where R and a represent the radius and center of the hypersphere, respectively. are the given training data and are penalty terms introduced to allow for mismatches in the training process. C is the hyperparameter which controls the tradeoff between the volume and the mismatches. In addition, the hypersphere of SVDD can be made more flexible using kernel methods where the inner product of the mapping functions can be replaced by the kernel function as shown in (2):
The most popular kernel function is the Gaussian kernel
and a testing instance is detected as an outlier if the distance .
In our previous work [3], we have successfully applied SVDD for fault detection in distribution systems with DERs and discussed various issues with training the SVDD such as hyper-parameter optimization. However, SVDD can only provide outputs in the form of hard decisions and is unable to provide the confidence level of the decisions. In order to provide information on how far a testing data is from the normal case, or equivalently the probability of fault occurrence with a given measurement data, the idea is to first find the distribution of the distance d under normal operations as indicated by the training data. Then, the p-value of a given new data could be a good indicator of the confidence level of the fault. Next, we will introduce KDE to estimate the probability density function of the distance d.
2.3. Kernel Density Estimation
KDE is a non-parametric method to estimate the probability density function of a random variable. Additionally, it is a fundamental data smoothing technique to obtain the probability distribution function (pdf) using finite observation samples. The general form of KDE is considered to be proposed by Emanuel Parzen and Murray Rosenblatt, known as the Parzen-Rosenblatt window method [26]:
where are the univariate independent and identically distributed samples drawn from a distribution with unknown density f. is the estimated density function with kernel function K and a smoothing parameter h called the bandwidth.
While there are many options for the kernel functions, the performance of KDE is shown to be largely dependent on the choice of the kernel bandwidth [27,28,29]. The most popular data-driven bandwidth selection technique is the plug-in method [30,31] based on some priori assumptions about the unknown distribution of the data, this method seeks to minimize the asymptotic mean integrated square error (AMISE) of a density estimator . In the case of a univariate random variable with Gaussian kernel, the optimal bandwidth for normally distributed data is , where is the standard deviation of x and n is the sample size. However, these kernel density estimators are in lack of local adaptivity and hence very sensitive to outliers, which introduce the presence of spurious bumps and lead to an overall unsatisfactory bias performance. Moreover, the most popular plug-in method requires a preliminary normal model for the data, contradicting to the original motivation for applying a nonparametric method. To this end, Botev et al. [32] proposed a method named KDE via diffusion as a comprehensive solution to overcome the drawbacks of the kernel density approach mentioned above. Therefore, in this paper, we adopt KDE via diffusion to estimate the probability densities of the distance during the training process of our SVDD procedure discussed in Section 2.2 and then determine the fault confidence level of each subregion in the distribution system. Detailed proof and analyses of the method of KDE via diffusion can be found in [32].
3. The Data-Driven Fault Localization Strategy
In this section, we first present the general criterion for the partition of distribution systems. Under this criterion, we will show details of the proposed data-driven fault localization strategy based upon SVDD and KDE.
3.1. Criterion for Distribution Systems Partition
As stated in Section 2.1, we intend to develop a fault localization framework based upon the quantified confidence levels of fault detection in subregions of the system. With these quantified outputs, one can find the exact fault location by gradually narrowing down the fault area. However, in general, there is no clear system partitioning for a distribution system. Therefore, in this paper, we introduce a general graph-based partitioning criterion for medium and low-voltage distribution systems based upon the system topology. This partitioning criterion characterizes the size (number of users and power equipment in the distribution system) of different regions between the superior and subordinate levels of a partition. The region of higher levels contain the users in the region of lower levels of the hierarchy. In this way, we eventually can obtain the fault location in the partition among the lowest levels of the hierarchy.
Detailed partitioning criterion is described as follows:
- (1)
- Represent a distribution system in terms of a tree graph, denoted as , with L denoting the collection of user nodes , and E representing the set of directed edges in the rooted tree . Identify and classify the branches into three categories: three-phase branches, two-phase branches and single-phase branches.
- (2)
- In general, for a typical radial distribution system, there is usually a clear three-phase trunk wiring. Starting from the root node R in rooted tree G, select one of the paths consisting of three-phase nodes as the trunk of the entire system and go to step (3); If there is no trunk in the rooted tree G, go to step (5).
- (3)
- Along the selected trunk of the system, if an internal node in the trunk, , has at least two children nodes, set the internal node as root node of the subtree , and its subordinate nodes belong to subregion , where k is the index of the subtree/subregion.
- (4)
- In each subtree/subregion, continue to repeat step (2) and find following subtrees/subregions at the lower level of the hierarchy.
- (5)
- In subtree without a trunk, if all subordinate nodes have a degree (except leaf node), partition all nodes into two halves; If not, starting from the root node , continue to repeat the partitioning procedure in the descendant node of until the number of descendant nodes in the lower level subregion is smaller than a predefined lower bound which is set according to the minimum protection area for this system.
A partitioning example is shown in Figure 4. In this case, four subregions plus a three-phase line trunk are obtained. In subregion , according to the partitioning rule, we continue the partition and finally obtain the corresponding single-phase/two-phase lines and a three-phase line as the trunk of this subregion. If there is no three-phase branch in the subregion, such as in partition , the final subregions are obtained by gradually partitioning the rooted tree with root node .
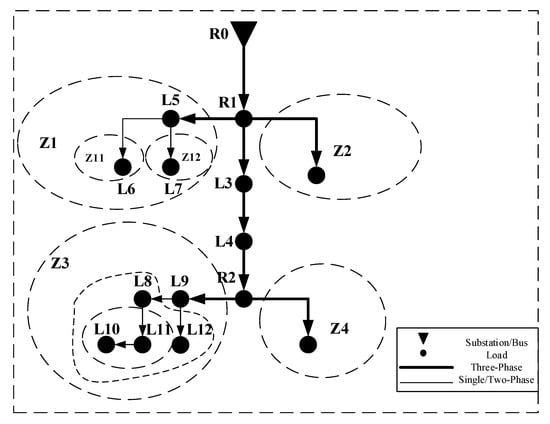
Figure 4.
One example of partition of distribution system.
3.2. The Details of the Proposed Data-Driven Strategy
With the proposed partition criterion for the distribution system, one can divide the system into several subregions and apply SVDD in each region for fault detection. When a single fault occurs in the system, due to the interconnection among regions, several different regions might claim fault detected at the same time. Therefore, it is imperative to quantify the confidence level of the fault detection report in each region. By comparing the normalized confidence level of fault reports, one could clearly know and localize the fault step by step and finally figure out the faulty line. To this end, we develop the fault localization framework by resorting to probability density estimation and p-values. The overview flowchart of the proposed fault localization strategy is shown in Figure 3 and the details of the proposed data-driven fault probability quantization model is presented in Figure 5 and explained in the following.
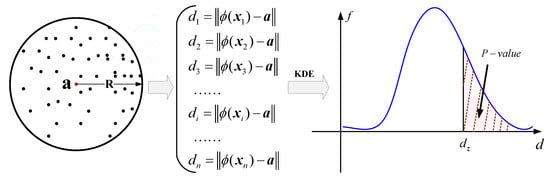
Figure 5.
Evaluation of the confidence level of fault detection results.
After training by the given training data , SVDD obtains a hypersphere and a group of one-dimensional distance data () which captures the distance from the corresponding support vectors and non-support vectors to the center of constructed hypersphere . Then the probability density function of the distances of the training data can be obtained from the KDE estimation. As a result, for any given system operating condition, one can compute the exact distance from the data under this condition to the center of the SVDD hypersphere by and provide a quantified confidence level of fault detection in this region by calculating the p-value using the estimated probability density function, i.e.,
In this manner, each testing data can be quantified by a p-value which captures the confident level of the fault detection report. A testing data with larger p-value is more likely to be the normal one and the data with smaller p-value is with higher confidence to declare a fault. Next, we will conduct experiments to illustrate how to apply our proposed framework to fault localization in a given distribution system with DERs and validate the feasibility and advantage of the proposed date-driven fault localization strategy.
4. Simulations
In this section, we show the performances of fault localization under the IEEE-123 node test feeder [33]. By comparing the traditional relay operation based approach and the proposed data-driven fault localization approach, we verify the effectiveness and the superiority of the proposed method. The simulation setup and data organization are briefly described as follows.
4.1. Simulation Setup and Data Organization
In this section, we use the Gridlab-D platform [34] to generate the system data and follow the same data generation setting as our previous work [3], except that the DER penetration level is set as high as , which means that the total DER capacity is equal to of all loads in the system. The outputs of DERs are uniformly distributed from 80% to 120% of the pre-defined generation level. Samples of outputs of DERs are i.i.d. and the location of DER are randomly generated and shown in Figure 6.
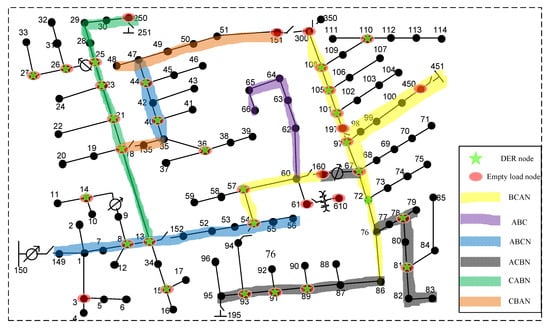
Figure 6.
IEEE-123 node test feeder with Distributed Energy Resources (DERs).
With these simulation setups, we use Gridlab-D to simulate a distribution system, 123-node test feeder, and then collect n measurements including voltage, current, apparent power, active power, and reactive power. Stacking up all these n power measurements in the corresponding subregion, we obtain the training data samples, whose structure is shown in Figure 7. In our work [3], the data of entire system has dimensions. In this paper, since the fault localization is conducted in a hierarchical manner and the size of the subregion decreases as one goes to another level, the dimensionality of the data decreases exponentially with the level number.
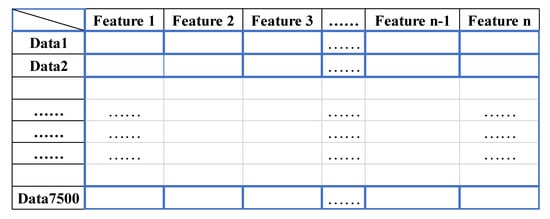
Figure 7.
Data structure.
Under the 123-node test feeder, 7500 normal data for training and 2500 normal data for testing are generated. In addition, to test the fault localization performance, fault data are generated, which include 2500 data samples for each of 115 types of faults. Notice that these fault data are only used for testing and are not used in the training process. Every data samples, as a standard practice, are normalized into per-unit values.
Base upon this simulation setup, in the following of this paper, we first show the performance of the traditional relay operation based scheme in Section 4.2, and then present the performance of our proposed data-driven strategy in Section 4.3.
4.2. Fault Localization via Traditional Relay Operations
This subsection shows the performance of the traditional relay operation based method for fault localization in IEEE-123 node test feeder with DERs and with no DERs. In terms of traditional relay operation scheme, we assume that each line in the system is equipped with an overcurrent relay and the relay trips when the currents is 1.5 times larger than the full-load current [35]. Figure 8 and Figure 9 show the performance of the traditional protection scheme for systems with DERs when a fault takes place on line 42–43.
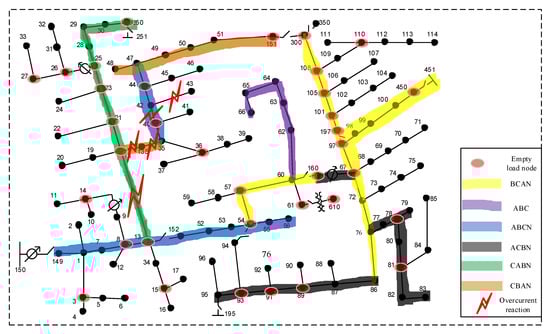
Figure 8.
Fault localization by conventional relay in system without DERs.
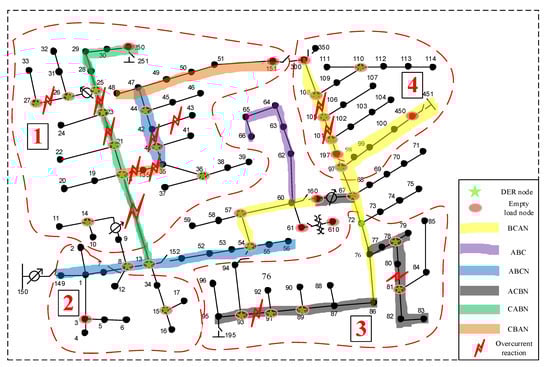
Figure 9.
Fault localization by conventional relay in system with DERs.
Figure 8 shows the case with no DER penetration in the distribution system. When a fault occurs on lines 42–43, the current on this line increases dramatically and its overcurrent relay trips. Meanwhile, the lines near the power substation providing current for lines 42–43 also experience current surges. Such overcurrent could lead to mal-operations of the relays if they are not properly coordinated. It can be clearly seen that there are 4 relay mal-operations when fault occurs on lines 42–43, even in the absence of DER penetration. By contrast, Figure 9 shows the case with DERs integrated in the distribution system. When DERs are introduced, they bring dynamic responses and non-traditional two-way power flow pattern into the power system. As a result, the overcurrent reactions will not only occur in the line near the fault, but also could take place in some other places of the system. As shown in the figure, there are 12 overcurrent reactions when a fault occurs on lines 42–43 with 50% DER penetration in system. By the relay protection coordination method in power system [35,36], the overcurrent will trigger relay coordination to eliminate the fault. Such relay protection method is usually with multiple hierarchies: if the main protection fails to clear the fault, the first or second stage backup protection will be initiated to isolate the fault. Even though the faults can be cleared eventually in this manner, there will be multiple relay mal-operations, and the reliability of the entire system is compromised. Furthermore, it is worth mentioning that even for some places where no relay trips, they are still greatly affected by the fault. It is because some line voltages are greatly suppressed due to the fault, which causes the currents to be significantly reduced accordingly.
Clearly, the conventional relay operation based scheme fails to accurately localize faults, especially for systems integrated with DERs. Specifically, for our system with DER penetration, some representative operations of overcurrent relays under traditional protection scheme are summarized in Table 1 when faults occur at different locations. In summary, it can be verified that the traditional protection scheme might involve more lines than necessary as we commented in Section 2.1. In other words, the traditional overcurrent relays cannot obtain a good resolution for fault localization.

Table 1.
Results of fault localization (traditional protection scheme).
4.3. Fault Localization via the Proposed Data-Driven Strategy
This subsection shows the performance of the proposed method for fault localization in the IEEE-123 node test feeder with 50% DER penetrations. Firstly, based upon the criterion given in Section 3.1, we use the three-phase line as the trunk of the distribution system and roughly divide the IEEE 123-node test feeder into 5 subregions, i.e., subregion 1 to subregion 4 and a trunk subregion (the trunk is the region that contains all nodes that are not included by subregions 1–4), as shown in Figure 9. Next, we apply the proposed data-driven fault localization strategy to localize the fault in the system. As shown in Figure 3, we train SVDD for each subregion offline by the data collected under normal system operations without faults. Here we apply the same method as proposed in [3] to optimize the hyper-parameters for SVDD. And then for each testing data, we perform the proposed fault confidence level quantification, shown in Figure 5, in each of the five subregions of the system and obtain their corresponding p-values. By comparing the p-values of all subregions, it can be found that the p-value of the subregion where the fault occurs is generally much smaller than the p-value of other subregions (the magnitude differs by more than ). The smaller the p-value, the greater the confidence that the fault takes place in that subregion. Some exemplary results are shown in Table 2.
Table 2.
Results of fault localization (our proposed data-driven model).
From the table, we can see that there could be cases where the p-values in several subregions are small. For example, as shown in Table 2, when a fault happens on lines 42–44, the p-value of the trunk subregion of the system is of the same order of magnitude as the p-value of subregion 1 (both at the scale of ). This case requires logical reasoning to determine the fault location: if the fault occurs in the trunk subregion, subregions 2, 3, and 4 should also see a current increase and be affected to produce a small p-value, such as when fault occurs on lines 53–54. However, it is not the case for the data shown in the column. Therefore, one could conclude that the fault actually takes place in subregion 1 instead of the trunk. Likewise, fault in lines 81–82, 105–106 can also be localized in the correct subregion.
Once the system partition is determined, then the fault line is gradually localized by further partitioning of the subsystems, as shown in Figure 3. For instance, if the fault occurs on the 42–43 lines, after determining that the fault occurs in subregion 1, one can quickly localize the fault by further stepwise partitioning. As shown in Figure 10, subregion 1 is divided into several subregions in the lower level of hierarchy, namely subregions 1.1, 1.2 and the trunk subregion of the subregion 1 after initial judgement. Following a similar rationale, one could determine that the fault occurs in the subregion 1.2 by logical reasoning and p-value comparisons. In this manner, the faulty region is gradually narrowed down and the fault is finally localized on the lines 42–43. The detailed full fault localization procedure is shown in Table 3 and Table 4.
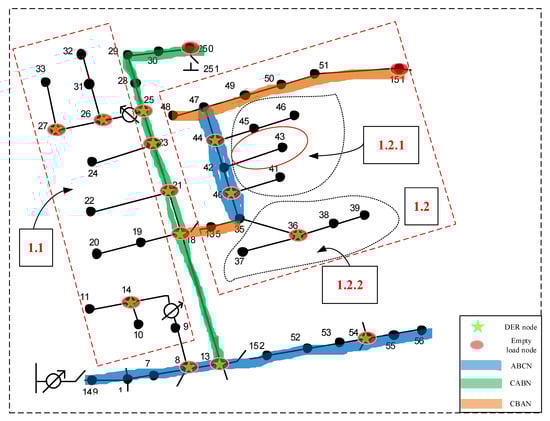
Figure 10.
Fault localization in subregion of the system with DERs.
Table 3.
Results of fault localization.
Table 4.
Results of fault localization.
To evaluate the overall performance of our proposed method, we have conducted more than 10,000 tests on the cases where a single fault randomly occurs at a line in the system and applied our proposed procedure to localize the fault. Results demonstrate consistently good performance in terms of fault localization with the overall accuracy of . Figure 11 shows the histogram of localization accuracy corresponding to different fault patterns. We can see that most fault patterns can be localized correctly with the desired accuracy, and only 2 to 3 fault patterns have relatively lower localization accuracy (less than ) by our method. Even in this case, our proposed method still can help system operators to narrow down the susceptible fault subregions by providing the corresponding fault confidence level.
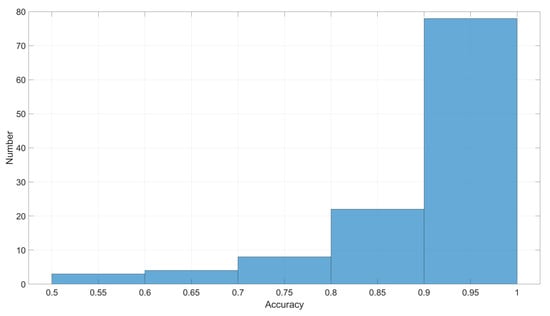
Figure 11.
Histogram of localization accuracy.
In summary, the proposed data-driven model based on the fault confidence levels of system partition can overcome the challenges faced by the traditional protection scheme brought by DERs and help the system operator to rapidly localize the fault and effectively clear the fault without unnecessary trippings.
5. Conclusions
In this paper, a novel data-driven fault localization strategy based on the quantified confidence levels of fault in subregions of distribution systems with DERs has been proposed. Specifically, after the fault detection by the SVDD classifier in each partition of the system, we converted the distance decision value of SVDD in each subregion of the distribution system into p-value through KDE, in order to measure the confidence level of fault detection and henceforth facilitate the fault localization. In order to apply the proposed strategy, one can divide the distribution system into several subsystems using the general criterion presented in this paper. Compared with the traditional relay operation based approach, the proposed data-driven fault localization is able to accurately locate the fault even for systems integrated with DERs. The proposed method is tested under the IEEE-123 node test feeder with 50% DER penetration. The experiment results show that the proposed fault localization strategy can narrow down the suspected fault range and ultimately localize the fault on a specific line successfully.
Author Contributions
Conceptualization, X.C., L.Y. and S.C.; methodology, Z.L. and D.D.; software, Z.L.; validation, Z.L.; formal analysis, Z.L. and D.D.; investigation, Q.Y., X.H., and X.C.; resources, Q.Y., X.H. and S.C.; writing—original draft preparation, Z.L.; writing—review and editing, D.D., Q.Y., X.H., X.C., L.Y. and S.C.; supervision, D.D., Q.Y. and X.H.; project administration, L.Y. and S.C.; funding acquisition, S.C. All authors have read and agreed to the published version of the manuscript.
Funding
This work was supported in part by Shenzhen Fundamental Research Fund under Grant No. JCYJ20170411102217994 and Guangdong province under grant No. 2017ZT07X152.
Conflicts of Interest
The authors declare no conflict of interest. The funders had no role in the design of the study; in the collection, analyses, or interpretation of data; in the writing of the manuscript, or in the decision to publish the results.
References
- Saha, M.M.; Izykowski, J.J.; Rosolowski, E. Fault Location on Power Networks; Springer Science & Business Media: Berlin/Heidelberg, Germany, 2009. [Google Scholar]
- Minniti, S.; Haque, N.; Nguyen, P.; Pemen, G. Local markets for flexibility trading: Key stages and enablers. Energies 2018, 11, 3074. [Google Scholar] [CrossRef]
- Lin, Z.; Duan, D.; Yang, Q.; Cheng, X.; Yang, L.; Cui, S. One-Class Classifier Based Fault Detection in Distribution Systems with Distributed Energy Resources. In Proceedings of the 2018 IEEE Global Conference on Signal and Information Processing (GlobalSIP), Anaheim, CA, USA, 26–29 November 2018; pp. 932–936. [Google Scholar]
- Häger, M.; Sollerkvist, F.; Bollen, M. The impact of distributed energy resources on distribution-system protection. In Proceedings of the Nordic Distribution and Asset Management Conference (Nordac), Stockholm, Sweden, 20–21 August 2006. [Google Scholar]
- Jiang, Z.; Sahasrabudhe, V.; Mohamed, A.; Grebel, H.; Rojas-Cessa, R. Greedy Algorithm for Minimizing the Cost of Routing Power on a Digital Microgrid. Energies 2019, 12, 3076. [Google Scholar] [CrossRef]
- Bollen, M.; Rönnberg, S. Hosting capacity of the power grid for renewable electricity production and new large consumption equipment. Energies 2017, 10, 1325. [Google Scholar] [CrossRef]
- Shafiullah, M.; Abido, M.A. A review on distribution grid fault location techniques. Electr. Power Compon. Syst. 2017, 45, 807–824. [Google Scholar] [CrossRef]
- Bretas, A.S.; Salim, R.H. A new fault location technique for distribution feeders with distributed generation. WSEAS Trans. Power Syst. 2006, 1, 894. [Google Scholar]
- Brahma, S.M. Fault location in power distribution system with penetration of distributed generation. IEEE Trans. Power Deliv. 2011, 26, 1545–1553. [Google Scholar] [CrossRef]
- Alwash, S.F.; Ramachandaramurthy, V.K.; Mithulananthan, N. Fault-location scheme for power distribution system with distributed generation. IEEE Trans. Power Deliv. 2015, 30, 1187–1195. [Google Scholar] [CrossRef]
- Mao, Z.T.Y. A fault location and realization method for overhead high voltage power transmission. Procedia Eng. 2011, 15, 964–968. [Google Scholar]
- Lin, S.; He, Z.; Li, X.; Qian, Q. Travelling wave time–frequency characteristic-based fault location method for transmission lines. IET Gener. Transm. Distrib. 2012, 6, 764–772. [Google Scholar] [CrossRef]
- Ding, J.; Li, L.; Zheng, Y.; Zhao, C.; Chen, H.; Wang, X. Distributed travelling-wave-based fault location without time synchronisation and wave velocity error. IET Gener. Transm. Distrib. 2017, 11, 2085–2093. [Google Scholar] [CrossRef]
- Majidi, M.; Etezadi-Amoli, M. A new fault location technique in smart distribution networks using synchronized/nonsynchronized measurements. IEEE Trans. Power Deliv. 2017, 33, 1358–1368. [Google Scholar] [CrossRef]
- Al-shaher, M.A.; Sabry, M.M.; Saleh, A.S. Fault location in multi-ring distribution network using artificial neural network. Electr. Power Syst. Res. 2003, 64, 87–92. [Google Scholar] [CrossRef]
- Javadian, S.; Nasrabadi, A.; Haghifam, M.R.; Rezvantalab, J. Determining fault’s type and accurate location in distribution systems with DG using MLP neural networks. In Proceedings of the 2009 International Conference on Clean Electrical Power, Capri, Italy, 9–11 June 2009; pp. 284–289. [Google Scholar]
- Gururajapathy, S.; Mokhlis, H.; Illias, H. Fault location and detection techniques in power distribution systems with distributed generation: A review. Renew. Sustain. Energy Rev. 2017, 74, 949–958. [Google Scholar] [CrossRef]
- Gururajapathy, S.S. Fault Location in Distribution Systems Using Mathematical Analysis and Support Vector Machine. Ph.D. Thesis, University of Malaya, Kuala Lumpur, Malaysia, 2017. [Google Scholar]
- Zheng, X.; Geng, X.; Xie, L.; Duan, D.; Yang, L.; Cui, S. A svm-based setting of protection relays in distribution systems. In Proceedings of the 2018 IEEE Texas Power and Energy Conference (TPEC), College Station, TX, USA, 8–9 Feburary 2018; pp. 1–6. [Google Scholar]
- Khan, S.S.; Madden, M.G. One-class classification: Taxonomy of study and review of techniques. Knowl. Eng. Rev. 2014, 29, 345–374. [Google Scholar] [CrossRef]
- Tan, J.; Fu, W.; Wang, K.; Xue, X.; Hu, W.; Shan, Y. Fault diagnosis for rolling bearing based on semi-supervised clustering and support vector data description with adaptive parameter optimization and improved decision strategy. Appl. Sci. 2019, 9, 1676. [Google Scholar] [CrossRef]
- Jung, D.; Ng, K.Y.; Frisk, E.; Krysander, M. Combining model-based diagnosis and data-driven anomaly classifiers for fault isolation. Control Eng. Pract. 2018, 80, 146–156. [Google Scholar] [CrossRef]
- Cui, J. Faults classification of power electronic circuits based on a support vector data description method. Metrol. Meas. Syst. 2015, 22, 205–220. [Google Scholar] [CrossRef]
- Castelo de Oliveira, T.E.; Bollen, M.; Ribeiro, P.F.; de Carvalho, P.; Zambroni, A.C.; Bonatto, B.D. The concept of dynamic hosting capacity for distributed energy resources: Analytics and practical considerations. Energies 2019, 12, 2576. [Google Scholar] [CrossRef]
- Tax, D.M.; Duin, R.P. Support vector data description. Mach. Learn. 2004, 54, 45–66. [Google Scholar] [CrossRef]
- Parzen, E. On estimation of a probability density function and mode. Ann. Math. Stat. 1962, 33, 1065–1076. [Google Scholar] [CrossRef]
- Scott, D.W. On optimal and data-based histograms. Biometrika 1979, 66, 605–610. [Google Scholar] [CrossRef]
- Li, Q.; Racine, J.S. Nonparametric Econometrics: Theory and Practice; Princeton University Press: Princeton, NJ, USA, 2007. [Google Scholar]
- Silverman, B.W. Density Estimation for Statistics and Data Analysis; Routledge: Abingdon, UK, 2018. [Google Scholar]
- Jones, C.; Marron, J.S.; Sheather, S.J. Progress in data-based bandwidth selection for kernel density estimation. Comput. Stat. 1996, 11, 337–381. [Google Scholar]
- Sheather, S.J.; Jones, M.C. A reliable data-based bandwidth selection method for kernel density estimation. J. R. Stat. Soc. Ser. B 1991, 53, 683–690. [Google Scholar] [CrossRef]
- Botev, Z.I.; Grotowski, J.F.; Kroese, D.P. Kernel density estimation via diffusion. Ann. Stat. 2010, 38, 2916–2957. [Google Scholar] [CrossRef]
- Kersting, W.H. Radial distribution test feeders. In Proceedings of the 2001 IEEE Power Engineering Society Winter Meeting, Columbus, OH, USA, 28 January–1 February 2001; Volume 2, pp. 908–912. [Google Scholar]
- Chassin, D.P.; Schneider, K.; Gerkensmeyer, C. GridLAB-D: An open-source power systems modeling and simulation environment. In Proceedings of the 2008 IEEE/PES Transmission and Distribution Conference and Exposition, Chicago, IL, USA, 21–24 April 2008; pp. 1–5. [Google Scholar]
- Blackburn, J.L.; Domin, T.J. Protective Relaying: Principles and Applications; CRC Press: Boca Raton, FL, USA, 2014. [Google Scholar]
- So, C.; Li, K. Time coordination method for power system protection by evolutionary algorithm. IEEE Trans. Ind. Appl. 2000, 36, 1235–1240. [Google Scholar] [CrossRef]


© 2020 by the authors. Licensee MDPI, Basel, Switzerland. This article is an open access article distributed under the terms and conditions of the Creative Commons Attribution (CC BY) license (http://creativecommons.org/licenses/by/4.0/).