Abstract
One of the main tasks of the Power System Operators is to ensure a proper, safe, and trouble-free operation and development of power grids. Growth of power system is inseparably linked to a connection of both renewable and classical new energy sources. For network operators and potential investors, it is essential to know the place and volume of generation capacity that can be connected to the grid. A publication of such data is currently a legal obligation for many operators. This paper proposes a method of determining the bus connection capacity in power grid of any type with the use of black-box optimization. Calculations and analyses were performed with a full, nonlinear model of the analyzed network. Obtained results show the effectiveness of this method for both single and multiple nodes in any configuration. All the constraints relevant for the proper and safe system operation, such as bus voltages, line loads, and short-circuit currents, both in a steady-state and (n-1) contingency states, are taken into consideration. Calculations confirmed the good convergence and repeatability of the method for all three tested computational algorithms. This has also confirmed the possibility of use of open source software to extend the functionality of Siemens PSS®E commercial power system calculation software.
1. Introduction
One of the most important factors taken into account in the network development forecast is knowledge of the network bus connection capacity. This information is essential to any Power System Operator (PSO) and a potential investor in order to identify the development and investment opportunities in new power sources.
The bus connection capacity can be defined as the maximum active power of generating units which can be connected to a single node or to a selected group of nodes without deteriorating the existing status of the power grid. Knowledge of these data allows PSO to determine the development opportunities in the network and to identify weak elements requiring an upgrading.
The literature lacks descriptions of methods allowing PSOs to determine, in a simple and quick way, the bus connection capacity for the selected nodes of the operated network, without the necessity of laborious creating of auxiliary computational models. The problem of determining the bus connection capacity is resolved indirectly in many publications but is not the main objective of the articles. In most cases authors use optimization methods with calculations based on deterministic models. Network models used in calculations have to be, however, each time created anew, mostly by transformation or reduction of existing power network models used in power flow calculations.
Most of the papers that have been published so far, however, has been focused on the aspects that are not very useful for PSOs in the day-to-day operation of the power grid. Some authors focus on economic aspects of capacities to be connected, useful for short- and long-term planning.
Afful-Dadzie et al. [1] present a multi-period stochastic optimization model for studying long-term power generation capacity planning in developing countries. The problem is modeled using a stochastic mixed-integer linear programming technique under demand uncertainty. Wogrin et al. [2] apply multi-year bi-level equilibrium model to analyse the generation capacity expansion problem in a liberalized framework. The model is based on a market equilibrium equation with constraints, which are transformed into a mixed-integer linear program and solved using diagonalization in order to maintain the market equilibrium condition. Hesamzadeh and Yazdani [3] propose a mathematical model for transmission planning in an environment where there is imperfect competition in the electricity supply industry. The model is developed based on the concept of the leader-followers game in applied mathematics. Tohidi et al. [4] apply mathematical models for progressive transmission expansion planning including new generation resources. The paper study both the proactive coordination modeled as a mixed-integer bi-level linear program (MIBLP) and the reactive coordination, which is modeled as a mixed-integer linear program (MILP).
The authors use simplified linear system models in the above articles. These models, although useful for forecasting and making strategic decisions, do not fully reflect all important phenomena in actual power systems.
Other papers analyze bus connection capacity referring to generation technology. These methods provide an opportunity to identify and select technologies that maximize profits of potential investors.
Centeno et al. [5] deal with the case of generation company, which need to to choose between a number of alternative technologies. The main outcome of the paper consist in the two stage market simulation model using a conjectured-price-variation approach. In the first step the net present value is maximized assuming that the company is in an incumbent position and knows the new capacity that will be built by the others. Pisciella et al. [6] present a multi-stage stochastic optimization model for the generation capacity expansion problem of a price-taker power producer. The objective function represents a trade-off between expected profit and risk in the presented model. Chen et al. [7] present a copula-based fuzzy chance-constrained programming model and applied it to electric power generation systems planning under multiple uncertainties.
Few publications focus on economic issues related to determining the bus connection capacity in the power grid while providing an optimal mix of connected sources. Mokgonyana et al. [8] propose a planning approach, which maximizes profits of distribution companies. The model is used to define both optimal location and capacity for renewable energy sources including both self-producers and grid exporters.
This approach is characteristic for planning and defining of the energy mix, it is not very useful, however, from a practical point of view of PSOs, who are obliged to show the connection capacities regardless of the power source technology.
Determining the bus connection capacity in relation to accommodation of renewable and distributed energy sources in existing transmission and distribution networks is gaining weight in recent years, due to the high degree of penetration of such sources.
Theo et al. [9] present a review of distributed generation system planning and optimization techniques. Numerical and mathematical modeling optimization methods are reviewed, analyzed and criticized with recommendations for their improvements. Mohtashami et al. [10] focus on a multi-year planning of distribution networks with large share of distributed, renewable sources. The optimization model considers both investment in traditional network technologies and smart grid solutions including dynamic line rating, active network management, quadrature-booster transformers. This optimization considers also adjustment of the set points for various network devices, the curtailment of distributed generation output taking into account take into account different network access options (firm or non-firm contracts).
Due to the specifics of the location of renewable sources in distributed generation networks, methods used in these cases are limited to radial networks.
Koutroumpezis and Safigianni [11] propose a method to determine the optimum allocation of the maximum distributed generation penetration in medium voltage power distribution networks. Technical constraints, such as thermal rating, transformer capacity, voltage profile, and short-circuit level, are considered. Papaioannou and Purvins [12] present an easily applicable methodology to calculate maximum distributed generation capacity in radial low-voltage feeders. Kolenc et al. [13] present a probabilistic approach to network planning, which has many advantages compared to the traditional approaches using estimated peak values and empirically defined simultaneity factors. The method takes into account the stochastic natures of future distributed generation location and loads consumption.
Xu and Zhuan [14] are searching for the optimal wind generation capacity considering grid coupling assets. The authors maximize yearly profits of the entire power system accounting for operational constraints and the reliability requirement. The problem is solved using combined Monte Carlo simulation, neural networks and genetic algorithm optimization technique.
Only a few papers deal with the determination of bus connection capacity taking into account only technical limitations, separate from economic issues. Sobierajski et al. [15] bring down the task of determination of bus connection capacity to the minimization of a linear goal function subjected to linear equality (generation and demand balance) and inequality constraints (permissible branch flows and thermal generation minimum). A linear programming method has been used, however, to solve so formulated problem. Bajor [16] describes the use of coherent node method for bus capacity determination, but this method can be applied only for a group of nodes selected in a very specific way.
Harrison and Wallace [17] present a method for determining the installed capacity of new generation sources in the distribution network. In the method, named by the authors as “reverse load-ability”, new generation sources are modeled as loads of negative value. Using the optimal power flow method, the authors search for the minimum value of negative load. In the calculation process, technical constraints are considered, such as: maximum capacity of distribution lines, voltage tolerance boundary at network nodes. Cornélusse et al. [18] also propose a method for determining the connection capacity of new generation sources to the distribution network. Additionally, in this method the authors use typical tools that are usually used by Network Operators in the planning and operation of distribution systems: long-term load forecasting, long-term network expansion/reconstruction planning, network reconfiguration, and power flow calculation tools. In both papers, the authors analyze the problem of, ”network sterilization”. This problem occurs in the case of improper distribution of the connected generation between network nodes, e.g., too high generation capacity connected to one of the network nodes. Consequently, it may block the possibility of connecting additional power to other nodes of this network. Both methods use a power flow model of the grid offering the exact mathematical description of the power grid operation parameters. In both methods, the calculation model must be created from scratch (based on network data).
Georgilakis and Hatziargyriou [19] in their article attempted to summarize the methods used to determine the connection capacity of new generation sources to distribution networks. It presents an overview of the most advanced methods and models used to solve the problem. A key contribution of this paper consists in the analysis and clustering of research trends in this field.
2. Proposed Method and Its Novelty
One of the main tasks of the PSOs is to ensure a proper, safe and trouble-free operation of power grids and their successive and economically justified development. One of the key factors in the successful accomplishment of these tasks is profound knowledge of the bus connection capacity. For this purpose optimization methods are used, which allow PSOs to more and more efficiently and rationally utilize technical capabilities of the operated networks.
This problem can be generally solved in two ways:
- Developing an own, fully functional power system calculation software with access to all variables necessary in the optimization process. It is a labor-intensive method requiring a long time and multiple verifications.
- Using available open source or freeware power flow calculation software, which allows for performing power flow calculations with simultaneous access to all variables necessary in the optimization process. Unfortunately, such software most often does not meet all requirements for professional power flow calculations. For example, an inability to adjust a transformer ratio or lack of reactive power regulation significantly limits the application of such programs in actual power networks [20].
Optimization of operation or structure of a power system is a known and well described problem in literature [21,22,23,24]. Various methods and optimization algorithms are used to solve this problem. The main purpose aims at minimizing the costs of system operation or at the improvement of technical parameters of system operation, such as active or passive power losses or a system stability reserve. Currently, primarily commercial software enabling high-speed computing, efficiency, and reliability of the results is used for calculations and analyses of complex engineering systems. Many programs also have optimization modules. The basic disadvantage of these modules is that the user’ possibilities are limited to the use of one of the optimization models implemented in the program, without an opportunity to formulate their own optimization problem. The main obstacle is the lack of direct and free access to all system variables and to the full mathematical model of the analyzed power system. As an output from such software, the user receives a set of values describing the state of the system, such as line and transformer loads and bus voltages. For this reason, it is not possible to directly use any power flow software known to the authors to determine the bus connection capacity in the analyzed power grid. But these results can be used to solve many optimization problems related to power systems by use of Simulation Optimization methods [25] or a black-box optimization [26,27].
This paper proposes a new method, which uses black-box optimization to determine the bus connection capacity in electric power network of any type. One of the main elements determining the uniqueness of the proposed method is the use, in calculations of a power system flow, of the full nonlinear power system model, without any simplification or linearization. There is no need to create a new network model or to convert an existing one, PSO can apply a model which is used in daily routine power flow calculations.
The full, nonlinear power system model is applied in all calculations used in the method presented in this article. The necessary condition is the possibility of obtaining numerical results from the flow calculation program. All the constraints relevant for proper and safe system operation, such as bus voltages, line loads, and short-circuit currents, both in a steady-state and in (n-1) contingency states, can be taken into consideration. The type and scope of included constraints can be arbitrary determined by the user. This essential quality ensures that the obtained solution meets the constraints of the actual power system.
In addition, the proposed algorithm is an example of the so-called technical optimization, which determines only the values of the generation power that can be connected in the analyzed nodes regardless of the generation cost (does not determine an optimal “mix” of generating sources). This approach is preferred by all PSOs, who primarily wish to determine how large a source can be connected to the node(s), without worsening the existing network state or define a clear indication of network investments necessary to connect the source of a certain size in the node(s). The problems of cost and choice of generation technologies are usually on the site of the investor, who in turn should not be burdened with technical problems regarding the network.
Obtained results show the effectiveness of this method both for single nodes and for their groups in any configuration. Calculations confirmed good convergence and repeatability of the method for all three tested computational algorithms. The method creates the possibility to use open source software to extend the functionality of Siemens PSS®E commercial power system calculation software.
Authors of the article do not know any publications regarding methods that directly determine bus connection capacity with the use of power flow calculation software employing full, nonlinear network model. This is especially important for PSOs who, on the basis of such models, simulate and analyze power system operation on a daily basis. This article fills this gap, giving simultaneously the opportunity to simplify and expand the functionality of already used software.
3. Black-Box Optimization
An optimization algorithm used in the black-box method is usually based on a simple search algorithm [26,28]. This is mainly due to the difficulty or inability to calculate gradients or second derivatives matrices used by more efficient gradient or Newton methods. The problem of determination of the bus connection capacity in the power grid is nonlinear and, in its general form, can be presented as below:
Adaptation of the above equations for the black-box optimization method is as follows: for each iteration , the optimization algorithm calculates the current value of searched variables vector and passes it to the black-box object. The black-box in the presented problem constitutes a model of the power system under consideration, implemented in the power system calculation software. The software calculates the power flow for given vector and passes numerical values of the objective function (), all inequality constraints and/or all equality constraints to the optimization algorithm. Basing on these values, the optimization algorithm calculates the new value of the searched variables vector , which is subsequently used in the next iteration of the optimization process. The knowledge of functional dependencies between the state vector and the constraints is not necessary and in practice is often lacking. The result of this method is the optimal variables vector , satisfying defined constraints.
The searched variables of the optimization problem are capacities () to be connected at selected power system nodes and the objective function is the maximum sum of these capacities. The most important values determining the proper and safe operation of the power system (such as: admissible transformer and line loads (), admissible bus voltages (), allowable short-circuit current values () in network nodes, etc.) are the problem constraints. The user can also create his own set of constraints, taking into account the specific requirements of the PSO. A characteristic feature of the presented method is that the above-presented constraints are not explicitly described by mathematical equations. The constraints values are obtained from the power flow calculation software (a black-box in the method) in a numeric form. The optimal solution is found by the optimization algorithm to which constraints values are passed (from a black-box) in each step of the calculations. A detailed model of the optimization problem is presented in Section 4.
The problem of determining the bus connection capacity in power grid is a nonlinear multi-dimensional and in general case a non-convex optimization problem. Therefore and due to applied optimization algorithms, the solution obtained using the proposed method is only a local optimum, not a global one. In practice, this may result in finding many solutions (local optimums), depending on, e.g., the selection of the starting point or chosen optimization algorithms.
The main fields of black-box optimization application are research areas based on experiments, simulations or real values measurements. Researchers in many cases have a problem with the creation of appropriately accurate models that reflect the phenomena they are investigating or even fail to build these models at all, because of the complexity of the studied phenomena. Black-box optimization methods allow for efficient and accurate calculations in such cases, despite lack or incomplete knowledge of the exact form of the objective function or constraints. Many examples of the effectiveness of black-box optimization in solving complex engineering problems can be found in the literature.
Schaul [29] presents and compares the latest methods in the field of continuous black-box optimization. He also shows possibilities and implementations of these methods in an open source Python environment. Bajaj and Hasan [30] propose an effective strategy for the sampling, modeling, and optimization of black-box problems with constraints. Santarelli and Pellegrino [31] use black-box method to optimize a stand-alone energy system based only on renewable sources integrated with a system for the production of hydrogen, with the aim to supply the electricity needs of a residential user. Brus and Zambrano [32] adapt a black-box method for nonlinear systems for identification of the solar collectors at an air conditioning plant. Brabec et al. [33] present black-box models for forecasting hourly average solar irradiance. The results are compared with classical statistical methods. Paulescu et al. [34] compare two advanced models for forecasting the output power of photovoltaic plants: a black-box fuzzy model and a physically inspired, semiparametric statistical model (gray box). Ruschenburg et al. [35] describe the applicability and the ways to validate a black-box heat pump simulation model. The results are backed by research for five real objects. Afram and Janabi-Sharifi [36] show the possibilities of the use of black-box models for effective control of the residential HVAC systems. Tang et al. [37] solve the problem of distribution system feeder reconfiguration using black box Mesh Adaptive Direct Search (MADS). Black and white box method is used by Ma et al. [38] for diagnostic of hub permanent-magnet synchronous motors based on abnormal noise analysis. Bent et al. [39] apply black-box approach based on a discrepancy-bounded local search (DBLS) to optimize expansion of transmission assets and considering power flow related constraints. Valdivia et al. [40] apply a black-box models for the control of DC-DC converters used for fuel-cell power conditioning. A black-box approach for the identification of parameters of proton exchange membranes in fuel cell stack predictive control has been proposed by Lopes et al. [41]. It uses neural networks with nonlinear autoregressive, exogenous input and nonlinear output error.
4. Mathematical Model
The basic aim of the method presented in this paper is to find the total, maximum active power of generating units that can be attached to any selected group of power grid nodes while maintaining safe system operation. The searched variables are active powers , which can be connected to an arbitrarily chosen group of N network nodes:
The objective function for the described problem is:
In practice, each newly connected energy source changes the volume of total active power losses in the network, to which it is connected. For the power grid operation, the real gain is the net power, which is a difference between the sum of the active power of the added sources (3) and the change of total active power losses caused by their connection. This can be presented as:
Equation (4) is an objective function of the considered optimization task. This may lead to a situation in which the net power is greater than the sum of capacities of connected generating units. This is due to such an allocation of newly connected generating units that results in lower total active power losses in the network. For the complete definition of the optimization task, it is necessary to formulate problem constraints—mathematical relationships describing the technical limitations existing in the actual network. They are:
- permissible line and transformer loads:
- range of permissible voltage levels at power network nodes:
- range of permissible short-circuit current values at network nodes:
- limit of the total added generation:
All the above constraints should be met both in a steady state and in contingency states ( criteria). Usually, a power network fails to meet one or more criteria even without any additional power sources. Then some of the constraints (5) and/or (6) are not fulfilled at the beginning of calculation. In such a case, the constraints (5) and/or (6) must be modified. They take a more general form:
and
Equations (9) and (10) mean that the connection of an additional generation cannot worsen the existing overloads of lines or transformers and/or voltage transgressions. Results of calculations carried out so far, indicate, that connection of additional generation in many cases lowers or even eliminates the previously described exceedances in contingency states.
Voltage levels specified in the relevant regulations, regarding the correct operation of the power system are used as maximum and minimum bus voltage levels and in constraints (6) and (10).
Constraint (7) results from the necessity of maintaining the short-circuit strength of existing in the analyzed network switching, measuring and protection equipment, in face of changing short-circuit conditions, resulting from the connection of new generation sources.
Constraint (8) arises from the requirement to keep the power balance in analyzed power system unchanged; the total output of the designated existing centrally controlled power units has to be reduced by the total power of new connected units. Centrally controlled units are selected in a manner determined by the PSO. In each calculation step their output is reduced in proportion to currently generated power. In practice, due to technical constraints or market mechanisms, centrally controlled power units should remain operating. It means that their output should be within the limits , giving adjustable power value . This will ensure, among other things, the minimum requirements for voltage regulation and stability of the entire power system.
The range of reactive power generation of the newly connected power units can be determined arbitrarily as , and in practice should be related to the unit characteristics or be determined by PSO’s requirements.
Verification of constraints (5) to (10) and power balance corrections are carried out in each step of the proposed method, both for the steady state and for all considered contingency states.
Calculations are performed successively for the steady state and for all k considered contingency states: . From obtained solutions , the one with the lowest objective value is the final solution of the problem. Because of the nonlinearity of the problem, the final solution is additionally verified for compliance with all the constraints in the remaining states of the system.
5. Validation and Testing
The proposed method is presented on the IEEE 118-bus test network [42,43], shown in Appendix B in Figure A1. The full, nonlinear model of the power system was used.
The largest generating units with output exceeding 300 MW were selected as the centrally controlled units (used to balance the power in the network). Their details are presented in Appendix B in Table A1. A group of nodes was arbitrarily chosen within the considered network, for which the total maximum power of the connected generating sources was to be determined. The group consisted of 15 nodes, and its data are given in Appendix B in Table A2. Calculations were made on a PC characterized by the following parameters: INTEL® Core i7-4790K 4 GHz processor, 32 GB RAM, running on Windows 10. The following software was used in the calculations:
- Three optimization algorithms:
- NLOPT v2.4.2—algorithm COBYLA (Constrained Optimization BY Linear Approximations, open source software) [44,45,46].
- NOMAD v3.7.3 (Mesh Adaptive Direct Search algorithm, open source software) [47,48,49,50,51].
- Pattern Search algorithm from MATLAB® R2015b Global Optimization Toolbox (licensed software).
- Siemens PSS®E v33.7 (flow calculation software, licensed software).
- MATLAB® R2015b (as a computational interface, licensed software).
- Python v2.7.10 programming language (as a computational interface, open source software).
Figure 1 shows the block diagram of the presented calculation method. The left part of the algorithm is implemented in the MATLAB® environment and is responsible for optimization. The current calculation point is computed in this block after each iteration, the optimization algorithms are called from this block and the criterion for calculation termination is tested. The right part of the algorithm is implemented in the Python environment and is responsible for data transfer from the tested black-box object, which in the presented case is the network flow calculation software (Siemens PSS®E) with implemented full nonlinear model of the analyzed power network. Ultimately, MATLAB® can be replaced by Python what will allow eliminating the cost of MATLAB® license. All three optimization algorithms were run with default settings and two stopping criteria:
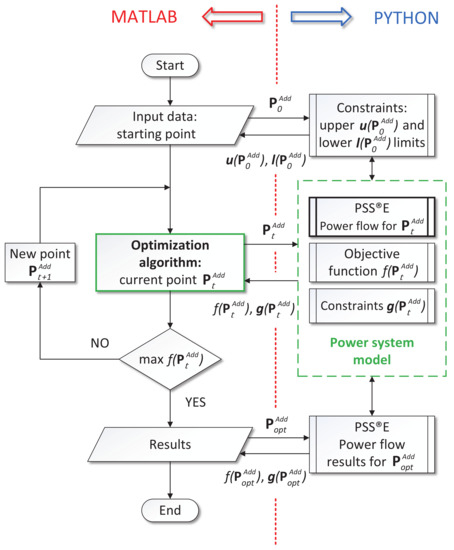
Figure 1.
Block diagram of the presented method.
- obtained calculation accuracy , or
- a maximum number of iterations (depending on algorithm). The following values have been here adopted: COBYLA—2500; NOMAD—5000; Pattern Search (MATLAB®)—5000. In practical calculations, further increase of the maximum iteration number did not change the accuracy of the obtained results.
Calculations were carried out for following network configurations:
- steady state,
- contingency states, including the single outage of all lines (179 cases) and transformers (9 cases). This together makes 188 different configurations of the tested power grid.
From the solutions obtained for all such defined network configurations, the one with the lowest sum of additionally connected powers described by (4), was taken as the final solution.
Calculations in contingency states were made for two levels of acceptable overload of power system components (lines and transformers):
- no overload accepted (max load = 100% rated value),
- 20% overload in contingency states accepted (max load = 120% rated value).
The second case results from a common network operation practice, in which small, short-term overloads are allowed. All calculations were made:
- separately for each node belonging to a chosen group,
- for the group of nodes as a whole.
The results of calculations made with the above assumptions are presented in Tables 2–4. Calculation time was below 1 min for the single nodes and from several min up to a few h for the group of nodes. For example, the following algorithms performance indicators in one of the calculation variants are presented in Table 1. Larger values (both: function evaluation and CPU time) for NOMAD and Pattern Search algorithms result from the specifics of these algorithms that require a larger number of function calculations.

Table 1.
Example of algorithm performance indicators—variant “Group as a whole”, the max load of the lines, and transformers in contingency states = 100%. COBYLA = Constrained Optimization BY Linear Approximations.
General comments on calculation results:
- All three tested optimization algorithms have confirmed their suitability for solving of the presented problem.
- Calculations show that the net power resulting from the additional connection of power units sometimes is greater than the sum of power values of the connected generators. This is due to such an allocation of newly connected units that results in lower total active power losses in the network.
- The results of total bus connection capacity are very close for all three tested algorithms, but the power distribution between the nodes may be different. This is because several different power distributions can give practically the same results. A simple example of such a situation is presented in Figure 2. Both bus capacity distributions in Figure 2 are equivalent. In each of buses 1 and 2, the connection capacity is limited by the rated load of identical lines 1 and 2 (150 MW), while the total connection capacity is bounded by the rated load of line 3 (250 MW).
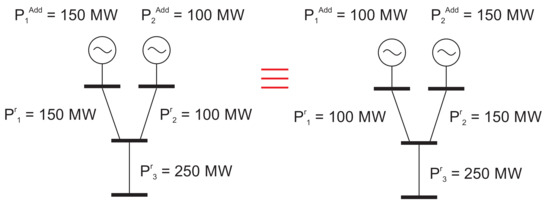 Figure 2. An example of an ambiguous distribution of bus connection capacity.
 - The efficiency of the algorithm depends on the starting point selection. The standard starting point for calculations is point . Such a choice allows avoiding any violation of the constraints (e.g., overloading of network elements) just after the beginning of the calculations. Starting point also meets the condition of starting optimization calculations from the permitted area, which is required for most of the optimization algorithms incorporating constraints. When an approximate upper power range for considered network nodes is known to a PSO (what often happens in practice), sometimes better results can be acquired by starting calculations from the point .
6. Summary and Conclusions
Conducted calculations and analyses have demonstrated the possibility of using the presented black-box optimization method to determine the bus connection capability in the power grid of any type and for any configuration of nodes. The presented results allow for drawing the following conclusions:
- Analysis and calculation of the bus connection capacity can be made using a full, nonlinear grid model, without any simplification or linearization. A very important factor is that the following network flow analyses are performed on the same model.
- The proposed method is convergent and relatively quick. The number of iterations and calculation time depends on the algorithm used, network size and a number of selected nodes. Sample graphs showing the convergence process for the IEEE 118-bus test network (steady state) are presented in Figure 3.
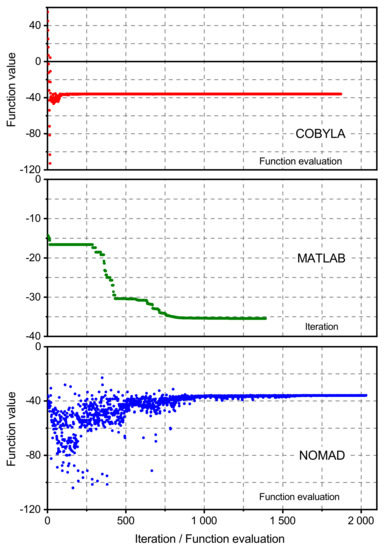 Figure 3. Convergence rate for tested algorithms.
 - The most effective in the conducted analysis was the COBYLA algorithm, which is also the simplest one. The optimum was reached with the smallest number of iterations and in the shortest CPU time. Larger values (both iterations and CPU time) for NOMAD and Pattern Search algorithms result from the specifics of these algorithms that require a larger number of function calculations. Additionally, the effectiveness of the Pattern Search algorithm depends in a significant way on the proper selection of the starting point and the control parameters of the algorithm. In the case of bad selection of control parameters or/and starting point, calculations result was often much worse than for other tested algorithms.
- Convergence of the proposed method results from convergence of used optimization algorithm, provided the convergence of the power network model.
- The method can be used for any configuration of buses. PSO can define arbitrarily the composition of such node groups, according to its guidelines or needs.
- The proposed method makes it possible to take into account all the constraints relevant for safe operation of the system, such as bus voltages, line loads, and short-circuits currents, both in steady state and in contingency states.
- If the PSO has flow calculation software (which is very common), the proposed method can be implemented at relatively low cost. It is based on open source optimization algorithms, and requires only access to results from flow calculation software. MATLAB® software used by the authors as a computational interface can be fully replaced with procedures written in other programming language, e.g., Python.
The presented method also allows to solve the problem of “network sterilization” described in [17,18]. Correct analysis of the results presented in Table 2, Table 3 and Table 4 allows to determine such parameters as:
Table 2.
Distribution of the additional power among the group of nodes, calculations made for the group as a whole.
Table 3.
Bus connection capacity—the max load of the lines and transformers in contingency states = 100%.
Table 4.
Bus connection capacity—the max load of the lines and transformers in contingency states = 120%.
- “strongest” node of the analyzed area of the network to which the highest power can be connected (LINKOLN node);
- maximum power that can be connected to the entire considered network area (Group as a whole = 67.531 MW);
- the method allows distributing the installed capacity of newly connected generating sources among grid nodes in the considered area by formulating appropriate constraints linked to the investment strategy of the grid operator. This issue was not presented and analyzed in the article.
The proposed method can be successfully applied and used by all PSOs, who own power flow calculation software programs on condition that this software can export calculation results to a file or pass them to other software as a memory variable. Additional benefits for PSOs, software, or designing companies are:
- the method can be used for identification of network bottlenecks that should be upgraded to increase the grid connection capacity,
- the proposed method can be also implemented by developers of flow calculation software to increase the functionality of the offered tool,
- due to the use of the open source software, costs of implementing the method can be relatively low.
For the more practical testing of the proposed method, calculations were also made for full, nonlinear model of the whole Polish Power System, the model of which consists of over 4500 nodes. The results obtained for the selected case study presented in [52] fully confirmed the suitability of the proposed method and its superiority over algorithm used by PSOs in Poland.
7. Future Research
The proposed method, thanks to its open structure, can be further developed and refined, without interfering in complicated flow calculation software. The most important proposed further development cover:
- testing new optimization algorithms that could increase the speed and accuracy of the method,
- identification of additional constraints that will contribute to a more unambiguous power distribution between the nodes,
- replacement of the commercial software (MATLAB®) by routines created in Python programming language.
All future work will focus on developing a fully independent, free computing tool that could be integrated with any power flow calculation software.
Author Contributions
T.S., Formal analysis, Investigation, Validation, Writing—review & editing; M.S., Investigation, Validation, Writing—original draft preparation; A.W., Conceptualization, Formal analysis, Methodology, Supervision, Writing—editing. All authors have read and agreed to the published version of the manuscript.
Funding
This research received no external funding.
Conflicts of Interest
The authors declare no conflict of interest.
Appendix A. Nomenclature
| Variable | Definition |
| N | number of nodes, to which additional generation is connected, |
| ni | total number of lines and transformers in analyzed network, |
| nu | total number of nodes in analyzed network, |
| nreg | number of centrally controlled units, |
| additional active power connected to the bus i, | |
| N-dim vector of | |
| change in total active power losses resulting from connection of generation , | |
| line/transformer j rated load, | |
| line/transformer j load without connection of any additional power, | |
| line/transformer j load after connection of , | |
| minimum admissible voltage at bus j, | |
| maximum admissible voltage at bus j, | |
| voltage at bus j without connection of any additional power, | |
| voltage at bus j after connection of , | |
| rated short-circuit breaking/withstand current of equipment at bus j, | |
| initial symmetrical short-circuit current at bus j after connection of , | |
| active regulating power of centrally controlled unit j, | |
| minimum active power of centrally controlled unit j, | |
| actual active power of centrally controlled unit j. |
Appendix B. Data Used in the Calculations
Standard IEEE 118-bus Test system data was used [42,43].
Table A1.
Units selected as centrally controlled.
Table A1.
Units selected as centrally controlled.
| No. | Bus No. | Bus Name | Bus Voltage | Machine Power | ||
|---|---|---|---|---|---|---|
| Pgen | Pmin | Preg | ||||
| (kV) | (MW) | (MW) | (MW) | |||
| 1 | 10 | BREED | 345 | 450 | 0 | 450 |
| 2 | 26 | TANNRSCK | 345 | 314 | 0 | 314 |
| 3 | 65 | MUSKNGUM | 345 | 391 | 0 | 391 |
| 4 | 66 | MUSKNGUM | 138 | 392 | 0 | 392 |
| 5 | 80 | CABINCRK | 138 | 477 | 0 | 477 |
| 6 | 89 | CLINCHRV | 138 | 607 | 0 | 607 |
| Total | 2631 | 0 | 2631 | |||
Table A2.
Buses selected for the group.
Table A2.
Buses selected for the group.
| No. | Bus No. | Bus Name | Bus Voltage | ||||
|---|---|---|---|---|---|---|---|
| Nominal | Normal | Emergency | |||||
| Min. | Max. | Min. | Max. | ||||
| (kV) | (pu) | (pu) | (pu) | (pu) | |||
| 1 | 1 | RIVERSDE | 138 | 0.94 | 1.06 | 0.90 | 1.10 |
| 2 | 2 | POKAGON | 138 | 0.94 | 1.06 | 0.90 | 1.10 |
| 3 | 3 | HICKRYCK | 138 | 0.94 | 1.06 | 0.90 | 1.10 |
| 4 | 4 | NWCARLSL | 138 | 0.94 | 1.06 | 0.90 | 1.10 |
| 5 | 5 | OLIVE | 138 | 0.94 | 1.06 | 0.90 | 1.10 |
| 6 | 6 | KANKAKEE | 138 | 0.94 | 1.06 | 0.90 | 1.10 |
| 7 | 7 | JACKSNRD | 138 | 0.94 | 1.06 | 0.90 | 1.10 |
| 8 | 11 | SOUTHBND | 138 | 0.94 | 1.06 | 0.90 | 1.10 |
| 9 | 12 | TWINBRCH | 138 | 0.94 | 1.06 | 0.90 | 1.10 |
| 10 | 13 | CONCORD | 138 | 0.94 | 1.06 | 0.90 | 1.10 |
| 11 | 14 | GOSHENJT | 138 | 0.94 | 1.06 | 0.90 | 1.10 |
| 12 | 15 | FTWAYNE | 138 | 0.94 | 1.06 | 0.90 | 1.10 |
| 13 | 16 | N.E. | 138 | 0.94 | 1.06 | 0.90 | 1.10 |
| 14 | 19 | LINCOLN | 138 | 0.94 | 1.06 | 0.90 | 1.10 |
| 15 | 117 | COREY | 138 | 0.94 | 1.06 | 0.90 | 1.10 |

Figure A1.
IEEE 118-bus test system (PSS®E diagram).
Figure A1.
IEEE 118-bus test system (PSS®E diagram).

References
- Afful-Dadzie, A.; Afful-Dadzie, E.; Awudu, I.; Banuro, J.K. Power generation capacity planning under budget constraint in developing countries. Appl. Energy 2017, 188, 71–82. [Google Scholar] [CrossRef]
- Wogrin, S.; Barquín, J.; Centeno, E. Capacity Expansion Equilibria in Liberalized Electricity Markets: An EPEC Approach. IEEE Trans. Power Syst. 2013, 28, 1531–1539. [Google Scholar] [CrossRef]
- Hesamzadeh, M.R.; Yazdani, M. Transmission Capacity Expansion in Imperfectly Competitive Power Markets. IEEE Trans. Power Syst. 2014, 29, 62–71. [Google Scholar] [CrossRef]
- Tohidi, Y.; Hesamzadeh, M.R.; Regairaz, F. Sequential Coordination of Transmission Expansion Planning With Strategic Generation Investments. IEEE Trans. Power Syst. 2017, 32, 2521–2534. [Google Scholar] [CrossRef]
- Centeno, E.; Wogrin, S.; Lópẽz-Pena, Á.; Vázquez, M. Analysis of investments in generation capacity: A bilevel approach. IET Gener. Transm. Distrib. 2011, 5, 842–849. [Google Scholar] [CrossRef]
- Pisciella, P.; Vespucci, M.; Bertocchi, M.; Zigrino, S. A time consistent risk averse three-stage stochastic mixed integer optimization model for power generation capacity expansion. Energy Econ. 2016, 53, 203–211. [Google Scholar] [CrossRef]
- Chen, F.; Huang, G.; Fan, Y.; Chen, J. A copula-based fuzzy chance-constrained programming model and its application to electric power generation systems planning. Appl. Energy 2017, 187, 291–309. [Google Scholar] [CrossRef]
- Mokgonyana, L.; Zhang, J.; Li, H.; Hu, Y. Optimal location and capacity planning for distributed generation with independent power production and self-generation. Appl. Energy 2017, 188, 140–150. [Google Scholar] [CrossRef]
- Theo, W.L.; Lim, J.S.; Ho, W.S.; Hashim, H.; Lee, C.T. Review of distributed generation (DG) system planning and optimisation techniques: Comparison of numerical and mathematical modelling methods. Renew. Sustain. Energy Rev. 2017, 67, 531–573. [Google Scholar] [CrossRef]
- Mohtashami, S.; Pudjianto, D.; Strbac, G. Strategic Distribution Network Planning With Smart Grid Technologies. IEEE Trans. Smart Grid 2017, 8, 2656–2664. [Google Scholar] [CrossRef]
- Koutroumpezis, G.; Safigianni, A. Optimum allocation of the maximum possible distributed generation penetration in a distribution network. Electr. Power Syst. Res. 2010, 80, 1421–1427. [Google Scholar] [CrossRef]
- Papaioannou, I.T.; Purvins, A. A methodology to calculate maximum generation capacity in low voltage distribution feeders. Int. J. Electr. Power Energy Syst. 2014, 57, 141–147. [Google Scholar] [CrossRef]
- Kolenc, M.; Papič, I.; Blažič, B. Assessment of maximum distributed generation penetration levels in low voltage networks using a probabilistic approach. Int. J. Electr. Power Energy Syst. 2015, 64, 505–515. [Google Scholar] [CrossRef]
- Xu, M.; Zhuan, X. Identifying the optimum wind capacity for a power system with interconnection lines. Int. J. Electr. Power Energy Syst. 2013, 51, 82–88. [Google Scholar] [CrossRef]
- Sobierajski, M.; Słabosz, S.; Rojewski, W. Optimal Interconnecting Wind Generation into Polish Power System. In Proceedings of the 2010 Modern Electric Power Systems (MEPS’10), Wroclaw, Poland, 20–22 September 2010; pp. 1–7. [Google Scholar]
- Bajor, M.; Jankowski, R.; Widelski, G. Area-Wide Management of a Significant Wind Generation as a Way to Ensure a Safe Grid Operation. Acta Energ. 2014, 3, 17–26. [Google Scholar] [CrossRef]
- Harrison, G.P.; Wallace, A.R. Optimal power flow evaluation of distribution network capacity for the connection of distributed generation. IEE Proc. Gener. Transm. Distrib. 2005, 152, 115–122. [Google Scholar] [CrossRef]
- Cornélusse, B.; Vangulick, D.; Glavic, M.; Ernst, D. Global capacity announcement of electrical distribution systems: A pragmatic approach. Sustain. Energy Grids Netw. 2015, 4, 43–53. [Google Scholar] [CrossRef]
- Georgilakis, P.S.; Hatziargyriou, N.D. Optimal Distributed Generation Placement in Power Distribution Networks: Models, Methods, and Future Research. IEEE Trans. Power Syst. 2013, 28, 3420–3428. [Google Scholar] [CrossRef]
- Zimmerman, R.D.; Murillo-Sanchez, C.E.; Thomas, R.J. MATPOWER: Steady-State Operations, Planning, and Analysis Tools for Power Systems Research and Education. IEEE Trans. Power Syst. 2011, 26, 12–19. [Google Scholar] [CrossRef]
- Chen, H.; Ngan, H.; Zhang, Y. Power System Optimization: Large-Scale Complex Systems Approaches, 1st ed.; John Wiley & Sons Singapore Pte. Ltd.: Singapore, 2016. [Google Scholar] [CrossRef]
- Zhu, J. Optimization of Power System Operation, 2nd ed.; IEEE Press Series on Power Engineering; John Wiley & Sons: Hoboken, NJ, USA, 2015. [Google Scholar] [CrossRef]
- Mahmoud, M.S.; AL-Sunni, F.M. Control and Optimization of Distributed Generation Systems, 1st ed.; Power Systems; Springer International Publishing: Cham, Switzerland, 2015. [Google Scholar] [CrossRef]
- Soliman, S.A.; Mantawy, A.H. Modern Optimization Techniques with Applications in Electric Power Systems, 1st ed.; Energy Systems; Springer: New York, NY, USA, 2012. [Google Scholar] [CrossRef]
- Hachicha, W.; Ammeri, A.; Masmoudi, F.; Chachoub, H. A Comprehensive Literature Classification of Simulation Optimisation Methods; MPRA Paper; University Library of Munich: Munich, Germany, 2010. [Google Scholar]
- Audet, C. A Survey on Direct Search Methods for Blackbox Optimization and Their Applications. In Mathematics Without Boundaries: Surveys in Interdisciplinary Research; Pardalos, P.M., Rassias, T.M., Eds.; Springer: New York, NY, USA, 2014; pp. 31–56. [Google Scholar] [CrossRef]
- Muñoz, M.A.; Sun, Y.; Kirley, M.; Halgamuge, S.K. Algorithm selection for black-box continuous optimization problems: A survey on methods and challenges. Inf. Sci. 2015, 317, 224–245. [Google Scholar] [CrossRef]
- Rios, L.M.; Sahinidis, N.V. Derivative-free optimization: A review of algorithms and comparison of software implementations. J. Glob. Optim. 2013, 56, 1247–1293. [Google Scholar] [CrossRef]
- Schaul, T. Studies in Continuous Black-Box Optimization. Ph.D. Thesis, Technische Universität München, Fakultät für Informatik, Munich, Germany, 2011. [Google Scholar]
- Bajaj, I.; Hasan, M.F. Effective Sampling, Modeling and Optimization of Constrained Black-box Problems. In Proceedings of the 26th European Symposium on Computer Aided Process Engineering, Portorož, Slovenia, 12–15 June 2016; Kravanja, Z., Bogataj, M., Eds.; Elsevier: Amsterdam, The Netherlands, 2016; Volume 38, pp. 553–558. [Google Scholar] [CrossRef]
- Santarelli, M.; Pellegrino, D. Mathematical optimization of a RES-H2 plant using a black box algorithm. Renew. Energy 2005, 30, 493–510. [Google Scholar] [CrossRef]
- Brus, L.; Zambrano, D. Black-box identification of solar collector dynamics with variant time delay. Control Eng. Pract. 2010, 18, 1133–1146. [Google Scholar] [CrossRef]
- Brabec, M.; Paulescu, M.; Badescu, V. Tailored vs black-box models for forecasting hourly average solar irradiance. Sol. Energy 2015, 111, 320–331. [Google Scholar] [CrossRef]
- Paulescu, M.; Brabec, M.; Boata, R.; Badescu, V. Structured, physically inspired (gray box) models versus black box modeling for forecasting the output power of photovoltaic plants. Energy 2017, 121, 792–802. [Google Scholar] [CrossRef]
- Ruschenburg, J.; Ćutić, T.; Herkel, S. Validation of a black-box heat pump simulation model by means of field test results from five installations. Energy Build. 2014, 84, 506–515. [Google Scholar] [CrossRef]
- Afram, A.; Janabi-Sharifi, F. Black-box modeling of residential HVAC system and comparison of gray-box and black-box modeling methods. Energy Build. 2015, 94, 121–149. [Google Scholar] [CrossRef]
- Tang, L.; Yang, F.; Feng, X. A novel method for distribution system feeder reconfiguration using black-box optimization. In Proceedings of the 2013 IEEE Power Energy Society General Meeting, Vancouver, BC, Canada, 21–25 July 2013; pp. 1–5. [Google Scholar] [CrossRef]
- Ma, C.; Liu, Q.; Wang, D.; Li, Q.; Wang, L. A Novel Black and White Box Method for Diagnosis and Reduction of Abnormal Noise of Hub Permanent-Magnet Synchronous Motors for Electric Vehicles. IEEE Trans. Ind. Electron. 2016, 63, 1153–1167. [Google Scholar] [CrossRef]
- Bent, R.; Toole, G.L.; Berscheid, A. Transmission Network Expansion Planning With Complex Power Flow Models. IEEE Trans. Power Syst. 2012, 27, 904–912. [Google Scholar] [CrossRef]
- Valdivia, V.; Barrado, A.; Lázaro, A.; Sanz, M.; del Moral, D.L.; Raga, C. Black-Box Behavioral Modeling and Identification of DC-DC Converters With Input Current Control for Fuel Cell Power Conditioning. IEEE Trans. Ind. Electron. 2014, 61, 1891–1903. [Google Scholar] [CrossRef]
- da Costa Lopes, F.; Watanabe, E.H.; Rolim, L.G.B. A Control-Oriented Model of a PEM Fuel Cell Stack Based on NARX and NOE Neural Networks. IEEE Trans. Ind. Electron. 2015, 62, 5155–5163. [Google Scholar] [CrossRef]
- IEEE 118-Bus Test System. Available online: http://icseg.iti.illinois.edu/ieee-118-bus-system/ (accessed on 20 July 2017).
- IEEE 118-Bus Test System. Available online: https://www2.ee.washington.edu/research/pstca/pf118/pg_tca118bus.htm (accessed on 20 July 2017).
- Powell, M.J.D. A Direct Search Optimization Method That Models the Objective and Constraint Functions by Linear Interpolation. In Advances in Optimization and Numerical Analysis, Proceedings of the 6th Workshop on Optimization and Numerical Analysis, Oaxaca, Mexico, January 1992; Gomez, S., Hennart, J.P., Eds.; Kluwer Academic: Dordrecht, The Netherlands, 1994; Volume 275, pp. 51–67. [Google Scholar]
- Powell, M.J.D. Direct search algorithms for optimization calculations. Acta Numer. 1998, 7, 287–336. [Google Scholar] [CrossRef]
- Johnson, S.G. The NLopt Nonlinear-Optimization Package. Software. Available online: http://github.com/stevengj/nlopt (accessed on 20 July 2019).
- Abramson, M.; Audet, C.; Couture, G.; Dennis, J.; Le Digabel, S.; Tribes, C. The NOMAD Project. Software. Available online: https://www.gerad.ca/nomad/ (accessed on 20 July 2017).
- Audet, C.; Dennis, J. Mesh Adaptive Direct Search Algorithms for Constrained Optimization. SIAM J. Optim. 2006, 17, 188–217. [Google Scholar] [CrossRef]
- Audet, C.; Le Digabel, S.; Tribes, C. NOMAD User Guide. Available online: https://www.gerad.ca/nomad/Downloads/user_guide.pdf (accessed on 15 January 2017).
- Audet, C.; Dennis, J.; Le Digabel, S. Trade-off studies in blackbox optimization. Optimization Methods and Software 2012, 27, 613–624. [Google Scholar] [CrossRef]
- Le Digabel, S. Algorithm 909: NOMAD Nonlinear Optimization with the MADS algorithm. ACM Trans. Math. Softw. 2011, 37, 1–15. [Google Scholar] [CrossRef]
- Wędzik, A. Determination of Connection Capacity in the HV Closed Network by the use of a Black-box Optimization—A Case Study. Acta Energ. 2017, 1, 131–138. [Google Scholar] [CrossRef]


© 2019 by the authors. Licensee MDPI, Basel, Switzerland. This article is an open access article distributed under the terms and conditions of the Creative Commons Attribution (CC BY) license (http://creativecommons.org/licenses/by/4.0/).