Abstract
Medium and low-rank coal from the Zhunnan coalfield of Xinjiang in China was investigated for quantitatively characterizing its range of aperture structure. The pore parameters were determined by nitrogen adsorption at low temperature and mercury injection at high pressure, and the full aperture was determined. The FHH model, Menger model, Sierpinski model, and a thermodynamic model were used to calculate the comprehensive fractal dimension of the coal samples over the full range of aperture. The fractal characteristics of the pores of medium- and low-rank coal were quantitatively analyzed, which provided a reference for the overall characterization of pore structure heterogeneity in this coalfield. The results show that the FHH model and thermodynamic model more accurately calculate the fractal dimensions of less and greater than the joint pore position, respectively. The comprehensive fractal dimension of the low-rank coal pore is 2.8005–2.8811 and that of medium rank coal is 2.5710–2.6147. When compared with the medium-rank coal, pores of the low-rank coal are more developed and they exhibit a more complex structure with stronger heterogeneity. The comprehensive fractal dimension of the pores is a negative correlation with average pore size, vitrinite content, and maximum vitrinite reflectance, and positive correlation with pore volume, pore specific surface area, inertinite content, and exinite content.
1. Introduction
The coal reserves in Xinjiang are 2.19 trillion tons, ranking first in China, among which the Zhunnan coal field is the main coal deposit and it consists of mostly middle- and low-rank coal. Coal is a complex heterogeneous porous medium. The pore structural features include pore size, specific surface area, volume, shape, and connectivity, all of which exert important influences on the occurrence and state of coal seam gas and the law of adsorption-desorption [1,2,3].
Recent studies have used a range of research methods for investigating the pore structure of coal, including adsorption [4], mercury injection [5], scanning electron microscopy [6], small-angle X-ray scattering [7], micro-CT [8], and nuclear magnetic resonance [9]. The inherent complexity of the coal structure makes the accurate structural characterization difficult while using traditional Euclidean geometry, so many scholars have used fractal mathematics to characterize the pore structure [10,11]. Yang Chao and Xi Zhaodong studied nanoscale fractal characteristics of coal pore structures from samples that were collected in different mining areas [12,13]. Lu Guanwen studied the applicability of the pore fractal model to structural coal [14]. Fu Haijiao and Wang Xiaoyao studied the fractal characteristics of the pore structure of low-rank coal [15,16]. Liu Kouqi established a characterization method that was applicable to the fractal characteristics of coal pore structure [17]. Wang Boyang used fractal dimension to characterize the degree of coal pore structural deformation [18]. Li Fengli used fractal models to analyze the fractal characteristics of the nanopore structure of primary coal and structural coal [19]. Zhou Shandong studied the correlation between pore structure and adsorption performance and fractal dimension of pores that were suitable for low-rank coal adsorption [20]. Xi Zhaodong analyzed pore structure and fractal characteristics of sapropelite [21]. Liu Gaofeng studied the fractal characteristics of coal samples of different grades from the Qianxi area [22].
In recent years, many studies have investigated the pore fractal characteristics and physical properties of coal seams in the Zhunnan coalfield of Xinjiang [23,24]. However, the characteristics of the pore fractal structure, application range of the fractal model, and the influential fractal factors of middle- and low-rank coal from the Zhunnan coalfield have not been systematically studied. This topic has important theoretical and practical significance in identifying the heterogeneity of the pore structure and evaluating gas extraction in the middle- and low-rank coal in the quasi-southern coalfield. The coal samples in this study were collected from typical coalmines in the Zhunnan coalfield of Xinjiang. The pore parameters were determined by nitrogen adsorption at low temperature and mercury injection at high pressure. Fractal dimensions of less and greater than the joint pore position are calculated while using the FHH model, Menger model, Sierpinski model, and a thermodynamic model. The comprehensive fractal model of full aperture section is optimized and the relationship between fractal dimensions and pore parameters and macerals is discussed. The fractal characteristics of the pores of medium- and low-rank coal were quantitatively analyzed, which provides a reference for the overall characterization of pore structure heterogeneity in this coalfield.
2. Experimental and Methods
2.1. Study Area and Sample Preparation
The Zhunnan coalfield is located in the southern region of the Junggar Basin in northern Xinjiang, China [16], and it is mostly middle- and low-rank coal. The coal samples were collected from typical mines of the southern coalfield, including the TunBao coal mine M14 coal seam (sample #1), ShiTiZiXiGou coal mine B2 coal seam (sample #2), JianGou coal mine #45 coal seam (sample #3), and LiuHuangGou coal mine 9–15 coal seam (sample #4). The middle-rank coal samples were collected from the B3 coal seam (sample #5) of the Xiaogangou coal mine, the -Aiweiergou 1890 coal mine #5 coal seam (sample #6), Aiweiergou 1930 coal mine #4 coal seam (sample #7), and Aiweiergou 2130 coal mine #6 coal seam (sample #8).
The coal samples were collected from the newly exposed coal wall on the normal tunneling face of the mine, sealed, and brought to the laboratory to ensure discriminability and representativeness. The metamorphic degree, coal structure, and coal rock type were recorded during the sample collection. Industrial analysis, porosity, and maceral tests were performed on the samples in the early stages. Eight types of coal samples with different maximum reflectance of vitrinite were selected for the experiments. In this paper, the industrial analysis of the coal samples is carried out according to the “Industrial Analysis Method of Coal” (GB/T212-2008) while using a fully automatic industrial analyzer. Table 1 shows the results.

Table 1.
Industrial analysis results of coal samples.
2.2. Experimental Procedure
2.2.1. Determination of Coal Macerals
A TIDAS MSP 200 microspectrophotometer, as manufactured by the J&M Analytik AG (Essingen, GER), were used to determine the proportion of coal macerals. A TIDAS MSP 200 microspectrophotometer with a wavelength range of 190–720 nm and spectral resolution of <7 nm was used to determine the maceral composition of the coal samples. Vitrinite reflectance microscopy determined the vitrinite reflectance (GB/T6948-2008). Microlithotype determination calculated the vitrinite reflectance (GB/T15590-2008).
2.2.2. Low-Temperature Nitrogen Adsorption Experiments
An ASAP2020 surface analyzer and pore-size distribution determiner, as manufactured by the Micromeritics Instrument Corporation (Norcross, GA, USA), were used to determine the pore parameters of the coal samples through low-temperature liquid nitrogen adsorption. The pore diameter test range is 1.7–316 nm. Pulverize the coal sample and select the coal sample with particle size of 0.5 mm. Subsequently, take 10 g coal sample and dry it for 6 h in a vacuum drying oven at 80 °C. After the coal sample is cooled, pressurized nitrogen injection is tested at 77 K.
2.2.3. High-Pressure Mercury Injection Experiments
An Auto Pore IV 9510 mercury injector, as manufactured by the Micromeritics Instrument Corporation (Norcross, GA, USA), was used to determine the pore parameters of the coal samples. The Auto Pore IV 9510 mercury injector with a pressure range of 0.1–413 MPa, pore diameter range of 3 nm to 370 μm, pressure point of 81, and an equilibrium time of 10 s was used to test the pore parameters of the coal samples. Pulverize the coal sample, select small pieces of 1 cm3, and then dry the coal sample for six hours in a vacuum drying oven at 80 °C. After the coal sample is cooled, it is loaded into the dilatometer, and then the dilatometer is vacuumized for the experiment.
3. Results and Discussion
Table 2 lists the test results of the macerals and pore parameters. The Xодот B.B. pore classification system was used to classify the pores into micropores (<10 nm), transition pores (10–100 nm), mesoporous pores (100–1000 nm), and macropores (>1000 nm) [25]. Although the pore structure test results may differ for a comparable coal sample, owing to differences in testing method, instrument error, or other reasons, test results of the same aperture should be the same or the smallest difference in the overlapping section of the test range. A combination of nitrogen adsorption and mercury injection methods was used to study the pore distribution characteristics in the full pore size range to more comprehensively characterize the coal pore characteristics.
Table 2.
The test results of pore parameters and macerals.
Nitrogen adsorption is the main method for micropores, whereas mercury injection is the main method for the middle and large pores. The pore size of the joint pore location should not exceed the range of the respective test methods and the pore specific surface area increment or pore volume increment of the same pore size should be the smallest. This can be obtained from the above principles that the combined hole location of the experimental coal samples is 50–60 nm for the low-rank coal and 85–90 nm medium-rank coal, both of which are located in the transition hole section, as shown in Figure 1 and Figure 2. The low rank coal is mainly microporous. The minimum values of the pore surface area difference and pore volume difference measured by the two methods are close to the micropore side. The proportion of micropores in medium coal is smaller than that in low coal. The minimum values of the difference of specific surface area and the pore volume that are measured by the two methods are remote from the micropore side.
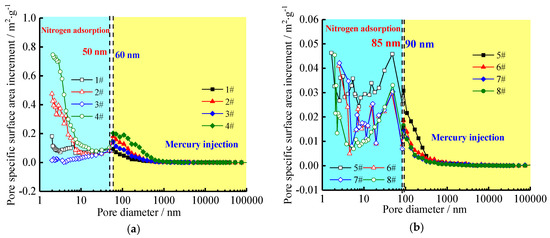
Figure 1.
Specific surface distribution feature of full aperture. (a) Distribution characteristics of low-rank coal; (b) Distribution characteristics of medium-rank coal.
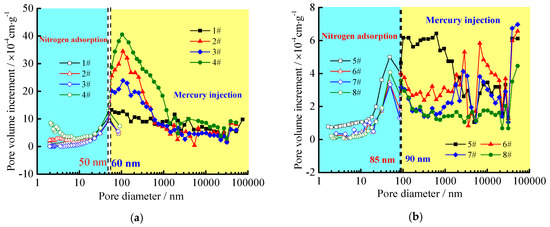
Figure 2.
Pore volume distribution feature of full aperture. (a) Distribution characteristics of.low-rank coal; (b) Distribution characteristics of medium-rank coal.
Table 3 shows the pore parameters in the full aperture section of the coal sample obtained by the combined nitrogen adsorption and mercury injection methods.
Table 3.
The pore parameters of full aperture of coal samples.
The range of average pore diameter of the entire pore diameter section of the coal sample is 2.59–12.44 nm, among which the range of average pore diameter of the low-rank coal is 2.59–10.25 nm. The range of average pore diameter of middle-rank coal is 6.38–12.44 nm and the range of average pore diameter of middle-rank coal is larger than that of low-rank coal. The pore specific surface area of the coal sample is 0.3709–10.5872 m2·g−1, among which the average pore specific surface area of the low-rank coal is 5.3322 m2·g−1 and that of the medium-rank coal is ten times smaller (0.4944 m2·g−1). The pore volume of the coal samples was 0.0069–0.0685 cm3·g−1 and the pore volume of low-rank coal was 0.0331–0.0685 cm3·g−1, with an average of 0.0457 cm3·g−1. The pore volume of the medium-rank coal was 0.0069–0.0161 cm3·g−1, with an average of 0.0111 cm3·g−1, smaller than that of low rank coal.
3.1. Fractal Dimension Calculation of Coal Pores
3.1.1. Fractal Dimension Based on FHH Model
Avnir established the FHH equation of gas adsorption theory on a fractal surface in a capillary condensation region [26,27].
In the equation, Pg is the adsorption equilibrium pressure (MPa), P0 is the saturated vapor pressure that is reached by gas adsorption (MPa), Vg is the gas adsorption capacity at the adsorption equilibrium pressure (cm3/g), V0 is the volume of adsorbed gas in a single molecular layer (cm3/g), A1 is the power exponent, which has a linear relationship with the fractal dimension D1, and its value is the slope of the line between ln(Vg/V0) and ln[ln(P0/Pg)], and the fractal dimension D1 = 3 + A1.
Equation (1) is used to calculate the fractal dimension of pores with a diameter smaller than the joint hole, according to the experimental nitrogen adsorption data. Figure 3 is the fitting curve of the FHH model. In the FHH fractal curve, the curves of medium and low rank coal show linear decreasing relationship, and the change trend is basically the same. Table 4 lists the fractal dimension of coal samples with pore diameters that are smaller than the joint hole. In Table 4, x is ln[ln(P0/Pg)] and y is ln(Vg). The FHH model is used to calculate the fractal dimension of the pore diameter smaller than the joint pore size. The low-rank coal is 2.7835–2.8626, which is larger than the medium-rank coal (2.5554–2.6915). The correlation is 92.95–99.24%.
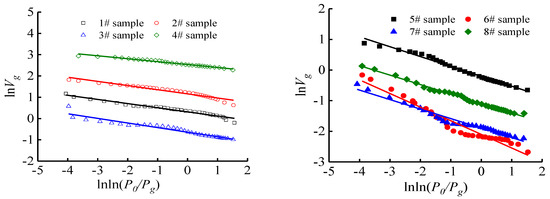
Figure 3.
FHH model fitting curves.
Table 4.
Pore fractal dimension based on FHH model.
3.1.2. Fractal Dimension Based on the Menger Sponge Model
The porous materials of the coal and rock are assumed to be a regular cube and the Menger sponge model was derived [19].
In the equation, Vm is the amount of mercury in the sample (cm3/g), Pm is the mercury injection test pressure (MPa), A2 is the power exponent, which has a linear relationship with the fractal dimension D2 and its value is the slope of ln(dVm/dPm) and lnPm, and the fractal dimension D2 = 4 + A2. According to the experimental mercury injection data, the fitting curve of the coal samples with the full aperture section under the Menger model is obtained by Equation (2), as shown in Figure 4. Table 5 shows the fractal dimension D2 of the coal samples, where x is lnPm and y is ln(dVm/dPm).
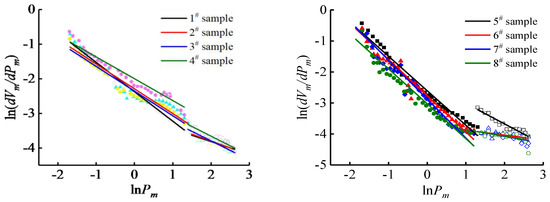
Figure 4.
Menger model fitting curves.
Table 5.
Fractal dimension based on Menger model.
It can be seen from Figure 4 and Table 5 that the fractal dimension of the pore size smaller than the combined pore size is >3, in which the low-rank coal is 3.4409–3.6375 and the medium-rank coal is 3.3397–3.8418. The pore diameter that is greater than the fractal dimension D22 of the combined hole section is 2.7450–3.3688, with an average of 3.0536. The low-rank coal is 3.1505–3.3688 and the medium-rank coal is 2.7450–2.88884.
3.1.3. Fractal Dimension Based on the Sierpinski Model
A unit square is divided into nine small squares, with a side length of 1/3, and one small square is removed from the center while maintaining the remaining eight squares. The iteration is repeated n times to form fractal geometry, namely the Sierpinski carpet [19]. The fractal dimension of the surface is defined.
In the equation, a is a constant and Pt is the threshold pressure (i.e., the pressure when mercury saturation is 10% [28]). A mercury volume-pressure diagram is initially made to determine the slope of each pressure point. The slope that corresponds to different pressures is then marked on the coordinate system, and the pressure corresponding to the point with the maximum slope is defined as the threshold pressure Pt.
The logarithm of both sides is taken from the above equation to obtain Equation (4):
where A3 is the power exponent, which has a linear relationship with the fractal dimension D3, and its value is the slope of the line of ln(Vm) and ln(Pm/Pt), and the fractal dimension of the pore volume is D3 = 3 − A3.
According to the experimental mercury injection data, the fitting curve of samples over the full aperture range can be obtained while using the Sierpinski model through Equation (4), as shown in Figure 5. Table 6 shows the calculated fractal dimension D3, in which x is ln(Pm/Pt) and y is ln(Vm).
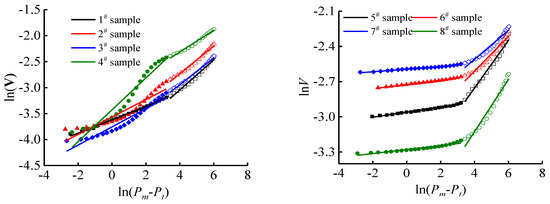
Figure 5.
Sierpinski model fitting curve.
Table 6.
Fractal Dimension based on the Sierpinski Model.
According to Figure 5 and Table 6, R312 is 0.9568–0.9874 and the fractal dimension D31 is 2.7111–2.8768. The low-rank coal is 2.7111–2.7911 and the medium-rank coal is 2.7771–2.7868. The R322 is 0.8820–0.9962 and the fractal dimension D32 is 2.7936–2.9887. The low-rank coal is 2.7936–2.8718 and the medium-rank coal is 2.9787–2.9887.
3.1.4. Fractal Model Based on a Thermodynamic Model
As pressure increases, the amount of added mercury and pore surface energy increases. The work done by the external environment on the mercury is equal to the increase of surface energy of the mercury solution entering the pores. The increase of mercury input and pore surface can satisfy the following equation [19]:
where Wn is the surface energy of a hole (J), γL is the surface tension between the mercury and pore surface (J/m), θ is the contact angle of the mercury with the pore surface (°), and S is the pore surface area (m2).
The expressions of incremental Qn of mercury injection and the corresponding surface energy Wn are as follows:
Equation (6) is modified to obtain Equation (7) [13]:
where Vn is pore volume (cm3/g), rn is the aperture (nm), and D4 is the fractal dimension of the pore surface that was obtained by linear fitting of ln(Vn1/3/rn) and ln(Wn/rn2).
According to the experimental mercury injection data, the thermodynamic model fitting curve of the full aperture section is calculated by Equation (7), as shown in Figure 6. Table 7 shows the calculated fractal dimension D3 of the coal samples, where x is ln(Vn1/3/rn) and y is ln(Wn/rn2)).
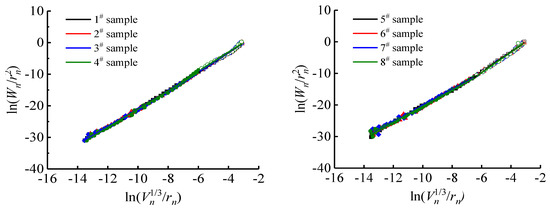
Figure 6.
Thermodynamic model fitting curve.
Table 7.
Fractal dimension that is based on thermodynamic model.
As shown in Figure 6 and Table 7, when the experimental pressure that corresponds to the pore diameter smaller than the joint pore section is greater than 10 MPa, it is not used as the quantitative standard for sample heterogeneity. The fractal dimension D42 of the pore diameter is 2.5412–2.8854 and the correlation coefficient R422 is 0.9915–0.9982, showing a high correlation. The average fractal dimension of low-order coal is 2.8347 and higher than that of medium-order coal (2.5747).
3.2. Comprehensive Fractal Model and Coal Pore Characteristics
3.2.1. Fractal Model Selection with Aperture Smaller than the Joint Hole Segment
The fractal dimension of pores smaller than each coal sample in the combined pore section was calculated on the basis of the FHH model, Menger sponge model, Sierpinski model, and thermodynamic model. According to fractal geometry theory, the fractal dimension of porous solid media is usually 2–3. Cai pointed out that the coal reservoir is highly metamorphic or fractured, when the fractal dimension exceeds 3 [29]. Friesen reported that during mercury injection experiments, compressibility failure occurs in coal fractures and pores when the pressure is >10 MPa, which results in a fractal dimension >3. When the pressure is <10 MPa, the fractal dimension ranges from 2 to 3 [28].
The fractal dimension that was calculated by the Menger sponge model and thermodynamic model that is smaller than the combined hole section is larger than 3 (i.e., the corresponding test pressure is >10 MPa), losing its representational significance, owing to experimental errors associated with the mercury injection method. Meanwhile, previous studies have shown that the Menger model is not suitable for calculating the fractal dimension of pores smaller than 72 nm [19].
In general, as the coal chemical deterioration degree increases, the orderliness of the coal structure increases, the irregularity of microporous surface decreases, and the fractal dimension decreases [30]. Although the fractal dimension D31 that is calculated by the Sierpinski model is between 2 and 3, the fractal dimension of low-rank coal is smaller than that of medium-rank coal, which differs from most previous conclusions [19,31,32]. Therefore the Sierpinski model is not applicable to calculate a fractal dimension that is smaller than the pores in the joint pore segment.
A large number of studies have shown that nitrogen adsorption is a more accurate method when measuring the characteristics of pore parameters below 100 nm [33]. The FHH fractal curve has regularity uniformity, the correlation reaches 0.9295–0.9924, and the fractal dimension of the low-rank coal is larger than that of middle-rank coal. Therefore, FHH model calculated the fractal dimension smaller than the porosity of the joint pore segment.
3.2.2. Fractal Model Selection with Aperture Larger than that of the Link Hole Segment
Owing to the limited testing range of the nitrogen adsorption method, the Menger sponge model, Sierpinski model, and thermodynamic model based on mercury injection experiments were used to calculate the fractal dimension larger than the coupling section. The correlation was 0.9014–0.9869 (mean 0.9347), 0.882–0.9962 (mean 0.9546), 0.9915–0.9982 (mean 0.9960), and the fitting degree R422 = 0.9960 > R322 = 0.9546 > R222 = 0.9347. The thermodynamic model calculates the fractal dimension larger than the pores in the coupling section because the thermodynamic model has the highest correlation.
3.3. Comprehensive Fractal Dimension of Coal Pores
Although different fractal models represent different pore meanings, the calculated fractal dimensions of coal pores cannot be directly compared. Conversely, fractal dimensions that were calculated using the same model reflect differences in pore structure. The pore volume ratio of different pore diameter segments is used as the weight value to quantitatively characterize the complexity of the coal structure and its surface roughness. The fractal dimension of different pore diameter segments is weighted and summed [34] to obtain the comprehensive fractal dimension:
where Dt is the comprehensive fractal dimension of coal, Di is the fractal dimension of the ith aperture segment, and Ti is the pore volume ratio of the ith pore diameter section (%).
The pore volumes V1 and V2 are smaller and larger than the joint pore section, respectively, and they were calculated according to the joint pore range. The proportion of pore volume was also calculated. The comprehensive fractal dimension was calculated according to Equation (8), as shown in Table 8.
Table 8.
Comprehensive fractal dimension of full aperture.
It can be seen from Table 8 that the pore volume smaller than the combined pore section is 0.0013–0.013037 cm3·g−1, accounting for 7.62%–16.37% with an average of 10.26%. The pore volume larger than the joint pore section is 0.005528–0.055428 cm3·g−1, which accounts for 83.63% to 92.48% with an average of 89.74%. The comprehensive fractal dimension of pores of the experimental coal samples ranges from 2.5710 to 2.8811, in which the low-rank coal is 2.8005–2.8811 with an average of 2.8319, and the medium-rank coal is 2.5710–2.6147 with an average of 2.5890. Low-rank coal pores are more developed and more heterogeneous.
3.4. Relationship between the Comprehensive Fractal Dimension and Pore Parameters
Figure 7 shows the relationship between the comprehensive fractal dimension of pores in the coal samples and pore parameters (in the figure, dm is the average pore diameter (nm), Sm is specific surface area of pores (m2/g), and Vm is pore volume (cm3/g)).
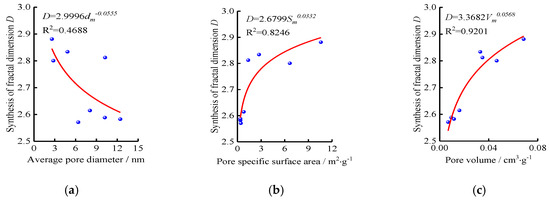
Figure 7.
Relation between comprehensive fractal dimension and pore parameters. (a) relation between comprehensive fractal dimension and average pore diameter; (b) relation between comprehensive fractal dimension and pore specific surface area; (c) relation between comprehensive fractal dimension and pore volume.
The larger the fractal dimension of pores, the more complicated the pore structure, the rougher the surface, the larger the proportion of micropores, and the smaller the average pore diameter, according to the traditional view. However, it can be seen from Figure 7a that the correlation between the two is poor and there is no direct relationship, which indicates that the small average pore size cannot directly reflect the strong adsorption capacity. The fractal dimension mainly represents the distribution of the pores in three-dimensional space, so it has no direct relationship with the pore size. In addition, it can be seen from Figure 7b,c that the comprehensive fractal dimension has high positive correlation with the pore specific surface area and pore volume. The average pore diameter cannot be used to directly characterize the pore specific surface area and pore volume due to the irregularity of the pores. However, pores with large pore specific surface area and large pore volume have smaller average pore diameters, so there is a correlation between the comprehensive fractal dimension and the average pore diameter. Figure 7 shows that the comprehensive fractal dimension decreases with an increasing average pore diameter and it increases with an increasing pore specific surface area and pore volume. Smaller pore diameters are associated with stronger structural heterogeneity, more complex shape, and larger fractal dimension. In addition, the adsorption of gas to coal is primarily pore surface adsorption, and the larger specific surface area is indicative of the strong adsorption capacity. Rougher surfaces are associated with stronger adsorption capacity and larger fractal dimension. The comprehensive fractal model reflects the irregularity and complexity of the pore structure.
3.5. Relationship between Pore Fractal Dimension and Macerals
The experimental results indicate a relationship between comprehensive pore fractal dimension and the reflectance of vitrinite content, inertinite content, and exinite content (Figure 8). In Figure 8, VI is the vitrinite content (%), IN and CH are the inertinite and exinite content (%), respectively, and R0 is the maximum vitrinite group reflectivity (%).
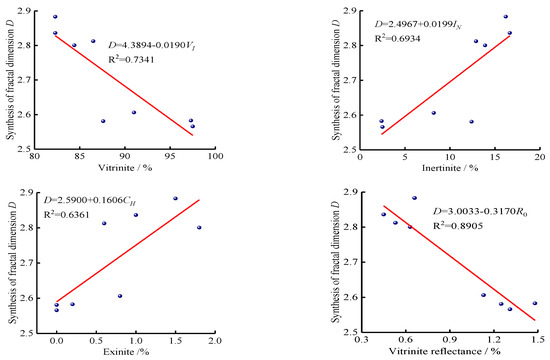
Figure 8.
Relation between comprehensive fractal dimension and macerals.
Figure 8 also shows that the comprehensive pore fractal dimension has a linear function relationship with VI, IN, CH, and maximum vitrinite group reflectance. The fractal dimension of pores decreases with an increasing VI and maximum reflectivity. The main reason is that the maximum reflectance of vitrinite group reflects the metamorphic degree of the coal. As the maximum reflectance of vitrinite group increases, the degree of coalification increases, the ordering of coal molecules increases, and the fractal dimension gradually decreases. The maceral content in coal is indicative of the degree of metamorphism [35]. The pore fractal dimension decreases with increasing vitrinite content and it increases with increasing inertinite and exinite content.
4. Conclusions
The FHH model is adopted to calculate the fractal dimension of the full aperture section that is smaller than the range of combined holes. The fractal dimension of low-rank coal is 2.7835–2.8626 and that of medium-rank coal is 2.5554–2.6915. The fractal dimension that is larger than the combined hole range was calculated while using the thermodynamic model. The average value of the medium- and low-rank coal is 2.5747 and 2.8347, respectively. The comprehensive fractal dimension of the entire aperture section of the experimental coal samples is 2.5710–2.8811. The comprehensive fractal dimension of the low-rank coal is 2.8005–2.8811, and that of the medium-rank coal is 2.5710–2.6147. Low-rank coal pores are more developed and more heterogeneous than the medium-rank coal pores. The comprehensive fractal dimension decreases with increasing average pore diameter, vitrinite content, and maximum vitrinite group reflectance, and it increases with increasing pore specific surface area, pore volume, inertinite content, and exinite content. In this paper, eight typical coal samples from xinjiang junnan coalfield are selected. More mine samples should be added in the future to make the results more general.
Author Contributions
Conceptualization, H.L.; Data curation, Y.B.; Formal analysis, Y.B. and J.B.; Funding acquisition, S.L.; Investigation, M.Y. and P.Z.; Methodology, H.L. and J.B.; Resources, S.L. and M.Y.; Supervision, L.Q.; Writing—original draft, H.L.; Writing—review & editing, Y.B. All authors have read and agreed to the published version of the manuscript.
Funding
This research was funded by the National Natural Science Foundation of China (no. 51674192, no. 51604220, no. 51734007, no. 51874236) and Natural Science Foundation of Shaanxi Province (no. 2019jlp-02).
Acknowledgments
This study is supported by the National Natural Science Foundation of China (no. 51674192, no. 51604220, no. 51734007, no. 51874236) and Natural Science Foundation of Shaanxi Province (no. 2019jlp-02).
Conflicts of Interest
The authors declare no conflict of interest.
References
- Nie, B.; Liu, X.; Yang, L.; Meng, J.; Li, X. Pore structure characterization of different rank coals using gas adsorption and scanning electron microscopy. Fuel 2015, 158, 908–917. [Google Scholar] [CrossRef]
- Clarkson, C.R.; Bustin, R.M. The effect of pore structure and gas pressure upon the transport properties of coal: A laboratory and modeling study. 2. adsorption rate modeling. Fuel 1999, 78, 1345–1362. [Google Scholar] [CrossRef]
- Tao, S.; Chen, S.; Tang, D.; Zhao, X.; Xu, H.; Li, S. Material composition, pore structure and adsorption capacity of low-rank coals around the first coalification jump: A case of eastern junggar basin, china. Fuel 2018, 211, 804–815. [Google Scholar] [CrossRef]
- Mastalerz, M.; Hampton, L.B.; Drobniak, A.; Loope, H. Significance of analytical particle size in low-pressure N2 and CO2 adsorption of coal and shale. Int. J. Coal. Geol. 2017, 178, 122–131. [Google Scholar] [CrossRef]
- Su, P.H.; Xia, Z.H.; Wang, P.; Ding, W.; Hu, Y.P.; Zhang, W.Q.; Peng, Y.J. Fractal and Multifractal Analysis of Pore Size Distribution in Low Permeability Reservoirs Based on Mercury Intrusion Porosimetry. Energies 2019, 12, 1337. [Google Scholar] [CrossRef]
- Meng, Z.Y.; Yang, Z.Y.; Yin, Z.Q.; Li, Y.Y.; Song, X.Y.; Zhao, J.J. Effects of coal slime on the slurry ability of a semi-coke water slurry. Powder Technol. 2020, 359, 261–267. [Google Scholar] [CrossRef]
- Li, W.; Jiang, B.; Moore, T.A.; Wang, G.G.X.; Liu, J.G.; Song, Y. Characterization of the chemical structure of tectonically deformed coals. Energ. Fuel 2017, 31, 6977–6985. [Google Scholar] [CrossRef]
- Hilonga, A.; Kim, J.K.; Sarawade, P.B.; Kim, H.T. Rapid synthesis of homogeneous titania-silica composite with high-bet surface area. Powder Technol. 2010, 199, 284–288. [Google Scholar] [CrossRef]
- Zhao, Y.; Sun, Y.; Liu, S.; Wang, K.; Jiang, Y. Pore structure characterization of coal by NMR cryoporometry. Fuel 2017, 190, 359–369. [Google Scholar] [CrossRef]
- Song, H.; Xuexing, S.; Youhui, X.; Jun, X.; Min, L.; Peisheng, L. Percolation research on fractal structure of coal char. Energ. Fuel 2002, 16, 1128–1133. [Google Scholar] [CrossRef]
- Wang, Z.; Pan, J.; Hou, Q.; Yu, B.; Li, M.; Niu, Q. Anisotropic characteristics of low-rank coal fractures in the fukang mining area, China. Fuel 2018, 211, 182–193. [Google Scholar] [CrossRef]
- Yang, C.; Zhang, J.; Wang, X.; Tang, X.; Gong, X. Nanoscale pore structure and fractal characteristics of marine-continental transitional shale: A case study from the lower permian shanxi shale in the southeastern ordos basin, china. Mar. Petrol. Geol. 2017, 88, 54–68. [Google Scholar] [CrossRef]
- Xi, Z.; Tang, S.; Zhang, S.; Li, J. Nano-scale pore structure of marine-continental transitional shale from liulin area, the eastern margin of ordos basin, china. J. Nanosci. Nanotechnol. 2017, 17, 6109–6123. [Google Scholar] [CrossRef]
- Lu, G.W.; Wang, J.L.; Wei, C.T.; Song, Y.; Yan, G.Y.; Zhang, J.J. Pore fractal model applicability and fractal characteristics of seepage and adsorption pores in middle rank tectonic deformed coals from the huaibei coal field. J. Petrol. Sci. Eng. 2018, 171, 808–817. [Google Scholar] [CrossRef]
- Fu, H.; Tang, D.; Xu, T.; Xu, H.; Tao, S.; Li, S. Characteristics of pore structure and fractal dimension of low-rank coal: A case study of Lower Jurassic Xishanyao coal in the southern Junggar Basin, NW China. Fuel 2017, 193, 254–264. [Google Scholar] [CrossRef]
- Yao, W.X.; Bo, Z.L.; Dong, Z.S.; Xiong, S.J.; He, T. Assessment of micro-pore structure fractal model evaluation of low-rank coal reservoirs. Nat. Gas Geosci. 2018, 29, 277–288. [Google Scholar]
- Liu, K.Q.; Ostadhassan, M.; Kong, L.Y. Multifractal characteristics of longmaxi shale pore structures by N2, adsorption: A model comparison. J. Petrol. Sci. Eng. 2018, 168, 330–341. [Google Scholar] [CrossRef]
- Wang, B.; Qin, Y.; Shen, J.; Zhang, Q.; Wang, G. Pore structure characteristics of low- and medium-rank coals and their differential adsorption and desorption effects. J. Petrol. Sci. Eng. 2018, 165, 1–12. [Google Scholar] [CrossRef]
- Li, F.L.; Jiang, B.; Cheng, G.X.; Song, Y.; Tang, Z. Structural and evolutionary characteristics of pores-microfractures and their influence on coalbed methane exploitation in high-rank brittle tectonically deformed coals of the yangquan mining area, northeastern qinshui basin, China. J. Petrol. Sci. Eng. 2019, 174, 1290–1302. [Google Scholar] [CrossRef]
- Zhou, S.; Liu, D.; Cai, Y.; Yao, Y.; Liu, Z. Multi-scale fractal characterizations of lignite, subbituminous and high-volatile bituminous coals pores by mercury intrusion porosimetry. J. Nat. Gas Sci. Eng. 2017, 44, 338–350. [Google Scholar] [CrossRef]
- Xi, Z.; Tang, S.; Zhang, S.; Sun, K. Pore structure characteristics of marine–continental transitional shale: A case study in the qinshui basin, china. Energ. Fuel 2017, 31, 7854–7866. [Google Scholar] [CrossRef]
- Liu, G.; Weng, H.; Song, Z.; Ren, J. Study on the adsorption mechanism of gas of deep coal seams based on the characteristics of the coal pore fractal medium. J. Comput. Theor. Nanosci. 2015, 12, 2724–2731. [Google Scholar] [CrossRef]
- Lin, H.F.; Bu, J.T.; Yan, M.; Bai, Y. Joint analysis of pore structure characteristics of middle and low rank coal with nitrogen adsorption and mercury intrusion method. J. Xi’an Univers. Sci. Technol. 2019, 39, 1–8. [Google Scholar]
- Yan, M.; Bai, Y.; Li, S.G.; Lin, H.F.; Yan, D.J.; Shu, C.M. Factors influencing the gas adsorption thermodynamic characteristics of low-rank coal. Fuel 2019, 248, 117–126. [Google Scholar] [CrossRef]
- Xодот, B.B. Coal and Gas Outburst; Song, S.Z.; Wang, Y.A., Translators; Industry Press: Beijing, China, 1966. [Google Scholar]
- Avnir, D.; Jaroniec, M. An isotherm equation for adsorption on fractal surfaces of heterogeneous porous materials. Langmuir 1989, 5, 1431–1433. [Google Scholar] [CrossRef]
- Jaroniec, M. Evaluation of the Fractal Dimension from a Single Adsorption Isotherm. Langmuir 1995, 11, 2316–2317. [Google Scholar] [CrossRef]
- Friesen, W.I.; Ogunsola, O.I. Mercury porosimetry of upgraded western Canadian coals. Fuel 1995, 74, 604–609. [Google Scholar] [CrossRef]
- Cai, Y.; Liu, D.; Pan, Z.; Yao, Y.; Li, J.; Qiu, Y. Pore structure and its impact on CH4 adsorption capacity and flow capability of bituminous and subbituminous coals from northeast china. Fuel 2013, 103, 258–268. [Google Scholar] [CrossRef]
- Tang, J.; Feng, L.; Li, Y.; Liu, J.; Liu, X. Fractal and pore structure analysis of shengli lignite during drying process. Powder Technol. 2016, 303, 251–259. [Google Scholar] [CrossRef]
- Li, S.G.; Bai, Y.; Lin, H.F.; Yan, M.; Laiwang, B.; Shu, Q.M. Molecular simulation of adsorption of gas in coal slit model under the action of liquid nitrogen. Fuel 2019, 255, 115775. [Google Scholar] [CrossRef]
- Bu, H.L.; Ju, Y.W.; Tan, J.Q.; Wang, G.C.; Li, X.S. Fractal characteristics of pores in non-marine shales from the Huainan coalfield, eastern China. J. Nat. Gas Sci. Eng. 2015, 24, 166–177. [Google Scholar] [CrossRef]
- Chen, F.; Lu, S.; Ding, X.; He, X.; Xing, H. The splicing of backscattered scanning electron microscopy method used on evaluation of microscopic pore characteristics in shale sample and compared with results from other methods. J. Petrol. Sci. Eng. 2018, 160, 207–218. [Google Scholar] [CrossRef]
- Ren, J.G.; Zhang, G.C.; Song, Z.M.; Liu, G.F.; Li, B. Comprehensive fractal description of porosity of coal of different ranks. Sci. World J. 2014, 4, 1–7. [Google Scholar] [CrossRef] [PubMed]
- Ouyang, Z.; Liu, D.; Cai, Y.; Yao, Y. Investigating the fractal characteristics of pore-fractures in bituminous coals and anthracites through fluid flow behavior. Energ. Fuel 2016, 30, 10348–10357. [Google Scholar] [CrossRef]


© 2019 by the authors. Licensee MDPI, Basel, Switzerland. This article is an open access article distributed under the terms and conditions of the Creative Commons Attribution (CC BY) license (http://creativecommons.org/licenses/by/4.0/).