Application of a GIS-Based Fuzzy Multi-Criteria Evaluation Approach for Wind Farm Site Selection in China


Abstract
:
1. Introduction
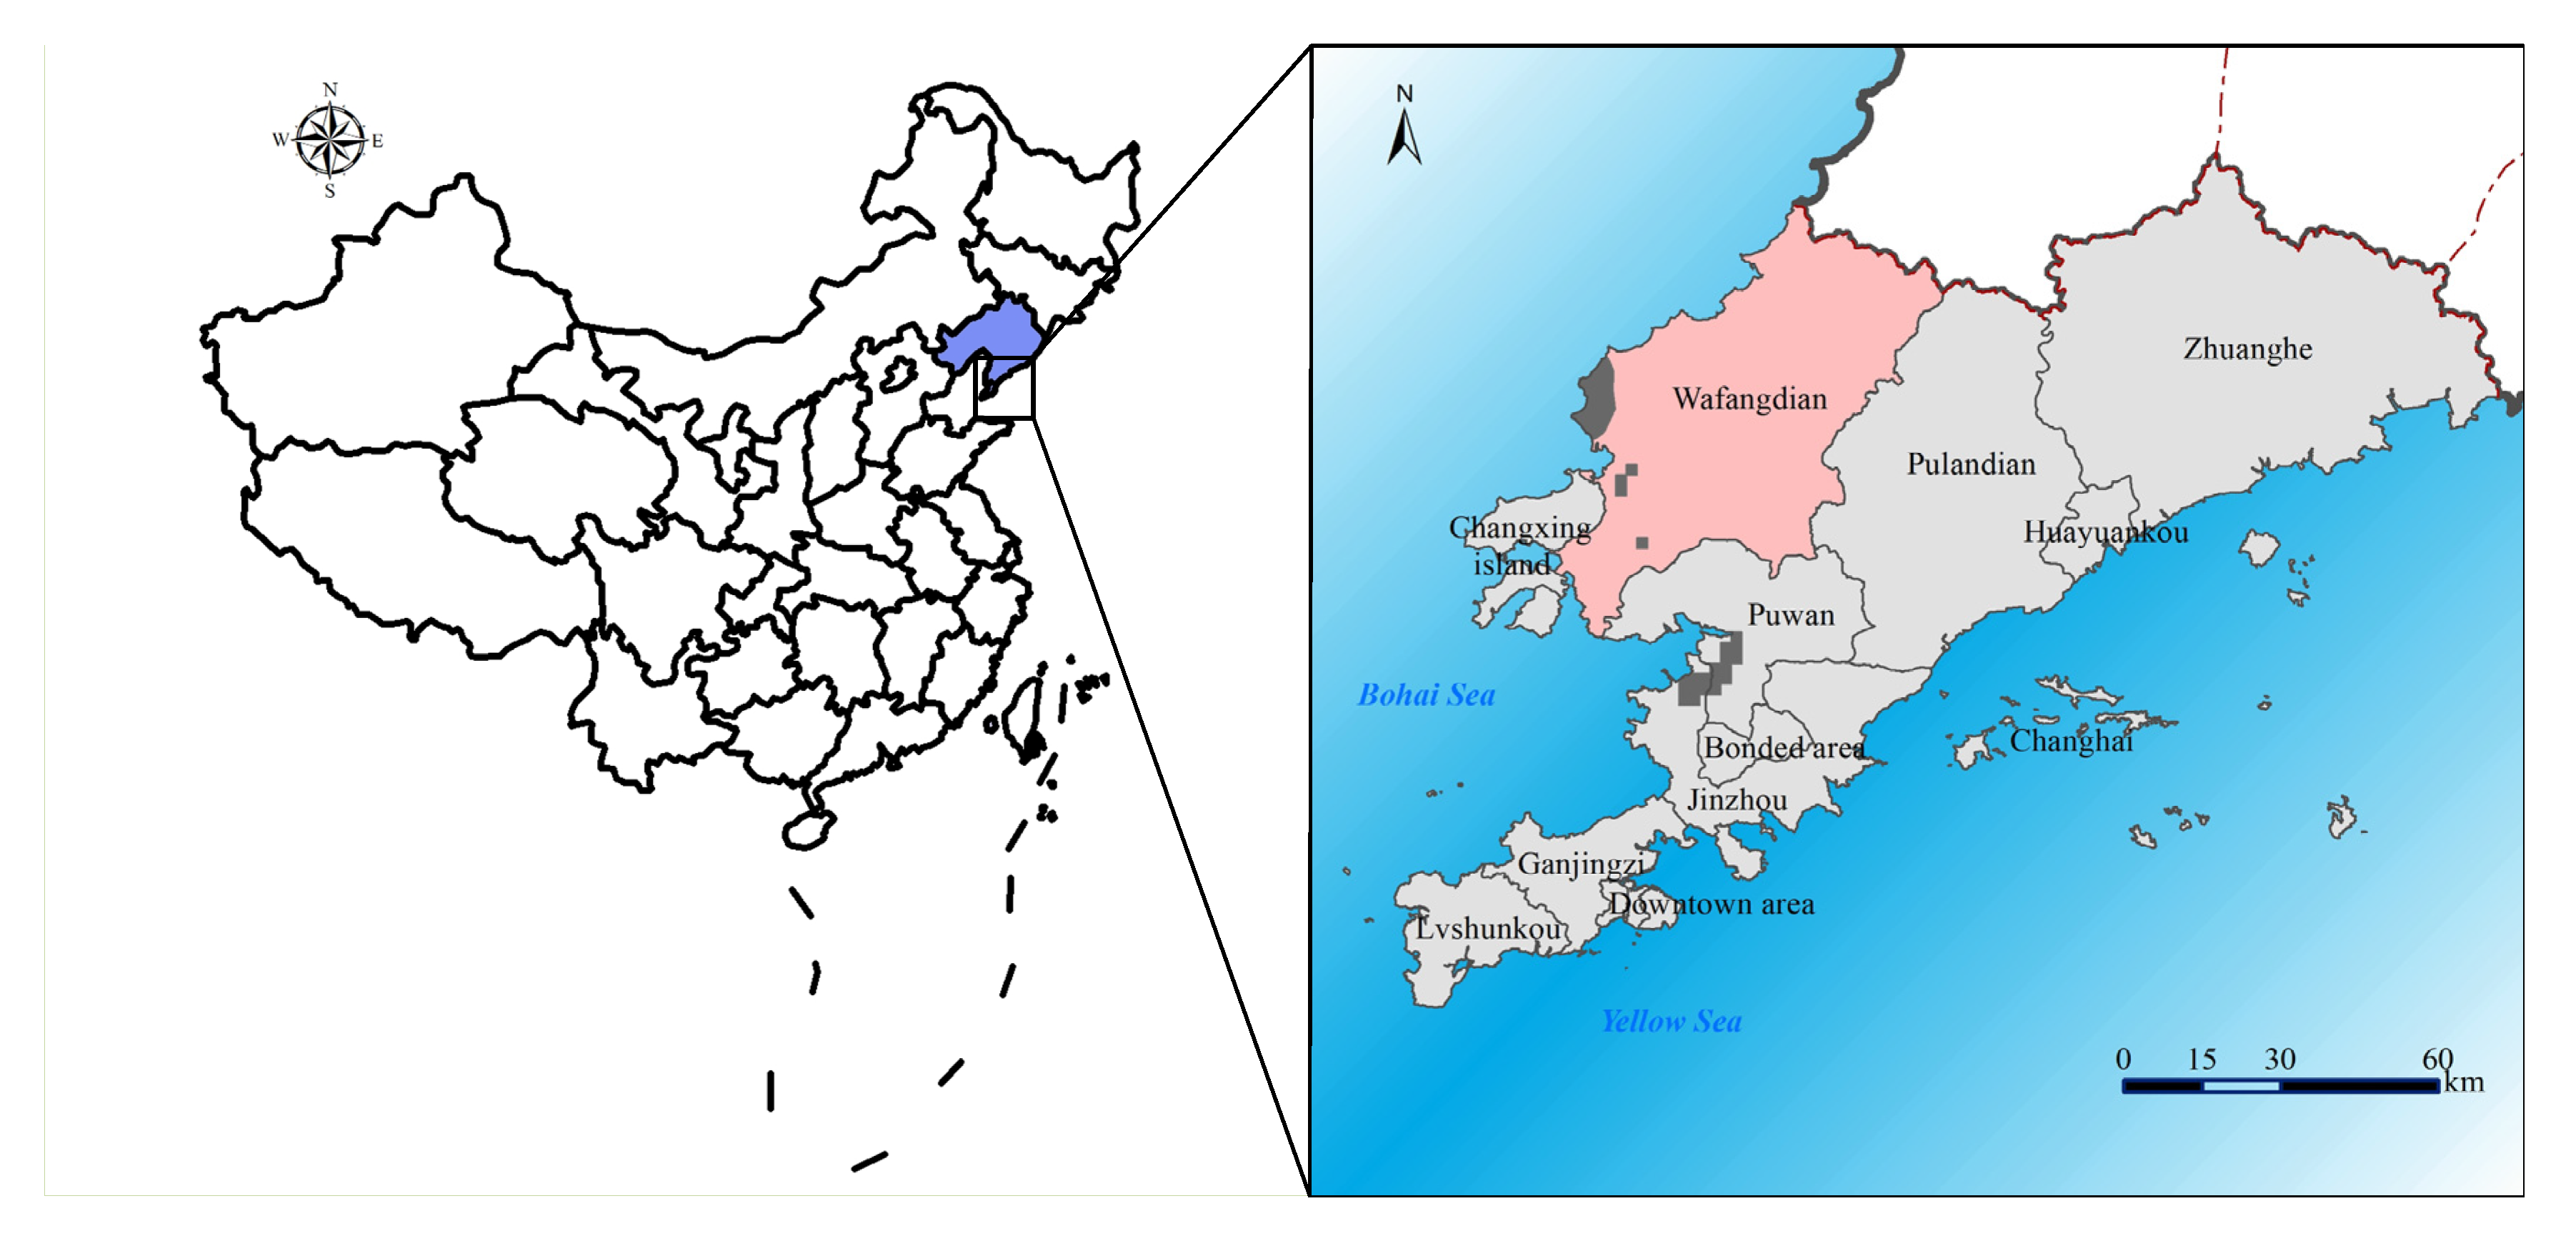
2. Study Area
2.1. Overview of Studied Region
2.2. The Necessity of Wind Energy Development
3. Methodology
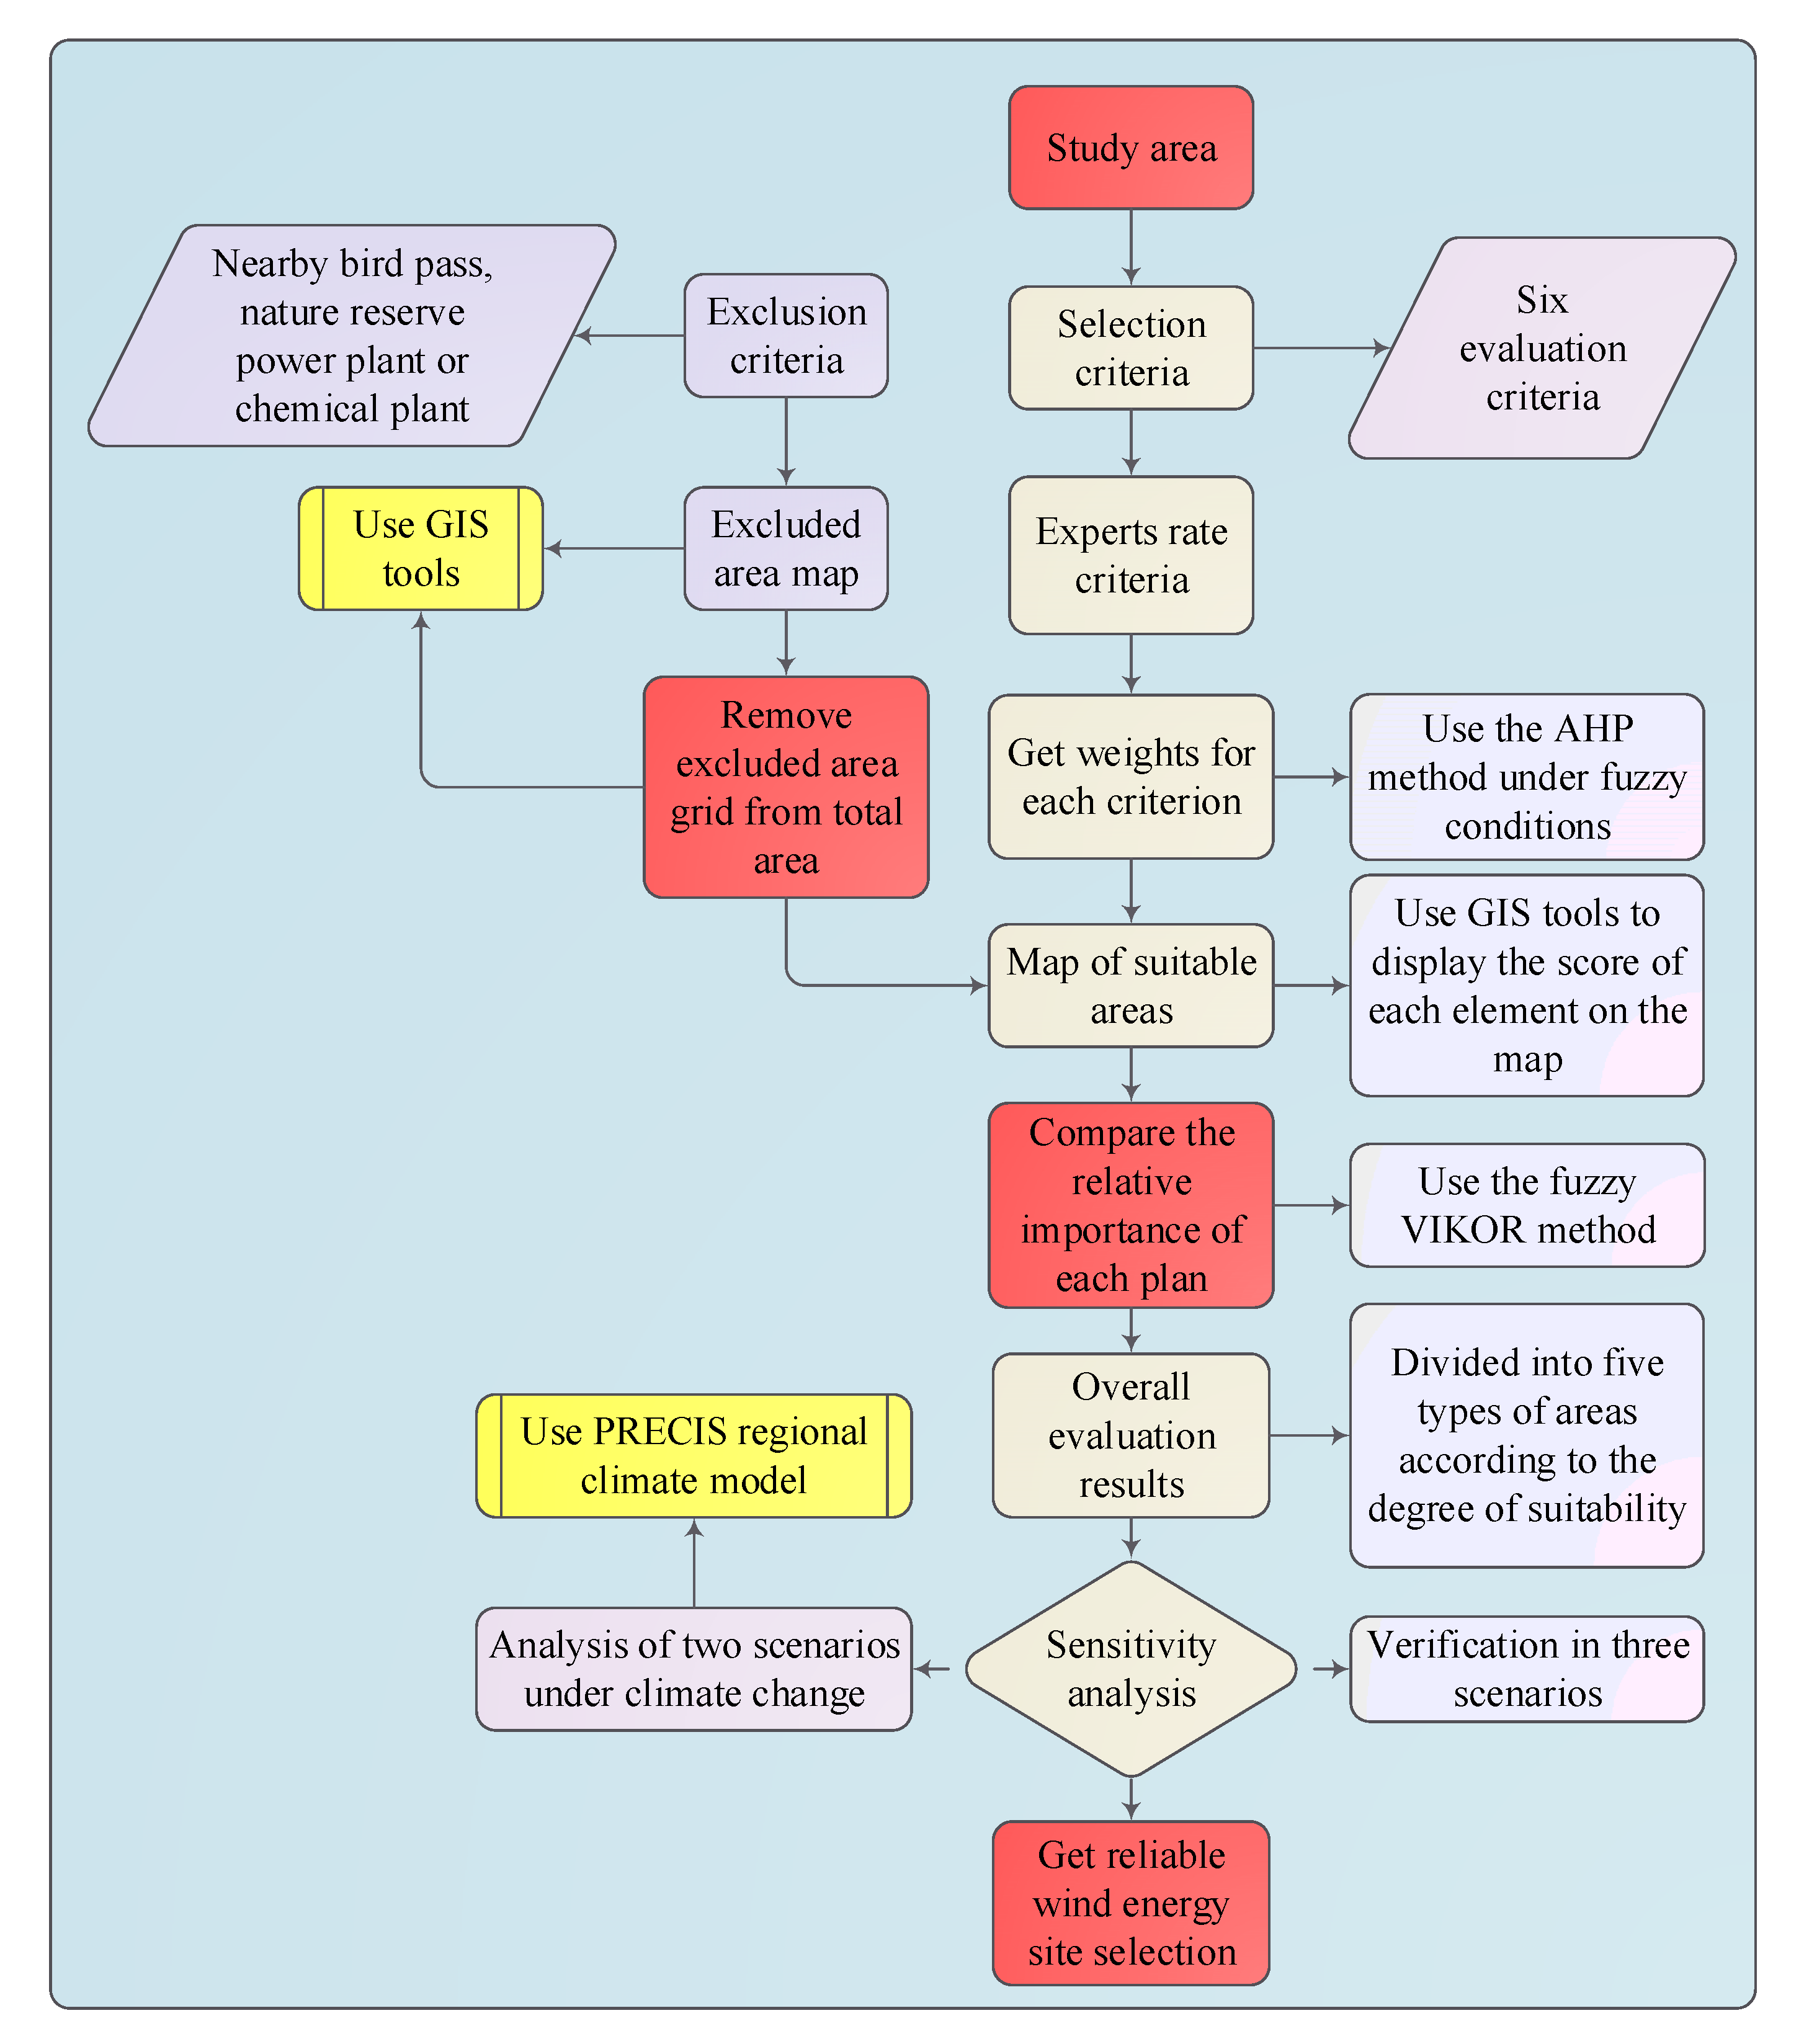
3.1. Methodological Framework
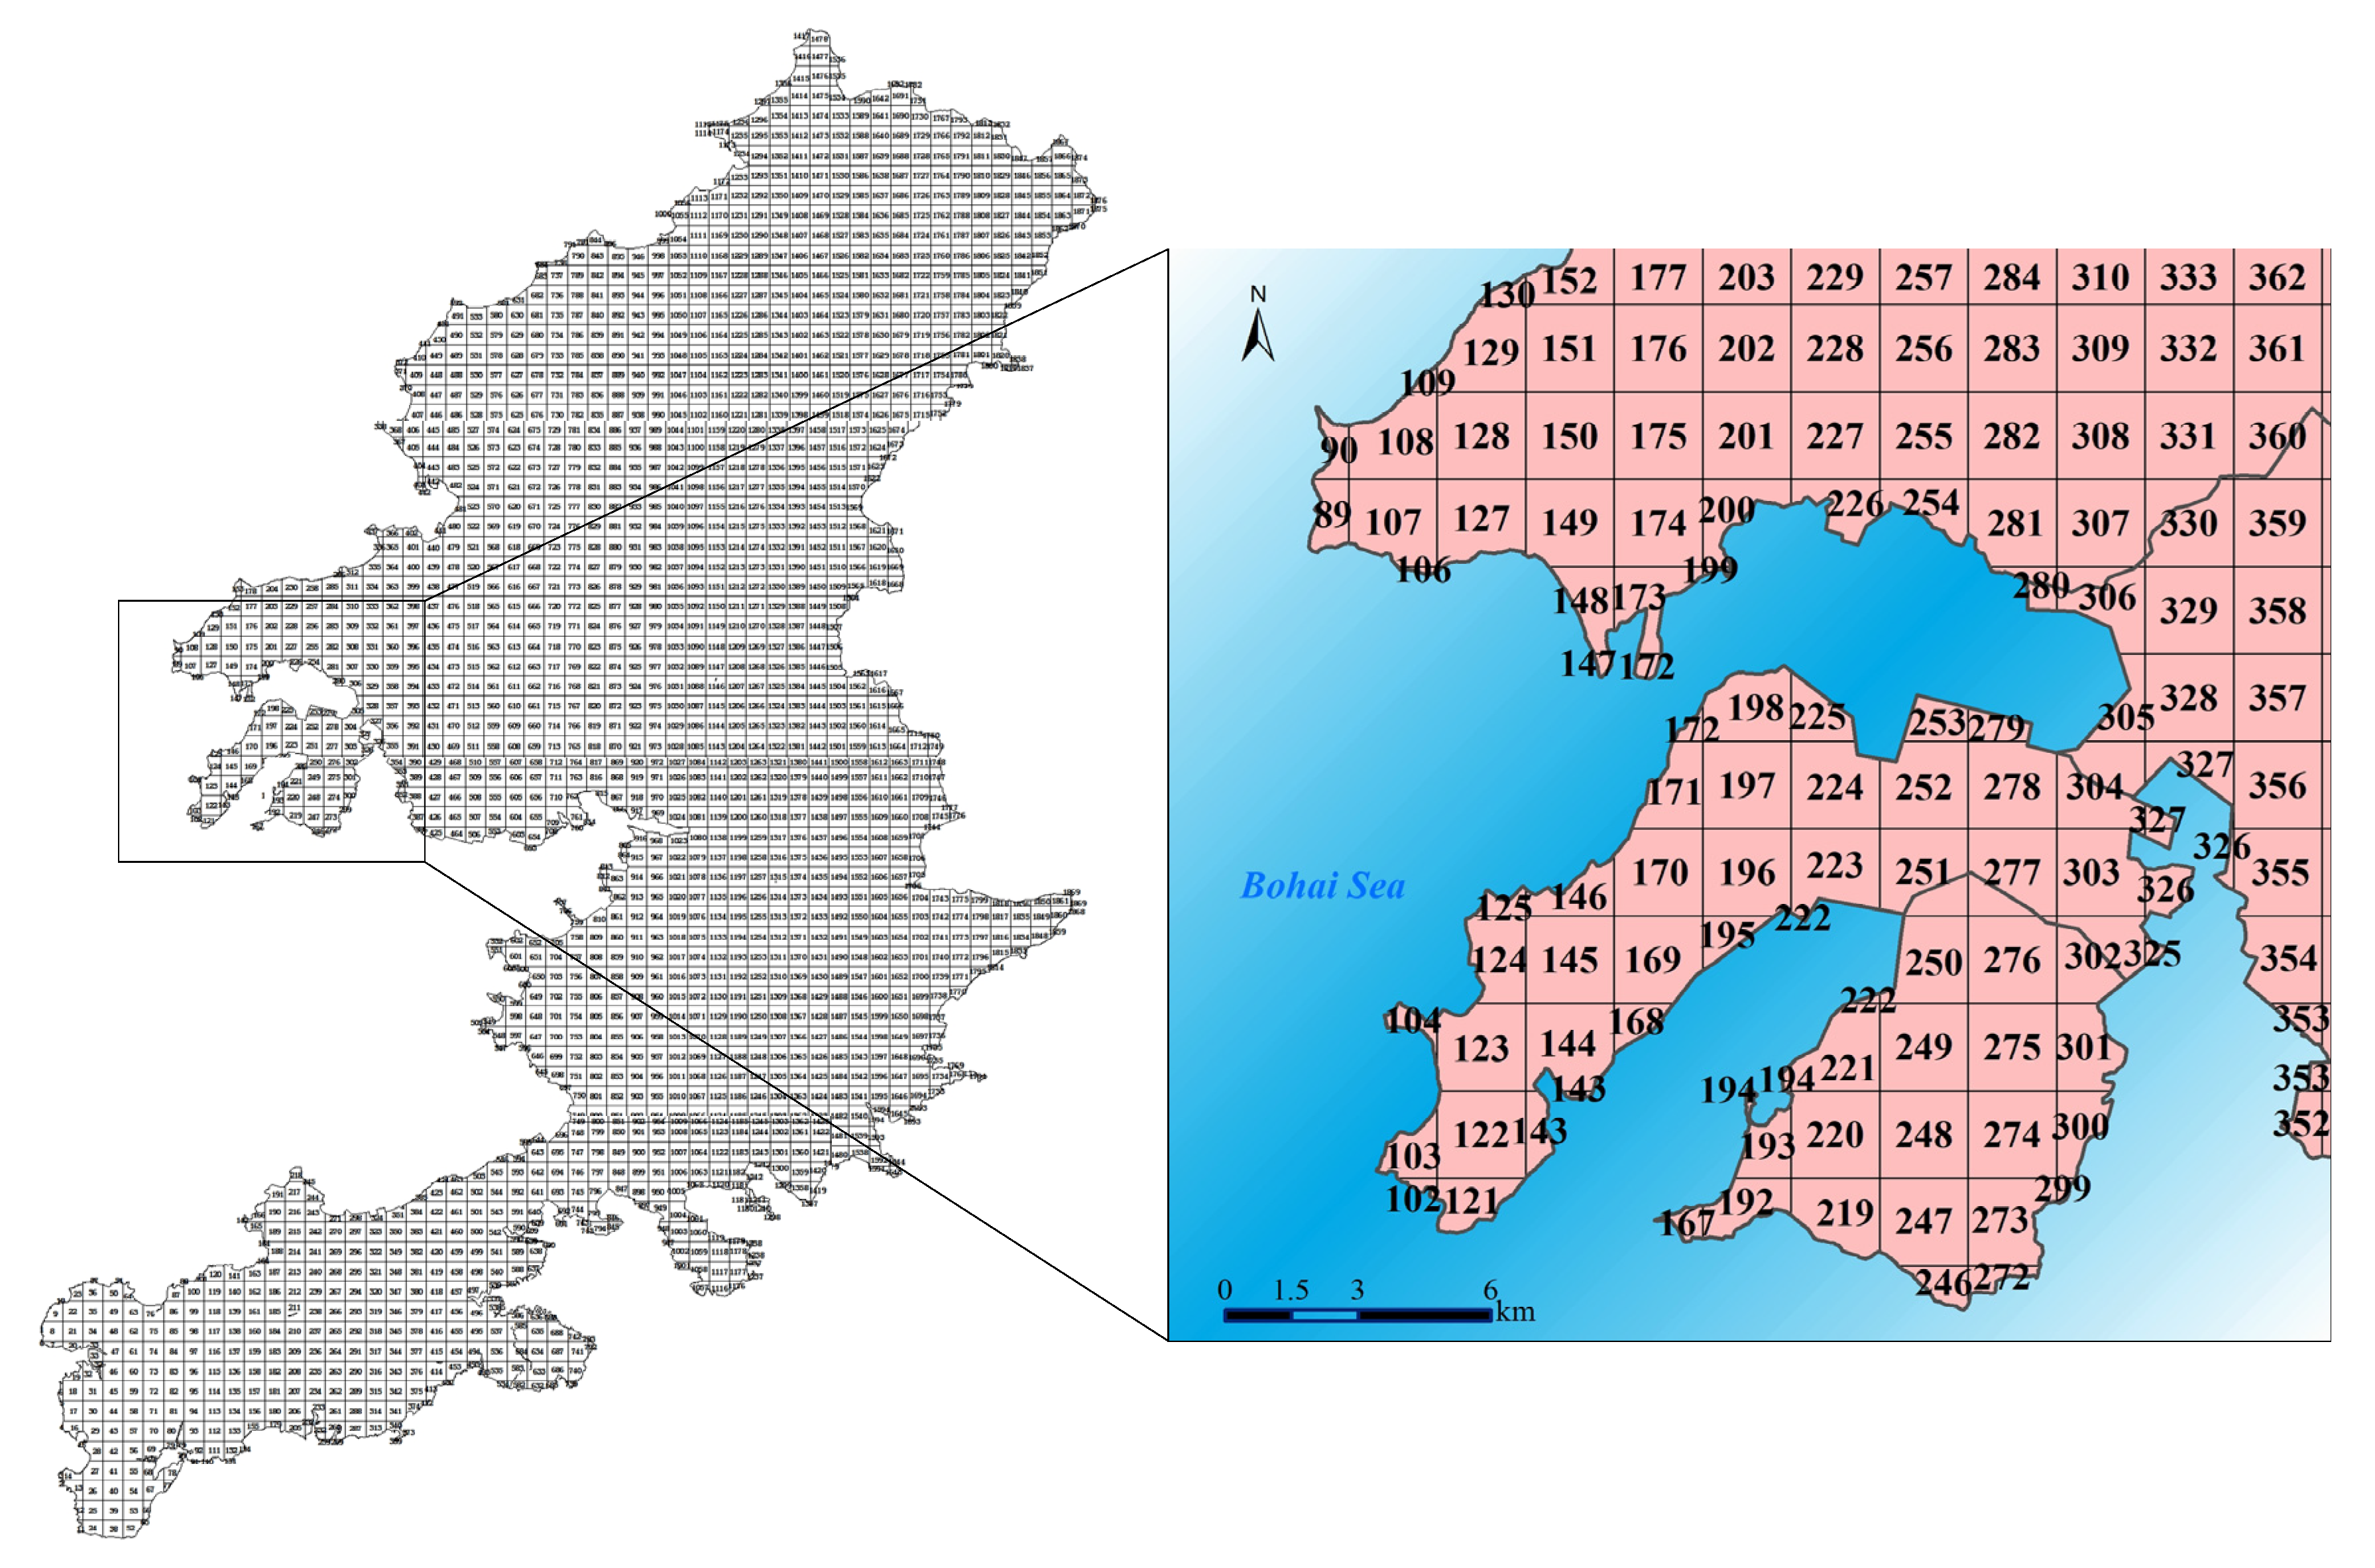
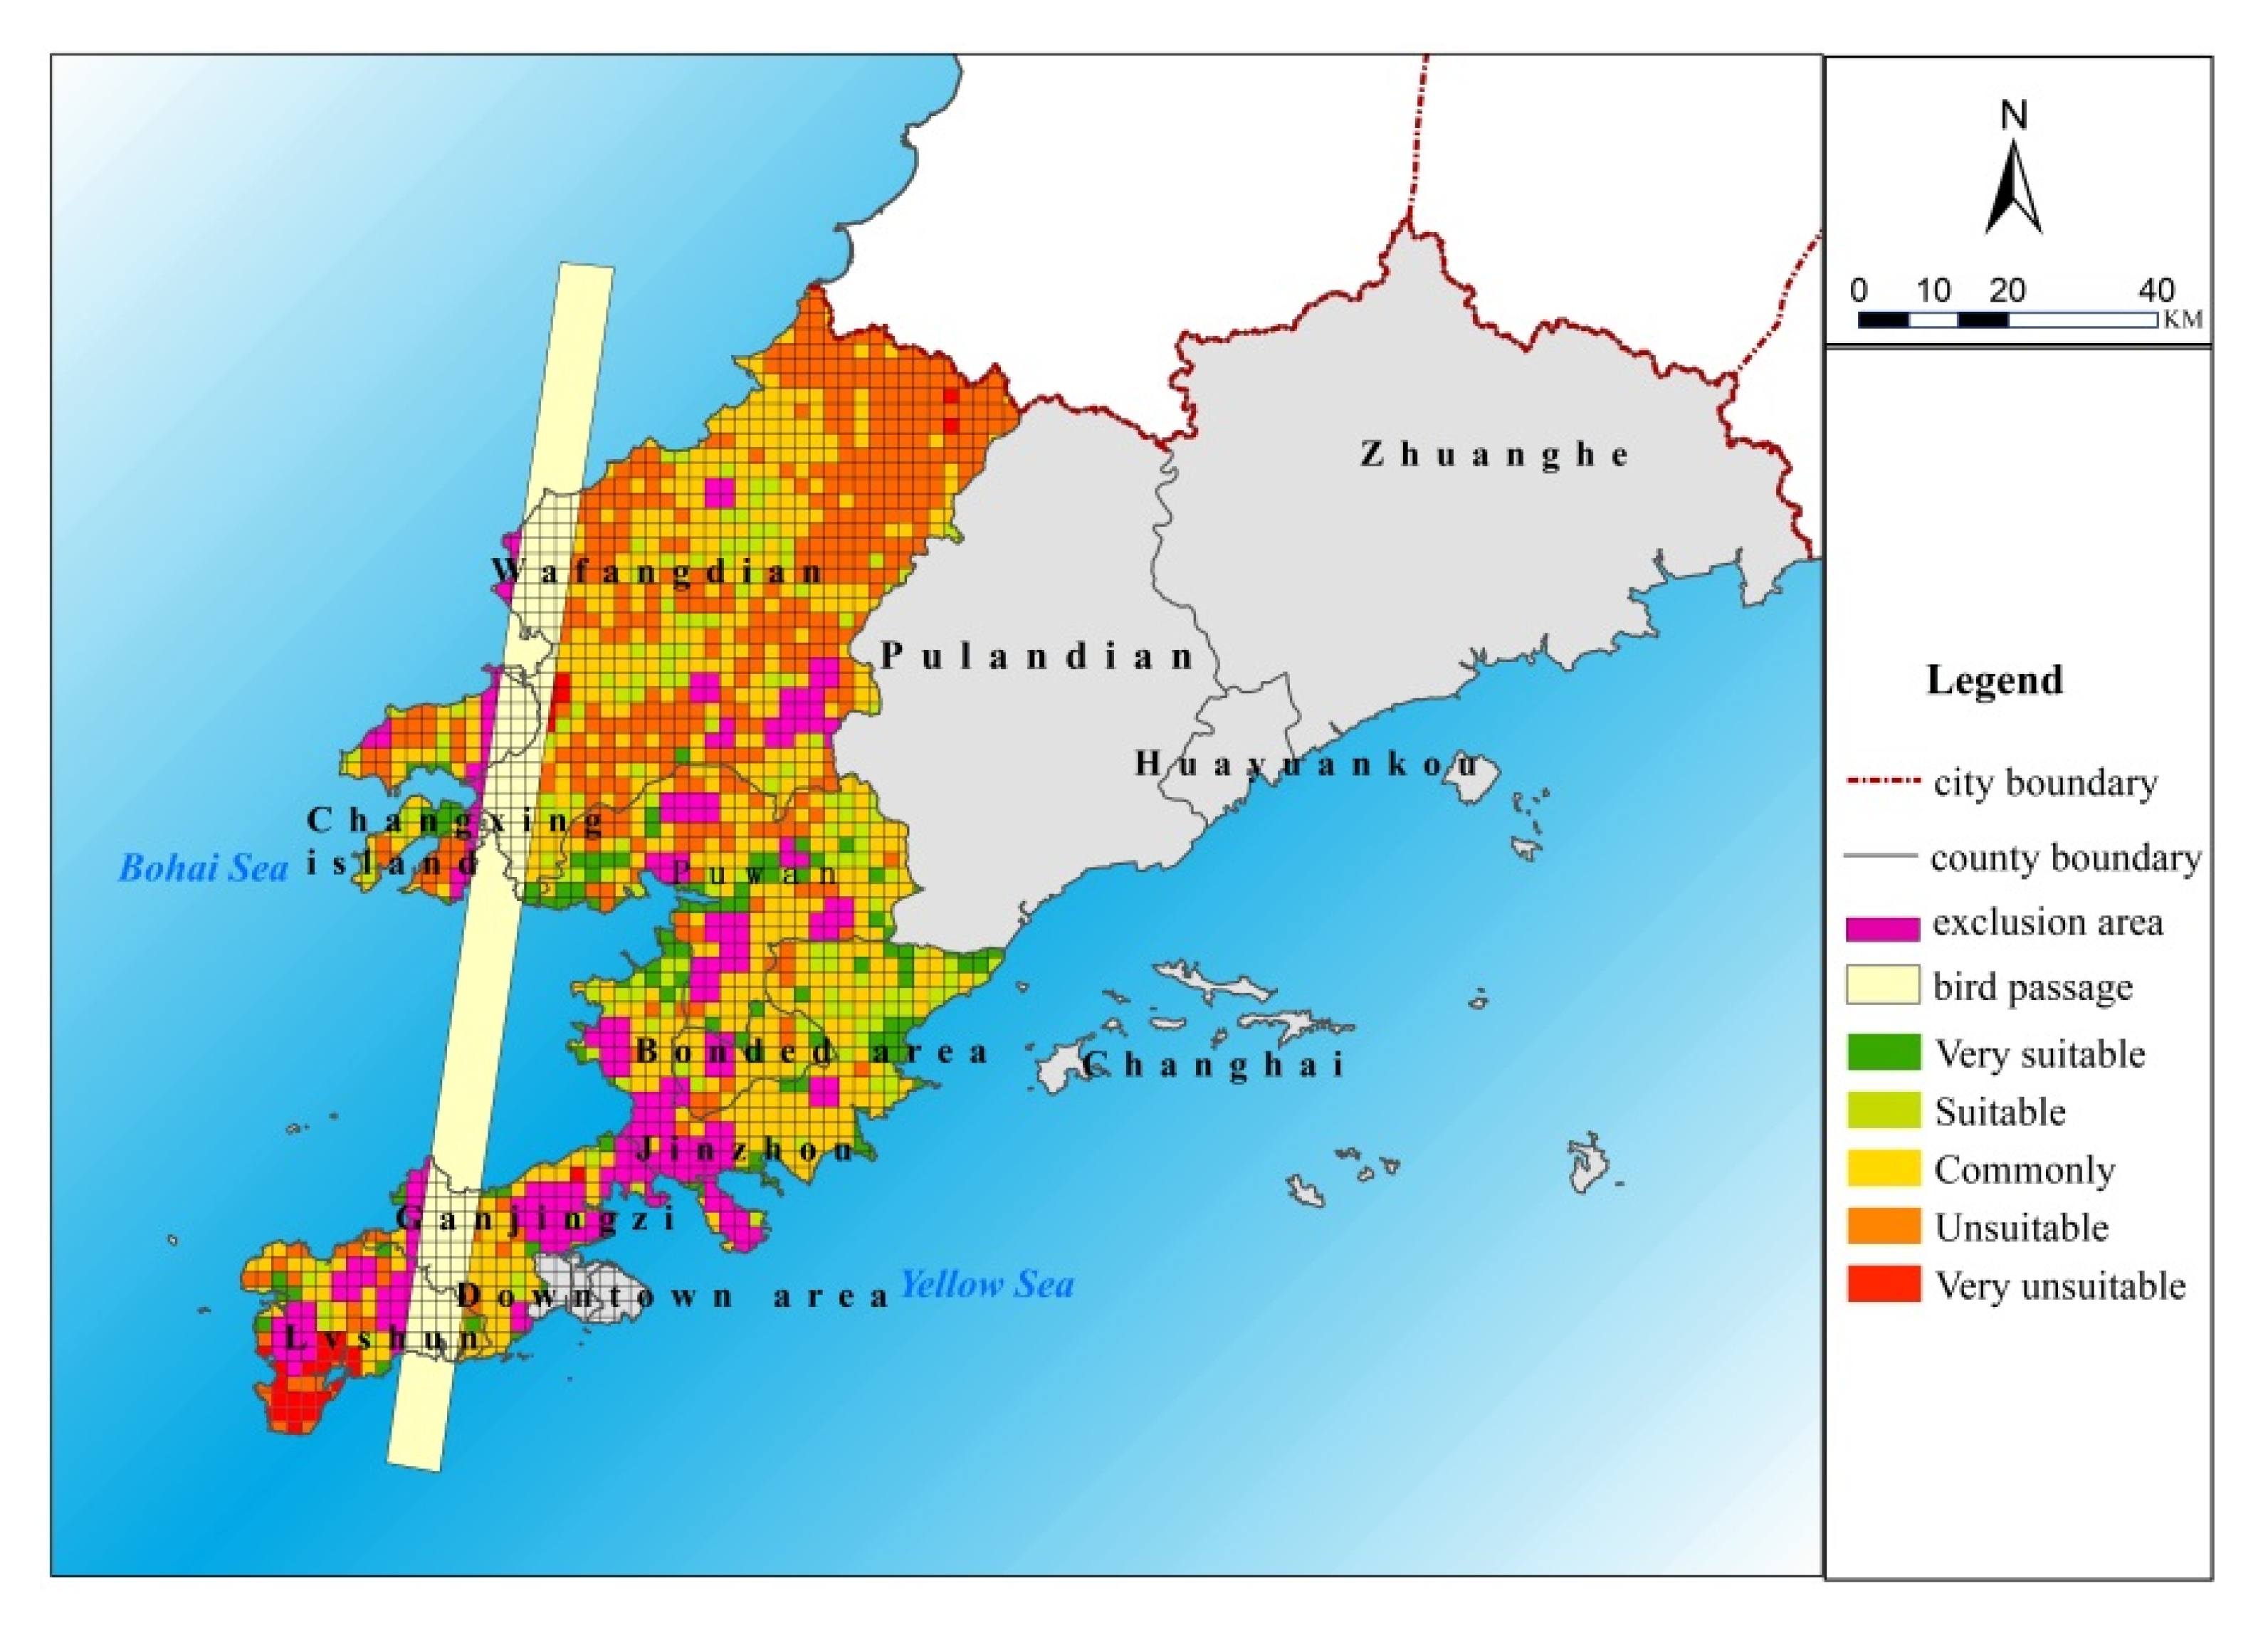
3.2. Exclusion Area
3.3. Evaluation Criteria
3.4. The Determination of Weight Coefficients Based on the FAHP Method
- (i)
- The comprehensive degree of the i-th evaluation target unit is expressed as follows:
- (ii)
- If , , Equation (6) is utilized to calculate the degree of possibility:
- (iii)
- In order to get and , it is necessary to calculate the corresponding values of and . The possible degree values for the remaining (n − 1) fuzzy numbers are as follows:
- (iv)
- Get the weight and express it as Equation (8); correspondingly, normalize it to Equation (9) as follows:
3.5. The Suitability Evaluation of the Studied Region Based on Fuzzy VIKOR
4. Results Analysis and Discussion
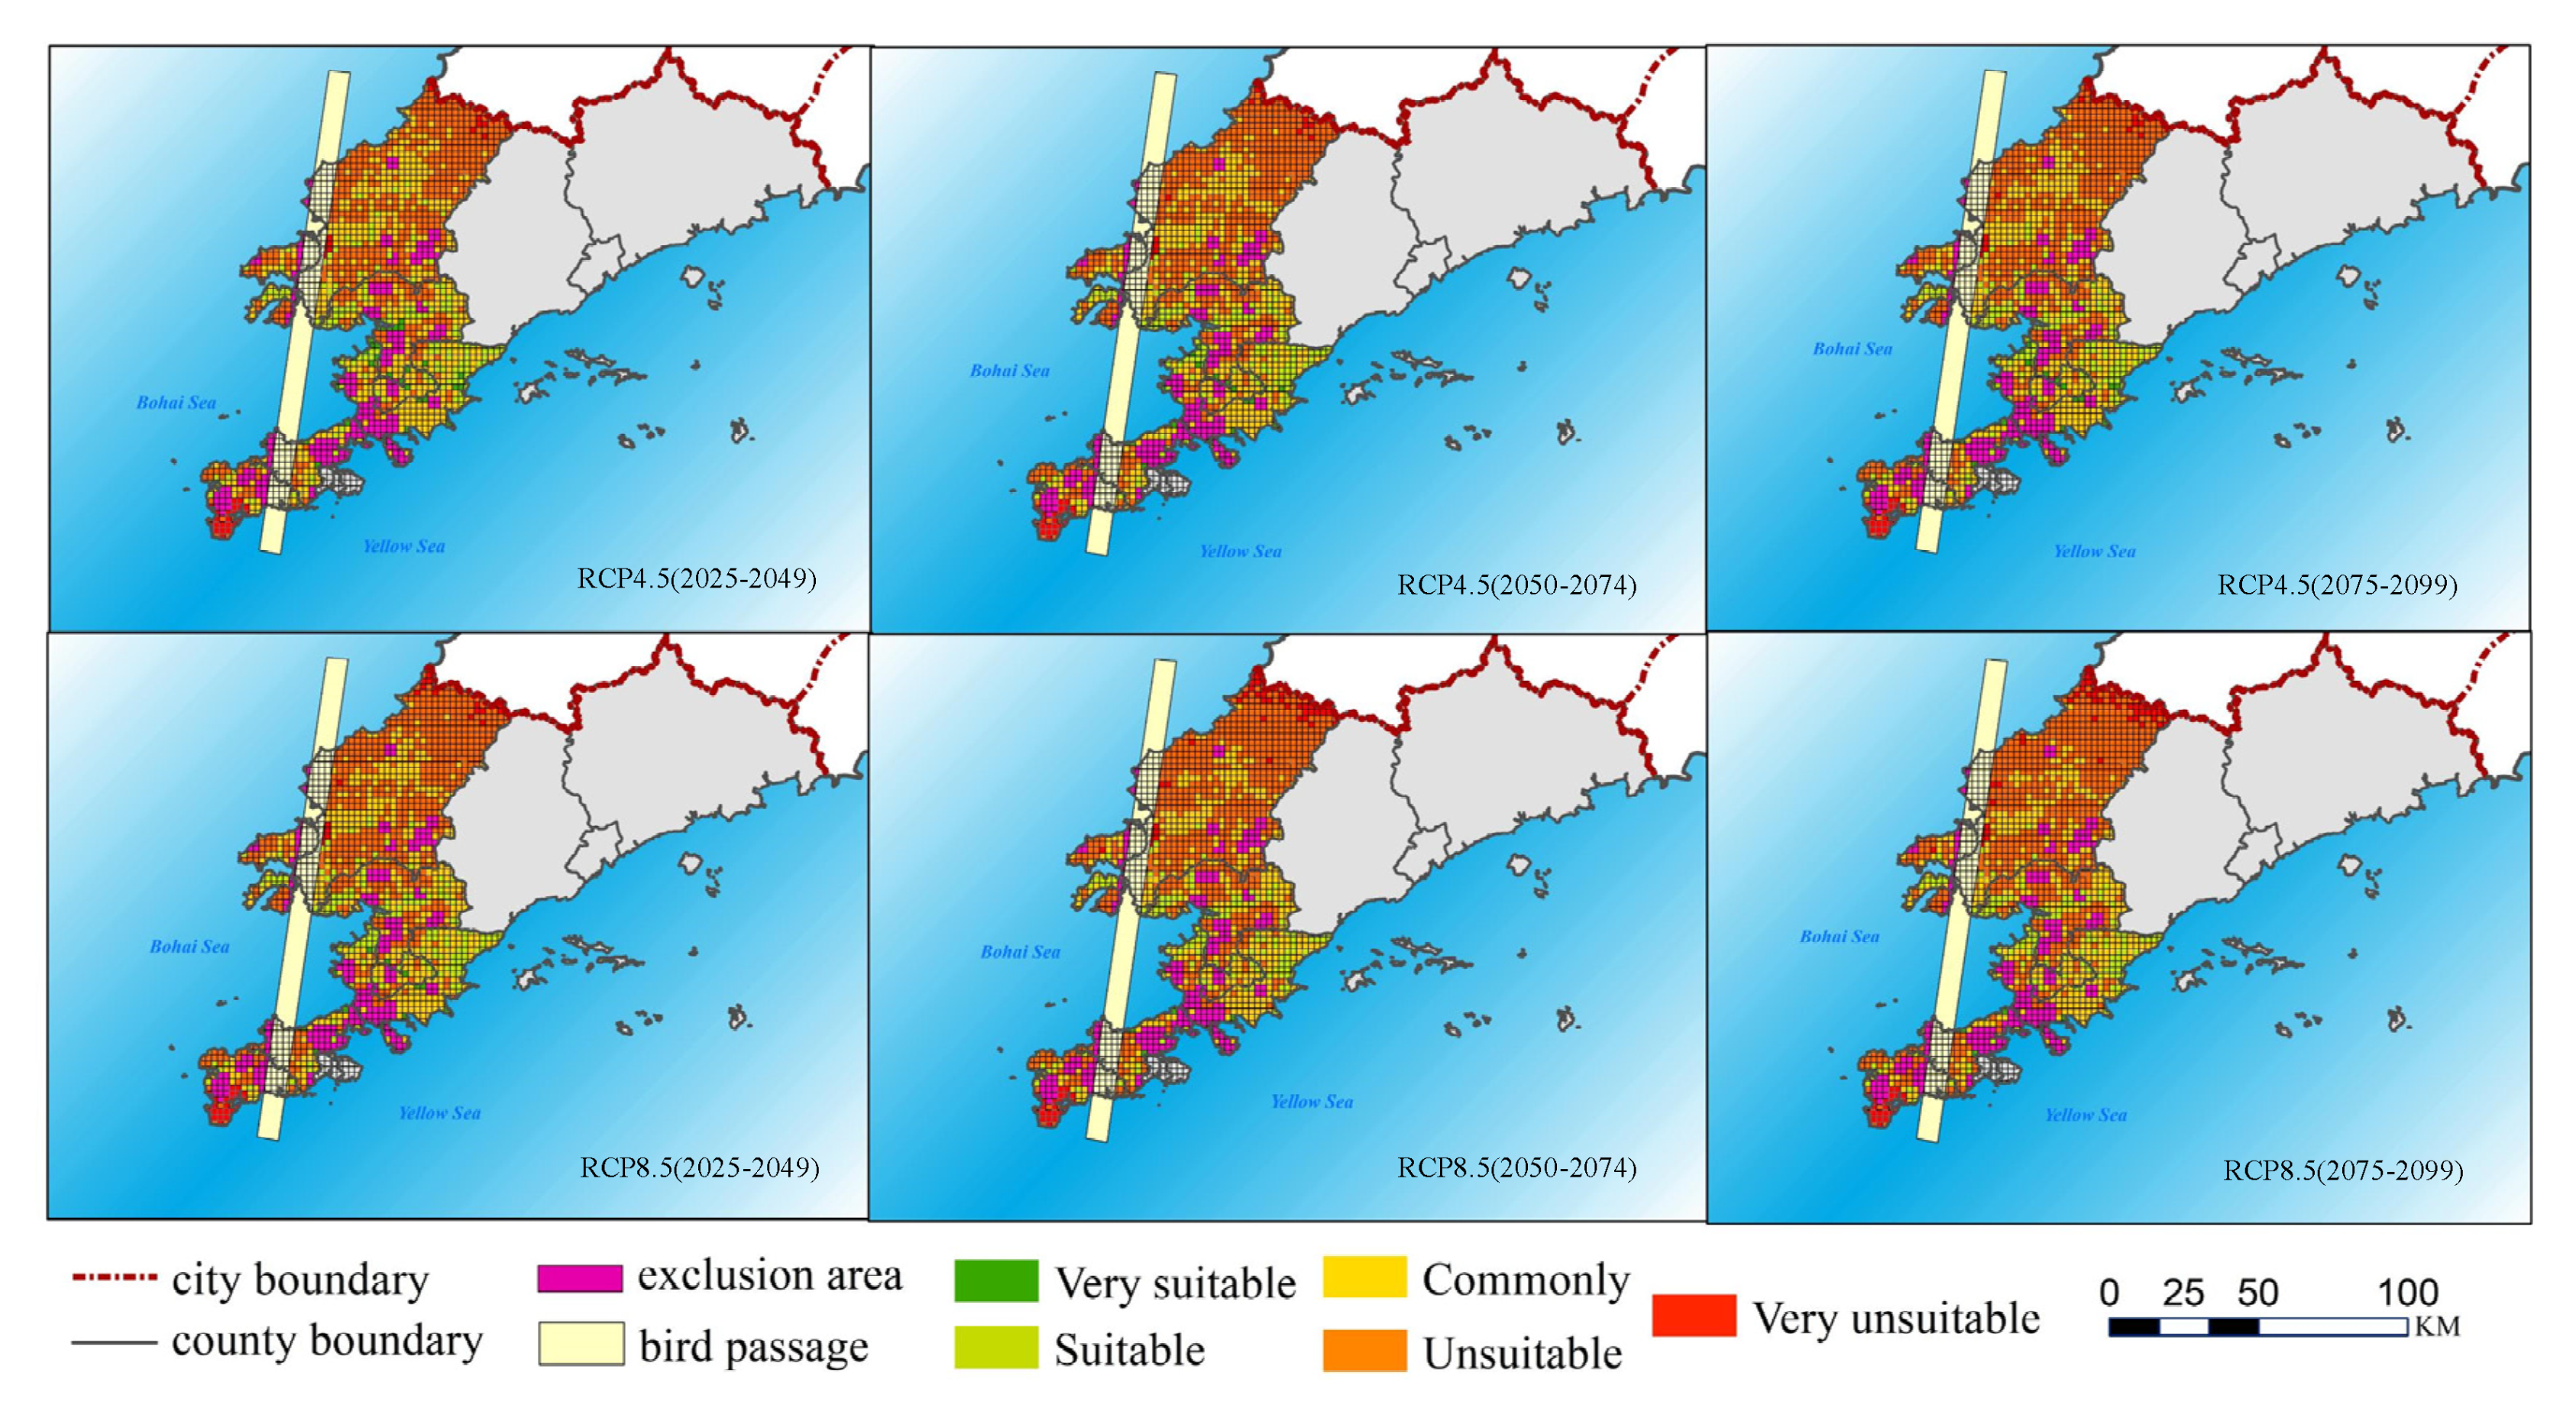
4.1. Results Analysis
4.2. Discussion
5. Conclusions
Author Contributions
Funding
Acknowledgments
Conflicts of Interest
Abbreviations
| A | the building area within the grid; |
| AHP | analytic hierarchy process; |
| ANP | analytic network process; |
| B | the bird estuary reserve; |
| E | the distance from the transmission line; |
| FAHP | fuzzy analytic hierarchy process; |
| FID | the number of candidate sites; |
| GHGs | greenhouse gases; |
| GIS | geographic information system; |
| IPCC | intergovernmental panel on climate change; |
| MCDM | multi-criteria decision making; |
| P | the wind speed; |
| PRECIS | providing regional climate for impacts studies; |
| PROMETHEE | preference ranking organization method for enrichment evaluations; |
| R | the distance from the main road; |
| RCP | representative concentration pathway; |
| S | the slope; |
| SE | south-east; |
| TIFN | triangular intuitionistic fuzzy number; |
| VIKOR | VIšekriterijumsko KOmpromisno Rangiranje. |
Nomenclatures for Variables and Parameters
| the fuzzy evaluation matrix for each evaluation index; | |
| the score of the index scored; | |
| Cj | evaluation criteria; |
| Cij | the importance of index Ci relative to Cj; |
| CI | consistency index; |
| CR | random consistency ratio; |
| the optimal solution; | |
| the worst solution; | |
| the minimum possible values; | |
| m | the total number of the candidate site; |
| the most probable value; | |
| n | the total number of the evaluation criterion; |
| Qi | overall suitability index; |
| Ri | the individual regret value; |
| the optimal solution of the group utility value; | |
| the optimal solution of the group utility value; | |
| RI | random consistency index; |
| Si | the group utility value; |
| the comprehensive degree of the i-th evaluation target unit; | |
| the optimal solution of the group utility value; | |
| the worst solution of the group utility value; | |
| the maximum possible values; | |
| v | the weight of the “majority criterion” strategy; |
| the weight of the indicator j; | |
| Wjk | the weight value of the j index of the k layer; |
| Wi(k+1) | the weight of the evaluation index i to the k + 1 layer index; |
| Wij(k) | the weight of the index i to criterion j; |
| the evaluated results of studied region A related to the criterion Cj; | |
| the largest characteristic root of matrix A. |
References
- National Bureau of Statistics of China. 2019. Available online: www.data.stats.gov.cn/easyquery.htm?cn=C01 (accessed on 30 April 2019).
- Ying, X.; Jie, W.; Ying, S.; Botao, Z.; Rouke, L.; Jia, W. Change in Extreme Climate Events over China Based on CMIP5. Atmos. Ocean. Sci. Lett. 2015, 8, 185–192. [Google Scholar] [CrossRef]
- The Intergovernmental Panel on Climate Change. 2016. Available online: www.ipcc.ch/sr15/chapter/summary-for-policy-makers/ (accessed on 1 April 2016).
- Rosencranz, A. The Origin and Emergence of International Environmental Norms. Hastings Int. Comp. L. Rev. 2003, 26, 309–319. [Google Scholar]
- Squalli, J. Renewable energy, coal as a baseload power source, and greenhouse gas emissions: Evidence from U.S. state-level data. Energy 2017, 127, 479–488. [Google Scholar] [CrossRef]
- Hagen, B.; Pijawka, D. Public Perceptions and Support of Renewable Energy in North America in the Context of Global Climate Change. Int. J. Disaster Risk Sci. 2015, 6, 385–398. [Google Scholar] [CrossRef] [Green Version]
- Wang, X.; Liu, Y.; Jiang, N.; Duan, Y. Summary of Wind Power Technology Development. Electr. Switch. 2013, 51, 16–19. [Google Scholar]
- Chaofeng, Z. Review of Wind Power Generator and Control Technology of Wind Power Generation. Low Carbon World 2015, 14, 58–59. [Google Scholar]
- Chen, Y.; Han, L.; Lin, P.; Gu, C. Review on the Development of Large-Scale Renewable Wind Power Generation Technology. Sci. Technol. Dissem. 2015, 21, 33–34. [Google Scholar]
- Chen, Z.; Dong, W.; Gao, H.; Jia, C.; Xu, X.; Zhang, G.; Zhu, L. Statistics of Wind Power installed capacity in China in 2017. Wind Energy 2018, 5, 44–57. [Google Scholar]
- Janke, J.R. Multicriteria GIS modeling of wind and solar farms in Colorado. Renew. Energy 2010, 35, 2228–2234. [Google Scholar] [CrossRef]
- Latinopoulos, D.; Kechagia, K. A GIS-based multi-criteria evaluation for wind farm site selection: A regional scale application in Greece. Renew. Energy 2015, 78, 550–560. [Google Scholar] [CrossRef]
- Höfer, T.; Sunak, Y.; Siddique, H.; Madlener, R. Wind farm siting using a spatial Analytic Hierarchy Process approach: A case study of the Städteregion Aachen. Appl. Energy 2016, 163, 222–243. [Google Scholar] [CrossRef]
- Geovanna, V.; Gabriel, G.; Javier, M.-G.; Diego, J.J. Wind farms suitability location using geographical information system(GIS), based on multi-criteria decision making (MCDM) methods: Thecase of continental Ecuador. Renew. Energy 2017, 109, 275–286. [Google Scholar]
- Mahdy, M.; Bahaj, A.S. Multi criteria decision analysis for offshore wind energy potential in Egypt. Renew. Energy 2018, 118, 278–289. [Google Scholar] [CrossRef]
- Ali, S.; Jang, C.-M. Selection of Best-Suited Wind Turbines for New Wind Farm Sites Using Techno-Economic and GIS Analysis in South Korea. Energies 2019, 12, 3140. [Google Scholar] [CrossRef] [Green Version]
- Wu, Y.; Tao, Y.; Zhang, B.; Wang, S.; Xu, C.; Zhou, J. A decision framework of offshore wind power station site selection using a PROMETHEE method under intuitionistic fuzzy environment: A case in China. Ocean Coast. Manag. 2019, 184, 105016. [Google Scholar] [CrossRef]
- Ioannou, K.; Tsantopoulos, G.; Arabatzis, G. A Decision Support System methodology for selecting wind farm installation locations using AHP and TOPSIS: Case study in Eastern Macedonia and Thrace region, Greece. Energy Policy 2019, 132, 232–246. [Google Scholar]
- Ding, X.; Liu, L.; Huang, G.; Xu, Y.; Guo, J. A Multi-Objective Optimization Model for a Non-Traditional Energy System in Beijing under Climate Change Conditions. Energies 2019, 12, 1692. [Google Scholar] [CrossRef] [Green Version]
- Guo, J.; Huang, G.; Wang, X.; Li, Y.; Lin, Q. Dynamically-downscaled projections of changes in temperature extremes over China. Clim. Dyn. 2018, 50, 1045–1066. [Google Scholar] [CrossRef]
- Zha, J.; Wu, J.; Zhao, D.; Fan, W. Future projections of the near-surface wind speed over eastern China based on CMIP5 datasets. Clim. Dyn. 2020, 54, 2361–2385. [Google Scholar] [CrossRef]
- Guo, J.; Huang, G.; Wang, X.; Xu, Y.; Li, Y. Projected changes in wind speed and its energy potential in China using a high-resolution regional climate model. Wind Energy 2020, 23, 471–485. [Google Scholar] [CrossRef]
- Sánchez-Lozano, J.M.; Lamata, M.T. GIS-based onshore wind farm site selection using Fuzzy Multi-Criteria Decision Making methods. Evaluating the case of Southeastern Spain. Appl. Energy 2016, 171, 86–102. [Google Scholar] [CrossRef]
- Sun Hongxia, L.Y. VIKOR Method with Triangular Intuitionistic Fuzzy Numbers. Oper. Res. Manag. Sci. 2015, 24, 288–294. [Google Scholar]
- Chifang, Z. VIKOR Method for Intuitionistic Fuzzy Multi-Attribute Group Decision Making. J. Xi’an Technol. Univ. 2015, 3, 182–185. [Google Scholar]
- Tavana, M.; Mavi, R.K.; Santos-Arteaga, F.J.; Doust, E.R. An extended VIKOR method using stochastic data and subjective judgments. Comput. Ind. Eng. 2016, 97, 240–247. [Google Scholar] [CrossRef]
- Azadeh, A.; Rahimi-Golkhandan, A.; Moghaddam, M. Location optimization of wind power generation–transmission systems under uncertainty using hierarchical fuzzy DEA: A case study. Renew. Sustain. Energy Rev. 2014, 30, 877–885. [Google Scholar] [CrossRef]
- Liu, P.; Jin, F. Methods for aggregating intuitionistic uncertain linguistic variables and their application to group decision making. Inf. Sci. 2012, 205, 58–71. [Google Scholar] [CrossRef]
- Jan, K.; Joost van, H.; Szymon, S. Challenges in the wind turbines location process in Central Europe—The use of spatial decision support systems. Renew. Sustain. Energy Rev. 2017, 76, 425–433. [Google Scholar]


| Exclusion Standard | Points |
|---|---|
| Bird passages | 154–156, 179–186, 189–191, 205–212, 216–218, 233–240, 243–245, 268–274, 299–307, 325–337, 352–353, 356–372, 392–407, 410–411, 437–446, 449–451, 480–487, 525, |
| Power plant (Centered on the power plant, 3 km outside) | 415–416, 452–453, 459–460, 495, 527, 713, 1024, 1347, 1449, 1506–1507, 1532–1533, 1585–1586, |
| Chemical plant (Centered on the chemical plant leader, and expand 3 km) | 29–31, 42–46, 57–60, 84–85, 97–99, 117–118, 129–130, 135–137, 151–152, 375–376, 382–383, 390–391, 413–414, 419–422, 419–422, 454–458, 528, 530–531, 571–572, 581–582, 615–616, 618–619, 624–627, 665–669, 672–675, 714–715, 718–719, 763–764, 766–768, 782–783, 816–820, 835, 838–839, 867, 870–871, 889–890, 917–919, 929–931, 941–942, 949–950, 970–975, 979–981, 984–986, 988–989, 996–997, 1001, 1004–1005, 1017–1018, 1026–1032, 1036–1038, 1043–1046, 1058–1059, 1074–1075, 1085–1086, 1101–1104, 1143–1144, 1237–1238, 1287–1288, 1295–1298, 1346, 1355–1357, 1391–1392, 1402–1403, 1416–1420, 1450–1451, 1461–1463, 1474–1475, 1478–1479, 1520–1521 |
| Both bird passage and chemical plant | 159–161, 187–188, 213–215, 241–242, 354–355, 488–489, 491–494 |
| Both bird passage and power plant | 408–409, 447–448, 526 |
| Both chemical plant and power plant | 490, 716–717, 761–762, 812–815, 834, 865–866, 885–886, 1025, 1083–1084 |
| FID | S | R | E | B | A | P | Qi |
|---|---|---|---|---|---|---|---|
| 678 | 8.86 | 4.32 | 10.00 | 10.00 | 10.00 | 6.49 | 0.14 |
| 679 | 10.00 | 5.20 | 9.89 | 10.00 | 10.00 | 6.49 | 0.12 |
| 728 | 10.00 | 4.04 | 10.00 | 10.00 | 10.00 | 6.48 | 0.13 |
| 982 | 9.44 | 10.00 | 10.00 | 10.00 | 9.86 | 6.50 | 0.11 |
| 990 | 10.00 | 10.00 | 10.00 | 10.00 | 10.00 | 6.41 | 0.16 |
| 1206 | 10.00 | 8.05 | 9.58 | 10.00 | 10.00 | 6.38 | 0.19 |
| 1611 | 10.00 | 7.45 | 9.35 | 10.00 | 10.00 | 6.50 | 0.11 |
| 1705 | 10.00 | 9.07 | 10.00 | 10.00 | 7.12 | 6.41 | 0.20 |
| 1735 | 10.00 | 4.58 | 8.48 | 10.00 | 9.81 | 6.44 | 0.17 |
| 1736 | 10.00 | 4.76 | 9.14 | 10.00 | 10.00 | 6.44 | 0.16 |
| 1737 | 10.00 | 7.92 | 10.00 | 10.00 | 9.98 | 6.40 | 0.17 |
| FID | S | R | E | B | A | P | Qi |
|---|---|---|---|---|---|---|---|
| 12 | 1.98 | 7.74 | 1.63 | 1.00 | 10.00 | 6.50 | 0.91 |
| 16 | 2.23 | 10.00 | 1.75 | 1.00 | 10.00 | 6.50 | 0.90 |
| 25 | 1.98 | 8.18 | 1.65 | 1.00 | 10.00 | 6.50 | 0.91 |
| 26 | 2.11 | 10.00 | 1.69 | 1.00 | 10.00 | 6.50 | 0.90 |
| 27 | 2.25 | 10.00 | 1.73 | 1.00 | 8.11 | 6.51 | 0.92 |
| 38 | 1.84 | 5.17 | 1.66 | 1.00 | 10.00 | 6.51 | 0.91 |
| 40 | 1.76 | 10.00 | 1.74 | 1.00 | 3.45 | 6.51 | 0.98 |
| 53 | 2.39 | 5.76 | 1.75 | 1.00 | 0.88 | 6.52 | 1.01 |
| 56 | 2.68 | 10.00 | 1.88 | 1.00 | 2.55 | 6.53 | 0.97 |
| 65 | 2.39 | 4.64 | 1.75 | 1.00 | 10.00 | 6.53 | 0.90 |
| 66 | 2.39 | 5.66 | 1.78 | 1.00 | 0.88 | 6.53 | 1.01 |
| 69 | 2.23 | 10.00 | 1.94 | 1.00 | 3.50 | 6.54 | 0.97 |
| 71 | 3.05 | 10.00 | 2.03 | 1.00 | 5.04 | 6.54 | 0.93 |
| 80 | 3.20 | 10.00 | 2.05 | 1.00 | 3.99 | 6.55 | 0.94 |
| 81 | 3.40 | 10.00 | 2.11 | 1.00 | 3.99 | 6.55 | 0.94 |
| Suitability Value (Qi) | AHP and VIKOR | Scenario 1 (Equal Criteria Weights) | Scenario 2 (Economic Priority) | Scenario 3 (Environmental and Social Priority) | ||||
|---|---|---|---|---|---|---|---|---|
| (ha) | (% (of Feasible Area)) | (ha) | (% (of Feasible Area)) | (ha) | (% (of Feasible Area)) | (ha) | (% (of Feasible Area)) | |
| most suitable (Qi < 0.2) | 42, 571.60 | 7.10 | 17, 200 | 2.87 | 11, 600 | 1.93 | 63, 200 | 10.54 |
| suitable (0.2 < Qi < 0.4) | 81, 545.60 | 13.60 | 64, 400 | 10.74 | 176, 400 | 29.42 | 141, 200 | 23.55 |
| general suitable (0.4 < Qi < 0.6) | 242, 838.00 | 40.50 | 218, 400 | 36.42 | 206, 000 | 34.36 | 342, 800 | 57.17 |
| unsuitable (0.6 < Qi < 0.8) | 216, 455.60 | 36.10 | 270, 000 | 45.03 | 186, 800 | 31.15 | 33, 600 | 5.60 |
| very unsuitable (0.8 < Qi < 1) | 16, 189.20 | 2.70 | 29, 600 | 4.94 | 18, 800 | 3.14 | 18, 800 | 3.14 |
© 2020 by the authors. Licensee MDPI, Basel, Switzerland. This article is an open access article distributed under the terms and conditions of the Creative Commons Attribution (CC BY) license (http://creativecommons.org/licenses/by/4.0/).
Share and Cite
Li, M.; Xu, Y.; Guo, J.; Li, Y.; Li, W. Application of a GIS-Based Fuzzy Multi-Criteria Evaluation Approach for Wind Farm Site Selection in China. Energies 2020, 13, 2426. https://doi.org/10.3390/en13102426
Li M, Xu Y, Guo J, Li Y, Li W. Application of a GIS-Based Fuzzy Multi-Criteria Evaluation Approach for Wind Farm Site Selection in China. Energies. 2020; 13(10):2426. https://doi.org/10.3390/en13102426
Chicago/Turabian StyleLi, Mengran, Ye Xu, Junhong Guo, Ye Li, and Wei Li. 2020. "Application of a GIS-Based Fuzzy Multi-Criteria Evaluation Approach for Wind Farm Site Selection in China" Energies 13, no. 10: 2426. https://doi.org/10.3390/en13102426