Article

Energy, Environmental and Economic Performance of an Urban Community Hybrid Distributed Energy System

1
Department of Electrical, Electronics and Computer Engineering, University of Catania, 95125 Catania, Italy
2
DING, Department of Engineering, University of Sannio, 82100 Benevento, Italy
*
Author to whom correspondence should be addressed.
Energies 2020, 13(10), 2545; https://doi.org/10.3390/en13102545
Submission received: 28 April 2020 / Revised: 14 May 2020 / Accepted: 15 May 2020 / Published: 17 May 2020
(This article belongs to the Section A2: Solar Energy and Photovoltaic Systems)

Abstract

:
Energy systems face great challenges from both the supply and demand sides. Strong efforts have been devoted to investigate technological solutions aiming at overcoming the problems of fossil fuel depletion and the environmental issues due to the carbon emissions. Hybrid (activated by both renewables and fossil fuels) distributed energy systems can be considered a very effective and promising technology to replace traditional centralized energy systems. As a most peculiar characteristic, they reduce the use of fossil sources and transmission and distribution losses along the main power grid and contribute to electric peak shaving and partial-loads losses reduction. As a direct consequence, the transition from centralized towards hybrid decentralized energy systems leads to a new role for citizens, shifting from a passive energy consumer to active prosumers able to produce energy and distribute energy. Such a complex system needs to be carefully modelled to account for the energy interactions with prosumers, local microgrids and main grids. Thus, the aim of this paper is to investigate the performance of a hybrid distributed energy system serving an urban community and modelled within the framework of agent-based theory. The model is of general validity and estimates (i) the layout of the links along which electricity is distributed among agents in the local microgrid, (ii) electricity exchanged among agents and (iii) electricity exported to the main power grid or imported from it. A scenario analysis has been conducted at varying the distance of connection among prosumers, the installed capacity in the area and the usage of links. The distributed energy system has been compared to a centralized energy system in which the electricity requests of the urban community are satisfied by taking electricity from the main grid. The comparison analysis is carried out from an energy, environmental and economic point of view by evaluating the primary energy saving, avoided carbon dioxide emissions and the simple payback period indices.

1. Introduction

The rapid climate changes due to fossil fuel consumption and the rising awareness on the need to increase environmental protection have pushed the scientific community and governments to integrate sustainable solutions able to account for the massive global energy demand. In this sense, renewable-based energy production systems represent a valid alternative to the traditional fossil-fuelled energy production paradigm. Among the most important peculiarities of these systems, the decentralization of the energy distribution and the rising role of prosumers within a local microgrid constitutes the leitmotiv of this present research.
If on the one hand renewable systems have radically changed the way we have conceived energy production and distribution so far, on the other hand, their contribution is often not sufficient to guarantee the energetic autonomy of prosumers or, by extension, urban territories or cities. This is mainly due to the intermittent nature of renewable sources and to the mismatch between production and demand. Therefore, it is fundamental to deal with hybrid distribution, i.e., referring to both renewables and fossil fuel production.
Over the last decade, local microgrids have been widely investigated from both technical and operational viewpoints and with respect to multivariate scenarios. A common investigated issue concerns the dispatch of energy from different types of power generation sources and considering the distribution market operator perspective. For instance, Fateh et al. proposed a decision-making algorithm to model the operations between the retailers and microgrids [1]. Capacities on medium- and low-voltage grids are investigated by Hunziker et al. [2]. Aloumoush evaluated different resolution approaches ranging from metaheuristic algorithms to multi-objective optimization models [3]. Murty and Kumar developed a mixed-integer linear programming model to deal with the optimal energy dispatch of renewable energy sources in microgrids and under the demand response scheme including energy storage devices [4].
Other studies have also compared the performance of systems providing energy requests to end-users connected by local thermal and electric microgrids with conventional systems in which the users are not able to share their loads. These analyses have been commonly conducted by means of a techno-economic investigation aimed at comparing the performance of different energy conversion systems satisfying the same end-users’ requests by means of energy, environmental and economic indices such as the fuel energy saving ratio, the avoided carbon dioxide emission index or the simple payback period. For instance, Zabalaga et al. [5] have performed a performance analysis in terms of energy efficiency, economic feasibility, and environmental sustainability of an off-grid hybrid power system composed by photovoltaic/Stirling battery system for a Bolivian rural area. The hybrid system has been compared with a hybrid photovoltaic/diesel/battery system. The results have highlighted that the proposed system ensures an environmental sustainability (69% savings in carbon dioxide emissions), an 11% savings in annualized total cost and 5% savings in fuel energy conversion. Furthermore, Marrasso et al. [6] have compared the performance of a combined production system satisfying two separate residential buildings connected by means of a microgrids in a load sharing approach to those one achieved by a separate energy conversion system. The proposed system reaches a primary energy saving of 12.1% and a reduction of equivalent carbon dioxide emissions equal to 27.8%. In [7] a centralized combined production plant meeting simultaneously thermal and electric demands of a group of different buildings in Japan by means of thermal/power microgrids, has been investigated. The analysis has been carried out comparing the cogeneration plant performance with those achievable by the use of several separate energy systems. The results have demonstrated that the proposed system is able to guarantee substantial energy, environmental and economic benefits with respect to separate production system.
Particular attention is also devoted to control strategies to deal with power fluctuation [8], power flexibility in case of changes of the distribution topology [9] or power loss reduction through the optimal placement of the distribution generations [10]. Widespread contributions deal also with hybrid AC/DC microgrids, proposing hierarchical control strategies [11], energy efficiency methods for load management [12] or power flow control for residential hybrid production system [13]. Other, as [14], considered demand response for controllable residential loads in case of high penetration of renewable sources in microgrids. Gajula and Rajathy developed a model to balance power output from renewable energy sources and the demand [15].
The majority of the previously cited contributions propose voltage and current controllability strategies to solve the distribution problem in microgrids. Other authors, instead, have focused on the operational and management issues of the distribution implementing cost and environmental analyses. Among these studies, Pfeifer et al. integrated the local renewable production for a group of islands considering demand response schemes [16]; Ma et al. developed an optimization model to obtain the optimal structure of multi-energy systems along with the consideration of energy management strategies [17]. Similarly, but with more attention to the layout of the microgrid and without deepening power flow control, Fichera et al. proposed a complex network approach to model the configuration of a potential distribution network of prosumers [18]. Karmellos and Mavrotas formulated an optimization model to account for the design of multi-energy systems within microgrids [19].
So far, there is a fundamental feature of microgrids that needs to be further explored in depth, i.e., the impact of the active participation of prosumers in the distribution process in terms of electricity flows exchanged in local microgrids [20]. In fact, although the current literature is rich in models and approaches dealing with power control strategies, load shaping and optimal design, operation and management of energy systems, the investigation of electricity flows distributed within the local microgrid of prosumers still merits further research [21]. In this direction, a previous work of the authors proposed an agent-based model to account for the hybrid distributed energy system serving an urban community [22]. Each building is modelled as an agent able to both produce electricity for its own requests and to exchange electrical energy within the local microgrid. The electrical energy neither self-consumed nor distributed is fed into the main grid and, in the same way, electrical energy demands not met by the local microgrid are satisfied by the main grid. The model has been implemented in a programmable modelling environment and the analysis has been performed varying different parameters such as the installed photovoltaic capacity in the area, the imposed distance for the energy exchanges, and the utilization of the links of the local microgrid. The hybrid distributed energy system is composed by a certain number of grid-connected photovoltaic plants installed on residential and tertiary buildings of the urban area. Taking inspirations from the results of this previous research, the foremost goal of this paper is to provide insights on the performance of a local hybrid distributed energy system serving urban communities. To the scope, the local microgrid is compared to the traditional centralized configuration in which the electricity requests are entirely satisfied by the main grid. The comparison is grounded on energetic, environmental and economic issues evaluated taking primary energy savings, avoided carbon dioxide emissions and simple payback period indices into account.

2. Methodology

2.1. The Agent-Based Model

The smart grid paradigm implies the decentralization of the electricity distribution from a national centralized to a local decentralized configuration. This shift entails the direct involvement of final users in the electricity distribution process: thanks to the installation of renewable-based production systems, prosumers satisfy their own electricity demand and share the exceeding production within a limited neighborhood. The distribution among prosumers constitutes a local microgrid characterized by bidirectional electricity exchanges which modelling requires the development of ad hoc defined tools. Dealing with such a complex system, in which prosumers actively participate in the distribution process and pursuit the twofold objective of satisfying their demand and distributing the exceeding production is a non-trivial task. In fact, if on one side each prosumer acts as a unique decision maker, on the other side they are a part of a whole system that they directly influence through their autonomous behaviors. Precisely, by virtue of these characteristics, the electricity distribution among prosumers can be approached with the aim of agent-based models, able to highlight both interactions and mutual influence between the organisms and its parts. The agent-based model reported in this paper has been developed in a previous research of the authors [22] and investigated the topological configuration of the local microgrid. Here, the model is reported with the aim of enhancing the energetic, environmental and economic issues related to the electricity self-consumed and distributed within the local microgrid and to the electricity exported or imported from the main grid.
The steps of the agent-based model have been briefly summarized in the flowchart of Figure 1. The electricity distribution within the local microgrid follows three main steps: a pre-processing stage characterized by the import of all input parameters into NetLogo, a simulation stage in which distribution takes place according to a set of predefined rules and, finally, a post-simulation stage collecting data on the exchanged electricity flows (in terms of both local microgrid and main grid).
Going into the detail, the main scope of the pre-processing stage consists in the constitution of the local microgrid in terms of both energetic and architectural viewpoints. For each building, the input parameters transferred to the platform substantially refer to the spatial position (through longitudinal and latitudinal coordinates) and to the energetic demands. Properly, a daily electricity consumption profile is associated to each agent and the potential electricity production from photovoltaic (PV) panels is calculated by taking the available rooftop areas of the buildings into account and, particularly, including correction factors based on the typology of roof (span or flat), orientation, exposure and relative shading from surrounding elements. Once the potential size of the PV to be installed in each building has been estimated, the daily electricity production profiles for any agent of the local microgrid are calculated.
At this point, agents should be connected to ensure the distribution. It is not reasonable to choose a fully connected mode; therefore, a threshold distance d l establishes the maximum admitted length of the transmission line between each agent’s pair. According to this, two randomly selected agents are connected through a link if they are located within the predetermined distance. With respect to the connections with the main grid, each agent maintains its traditional electrical transmission line. Having determined the topological and energetic features of the local microgrid, the last step of this pre-processing stage consists in the calculation of the distribution potential of any agent. This potential is calculated as the difference between the electrical production and the electrical demand for each agent. In this sense, each agent is allowed to distribute electrical energy if its potential is positive, i.e., if the production exceeds the demand. On the contrary, a negative value of the distribution potential states that the demand exceeds the production, i.e., the agent needs to receive electrical energy from the local microgrid or from the main grid. It is worth noting that the decisional process of agents refers to the energetic flow control and does not involve power flow control, i.e., it does not include voltage problems, power losses on the power transmission lines or peak load-shaving issues. This assumption is common in the literature on the field of the energy distribution modelling [23,24,25]. In the simulation stage, distribution among agents takes place and the amount of electricity distributed by agents within the local microgrid is E E l P V , that is the electrical energy produced by PV and shared among agents. The distribution occurs within the neighbourhood of agents respecting the maximum admitted distance of connection d l as said, but also in accordance with a priority list accounting for who should be served first. In this model, distribution priority is granted to closest agents that have the lowest electricity demand yet to be fulfilled. After the distribution, two main configurations may occur: there are still agents whose demands need to be covered but no any agents with positive distribution potential can be identified within the neighbourhood comprised in the admitted distance d l : in this case, the agent needs to purchase electricity from the main grid E E l P G _ P S . In the second case, agents with positive distribution potential can be in the condition for which they still have electricity to be distributed but are not able to identify other requiring agents: this excess is therefore exported to the main grid E E l _ e x p P G . Finally, during the post-processing analysis, the total amount of electricity exchanged within the local microgrid and the total electricity imported or exported to the power grid are calculated.

2.2. The Energetic, Environmental and Cost Performance Evaluation

The local microgrid constituted by PV plants installed in an urban community (UC) is here considered as a proposed system (PS). The energy, environmental and economic performances of PS are compared with those of a conventional system (CS) in which the electricity needs of urban area are satisfied by taking off electricity from a main power grid (PG). Both PS and CS are schematically represented in Figure 2.

2.2.1. The Energy Analysis

Before starting the comparison between the energy performances of both PS and CS, the performances of only PS are evaluated by means of the specific power grid impact index (z) introduced in [26]. z index is defined as reported in Equation (1):
z = E E l _ exp P G + E E l P G _ P S E E l U C
z index is the ratio between the sum of electricity exported to the main power grid ( E E l _ exp P G ) and taken off PG ( E E l P G _ P S ) and the total urban community electricity needs ( E E l U C ). E E l _ exp P G is the electricity produced by PV panels installed on UC buildings that is not exchanged among users in UC.
PS and CS are compared from an energy point of view by means of the Fossil Primary Energy Saving (FPES) index (Equation (2)). It expresses the primary energy saving due to fossil fuels achieved by PS with respect to CS (PECS − PEPS) and primary energy of CS (PECS).
F P E S = P E C S P E P S P E C S
where:
P E C S = E E l U C η E l P P
P E P S = E E l P G _ P S E E l _ exp P G η E l P P = ( E E l U C E E l P V ) E E l _ exp P G η E l P P
Primary energy due to CS (Equation (3)) is the ratio between the annual urban community electricity requirement and the average Italian power plants mix efficiency in 2017 ( η E l P P ), calculated considering the hourly electricity generated from fossil fuel-based thermo-electric power plants, renewable plants and including also the grid losses in 2017 [27]. η E l P P is equal to 0.476. Primary energy of PS (Equation (4)) is proportional to the electric energy taken from grid ( E E l P G _ P S ) that is the amount of energy required by UC and not satisfied by electricity generated from PV panels ( E E l P V ). Moreover, the electric energy produced by PV panels and exported to main power grid ( E E l _ exp P G ) because it is not used to satisfy urban community requests, is accounted as a “credit” in energy analysis.

2.2.2. The Environmental Analysis

The avoided carbon dioxide (CO2) emissions index (∆CO2) is used to compare the environmental performance of PS and CS. ∆CO2 index (Equation (5)) represents the amount of CO2 emissions reduction achieved using PS with respect to CS on the basis of a simplified approach:
Δ C O 2 = C O 2 C S C O 2 P S C O 2 C S
where:
C O 2 C S = α E E l U C
C O 2 P S = α ( E E l P G _ P S E E l _ exp P G )
CO2 emissions of both CS (Equation (6)) and PS (Equation (7)) are defined by means of Italian average CO2 emission factor for electricity (α) in 2017. α factor is equal to 356 gCO2/kWhEl and it is evaluated considering Italian hourly electricity produced both by thermoelectric power plants and renewable-based plants including grid losses [27]. C O 2 P S emissions depend on electricity exported to main power grid ( E E l _ exp P G ) that is considered as a “credit” in C O 2 P S (as it has already done for energy analysis) according to methodology proposed in [28].

2.2.3. The Economic Analysis

Economic analysis is performed by assessing the investment cost (IC) of PS with respect to CS (Equation (8)). Hereinafter, it is considered that all the infrastructures referred to CS predate PS installation and thus, no Investment Cost (IC) can be imputable to CS:
I C = I C P V + I C L M
where:
  • IC is the investment cost of hybrid distributed energy system (PV panels and local microgrid connecting the agents of UC);
  • ICPV is the investment cost of photovoltaic plants equal to 1000 €/kW [29]. It includes all PV plants infrastructures (inverter, modules, wiring, etc.), transportation and installation costs and 10% VAT.
  • ICLM is the investment cost of the local microgrid (LM) which connects the agents in urban community. This cost is equal to 9.59 €/m [30] and it considers the electric wirings cost and their undergrounding as well as the dumping of waste materials.
Furthermore, the difference between operating cost of CS and PS (∆OC) is calculated according to (Equation (9)):
Δ O C = O C C S O C P S
where the Operating Cost (OC) of PS and CS is defined with reference to Equation (10) and Equation (11), respectively:
O C C S = c u . E l E E l U C
O C P S = O C P G _ P S O C E l _ exp P G + O C O & M
where:
  • O C P G _ P S (Equation (12)) and O C E l _ exp P G (Equation (13)) are the operating costs due to the electricity imported from and exported to power grid respectively. and they are expressed as following:
    O C P G _ P S = c u . E l E E l P G _ P S
    O C E l _ exp P G = c u . E l _ exp P G E E l _ exp P G
    cu,El is the unitary cost of electricity taken from the grid equal to about 187 €/MWh [31], that depends upon the amount of electricity imported from main power grid both for PS and CS.
  • c u . E l _ E x p P G is the unitary cost paid for the electricity exported to main power grid. It amounts to about 55 €/MWh [31];
  • O C O & M are the operating and maintenance costs that are equal to 3% of the whole initial investment cost [31].

3. Proposed System Energy Analysis Results

This paper describes the results of the application of the described agent-based model to an urban community (UC) located in Southern Italy. The area counts 370 buildings, the majority of them belonging to social houses (i.e., building stocks owned by the local government and rent to people with low incomes), but also including independent houses owned and occupied by a single-family unit, supermarkets, retail shops and a church. The electricity demands of the area have been collected merging data derived from both audits and public databases of the National Statistical Institute [32] and by Terna S.p.A. [33] for residential buildings. For non-residential buildings, data have been averaged from Confcommercio [34] and the Italian National Agency for New Technologies, Energy and Sustainable Economic Development (ENEA) [35]. Geometrical features of the rooftops derive from a data collection campaign: available data refer to the typology of roof (span or flat), to the orientation and shading from surrounding buildings. Two panoramic views of the area are reported in Figure 3.
As regards to the proposed systems the analysis is conducted considering nine different installed PV capacities in urban community, ranging from 2000 kW to 18,000 kW. In particular, PV panels have been first placed on the buildings that display the highest rooftop areas and have been then progressively increased taking into account all required constraints (inclinations, exposition and shading factors, cabling area and maintenance spaces). On average, the electrical energy production for the simulated area can be estimated to be around 1500 kWh/y per 10 m2 of south-oriented surface [22].
The two scenarios are described as follows:
  • Scenario#1 (Sc#1): the agents of proposed system are able to exchange electric energy if their mutual spatial distance d l is lower than 50 m.
  • Scenario#2: (Sc#2): the geographical allowed distance threshold between two agents that want to exchange electricity is extended to 200 m.
The choice of the two scenarios mainly derives from the simulations conducted in the previous research [22]. In fact, it has been demonstrated that the distribution among agents is enhanced in correspondence with allowed distances 50 m and, generally, for distances limited to 200 m. So, to highlight differences, it has been chosen to conduct the current analysis for the minimum and maximum values resulting from the simulations.
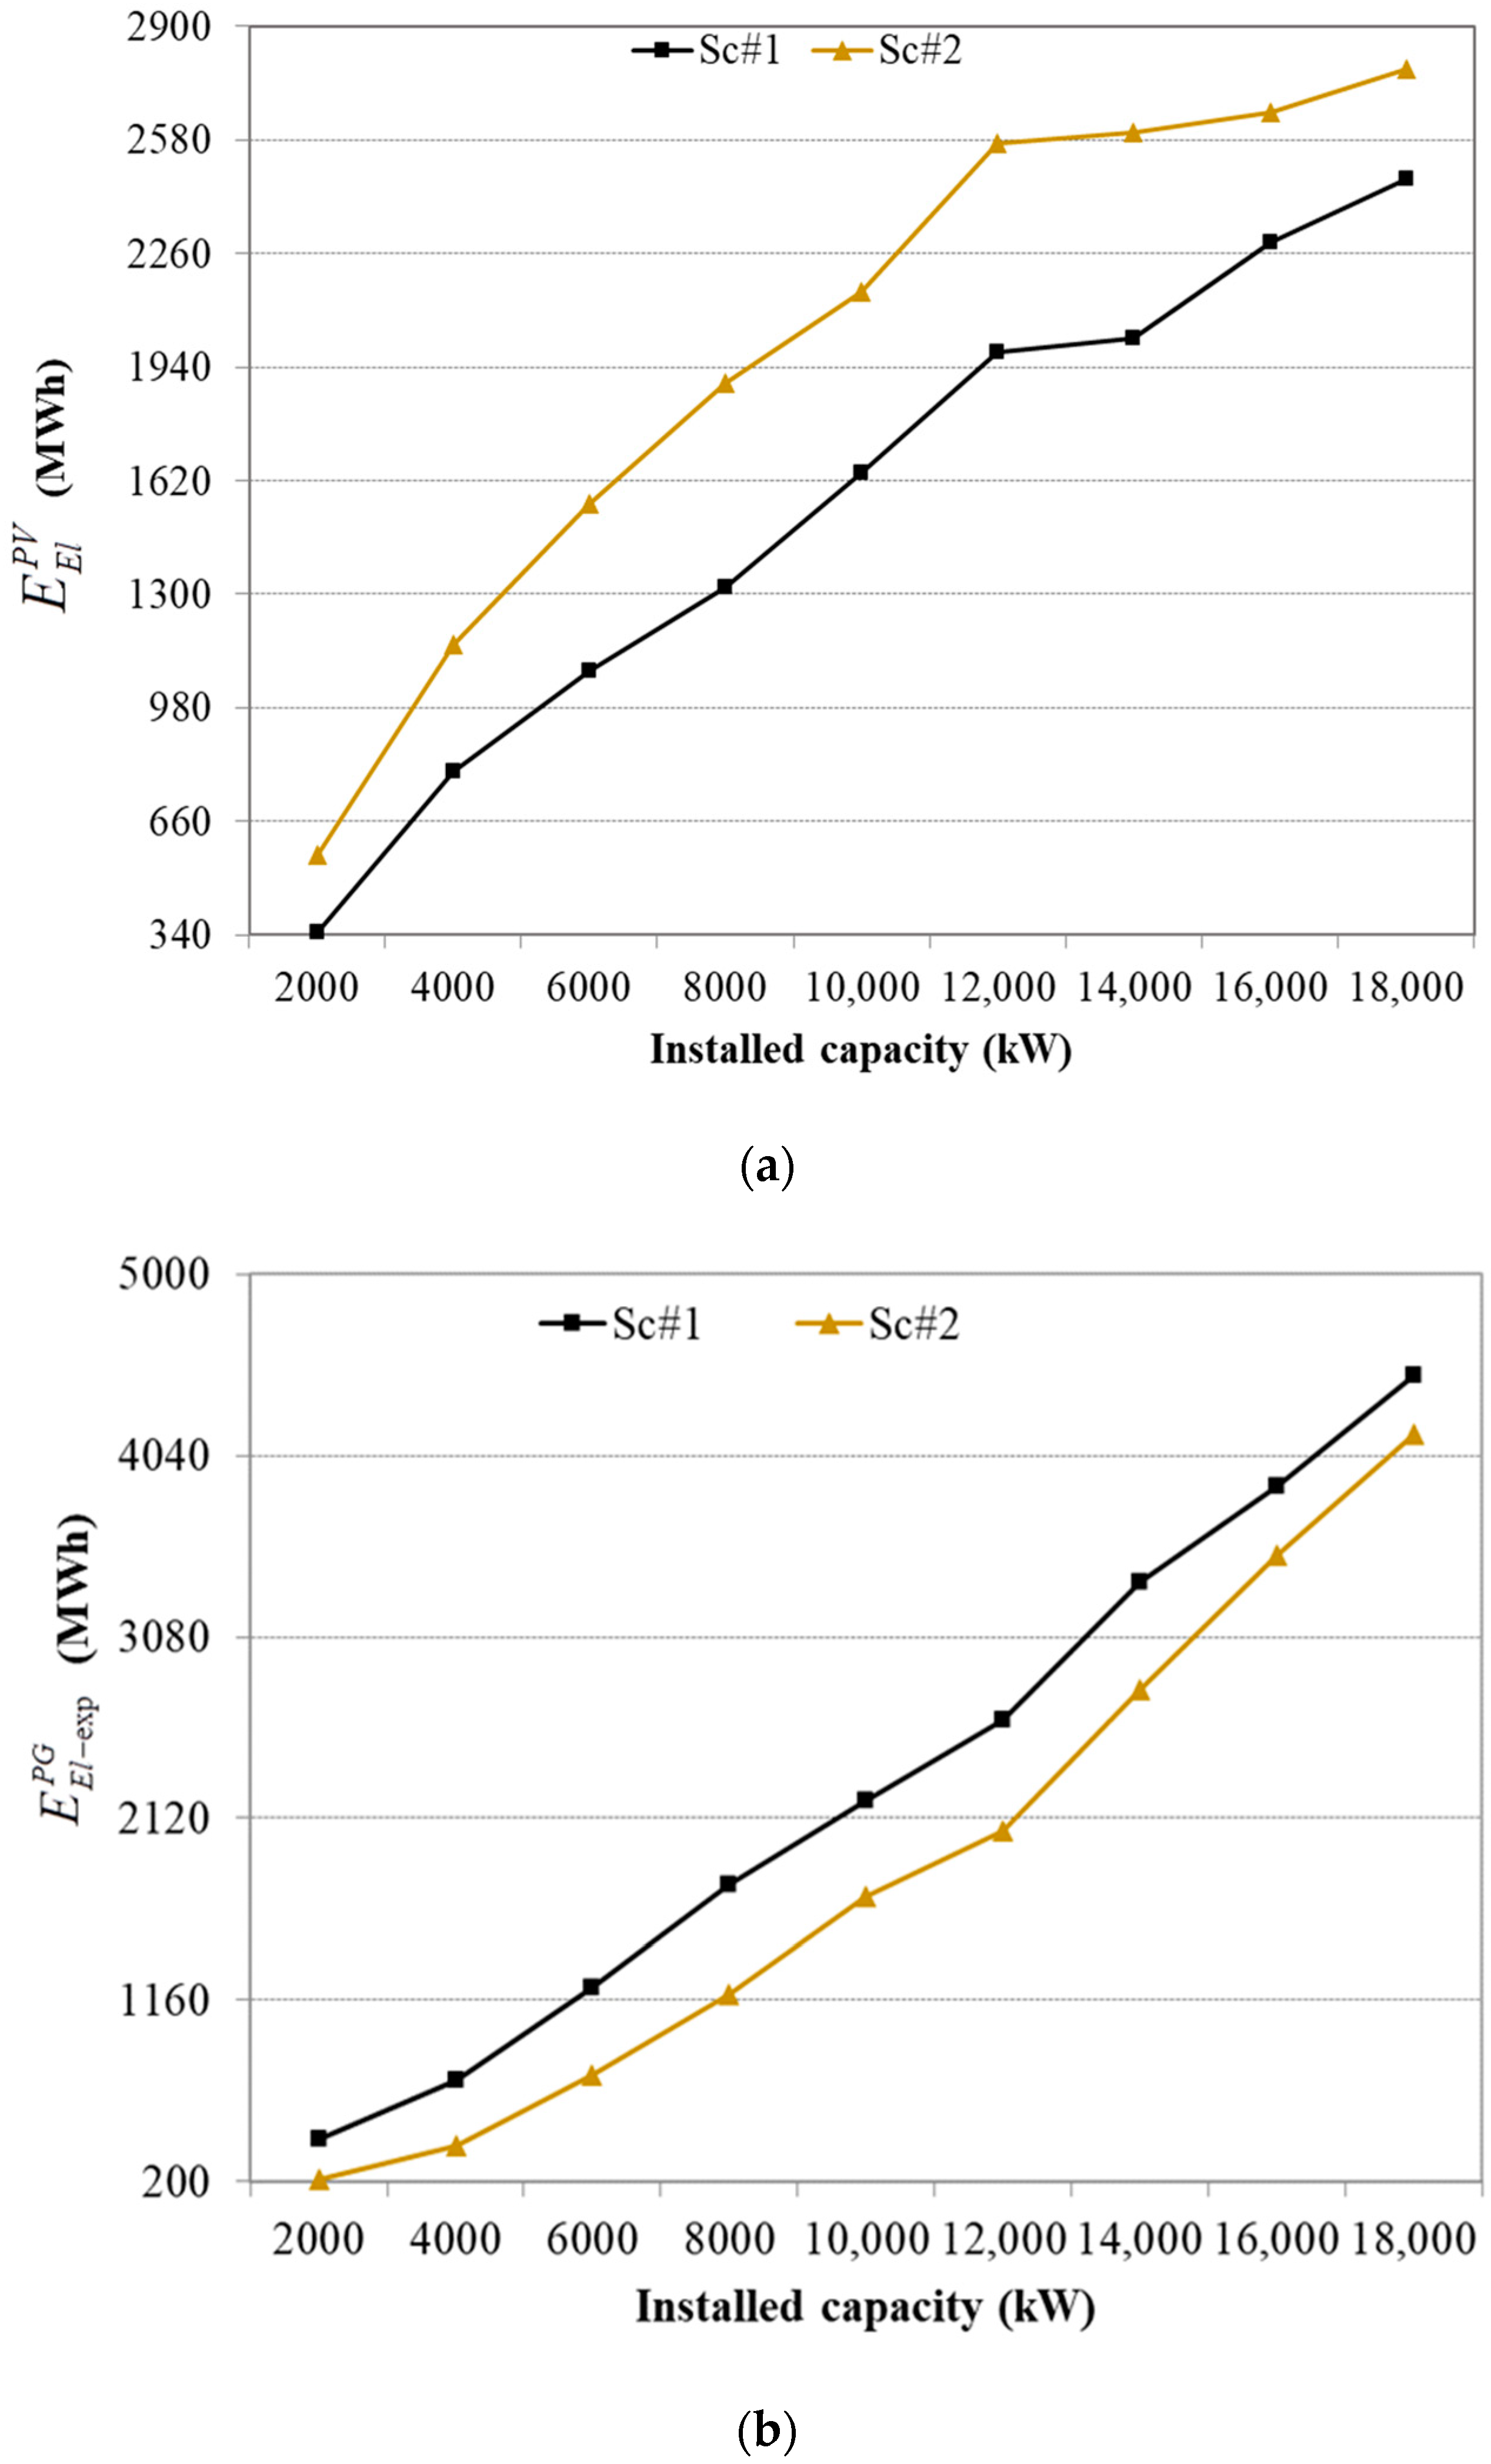
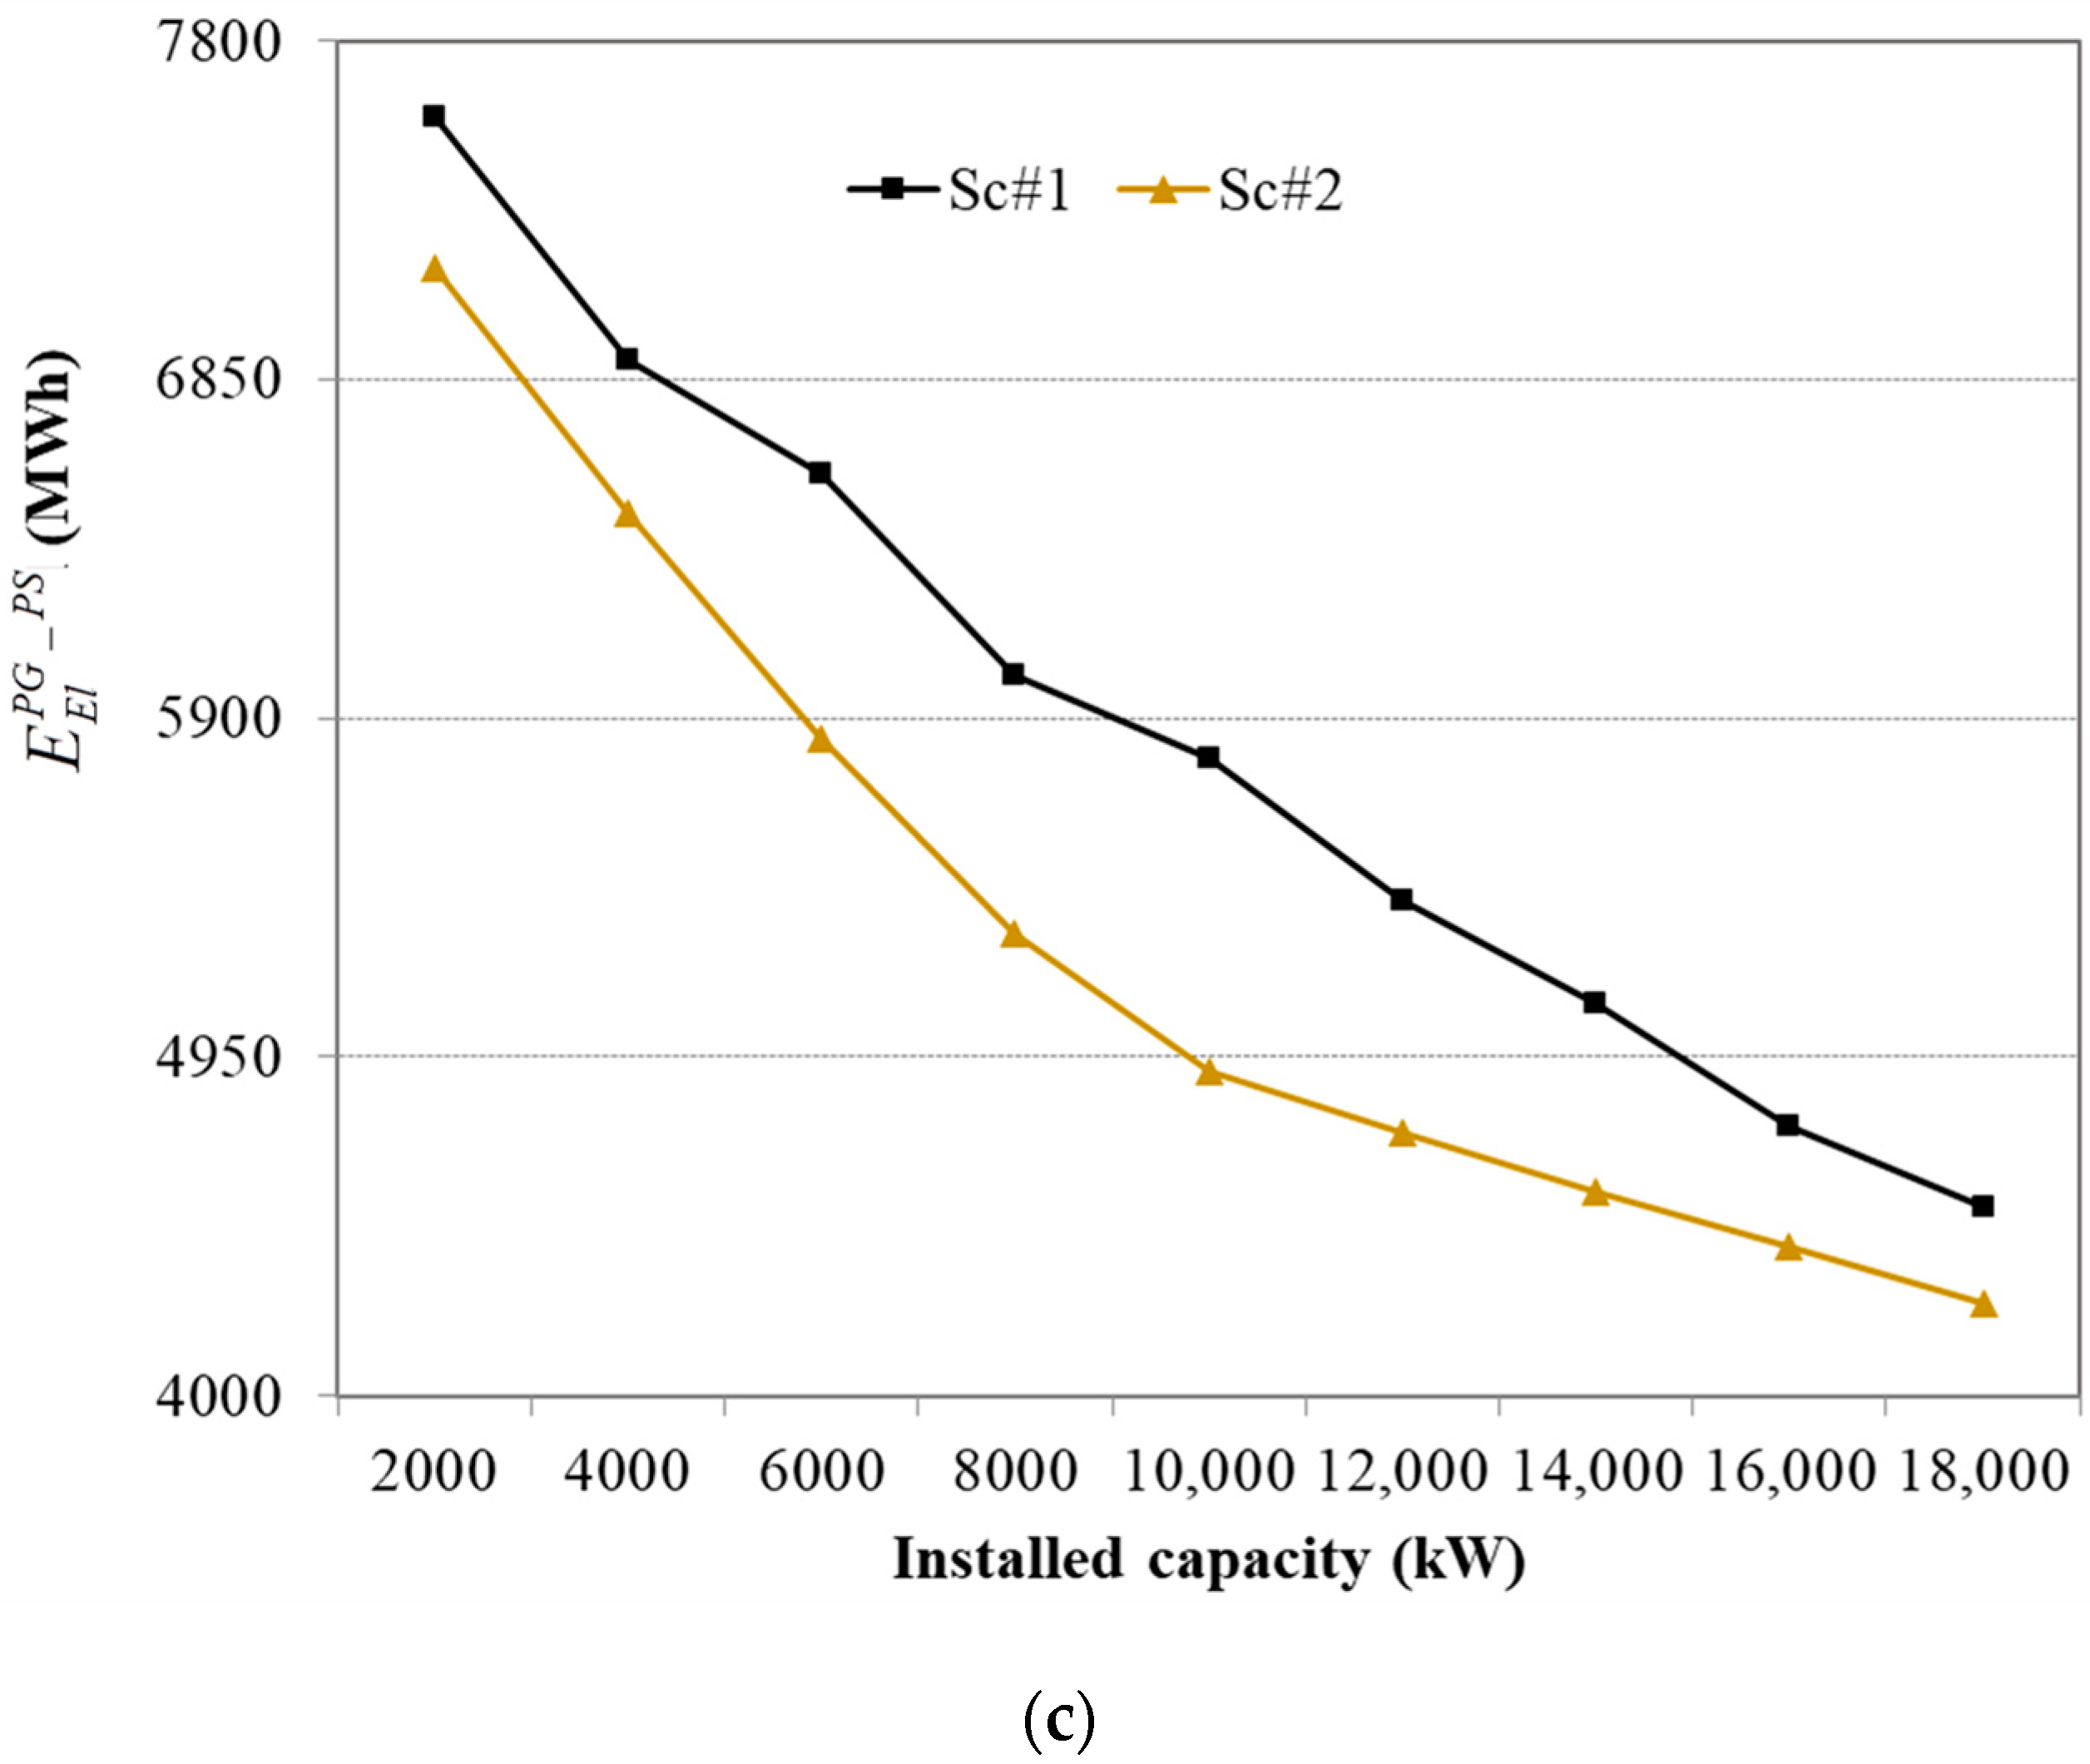
Figure 4 shows the outputs from the simulation including the electricity distributed within the local microgrid, the electricity exported to the main power grid and the electricity imported from it.
The electricity distributed within the local microgrid by agents with positive distribution potential is reported in Figure 4a at varying the installed PV capacity and for the two simulated scenarios. In both scenarios, the increase of the installed capacity yields an increase of the amount of electricity exchanged among agents.
The trends of both curves show an almost linear increase until the installed capacity is 12,000 kW, becoming smoother beyond this value. This is due to the fact that the higher installed capacity means higher diffusion within the territory and, therefore, a higher distribution potential. Moreover, the difference between the two scenarios is evident as far as an increase of the admitted distance of connection gives rise to a higher amount of electricity exchanged within the local microgrid. Figure 4b reports the electricity exported to the power grid; actually, after the satisfaction of their own demands and the distribution to other requiring neighbours, agents can still have a residual electricity production that is exported, in this case, to the main grid.
Coherently with the results plotted in Figure 4a here the electricity exported to the power grid decreases for any installed PV capacity at increasing the distance of connections between each agent’s pair: in this case, in fact, agents gain the chance to distribute their production to a higher number of neighbours.
As expected, the increase of the installed capacity in both scenarios produces an increase of the electricity exported to the traditional power grid. Finally, Figure 4c plots the electricity imported from the main grid despite the distribution within the local microgrid. As can be seen, the request to traditional fossil-fuelled grid decreases significantly at increasing the installed capacity in the territory. To this beneficial result, the observation that part of the electricity produced by agents, i.e., deriving from renewable sources, is exported to the grid play a noteworthy part in reducing the role of fossil consumption.
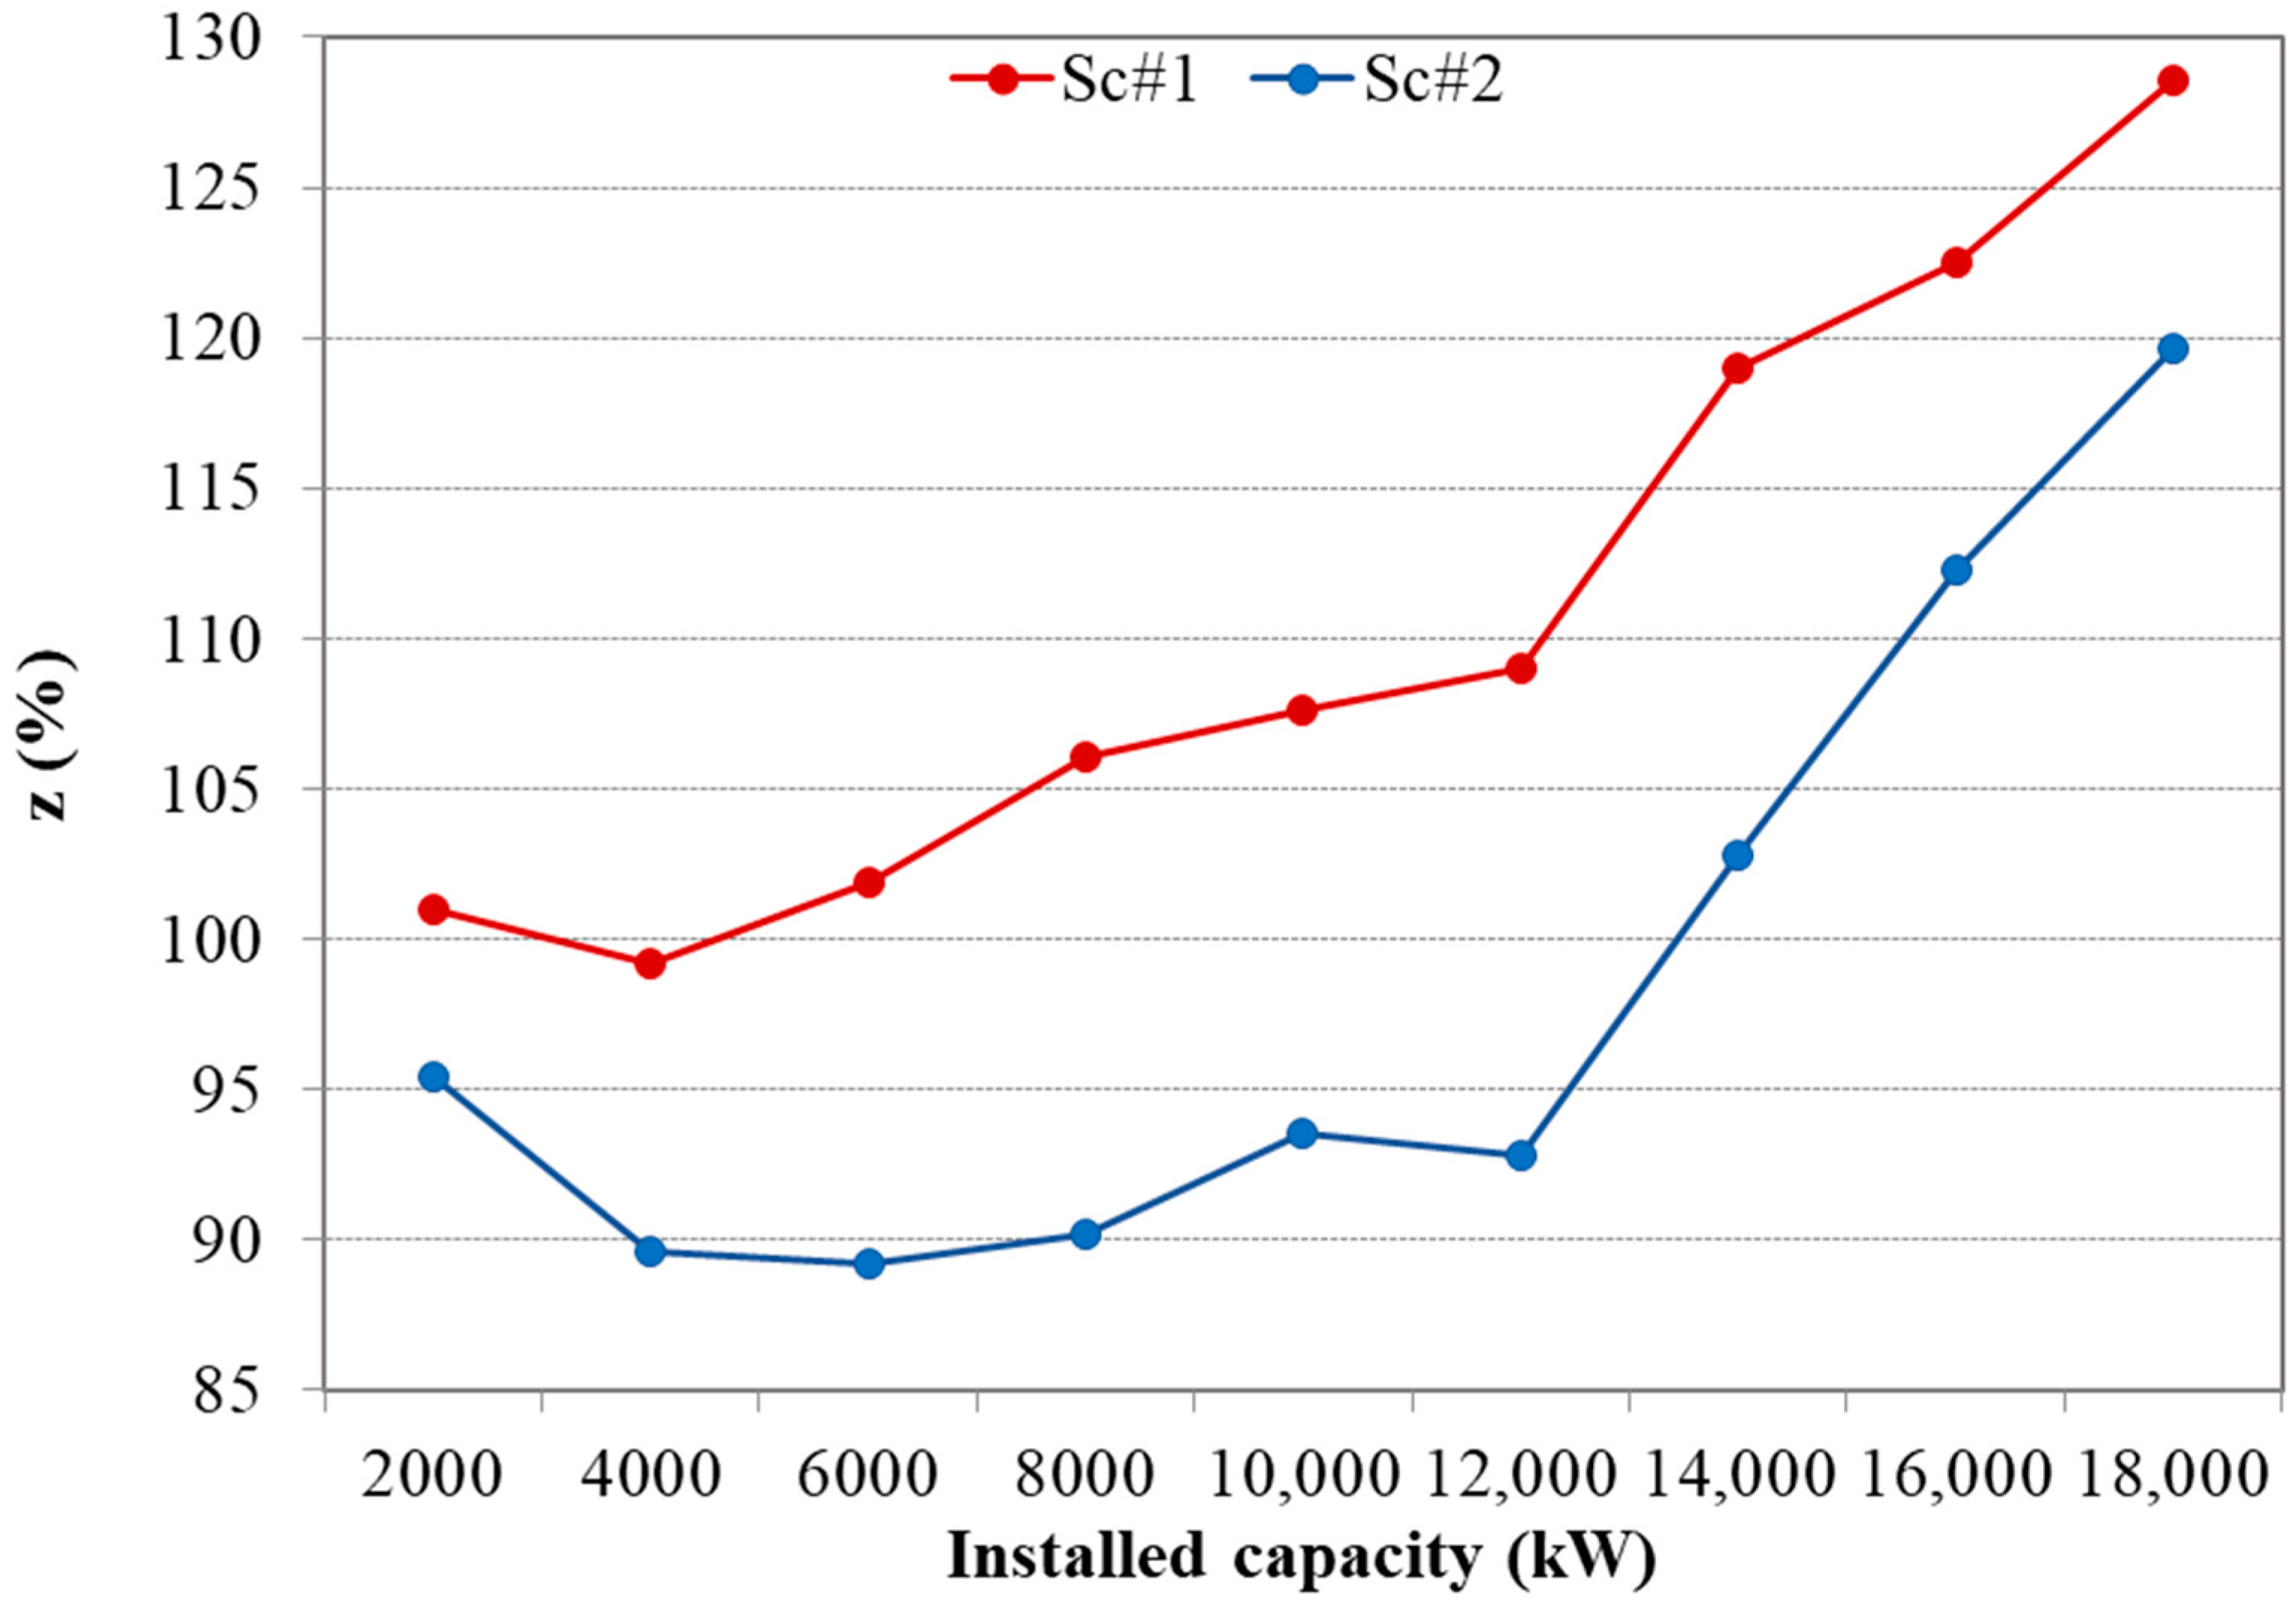
Figure 5 shows the z index trends as a function of PV installed capacity in urban community for both analysed scenarios (Sc#1 and Sc#2).
The z index accounts for the specific power grid impact and, as expected, it is lower in Sc#2 with respect to Sc#1 for each installed PV capacity option. Indeed, in Sc#2 the electricity exported to and imported from main grid is minor than Sc#1 since the spatial distance allowed for electricity exchange among agents is extended to 200 m, so the z index varies from 99% to about 133% in Sc#1, while in Sc#2 it ranges from 89% to 130%.
The highest value of the z index is obtained for 18,000 kW PV power in both scenarios, whereas the minimum value is achieved for 4000 kW and 6000 kW PV installed capacity in Sc#1 and Sc#2, respectively. These lowest values represent the best compromise, in terms of PV size, between the self-consumption of photovoltaic electricity and the reduction of the electricity taken from the main grid. The z index higher than 100% means that the sum of electric energy imported from and exported to main grid is greater than urban community electricity requests. This condition occurs with an increase of PV capacity beyond 12,000 kW in Sc#2 instead it is verified for the majority of PV power considered excepted for 2000 kW and 4000 kW in Sc#1.
In order to reduce the electricity exported to the main power grid maximising the on-site PV electricity consumption, the possibility to install an electric storage or a mobile electric storage, such as the mobile electric vehicles used within urban community could be considered.

4. Energy, Environmental and Economic Comparison Analysis Results and Discussion

The energy, environmental and economic comparison analysis introduced in Section 2 has been applied to PS and CS and the major results are reported in the following. In Figure 6 FPES index (Equation (2)) and primary energy of CS (Equation (3)) and PS (Equation (4)) in both scenarios and for each PV installed power are reported. Primary energy of conventional system (PECS) does not vary changing PV power and scenario since it depends only upon the electricity requested by urban community ( E E l U C ) that remains constant. PECS (16,776 MWh) is always higher than primary energy of proposed system (PEPS) in both Sc#1 and Sc#2. Precisely, PEPS in Sc#2 is lower than PEPS in Sc#1 since the higher allowed mutual spatial distance among agents for the electricity exchange in Sc#2 lead to a reduction of numerator in Equation (4). Indeed, the distributed electricity in the urban community increases and contemporary the electricity exported to the main power grid, considered as a credit, decreases for each PV installed capacity. As regards to Fuel Primary Energy Saving (FPES) index, it is always positive demonstrating that PS ensures a primary energy saving with respect to CS in all considered cases and scenarios. In addition, FPES rises with PV installed power thanks to the renewable-based electricity production increase. It moves from 10% to about 99% in Sc#1 and from 12% to 99% in Sc#2.
The values of FPES index near 100% is reached for the maximum PV capacity power in both scenarios since in this condition the amount of electricity imported from and exported to power grid in PS are very similar. This condition occurs for two reasons:
  • even if the amount of electricity produced by PV plants is lower than that requested by the urban community, the photovoltaic electricity is often available when the urban community electricity demand is low and thus it is exported to the main power grid;
  • the electricity demand of some agents cannot be satisfied by photovoltaic electricity because their mutual spatial distance is higher than that one allowed in each scenario.
The first issue can be overcome coupling PV plants with electric storage in order to store the energy produced by a photovoltaic system and to make it available for use when it is requested. The second issue can be solved changing the allowed mutual spatial distance or selecting the connections among buildings following energy criteria (such as the amount of electricity requested and the PV power installed).
Environmental analysis has been carried out by evaluating the avoided carbon dioxide emissions index (∆CO2) introduced in Equation (5). It has a behaviour similar to FPES as it can be seen from Table 1. The introduction of PV-based systems guarantees a considerable reduction of CO2 emissions due to fossil fuels especially in Sc#2 where higher values of ∆CO2 index are achieved compared to those of Sc#1. In particular, as it has been observed for FPES index, the avoided CO2 emissions rises with the installed PV power and the allowed spatial mutual distance for electricity exchange among agents.
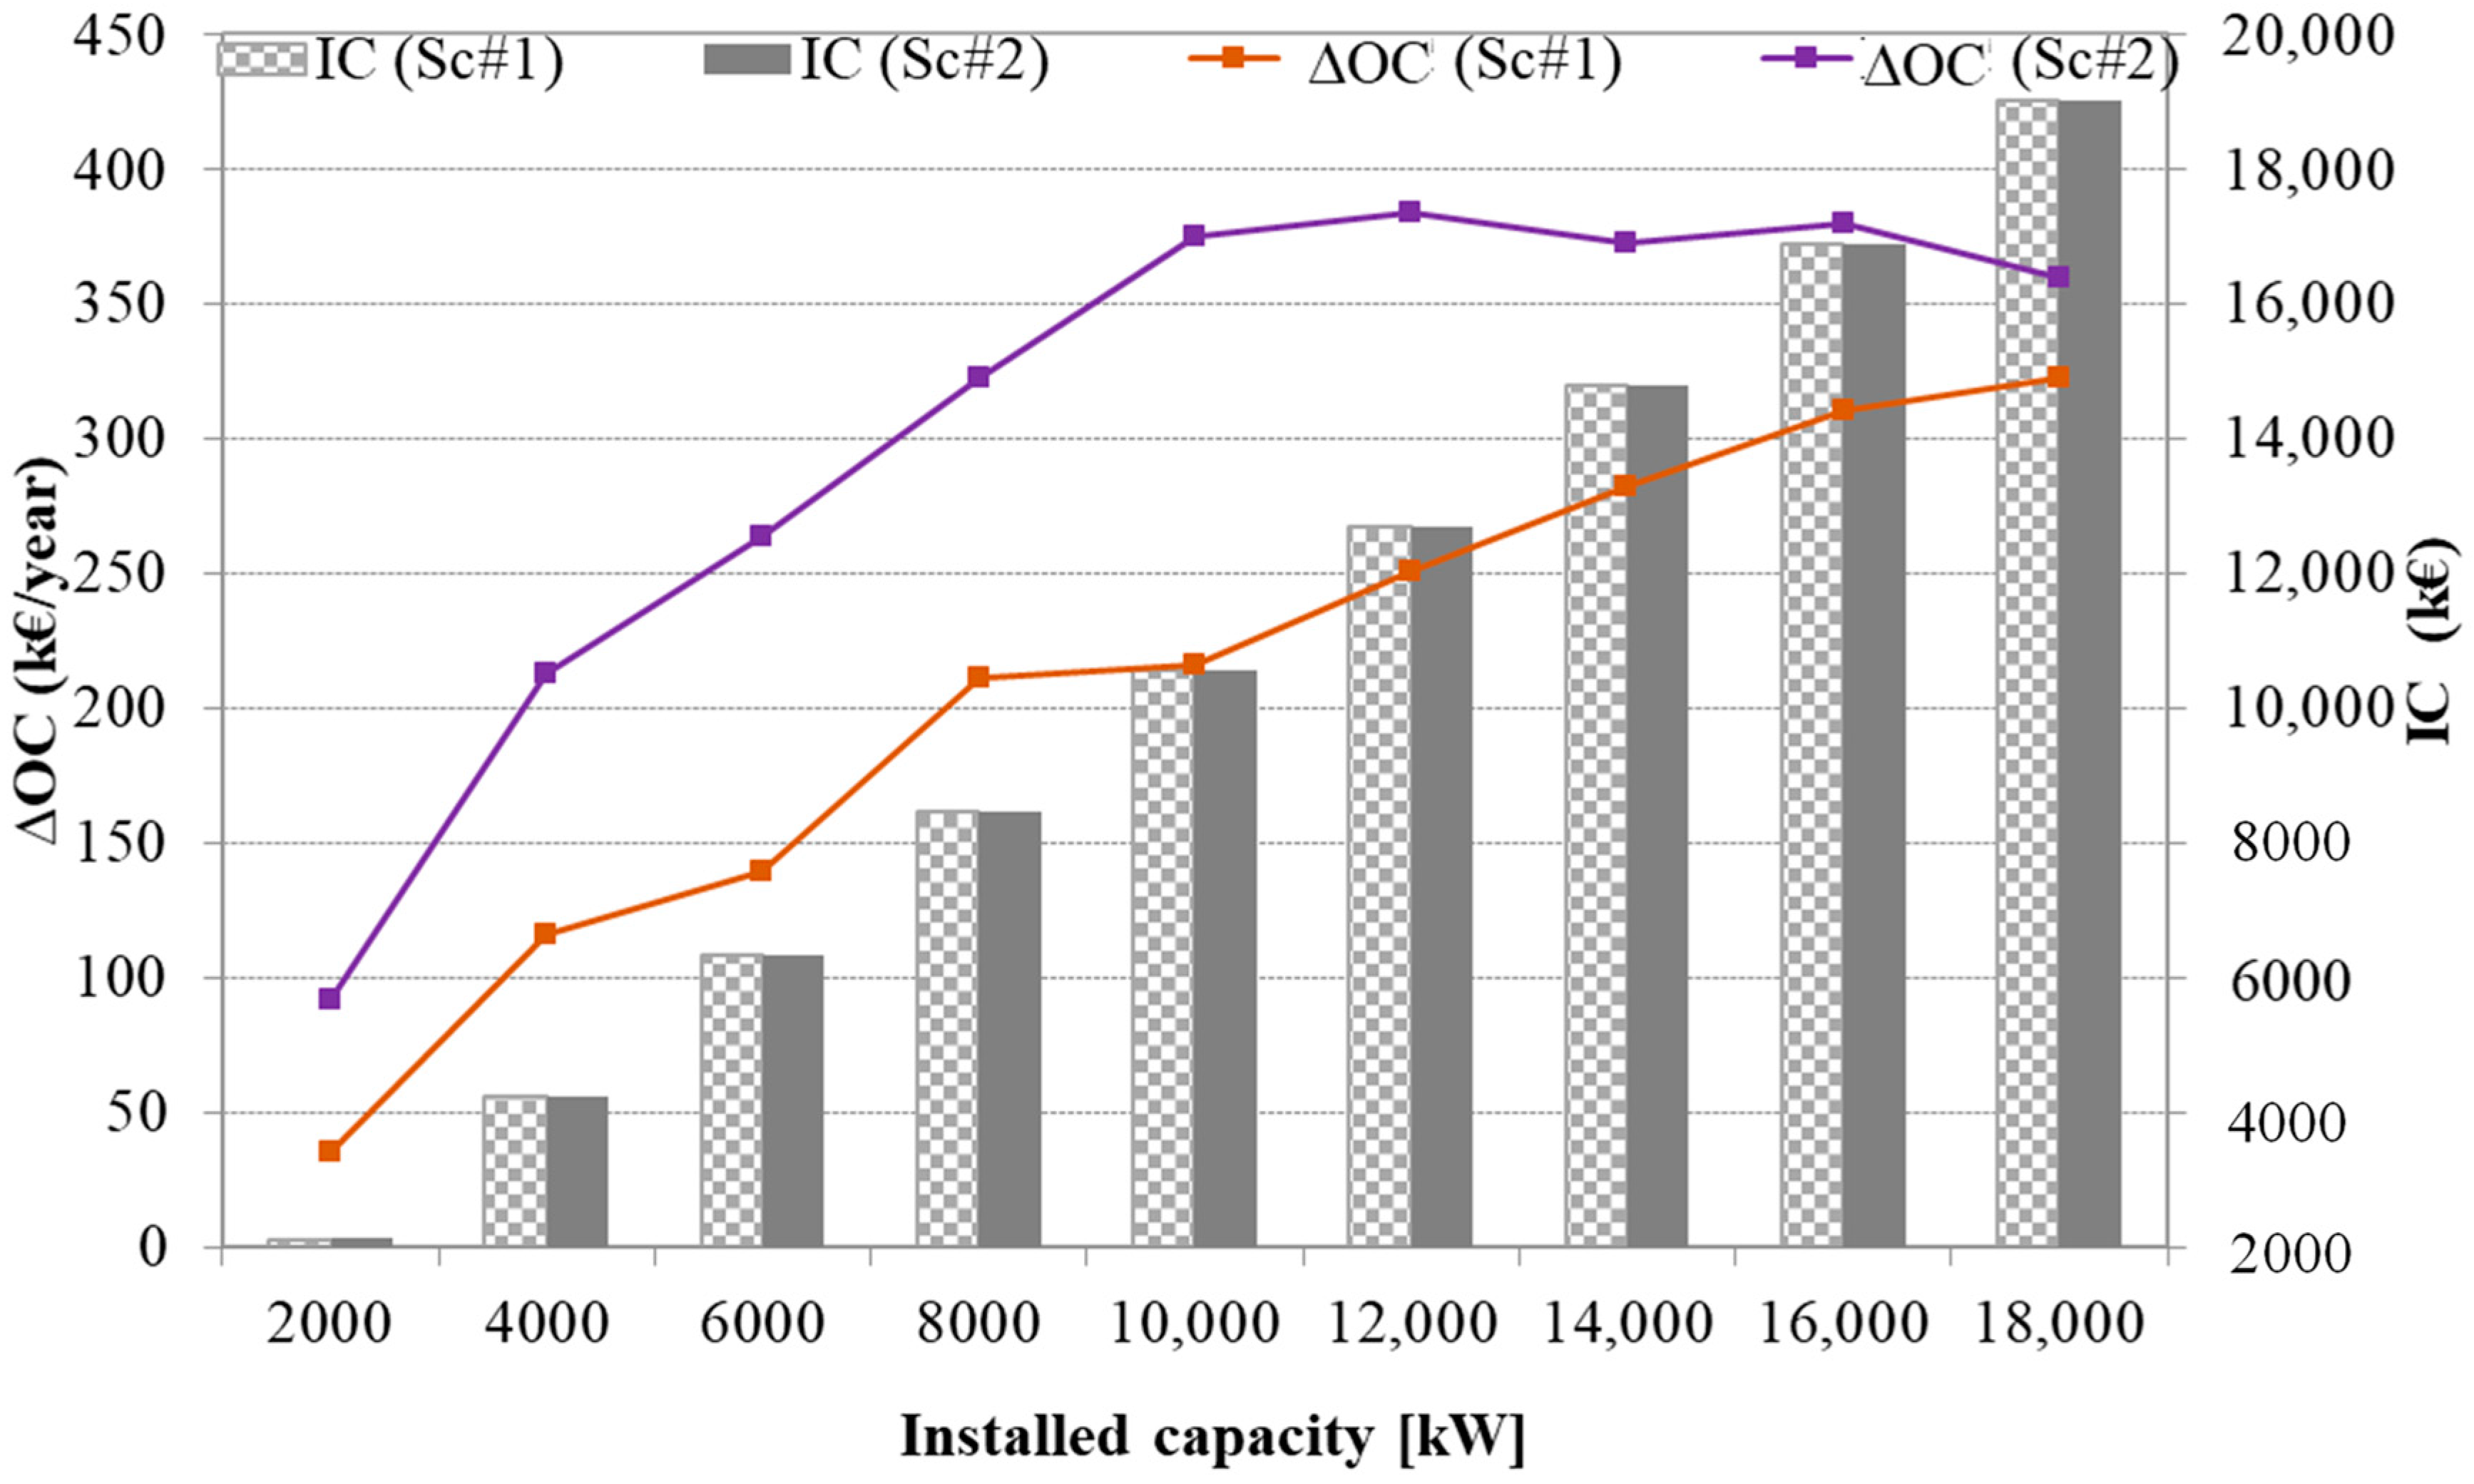
Economic analysis has been performed by calculating the investment cost (IC)for PS according to Equation (8) and the difference between operating cost of CS and PS (∆OC) as introduced in Equation (9) for both scenarios. Figure 7 reports ∆OC and IC trends as a function of PV power. Obviously, IC increases with PV installed capacity. Whereas, the difference between the IC in Sc#1 and Sc#2 is not appreciable since it mainly depends upon the cost of local microgrid connecting the agents. The Investment cost of local microgrid (ICLM) varies between two scenarios because of different length of IG nevertheless, this variation is not substantial compared to the investment cost of photovoltaic system (equal in both scenarios for a fixed PV power) which covers about 98–99% of total investment cost. ∆OC is higher in Sc#2 than Sc#1 and it reaches its maximum value (383 k€/year) at 12,000 kW PV installed power. ∆OC in Sc#1 is significantly lower since the amount of electricity imported/exported to/to grid varies between two scenarios and then its economic valorisation too.
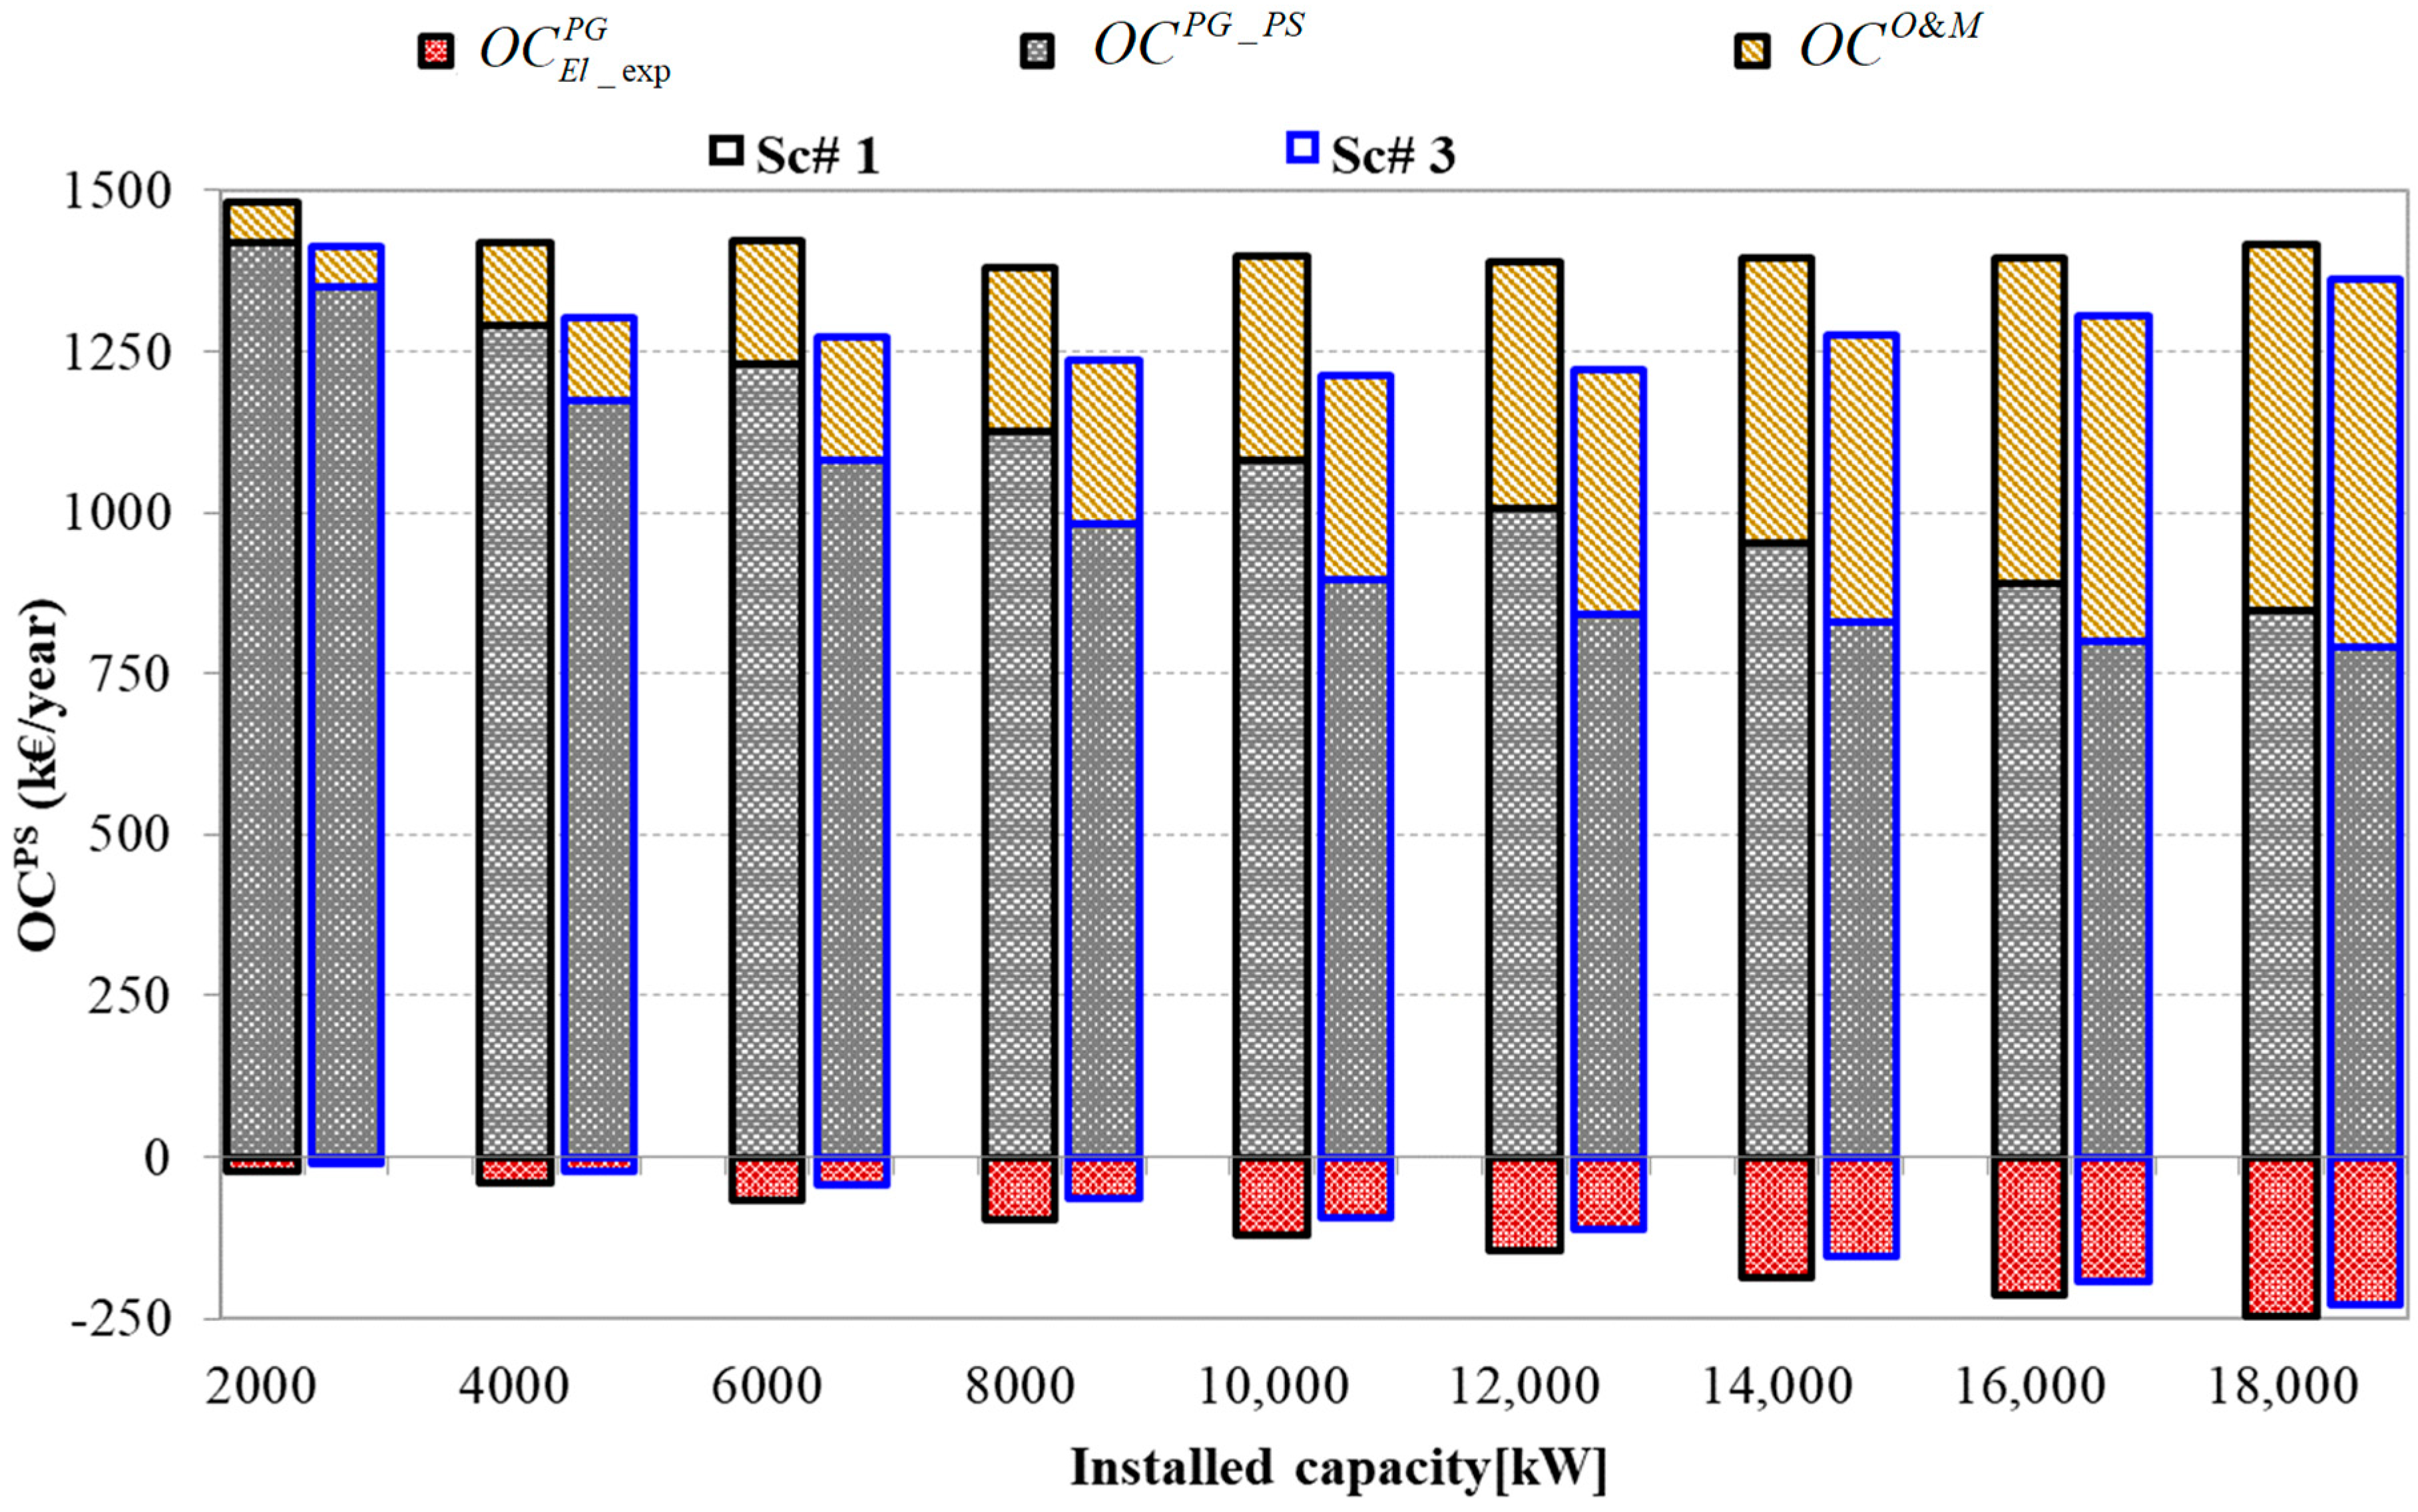
In order to better analyse the operating costs of PS, each term expressed in Equation (11) is displayed in Figure 8 for Sc#1 and Sc#2 and for all PV powers, while operating costs of conventional system (OCCS) are constant and they are equal to 1494 k€/year. The most of operating costs of proposed system (OCPS) is constituted by operating costs due to the electricity imported from main power grid (OCPG_PS) for all PV installed powers, but its contribution decreases with PV power increase. On contrary, the operating cost due to electricity exported to main power grid ( O C E l _ exp P G ) and the operating and maintenance costs (OCO&M) show an opposite trend rising with PV installed capacity. More in detail, OCPS in Sc#1 is higher than Sc#2 because two contemporary events occur:
  • #1 the decrease of electricity imported from main power grid;
  • #2 the decrease of electric energy exported to power grid.
While the first event contributes to a reduction of OCPS the second one should contribute to enhance the total operating cost according to Equation (11). This condition is not verified because the economic valorisation of electricity exported to power grid ( c u . E l _ exp P G ) is substantially lower than that one of electricity imported from grid ( c u . E l ). Thereby, considering 12,000 kW PV power installed (at which the greatest ∆OC occurs) OCPS are equal to 1242 k€/year and 1110 k€/year in Sc#1 and Sc#2, respectively. In this case the electricity exported to the power grid is 2643 MWh/y in Sc#1 and 2057 MWh/y in Sc#2 while the electricity taken from the PG amounts to 5389 MWh/y and 4507 MWh/y in Sc#1 and Sc#2, respectively. By using the investment cost and the operating costs of both proposed and conventional systems it has been possible to evaluate the simple payback period. This index returns the numbers of years needed to recover the investment cost. The calculation provides not favourable results thus, payback period in Sc#2 ranges from 16 to 42 years increasing with the installed PV capacity growth. These outcomes underline the unavoidable urgency to define specific economic incentives at national and European level to support initiatives of users’ aggregation form an energy point of view such as energy community, smart cities, urban districts, energy municipalities.

Sensitivity Analysis

The environmental analysis presented in the previous section is based on the average value of emission factor for electricity production in Italy ( α ). This parameter has been evaluated as the mean value of hourly electricity emission factor in 2017 calculated by the authors on the basis of the Italian hourly electricity production in that year [27]. Indeed, the electricity production mix is variable hour by hour and as a consequence also the emission factor shows the same variability. The variation of emission factor is due to the different environmental impact of the energy sources employed in the electricity generation as well as to the high penetration of renewables (especially in some seasons and hours) with a strong intermittent behavior (such as PV and wind). Thereby, the Italian electricity emission factor ranges from a minimum ( α M i n ) of 152 gCO2/kWEl to a maximum ( α M a x ) of 556 gCO2/kWEl (Table 2). Furthermore, it has been evidenced in [32] that in those countries in which congestion and physical constraints for electricity transmission over power lines occur, often, it is necessary to activate electricity production units near the geographical areas in which the electricity demand takes place. This fact implies that the electricity demand in a zone is frequently met by power units situated in the same territorial area and, since each zone is characterized by an own electricity production mix, the emission factor for electricity shows a spatial variability too. So that, as it has already done for Italy, the environmental indicator on hourly basis referred to Italian electricity market zones (North, South, Centre-North, Centre-South, Sicily and Sardinia) have been evaluated on hourly basis in [36]. Thus, in Table 2 the minimum ( α M i n S i c ), maximum ( α M a x S i c ) and average ( α S i c ) electricity emission factor for Sicily zone (where the analysed urban community is located) in 2017 are listed too.
It can be noticed that all values referred to Sicily zone are higher than those evaluated for Italy since the electricity production mix of Sicily zone is characterized in a large percentage by energy sources with a high environmental impact (such as fossil oil or other liquid and solid fossil fuels).
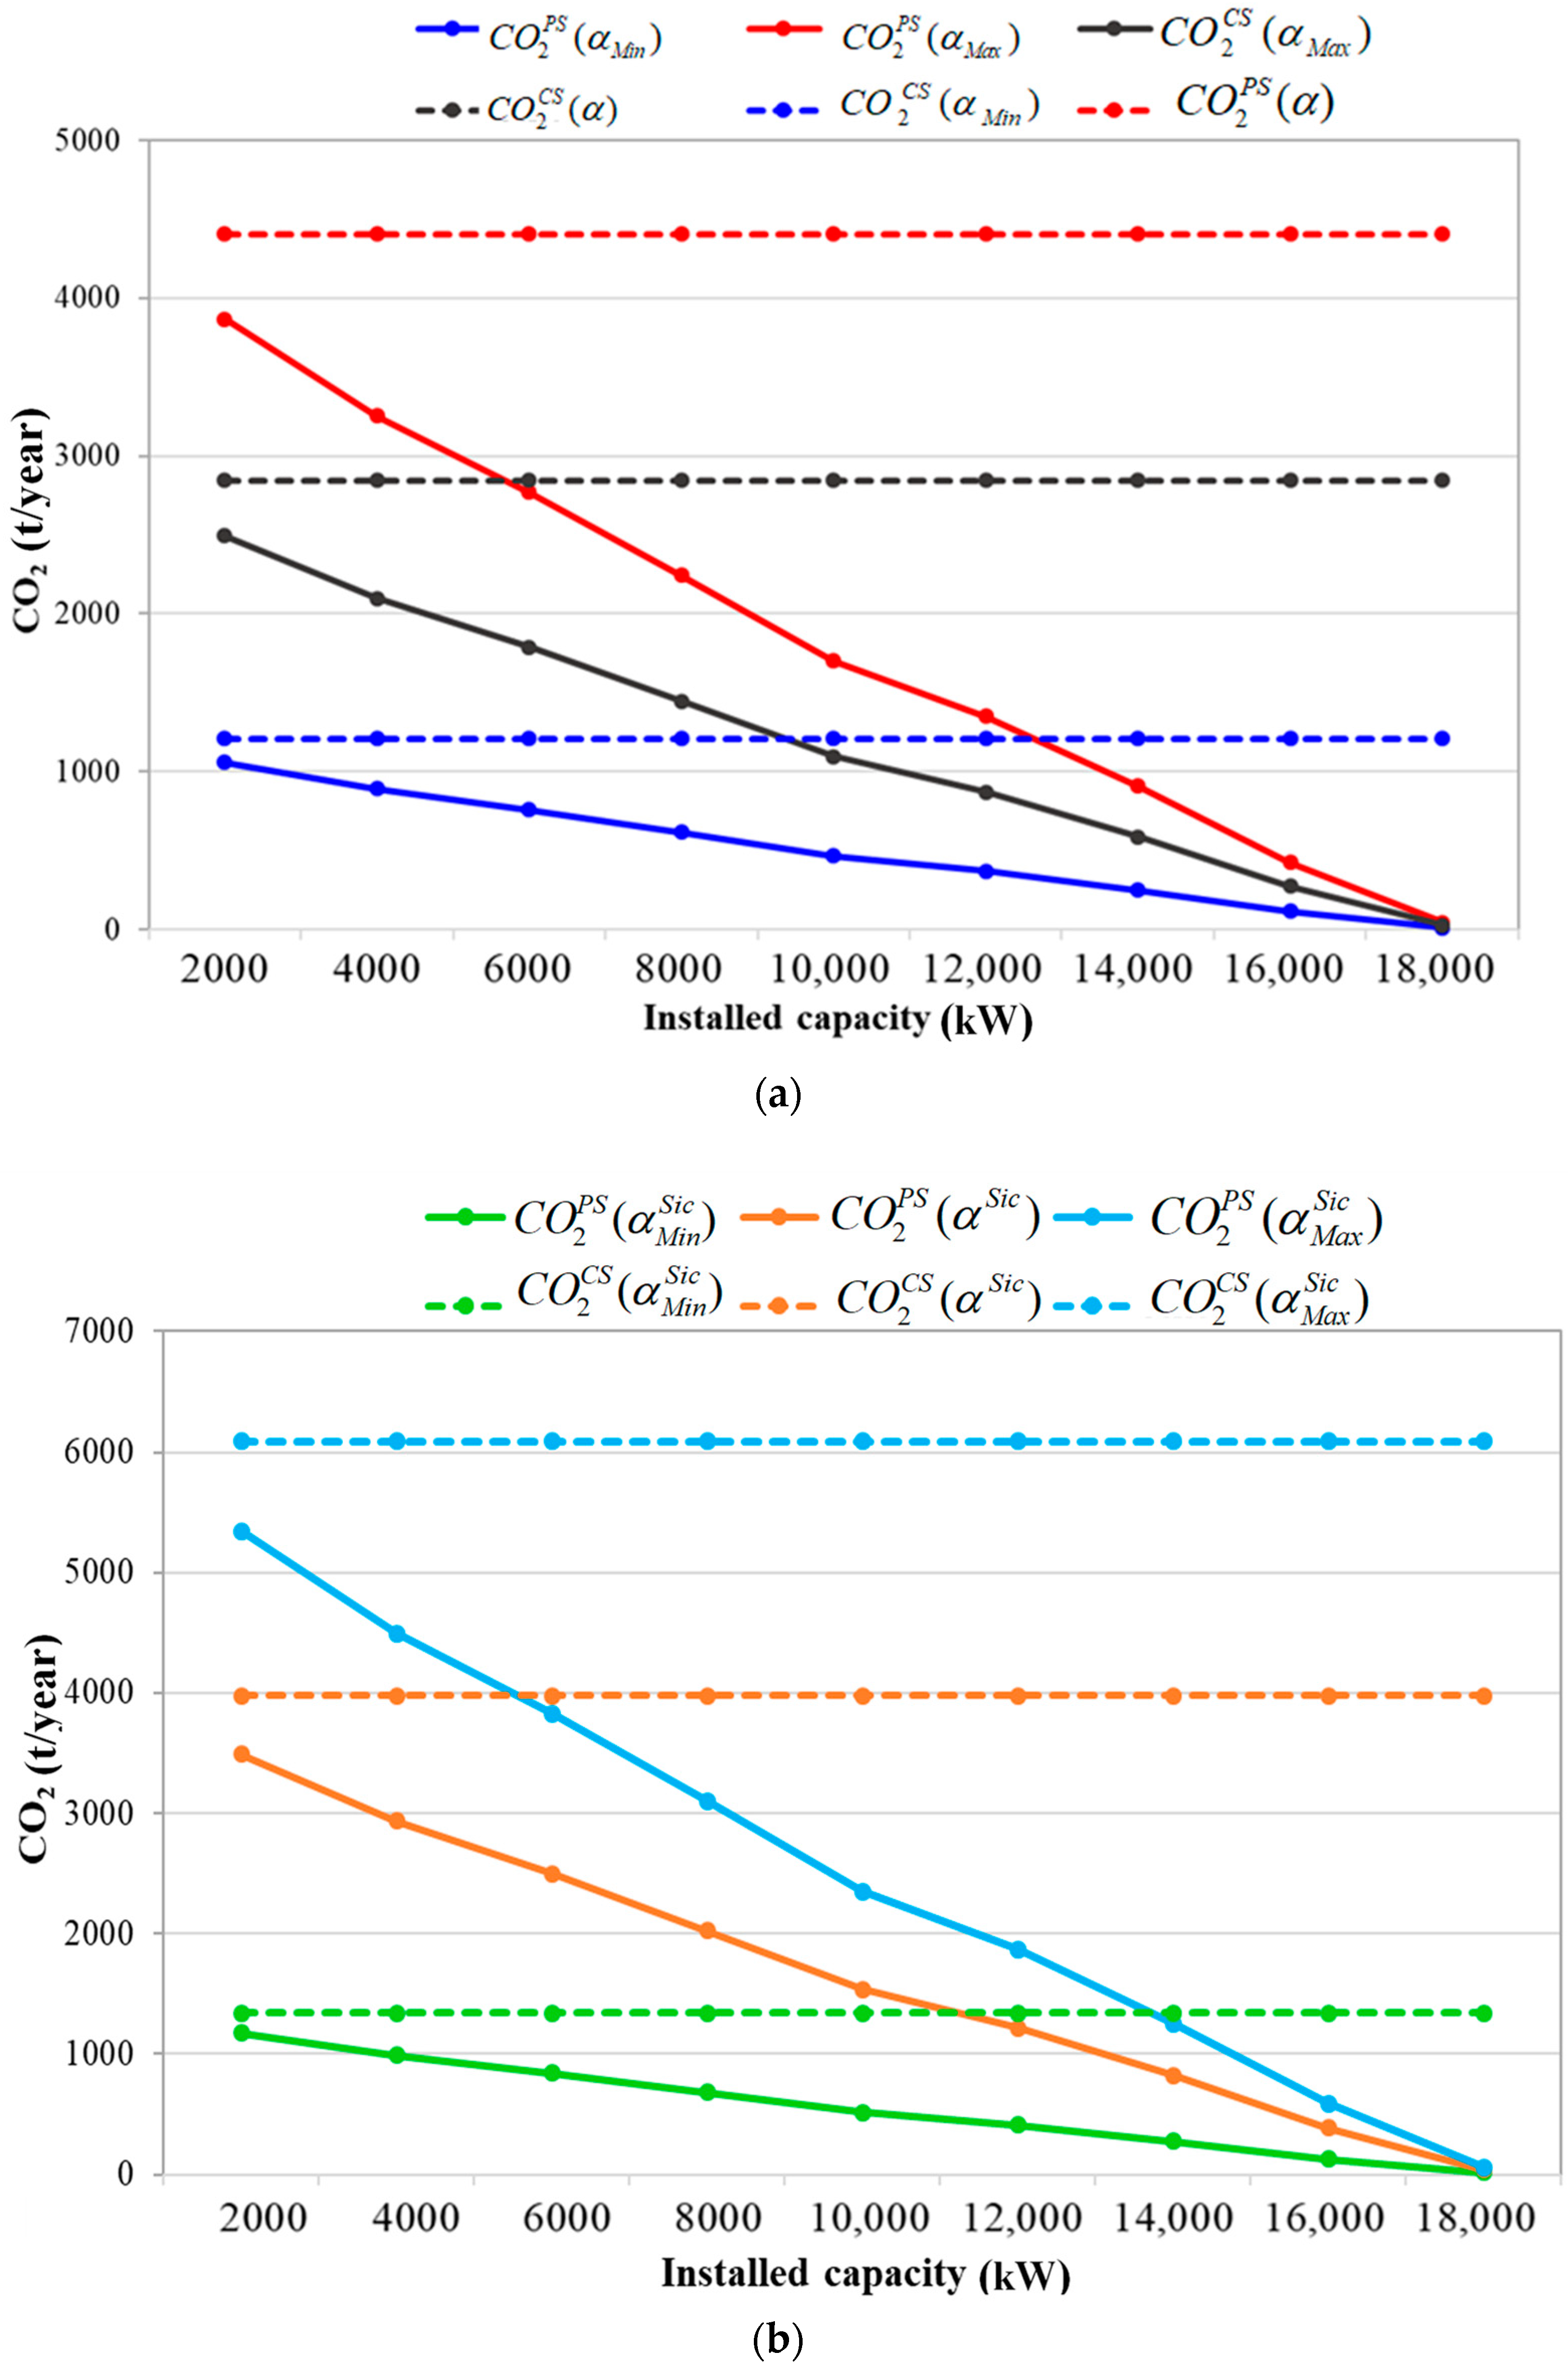
On the basis of these considerations, a sensitivity environmental analysis has been carried out with reference to Sc#2, considering the minimum, maximum and average emissions factor referred to Italy and Sicily zone. The outcomes of this analysis are showed in Figure 9a for Italy and in Figure 9b for Sicily zone, as a function of PV installed power. CO2 emissions of PS and CS have the same trends both for Italy and Sicily zone, but their values are very different. Indeed, if the CO2 emissions of PS are evaluated taking into account the minimum value of electricity emission factor for Italy ( α M i n ) they vary from 1060 tCO2/year (for installed PV capacity of 2000 kW) to 11.89 tCO2 (for installed PV capacity of 18,000 kW). Vice versa, by considering α M i n S i c CO2 emissions for PS rise ranging from 13.18 tCO2/year (for installed PV capacity of 18,000 kW) to 1176 tCO2/year (for installed PV capacity of 2000 kW). Obviously, CO2 emissions of CS calculated by means of α M i n , are lower than those one evaluated through α M i n S i c too. In particular, C O 2 C S ( α M i n ) amounts to 1207 tCO2/year while C O 2 C S ( α M i n S i c ) is equal to 1339 tCO2/year. Considering the worst cases referred to maximum values of emission factors, CO2 emissions grow both for Italy and Sicily zone either in CS and PS. With reference to installed PV power of 2000 kW, C O 2 P S ( α M a x ) is equal to 3867 tCO2/year and C O 2 P S ( α M a x S i c ) amounts to 5344 tCO2/year, while C O 2 C S ( α M a x ) and C O 2 C S ( α M a x S i c ) , that are constant for all installed PV capacities, rise until 4405 and 6088 tCO2/year, respectively. The avoided CO2 emissions index is positive for all considered emission factors, evidencing the environmental benefits of PS use instead of CS.
These results confirm that time and spatial variability of emission factor for electricity can strongly affect environmental analysis results. A similar sensitivity analysis could be carried out for the energy results too. Indeed, an hourly power grid efficiency can be defined both for Italy and all electricity market zones as already discussed by the authors in [27,36].

5. Conclusions

This paper compares the energy, environmental and economic performance of a proposed system based on distributed energy conversion systems and a conventional system. The proposed system is based on photovoltaic plants installed on the rooftops of about 370 buildings (located in the South of Italy) connected by a local electric microgrid. The electricity requests of each building constituting the urban community is satisfied by the electric energy produced by the photovoltaic system or by the near photovoltaic system connected to the grid. When there is a surplus of electricity it is exported to the power grid and, on contrary, when an electric deficit occurs each building is able to draw off electric energy from the grid. The conventional system represents the condition in which each building of urban community taken electricity from the main grid. The proposed system has been previous simulated by means of an agent-based model implemented in NetLogo software using as input, real data concerning building spatial position and electric load, structural dimensions and roof’s characteristics for the PV installation (exposure, shading, orientation and typology of roof).
On the basis of the simulation results, an energy, environmental and economic comparison analysis has been performed between the proposed and conventional systems considering nine different installed photovoltaic capacities ranging from 2000 kW to 18,000 kW and two scenarios. In the first one, agents of proposed system are able to exchange electrical energy if their mutual spatial distance is lower than 50 m, while in the second one this distance is set to 200 m. The main findings can be summarised as follows:
  • the proposed system allows achieving energy, environmental and economic benefits with respect to a conventional one. In particular, the best outcomes are achieved considering the second scenario;
  • the fossil primary energy saving index is always positive moving from 12% to 99% in second scenario;
  • the environmental analysis results follow the energy analysis outcomes highlighting that the avoided carbon dioxide emissions increase with the installed photovoltaic power and the allowed spatial mutual distance for electricity exchange among agents of the local microgrid;
  • the avoided operating cost awards proposed system reaching its maximum value (383 k€/year) at 12,000 kW photovoltaic installed power in second scenario.
In order to improve the performance of proposed system reducing the electricity exported to the main power grid and maximising the on-site PV electricity consumption, future works will consider the possibility of installing an electric storage system or using mobile electric storage such as electric vehicles used within urban community. In this way, it will be possible to temporally uncouple the photovoltaic electricity availability (linked to the solar energy availability) and the electricity needs. The outcomes of this work could be particularly useful for decision makers that operate the energy planning with the scope to maximising the renewables exploitation to reach national and international energy and environmental targets to reach a sustainable development.
Further improvements of this study could involve “dynamic” energy and environmental analyses based on time-dependent and spatial-dependent energy and environmental indicators (power grid efficiency and emission factors) in order to compare the results to those one achieved in this work.

Author Contributions

A.F., E.M., M.S. and R.V. contributed to the design and implementation of the research, to the analysis of the results and to the writing of the manuscript. All authors have read and agreed to the published version of the manuscript.

Funding

This research has been funded by the European Union and the Italian Ministry of Education, University and Research, under the project “AIM—Attrazione e Mobilità Internazionale” in attuazione dell’Azione I.2 “Mobilità dei Ricercatori” dell’Asse I del PON R&I 2014-2020—Linea di intervento 1.

Conflicts of Interest

The authors declare no conflict of interest.

Nomenclature

CO2Carbon dioxide emissions (kgCO2/y)
cuUnitary electricity cost/reward (€/MWh)
dlMutual spatial allowed distance among agents for electricity exchange (m)
EEnergy [MWh/y]
FPESFossil Primary Energy Saving index (%)
ICInvestment Cost (€)
OCOperating Cost (€/y)
PEPrimary Energy (MWh/y)
zRatio between the electricity flowing through the power grid and the global electricity required by urban community (%)
Greek symbols
αCO2 emissions factor for electricity (g CO2/kWhEl)
ηEfficiency
∆CO2Avoided CO2 emissions (%)
∆OCDifference between operating cost of CS and PS (€/y)
Subscripts
ElElectric
El_expElectricity exported to main power grid
MinMinimum
MaxMaximum
Superscripts and Acronyms
CSConventional System
LMLocal Microgrid
O&MOperating and Maintenance cost
PGPower Grid
PPPower Plant
PSProposed System
PVPhotovoltaic
SC#1referred to Scenario#1
SC#2referred to Scenario#2
SicReferred to Sicily electricity market zone
UCUrban Community

References

  1. Fateh, H.; Safari, A.; Bahramara, S. A bi-level optimization approach for optimal operation of distribution networks with retailers and micro-grids. J. Oper. Autom. Power Eng. 2020, 8, 15–21. [Google Scholar] [CrossRef]
  2. Hunziker, C.; Lehmann, J.; Keller, T.; Heim, T.; Schulz, N. Sustainability assessment of novel transformer technologies in distribution grid applications. Sustain. Energy Grids Netw. 2020, 21, 100314. [Google Scholar] [CrossRef]
  3. Alomoush, M.I. Microgrid combined power-heat economic-emission dispatch considering stochastic renewable energy resources, power purchase and emission tax. Energy Convers. Manag. 2019, 200, 112090. [Google Scholar] [CrossRef]
  4. Murty, V.V.S.N.; Kumar, A. Multi-objective energy management in microgrids with hybrid energy sources and battery energy storage systems. Prot. Control Mod. Power Syst. 2020, 5. [Google Scholar] [CrossRef] [Green Version]
  5. Zabalaga, P.J.; Cardozo, E.; Campero, L.A.C.; Ramos, J.A.A. Performance Analysis of a Stirling Engine Hybrid Power System. Energies 2020, 134, 980. [Google Scholar] [CrossRef] [Green Version]
  6. Marrasso, E.; Roselli, C.; Sasso, M.; Picallo-Perez, A.; Sala Lizarraga, J.M. Dynamic simulation of a microcogeneration system in a Spanish cold climate. Energy Convers. Manag. 2018, 165, 2016–2218. [Google Scholar] [CrossRef]
  7. Hirvonen, J.; Kayo, G.; Hasan, A.; Sirén, K. Local sharing of cogeneration energy through Individually prioritized controls for increased on-site energy utilization. Appl. Energy 2014, 135, 350–363. [Google Scholar] [CrossRef]
  8. Cheng, Z.; Li, Z.; Liang, J.; Si, J.; Dong, L.; Gao, J. Distributed coordination control strategy for multiple residential solar PV systems in distribution networks. Electr. Power Energy Syst. 2020, 117, 105660. [Google Scholar] [CrossRef]
  9. Bedawy, A.; Yorino, N.; Mahmoud, K.; Zoka, Y.; Sasaki, Y. Optimal voltage control strategy for voltage regulators in active unbalanced distribution systems using multi-agents. IEEE Trans. Power Syst. 2020, 35, 1023–1035. [Google Scholar] [CrossRef]
  10. Jalili, A.; Taheri, B. Optimal sizing and sitting of distributed generations in power distribution networks using firefly algorithm. Technol. Econ. Smart Grids Sustain. Energy 2020. [Google Scholar] [CrossRef] [Green Version]
  11. Yu, H.; Niu, S.; Zhang, Y.; Jian, L. An integrated and reconfigurable hybrid AC/DC microgrid architecture with autonomous power flow control for nearly/net zero energy buildings. Appl. Energy 2020, 263, 114610. [Google Scholar] [CrossRef]
  12. Zhou, J.; Xie, W.; Xia, Y.; Xue, F.; Su, J. Research on energy efficiency management method of AC/DC hybrid distribution system. In Proceedings of the 2019 3rd International Conference on Power and Energy Engineering, Qingdao, China, 25–27 October 2019; IOP Conf. Series: Earth and Environmental Science. IOP: London, UK, 2020; Volume 431, p. 012039. [Google Scholar] [CrossRef]
  13. Jafari, M.; Malekjamshidi, Z. Optimal energy management of a residential-based hybrid renewable energy system using rule-based real-time control and 2D dynamic programming optimization method. Renew. Energy 2020, 146, 254–266. [Google Scholar] [CrossRef]
  14. Hakimi, S.M.; Hasankhani, A.; Shafie-khah, M.; Catalao, J.P.S. Demand response method for smart microgrids considering high renewable energies penetration. Sustain. Energy Grids Netw. 2020, 21, 100325. [Google Scholar] [CrossRef]
  15. Gajula, V.; Rajathy, R. An agile optimization algorithm for vitality management along with fusion of sustainable renewable resources in microgrid. Energy Sources Part A Recovery Util. Environ. Eff. 2019, 42, 1580–1598. [Google Scholar] [CrossRef]
  16. Pfeifer, A.; Dobravec, V.; Pavlinek, L.; Krajacic, G.; Duic, N. Integration of renewable energy and demand response technologies in interconnected energy systems. Energy 2018, 161, 447–455. [Google Scholar] [CrossRef]
  17. Ma, T.; Wu, J.; Hao, L.; Lee, W.J.; Yan, H.; Li, D. The optimal structure planning and energy management strategies of smart multi energy systems. Energy 2018, 160, 122–141. [Google Scholar] [CrossRef]
  18. Fichera, A.; Frasca, M.; Palermo, V.; Volpe, R. An optimization tool for the assessment of urban energy scenarios. Energy 2018, 156, 418–429. [Google Scholar] [CrossRef]
  19. Karmellos, M.; Mavrotas, G. Multiobjective optimization and comparison framework for the design of Distributed Energy Systems. Energy Convers. Manag. 2019, 180, 473–495. [Google Scholar] [CrossRef]
  20. Dileep, G. A survey on smart grid technologies and applications. Renew. Energy 2020, 146, 2589–2625. [Google Scholar] [CrossRef]
  21. Fichera, A.; Frasca, M.; Volpe, R. The centralized energy supply in a network of distributed energy systems: A cost-based mathematical approach. Int. J. Heat Technol. 2017, 35, S191–S195. [Google Scholar] [CrossRef]
  22. Fichera, A.; Pluchino, A.; Volpe, R. A multi-layer agent-based model for the analysis of energy distribution networks in urban areas. Phys. A 2018, 508, 710–725. [Google Scholar] [CrossRef] [Green Version]
  23. Gonzalez de Durana, J.; Barambones, O. Technology-free microgrid modelling with application to demand side management. Appl. Energy 2018, 219, 165–178. [Google Scholar] [CrossRef]
  24. Li, K.; Wang, F.; Mi, Z.; Fotuhi-Firuzabad, M.; Duic, N.; Wang, T. Capacity and output power estimation approach of individual behind-the-meter distributed photovoltaic system for demand response baseline estimation. Appl. Energy 2019, 253, 113595. [Google Scholar] [CrossRef]
  25. Dorotic, H.; Doracic, B.; Dobravec, V.; Puksec, T.; Krajacic, G.; Duic, N. Integration of transport and energy sectors in island communities with 100% intermittent renewable energy sources. Renew. Sustain. Energy Rev. 2019, 99, 109–124. [Google Scholar] [CrossRef]
  26. Roselli, C.; Diglio, G.; Tariello, F.; Sasso, M. A novel energy index to assess the impact of a solar PV-based ground source heat pump on the power grid. Renew. Energy 2019, 143, 488–500. [Google Scholar] [CrossRef]
  27. Marrasso, E.; Roselli, C.; Sasso, M. Electric efficiency indicators and carbon dioxide emission factors for power generation by fossil and renewable energy sources on hourly basis. Energy Convers. Manag. 2019, 196, 1369–1384. [Google Scholar] [CrossRef]
  28. Dorer, V.; Weber, A. Methodologies for the Performance Assessment of Residential Cogeneration Systems, Report of Subtask C of FCþCOGEN-SIM: The Simulation of Building-Integrated Fuel Cell and Other Cogeneration Systems, Annex 42 of the International Energy Agency. 2007. Available online: http://www.ecbcs.org/Data/publications/EBC_Annex_42_Performance_Assessment_of_Residential_Cogeneration_Systems_in_Different_Italian_Climatic_Zones.pdf (accessed on 7 April 2020).
  29. GSE, Gestore Servizi Energetici. PV Market, Business and Price Developments in Italy. 2017. Available online: https://www.gse.it/documenti_site/Documenti%20GSE/Studi%20e%20scenari/PV%20market,%20business%20and%20price%20developments%20in%20Italy.PDF (accessed on 27 April 2020).
  30. Regione Siciliana, Assessorato Regionale delle Infrastrutture e della Mobilità, AREA 5—Prezzario Regionale e Commissione Regionale LL. PP. Investment Costs for the Infrastructure Realization of the Transmission Lines of the Local Microgrid. Available online: http://pti.regione.sicilia.it/portal/page/portal/PIR_PORTALE/PIR_LaStrutturaRegionale/PIR_AssInfrastruttureMobilita/PIR_Infoedocumenti/PIR_ALTRICONTENUTI/PIR_Anno2019/Prezzario%202019%20corretto.pdf (accessed on 27 April 2020). (In Italian).
  31. Deliberazione 20 Dicembre 2012, 570/2012/R/EFR Testo Integrato delle Modalità e delle Condizioni Tecnico-economiche per L’erogazione del Servizio di Scambio sul Posto: Condizioni per L’anno 2013, Modificato dalle Deliberazioni 578/2013/R/eel, 614/2013/R/eel, 128/2017/R/eel, 96/2018/R/eel e 66/2020/R/eel. Economic Regime Applied to Local Microgrids. Available online: https://www.autorita.energia.it/allegati/docs/12/570-12.pdf (accessed on 27 April 2020). (In Italian).
  32. ISTAT (Istituto Nazionale di Statistica). Censimento della Popolazione e delle Abitazioni 2011, Roma. Available online: https://www.istat.it/it/censimenti-permanenti/censimenti-precedenti/popolazione-e-abitazioni/popolazione-2011 (accessed on 27 April 2020). (In Italian).
  33. TERNA S.p.A. Consumi in “Dati Statistici Sull’energia Elettrica in Italia”. Available online: http://www.terna.it/default/Home/SISTEMA_ELETTRICO/statistiche/dati_statistici.aspx (accessed on 27 April 2020). (In Italian).
  34. PAES. Piano d’Azione per l’Energia Sostenibile della Città di Catania. Available online: http://mycovennat.eumayors.eu/docs/seap/16834_1435167207.pdf (accessed on 27 April 2020). (In Italian).
  35. ENEA. Tema di Ricerca 5.4.1.1/5.4.1.2 “Determinazione dei Fabbisogni e dei Consumi Energetici dei Sistemi Edificio-impianto, in Particolare Nella Stagione Estiva e per uso Terziario e Abitativo e Loro Razionalizzazione. Interazione Condizionamento e Illuminazione” 2010. RAPPORTO FINALE DELLA RICERCA Settembre 2010. Electrical Demands in Urban Areas for Residential and Non-residential Buildings. Available online: https://www.enea.it/it/Ricerca_sviluppo/documenti/ricerca-di-sistema-elettrico/fabbisogni-consumi-energetici/12-die-sintesi.pdf (accessed on 27 April 2020). (In Italian).
  36. Roselli, C.; Marrasso, E.; Tariello, F.; Sasso, M. How different power grid efficiency scenarios affect the energy and environmental feasibility of a polygeneration system. Energy 2020, 201. [Google Scholar] [CrossRef]
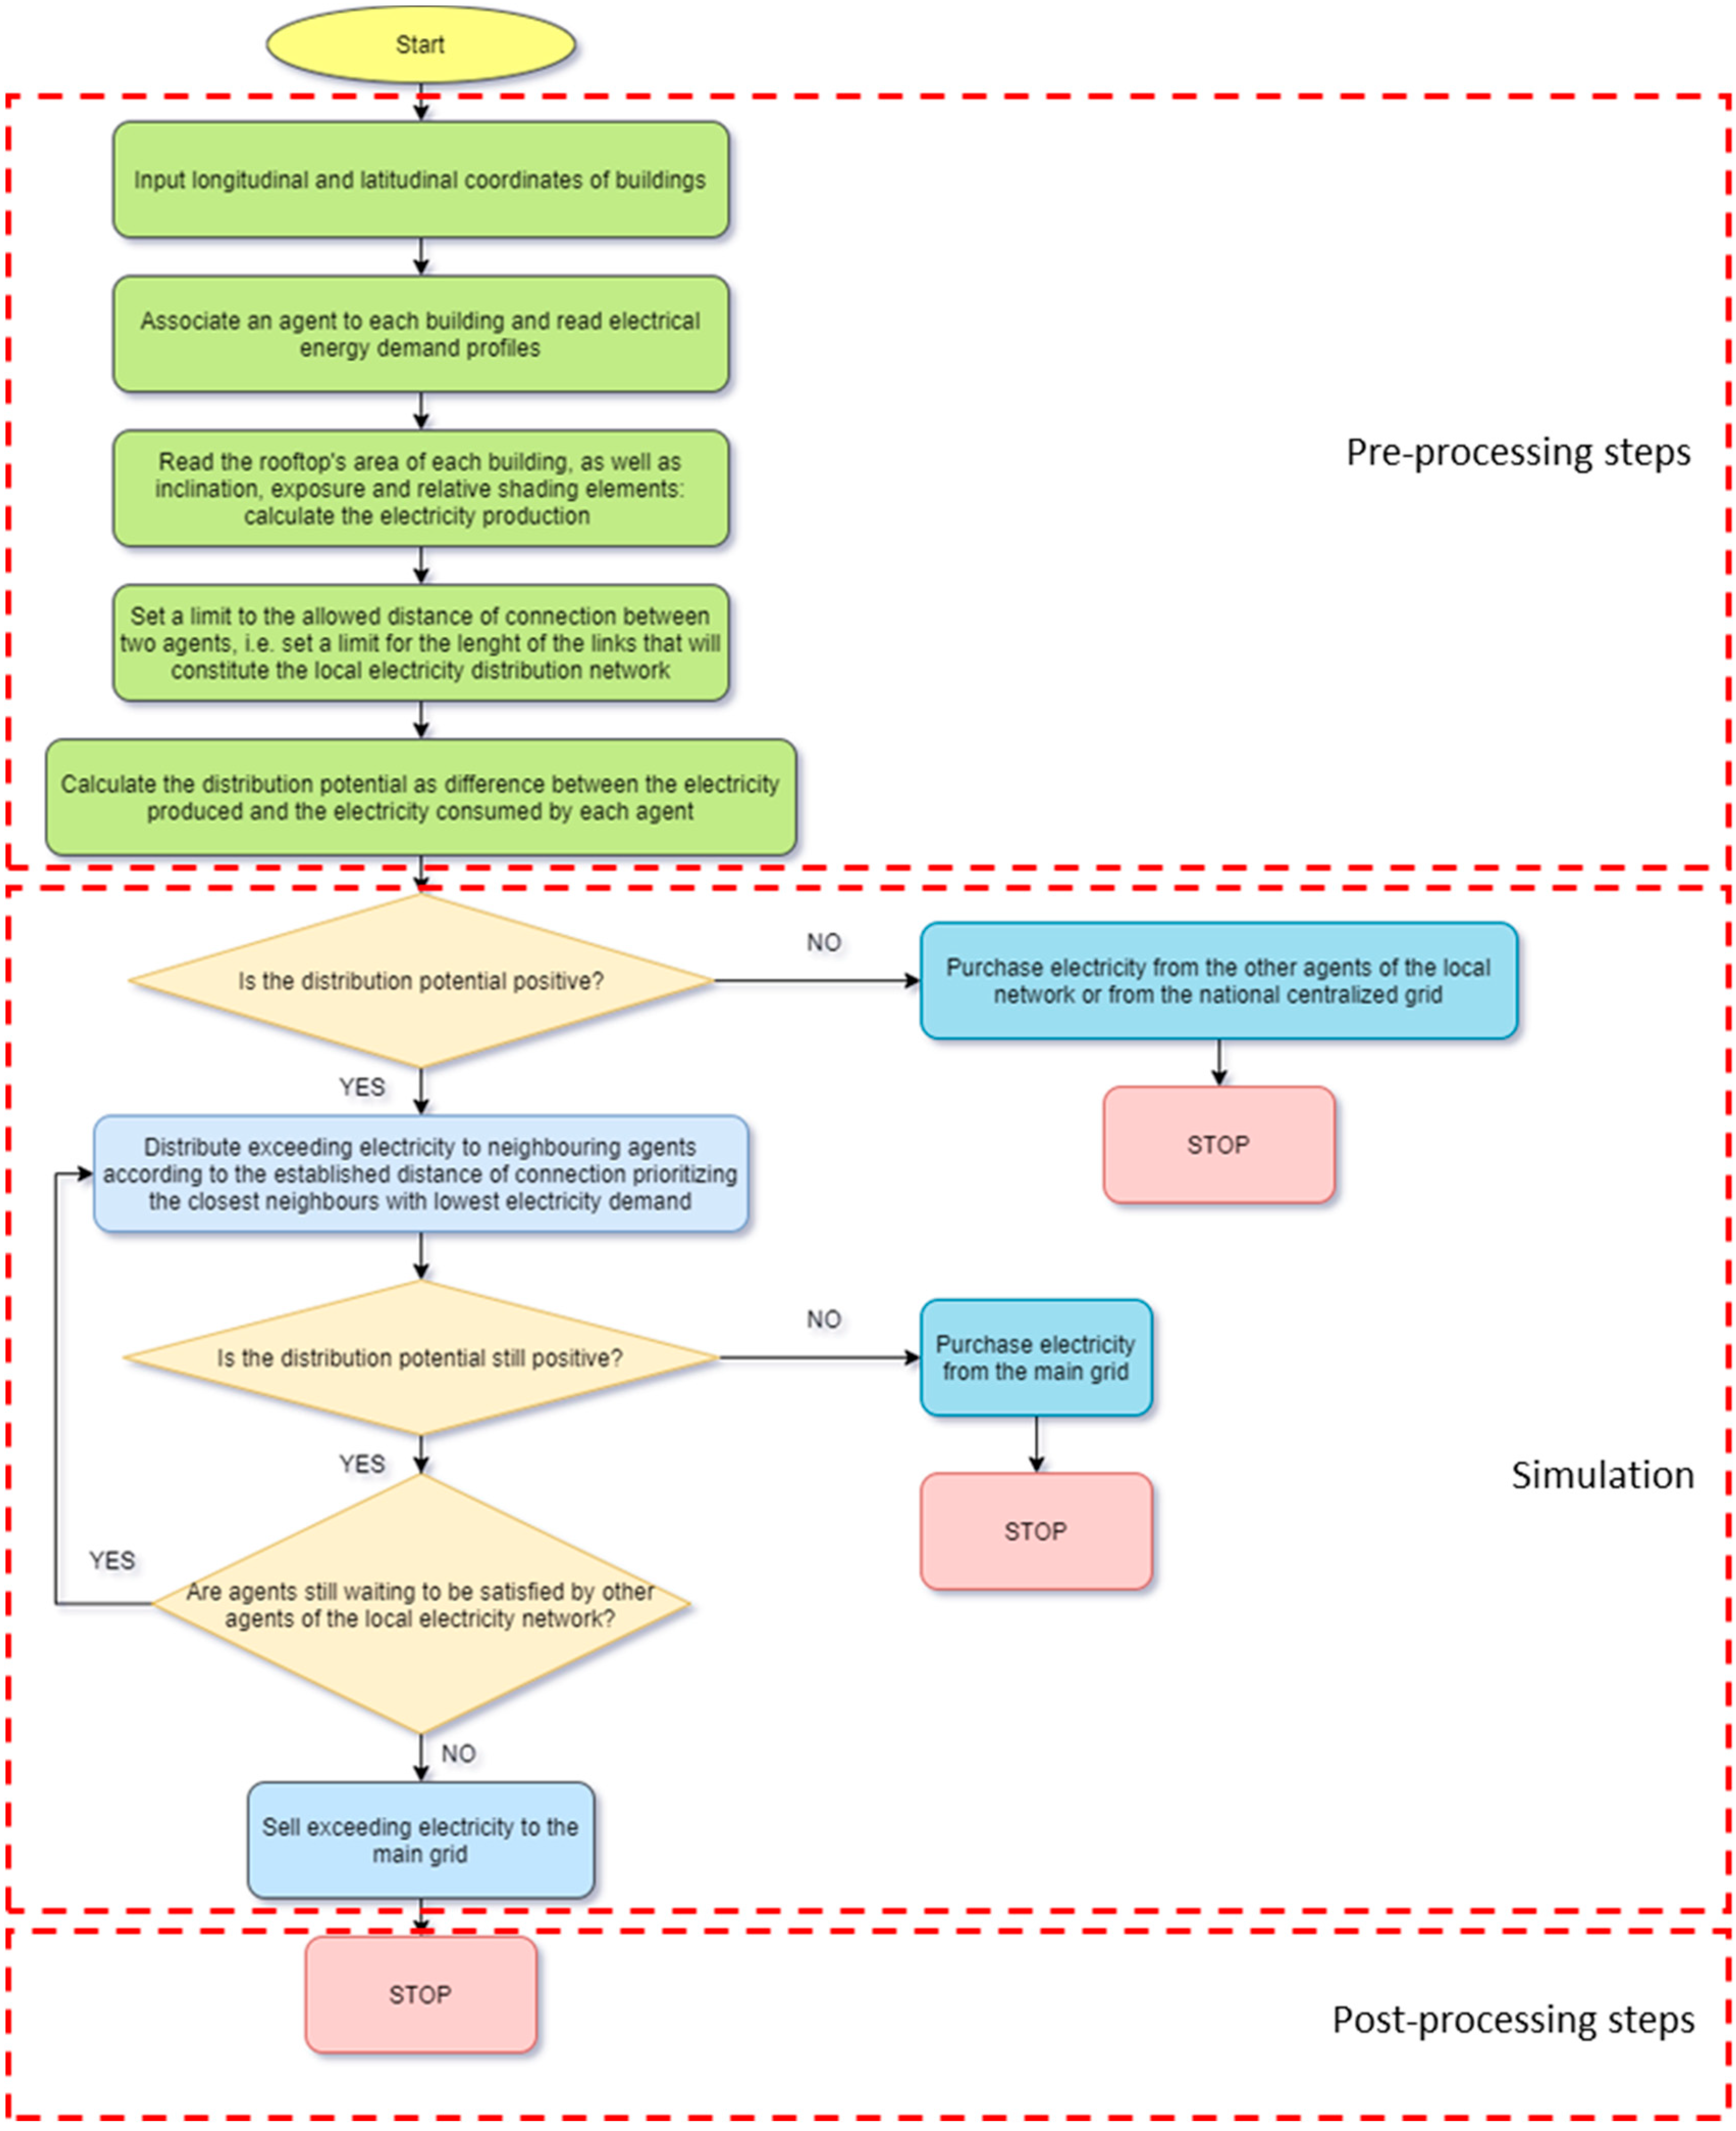
Figure 1. Flowchart of the proposed agent-based model.
Energies 13 02545 g001
Figure 2. Schematic diagrams of the proposed and conventional systems.
Energies 13 02545 g002
Figure 3. Panoramic views of the urban area selected as case study.
Energies 13 02545 g003
Figure 4. Trends of the electrical energy (a) distributed within the local grid; (b) exported to the main power grid; (c) requested to the main power grid.
Energies 13 02545 g004aEnergies 13 02545 g004b
Figure 5. The z index as a function of PV installed capacity in both Sc#1 and Sc#2.
Energies 13 02545 g005
Figure 6. Fuel Primary Energy Saving index and primary energy demand of PS and CS in Sc#1 and Sc#2 as a function of PV systems power.
Energies 13 02545 g006
Figure 7. Investment cost and the difference between operating cost of CS and PS (∆OC) in both scenarios as function of installed capacity.
Energies 13 02545 g007
Figure 8. Operating costs of PS as a function of installed PV capacity.
Energies 13 02545 g008
Figure 9. CO2 emissions for PS and CS considering minimum, maximum and average values of emission factor for electricity referred to Italy (a) and Sicily zone (b) as a function of installed PV power in Sc#2.
Energies 13 02545 g009
Table 1. Avoided carbon dioxide emissions index in Sc#1 and Sc#2 as a function of installed PV. capacity.
Installed PV Capacity (kW)
200040006000800010,00012,00014,00016,00018,000
∆CO2 (Sc#1)0.100.230.330.470.550.660.780.890.98
∆CO2 (Sc#2)0.120.260.370.490.610.690.790.900.99
Table 2. Minimum, maximum and average emission factors for electricity referred to Italy and Sicily zone.
Emission factor for electricity referred to Italy (gCO2/kWhEl) α M i n = 152 α = 356 α M a x = 556
Emission factor for electricity referred to Sicily zone (gCO2/kWhEl) α M i n S i c = 168 α S i c = 498 α M a x S i c = 762