Article

Assessment of Offshore Wind Power Potential along the Brazilian Coast

by
Sylvester Stallone Pereira de Azevedo
1,2,*,
Amaro Olimpio Pereira Junior
2,
Neilton Fidelis da Silva
1,3,
Renato Samuel Barbosa de Araújo
1 and
Antonio Aldísio Carlos Júnior
4
1
Natal Central Campus, Federal Institute of Education, Science and Technology of Rio Grande do Norte (IFRN), 1692, Tirol, Natal, RN 59015-300, Brazil
2
Energy Planning Program, Graduate School of Engineering, Federal University of Rio de Janeiro, Technology Center, Block C, Cidade Universitária, Ilha do Fundão, Rio de Janeiro, RJ 21941-972, Brazil
3
International Virtual Institute of Global Change (IVIG), Rio de Janeiro, RJ 21941-909, Brazil
4
Graduate Program in Soil and Water Handling, Semiarid Federal Rural University, 572, Costa e Silva, Mossoró, RN 59625-900, Brazil
*
Author to whom correspondence should be addressed.
Energies 2020, 13(10), 2557; https://doi.org/10.3390/en13102557
Submission received: 12 March 2020 / Revised: 14 May 2020 / Accepted: 14 May 2020 / Published: 18 May 2020
(This article belongs to the Section A3: Wind, Wave and Tidal Energy)

Abstract

:
Brazilian offshore potential exploration is still in its early stages, with no single offshore park in operation or being implemented. Unlike the already identified onshore wind potential—with over 14 GW installed in the form of onshore wind turbines—offshore wind potential research is absent and restricted to limited areas. In this context, this study aims to identify offshore wind potential throughout the Brazilian coast for electricity generation. The research method took into account the average annual wind velocity records as 100 m/s, as well as bathymetry and the distance from the coast baseline, to classify areas displaying the greatest potential, applying an analytic hierarchy process (AHP) to the geographic information system for the identification of potential offshore wind energy exploration sites. Environmental conservation units were considered exclusion areas. The installable capacity using aerogenerators was estimated at 3 TW, while an annual average power production of 14,800 TWh was calculated for the sum of the viable areas. These results demonstrate that the wind potential identified throughout the Brazilian coast provides the conditions for significant energy sector development. To this end, it is necessary to establish an ecological economic zoning of the areas displaying the greatest potential identified herein for the beginning of offshore exploration in Brazil.

Graphical Abstract

1. Introduction

Brazil displays high energy potential concerning new renewable sources, such as wind and solar energies, which can be applied in technologies aiming at their use. This potential has been revealed to be a proven complementary alternative to conventional sources, mainly hydro-electric power, which is mostly predominant in the Brazilian electric sector. An additional attractiveness is the fact that wind and solar energies are oriented towards the maintenance of the renewable character of the national energy matrix, also contributing to the implementation of commitments made under the United Nations Framework Convention on Climate Change (UNFCCC), including its agreements and protocols that encourage the mitigation of greenhouse gases (GHG) through the use of renewable energy sources. In the Paris agreement, Brazil assumed the commitment to increasing its share of renewables (except hydroelectric) to at least 23% by 2030, increasing wind and solar sources [1].
The current Brazilian experience in the use of onshore wind sources in its electric matrix has been configured as a predominantly coastal activity, mostly on the northeastern coast. At the end of 2019, Brazil had 14.8 GW of installed capacity in wind farms, 85.7% of which were installed in the northeastern region [2]. Figure 1 indicates that the distribution of wind farms occurs in the low population density regions and rural areas, since the wind in urban centers has a slower flow, due to a large number of obstacles.
Considering Brazil’s entire installed capacity, 76% is located less than 25 km from the coast, and 46%, at less than 5 km [5]. This reality was predicted by the Brazilian Wind Potential Atlas [6], which pointed to most of the entire Brazilian coast as concentrating the best sites in this regard, with emphasis on the northeastern region. The Brazilian states of Ceará and Rio Grande do Norte alone account for about 50% of the entire installed wind energy capacity in the country, accounting for 43% of all wind turbines located up to 5 km from the coast [5].
In order to consolidate onshore wind potential exploitation structures that border the coast, including densification in areas presenting higher economic attractiveness due to tourist interests, it is necessary to proceed, as noted previously, regarding the potential located in central Brazilian territory areas. In this context, it is important to include the use of the vast offshore wind potential in expansion plans for the sector.
Including offshore potential in planning is advantageous when compared to land surface use. The sea surface displays very low surface roughness, almost zero, which reduces turbulence, and therefore becomes a more favorable environment for wind energy use [7]. This translates into a greater energy availability to be converted by a given turbine.
Sea use does not lead to social conflicts arising from ownership, where parties claim ownership of the same land to obtain compensation. These parties claim various soil uses as a motive, whether used for agriculture, animal husbandry or tourism exploration. At sea, the logistics of transporting large machines are not limited to highway size and availability, which may hinder the construction of larger towers consisting of higher power turbines [8].
However, other aquatic environment elements lead to wind farm construction difficulties. For example, sea environments are highly saline, causing rapid tower structure degradation, which then require special protective coatings [9]. In addition, marine currents and wave and tide movements exert mechanical strains on these structures, both continuously and dynamically, demanding appropriate solutions so as not to incur the risk of tower collapse. Furthermore, the bottom of the ocean floor where a tower is to be built must be known, in order to allow for the best foundation choice [10].
In order to install a wind turbine in a certain area, it is necessary to confirm the high wind potential, beyond any doubt. To justify the installation of a large turbine (or aerogenerator), it is essential that the maximum available wind power be extracted. The depth at which the foundation is to be built is as decisive as wind quality, since it may be necessary to adopt fixed-base structures suitable for shallow waters or floating structures for deep waters (water columns of over 60 m [11]). Distance from the coast is also directly related to wind tower installation sites, since the further away from the coast, the higher the wiring costs for electricity transmission [12].
Research dedicated to understanding offshore wind resources in Brazil combines data from meteorological stations and satellites in order to evaluate resources in the South and Southeast regions. It considers data from the QuikSCAT satellite and two offshore buoys, one owned by PETROBRAS and the other maintained by the Brazilian Navy. Research has been carried out up to the 100 m bathymetric quota and identified 216 GW of available power [13].
A survey of the entire exclusive economic zone (EEZ) along the entire Brazilian coast [14] considered distance and depth separately, indicating 1780 GW for the EEZ and 606 GW considering the 100 m bathymetric quota. Specifying the offshore wind potential for the state of Ceará, in the Brazilian Northeast, the study observed three representative periods: one comprising the presence of El Niño (warming of Pacific waters, causing droughts in northeastern Brazil), one with the presence of La Niña (cooling of Pacific waters, causing intense rains in northeastern Brazil) and another neutral, where the first two phenomena are not observed [15], at a bathymetric quota of 50 m in depth and a 50 km distance from the coast. The study measured energy density variations ranging from 720 to 1800 W/m2, depending on the period, with higher values observed during the La Niña period.
By the end of 2019, six environmental licensing requirements were awaiting authorization from the Brazilian Institute for the Environment and Renewable Natural Resources (IBAMA), responsible for implementing the National Environment Policy: the offshore wind complexes Asa Branca I, Caucaia and Jangada off the coast of the State of Ceará, a Petrobras pilot plant near the city of Guamaré on the coast of the state of Rio Grande do Norte, the Maravilha complex on the coast near the city of Campos in the state of Rio de Janeiro and the Águas Claras complex on the coast near the city of Porto Alegre in the state of Rio Grande do Sul [16]. In January of 2020 this year, IBAMA opened a public consultation to receive contributions from the terms of reference that will guide the preparation of environmental impact studies for the offshore wind complexes. The proposal was developed based on the agency’s experience in licensing onshore wind, offshore oil and gas exploration, as well as on the environmental models applied in Europe and the scientific literature assessing environmental offshore wind complex impacts [8].
In this context, the present study aims to determine the Brazilian offshore wind potential for the entire Brazilian EEZ, considering bathymetry, distance from the coast and environmental indicators as integrated factors using a multicriteria analysis integrated to a geographic information system (GIS). At this point, this research differs from all others undertaken until now for the purpose of identifying the Brazilian offshore wind potential, as no other Brazilian research included an environmental variable as a restriction to offshore wind production, filling an explicit knowledge gap [17].

2. Materials and Methods

To achieve the goal, the EEZ was physically characterized, comprising the depth and distance from the coast of the study area, environmental conditions—determined by conservation unit rules—and wind resource mapping in terms of average speed. These assessed variables were combined using a multicriteria analysis integrated to a GIS.

2.1. Brazilian Exclusive Economic Zone Characterization

The spatial characterization of the EEZ applied the spatial divisions definitions and limits established by the United Nations Convention on the Law of the Sea (UNCLOS) [18] as well as the federal law No. 8617 of January 4 1993 [19], which affirms the Brazilian sovereign right over its EEZ and regulates activities that may be carried out in this area. Figure 2 displays the extension of the Brazilian EEZ obtained from digital files made available by the Mineral Resources Research Company (CPRM) or Brazilian Geological Survey [20], as it is currently designated.
According to the UNCLOS [18], each country possesses a maritime strip called the exclusive economic zone (EEZ) with a width comprising 200 nautical miles from the coastline (about 370 km). According to Law 8617 of January 4 1993 [19], this strip is divided into the following: (i) territorial sea consisting of a 12 nautical mile range from the low-sea line; (ii) a contiguous zone which is a range extending from 12 to 24 nautical miles from the baseline delimiting the territorial sea; and (iii) an exclusive economic zone that ranges from 12 to 200 nautical miles from the baseline that delimits the territorial sea. Figure 3 displays this division.
The figure indicates that the international airspace area begins after 24 nautical miles measured from the base of the coast. The red ellipse highlights the extent of the continental shelf. This region is related to the EEZ definition, due to the fact that it can occur before or after the EEZ limit, granting the coastal state the right to request an EEZ extension to the outer edge of the continental shelf (Art. 76). In addition, the Brazilian coast comprises a total of 7367 km, increasing to 9200 km when considering coastal recesses, constituting over 3,500,000 km2. Thus, any coastal investigation is a challenge, in particular regarding the search for suitable wind farm installation areas.

2.1.1. Bathymetry

Bathymetry is defined as ocean, river and lake depth measurements with the aim of determining a water body topography. As important as the wind resource, the depth at which an offshore wind tower is intended to be built is what defines which foundation will be adopted, accounting for about 25% of the installation cost [22]. The most common types of foundations according IRENA (2018) to the are the following [11]:
(a)
Gravity base: consists of a large circular concrete base and resists loads only due to gravity itself. These structures are supported on the seabed in shallow waters (depth less than 10 m) and can weigh from 500 to 1000 tons. About 9% of existing foundations are noted;
(b)
Monopile: the most common foundation in wind farms, consisting of a steel pillar embedded in the seabed by means of vibrators or high-impact hammers. These structures are recommended for depths over 30 m;
(c)
Tripod: triangular structure in the flat view with elements in steel tubes connected at the corners. Each leg is placed diagonally in the corner and horizontally supported in the center. These structures are not recommended for rocky soils or depths of over 7 meters. This type represents about 3% of foundations;
(d)
Jacket: a truss structure with three or four legs made of steel tubes and fastened with clamps to afford a higher rigidity. This structure is fixed on the seabed and thus affords resistance against waves to large turbines in waters in depths over 60 m. This structure accounts for over 5% of foundations;
(e)
Floating: structures unfixed to the seabed. Several projects of this nature are under development. The three main forms are the spar buoy, the semi-submersible and tension leg platform (TLP). These structures are used in waters with depths of over 100 m.
Due to these characteristics, foundations become more viable when installed in shallow water. However, landscape and environmental preservation impacts also occur closer to the coast. Thus, a dilemma of looking for shallower waters, closer to the coast, and the best winds, generally further away from the coast, arises. As an example of the costs that these foundations can assume, a regression performed with monopile, jacket and floating TLP technologies obtained the parameters to compare the installation cost between them for an 8 MW turbine [23]. The cost for a monopile foundation at a depth of 25 m exceeds USD 4,000,000; for the jacket type foundation from 25 to 55 m, the cost ranges from USD 4,000,000 to USD 6,000,000; and for the floating TLP foundation, despite presenting high costs in shallower waters (reaching USD 5,600,000 at 25 m in depth) presented a cost of USD 6,000,000 for waters of over 100 m in depth.
Figure 4 exhibits the depth ranges found on the Brazilian coast in the EEZ area, obtained from data available from the US Department of Commerce’s National Oceanic and Atmospheric Administration (NOAA) [24]. These data result from the ETOPO-1 global relief model, where the Earth’s topography is presented combining digital elevation models of the Earth’s surface and a digital bathymetry model of water- or ice-covered regions.
The bathymetric analysis of the Brazilian EEZ reveals that the coastal strip is formed, essentially, by depths up to 60 m (shallow water) in up to 50 km of the coast. On the northeastern coast, the strip of shallow water is narrower, always less than 50 km from the coast. The coastlines of the Southeast and South regions comprise more shallow bands, presenting a slight increase in depth with an increasing distance from the coast.

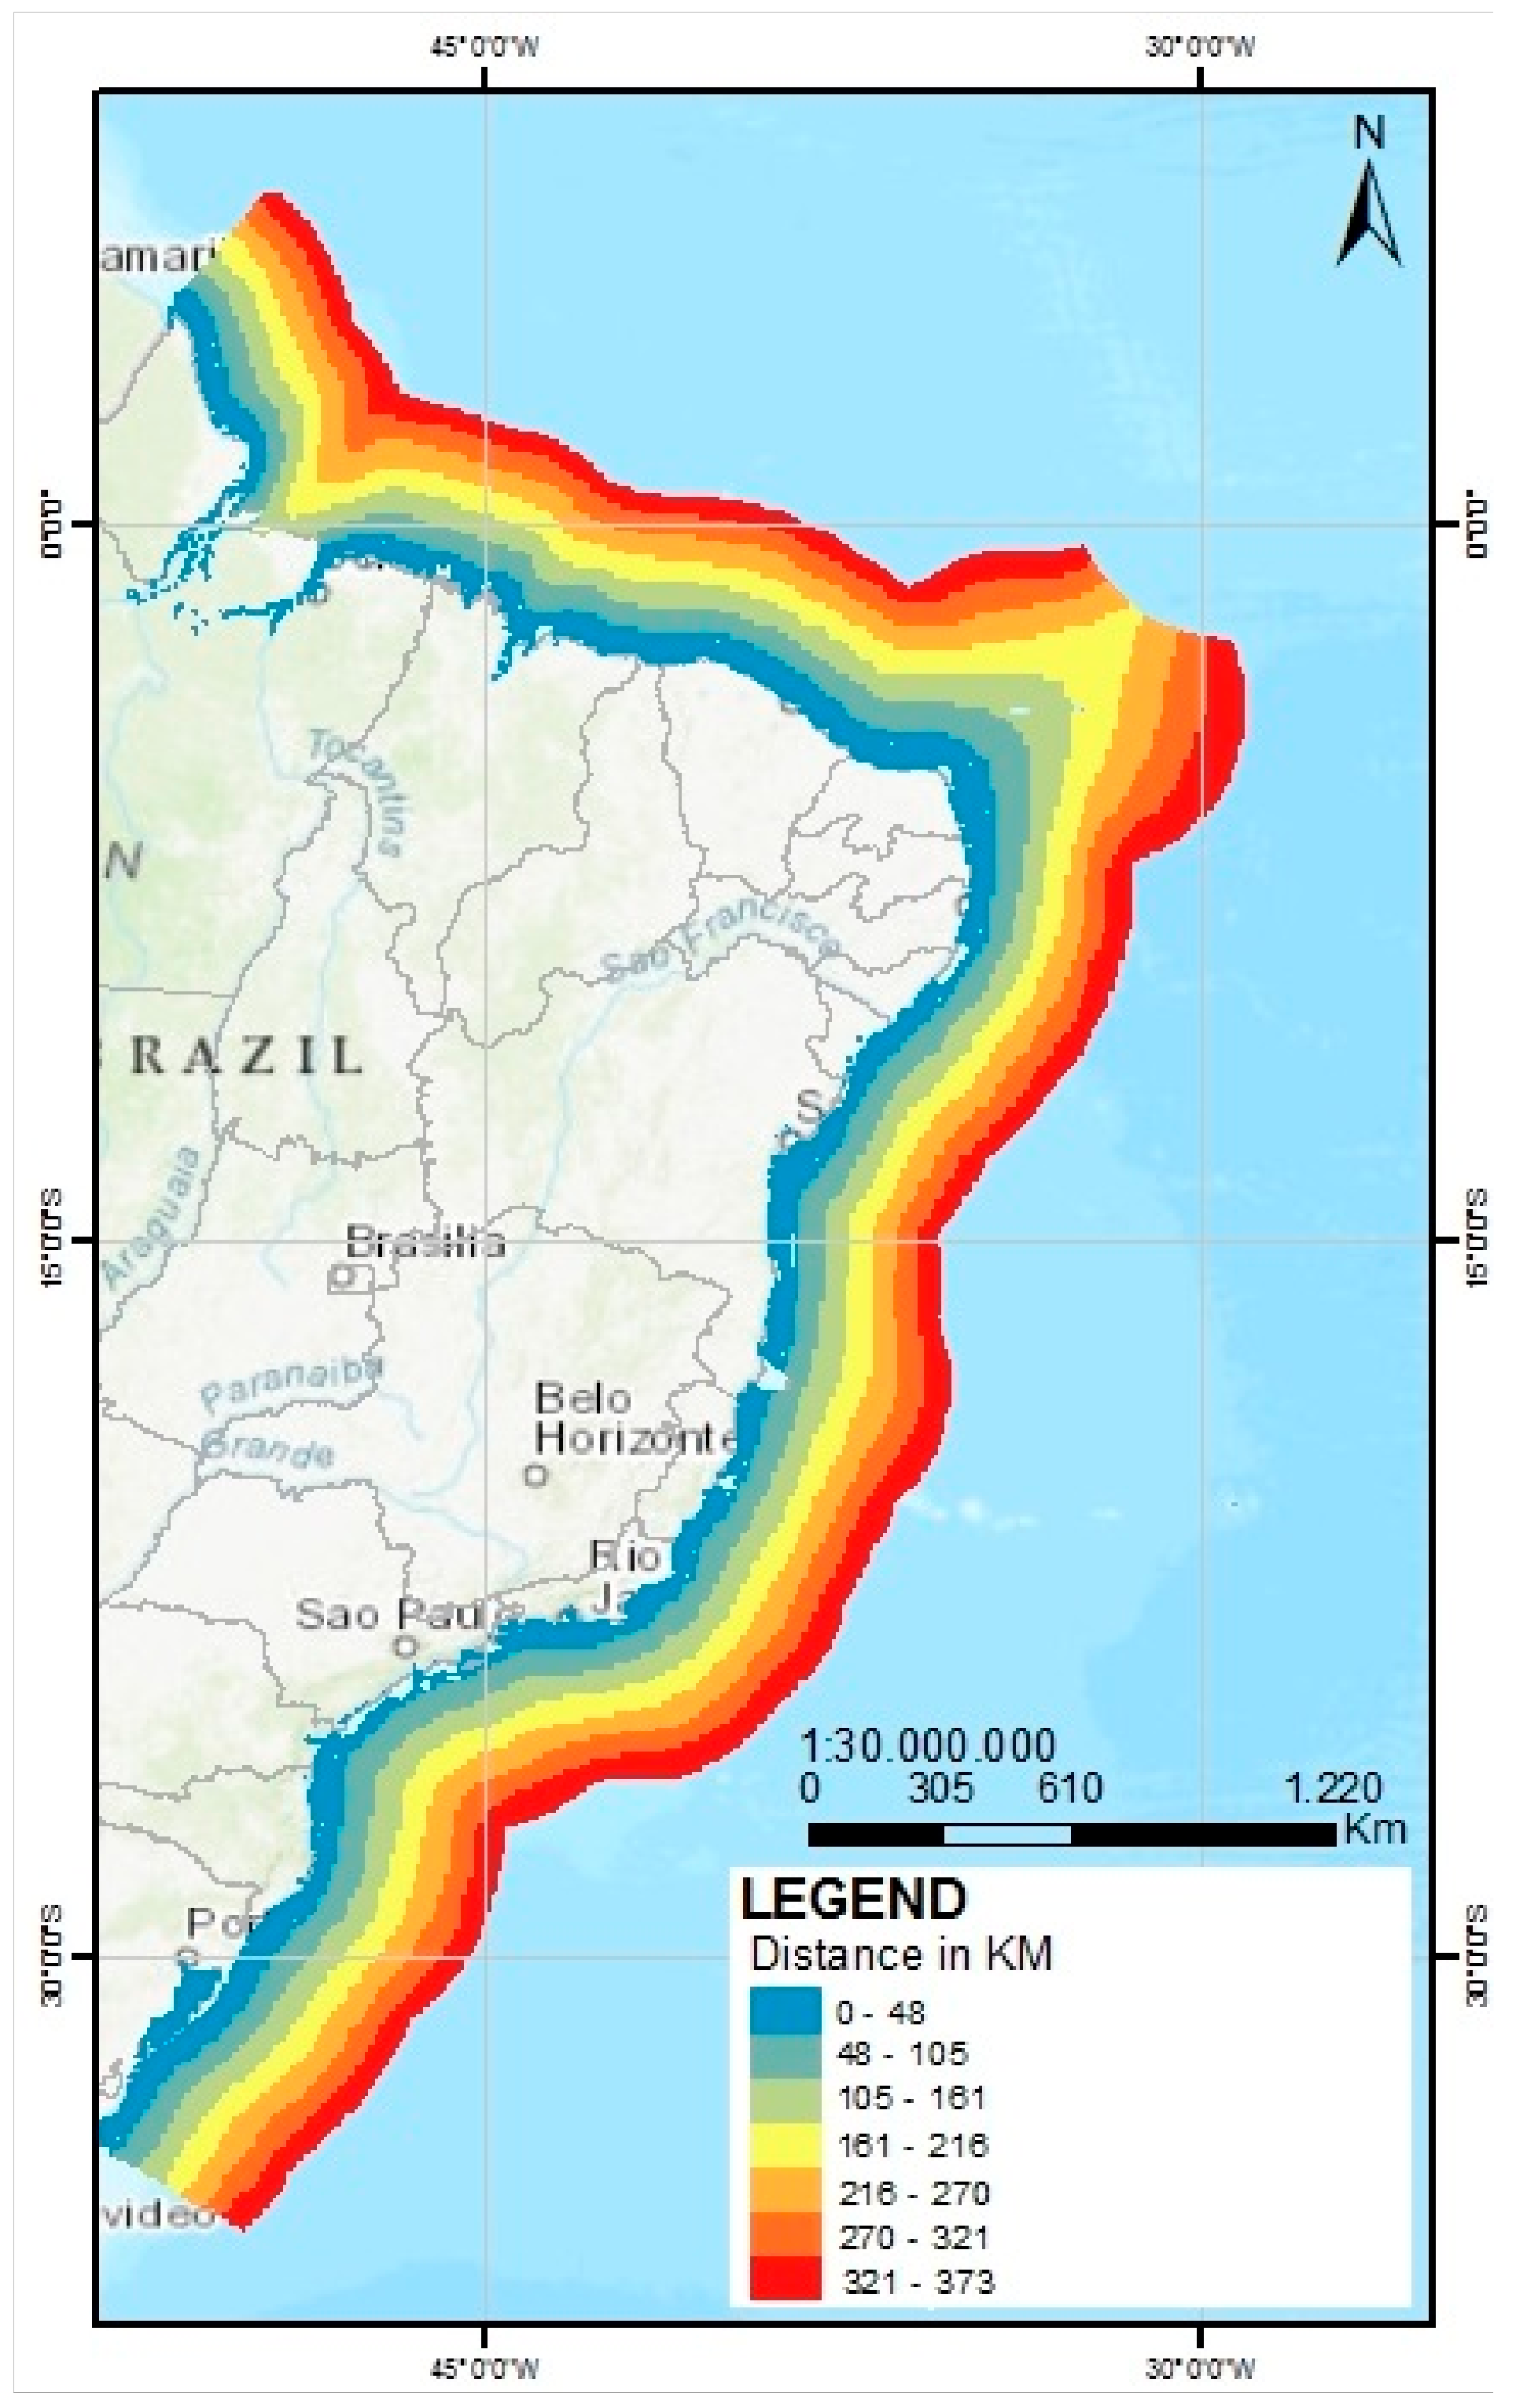
2.1.2. Distance from the Coast

When installing an offshore wind project, the distance between the site and the continent proves to be significantly important, since this distance will result in technical, economic and environmental consequences for the entire installation, operation and maintenance process, as well as transmission costs. In this research, the mapping of these distances, as shown in Figure 5, was constructed using a GIS software.
This Brazilian coastline mapping was established through the shapefile obtained from the CPRM [20]. With this, a line parallel to the coastline was determined at a fixed distance of 200 nautical miles, following the EEZ definition according to the UNCLOS [18]. A distance distribution map was then plotted using this second line, applying the inverse distance weighted interpolator (IDW), followed by a conversion to kilometers.

2.2. Conservation Units

Given the necessary inclusion of an environmental variable, so that its characteristics would impose restrictions on the use of a certain viable area for wind farms, thus ensuring that future use of these resources occurs under the aegis of sustainability, conservation unit (UC) areas, defined by Law 9985 of June 18 2000 which establishes the National System of Nature Conservation Units (SNUC) [25], were applied as limiters. According to this law, a conservation unit is a territorial space and its environmental resources, including jurisdictional waters comprising the relevant natural characteristics, are legally constituted by public authorities, with conservation objectives and defined limits, under a special administration regime, to which adequate protection guarantees apply. Figure 6 presents the conservation units legally instituted in Brazil. It was built from the shapefiles displaying the conservation units’ limits and their characteristics were obtained from different sources and strategies, namely searches on digital platforms developed for repositories, electronically sent documents, face-to-face or telephone contact with coastal management coordinators or the environmental secretariats of the 17 Brazilian coastal states. The main sources were the Chico Mendes Institute for Biodiversity Conservation (ICMBio) and the Socioenvironmental Institute (ISA).
Figure 6 highlights two large units, the environmental protection area (APA) Fernando de Noronha and the APA Ilha de Trindade and Martim Vaz. The other units are located mainly in areas close to the continent, within the range of the first 50 km off the coast, an area of significant interest for planning the use of offshore wind resources.

2.3. Wind Resource

Wind is a resource derived from an irregular global solar incidence. The use of the wind resource for electricity production is obtained by capturing part of the kinetic energy present in wind, due to the movement of air masses from different temperature layers present in the atmosphere and configuration inequalities concerning the wind and earth surface.
Among all elements that frequently appear in the literature, wind resource evaluation is the main factor to be considered for potential assessments. Wind determinations can be obtained either directly, through buoys or meteorological stations installed in the ocean, or indirectly, through satellites and mathematical modeling results [28]. Although direct measurements present greater accuracy and reliability, they require a large number of measurement points to cover large ocean areas. Due to these constraints, direct measurements are performed at a smaller scale, while indirect measurements comprise a global coverage range. For this reason, in research aimed at exploring the wind potential of a very large area, such as the coverage of a vast oceanic area, it is more common to use reanalysis data, such as ERA-Interim or NCEP/NCAR which, although are produced through indirect measurements, present a global coverage, instead of data obtained by direct measurements through buoys, but which are performed in only some points [13].
Therefore, the wind is the main variable observed for the estimation of wind potential for electric energy generation. The definition of the available power in the rotor of a wind turbine, already considering the Betz limit, is given by the following equation:
P = 1 2 ρ A v 3 0.593
where
P is the available wind power (in W);
ρ is the air density (in kg/m3);
A is the area swept by the turbine rotor (in m2); and
v is the wind speed (in m/s).
The data used for mapping the wind resource in the Brazilian EEZ were obtained from the information available in the ERA-Interim database, which provides a dataset from a global climate reanalysis carried out from 1979 to the present day, maintained and developed by the European Center for Medium-Range Weather Forecasts (ECMWF). These data display a spatial resolution of 0.125° (approximately 13 km) and are surface-type data, with monthly averages calculated from daily data collected four times a day every six hours (00:00, 06:00, 12:00, 18:00), covering an area defined by a window from latitude −40° S 10° N and longitude −60° W −20° W. The data provided by the ERA-Interim are defined for a reference height of 10 m. In this study, it was necessary to extrapolate these wind speeds to a height of 100 m by means of a logarithmic equation given by the expression
V h = V h 0 ln h z 0 ln h 0 z 0
where:
V h is the wind speed to be determined at the height h ;
V h 0 is the known wind speed at the height h 0 ;
h is the height where the wind speed is unknown;
h 0 is the height for which the wind speed is known; and
z 0 is terrain roughness. At sea, this value is of 0.0002 m.
Figure 7 is a result of this mapping. Two regions with the presence of a high wind resource are highlighted: a strip over 200 km wide that extends from one end of the state of Maranhão to the north end of the State of Rio Grande do Norte, and another in the extreme south of the country located at about 100 km far from the coast, where winds with an average speed of 8 m/s or more prevail. Wind speeds in almost the entire EEZ are above 7 m/s, with areas with winds below 5 m/s being scarce.
Other databases provide 100 m high wind data for the Brazilian coast, but only for a range of a few kilometers beyond the land territory. One is the Global Wind Atlas [30], a global coverage base, and the other is provided by the Electrical Energy Research Center (CEPEL) in the “Brazilian Wind Atlas—2013” [31], comprising national coverage and production. As this study was performed for the entire Brazilian EEZ (about 370 km beyond land), this data coverage would not be sufficient. However, for this narrow range in which the three databases provide their data, some data were collected and a Friedman’s non-parametric statistical test was performed (Table 1), confirming no significant differences between the three databases.

2.4. Multicriteria Analysis Integrated to GIS

An analytic hierarchy process (AHP) is a multicriteria method developed to aid in the decision-making process and has as its core the understanding that a complex problem can be decomposed, with different impacts on the main problem, so that their relevance or priorities are weighted and can also be analyzed individually, so that their use contributes to better decision-making. Its use in this study assumes that the location of the offshore wind potential is determined by the combination of the following factors: (i) wind resources; (ii) depth; (iii) distance of the coast where this resource is found; and (iv) restricted to non-environmentally protected areas. For this, the method assumes planner expertise, since it decomposes the main problem and will inform, even if subjectively, the importance of parts of the problem by assigning comparative degrees among them (pairwise comparisons), so that for each assigned degree a pair of options specifies the importance of one against another. These degrees are organized into a matrix that undergoes a consistency check process and, in case of confirmation, the theoretical weights are then calculated. These weights make up the feasibility index (FI) that will be used by the GIS to classify and represent the study areas on the map. Three scenarios are produced from different profiles and the available power in the viable areas is calculated. All methodology steps are represented in Figure 8.
In order to carry out all the planned steps, it is necessary to use the GIS (QGIS software) from the vector and matrix files that store variable data in their attributes, the weight calculation and the FI determined using the EasyAHP module, as well as the classification of all areas and their representation on the map.
An outstanding feature of offshore wind potential research is the huge territorial area explored, requiring the use of an appropriate methodology, which should be efficient concerning time use and computational resources. In these terms, Waewsak et al. (2015) and Mahdy and Bahaj (2018) applied a multicriteria analysis integrated to a GIS for the identification of potential offshore wind energy exploration sites [28,32]. A vast literature is available presenting its use in the prospection of onshore potential [33,34,35,36,37,38]. For comparison purposes, Table 2 displays the investigated site areas, in square kilometers, in the studies applying multicriteria analyses.
This study comprises only the Brazilian EEZ, similar to other studies concerning the coastal regions of different countries. The Brazilian EEZ is three-fold larger than the entire territory of Egypt and over six-fold the North Sea area. The mapping of this maritime area and of regions with greater wind power viability, reducing the environmental impacts on Brazilian biodiversity, represent a path towards the increase of an internal energy supply with a strong reduction in greenhouse gas emissions, also allowing for the reinforcement of environmental tourism, which can take advantage of prior planning for environmental preservation. In addition, the exploitation of this economic activity brings elements that promote development to the entire wind industry production chain, as well as port, road and naval infrastructure investments.
The AHP is applied to identify the most viable sites for offshore wind potential exploration, which present the highest feasibility index values. The following steps are performed to produce this index. The technique is based on a square matrix n × n, where the rows and columns correspond to n variables considered in order to obtain the greatest feasibility. Thus, the c i j value represents the relative importance of the criterion of line i before the criterion of column j. Since this matrix is reciprocal, only the lower triangular half needs to be evaluated, since the other half derives from this and the main diagonal assumes values equal to 1.
According to Saaty (1990) [39], the rank assignment matrix in a paired comparison
A = c i j   i , j   ranging   between   1 , 2 , ,
can be elaborated for the verification of n criteria to be evaluated, as follows:
A = c 11 c 12 c n 1 c 12 c 22 c n 2 c 1 n 1 c 2 n 1 c n n 1 c 1 n c 2 n c n n ,
where each c i j is the degree of importance of the criterion of row i in relation to criterion j, according to the scale presented in Table 3.
Since this matrix is a reciprocal matrix, if the degree of importance of the criterion of line i in relation to the criterion of line j is k, then the degree of criterion j in relation to criterion i will be 1 / k . In this way, the matrix A will be equal to c j i = 1 / c i j when i is different from j and c i i = 1 for i = 1, 2, …, n.
Note that the construction of this matrix is subjective. The planner is the one who compares the criteria and, based on his/her knowledge and experience, chooses the degree of importance between them. This assignment process may be different in practice for each planner, and it is a personal assignment that is very sensitive to the know-how of the person who chooses. However, planners within the same category tend to approach the assigned values in a similar manner. For example, engineers will be unanimous in indicating that the wind will be a more important criterion. They may differ in value but not in the importance of the criterion in the project. If the planner is considering project funding, he/she will evaluate that some criteria increase costs (depth and distance) and will express this in some manner. Thus, he/she will tend to decrease the distance between the degree of importance of the wind and the other criteria. Finally, if the planner is a representative of environmental protection agencies, he/she will probably assign a higher value than the one attributed by the other groups to the importance of this criterion in relation to the others. Therefore, consensus is not expected at this stage.
So that the method is not discarded by this characteristic (subjectivity), it is thought out in order to diminish the effect this aspect, giving objectivity to the planner’s judgment. Multicriteria analysis performs this process through a consistency check process. This verification is done by diagonalizing the matrix A , in which, in a simplified way, produces eigenvalues and eigenvectors associated with these eigenvalues. This procedure can be defined by the equation below:
A × w = λ m a x × w
where λ m a x is the greatest eigenvalue. The priority vector w is a theoretical instrument that objectively indicates the degree of importance of each criterion in relation to the others, considering the set of evaluations of all the planners who were part of the construction process of matrix A .
Since the score assignment to the composition of matrix A may be inconsistent, such as a single criterion presenting a high value of importance to one planner and an insignificant value to another, a consistency check test should be applied. For this, the highest eigenvalue λ m a x , should be calculated by the equation
det A I λ = 0
where I is the identity matrix of order n. The matrix A presents theoretical consistency when c i k = c i j c j k   i , j , k , but this condition is very difficult to observe when they represent human judgments. Thus, in practical terms, to check the consistency of the matrix, three indices are calculated: the consistency index (CI), the random consistency index (RI) and the consistency ratio (CR), where the CI and CR are calculated respectively by the equations
C I = λ m a x n n 1
C R = C I R I
and the RI varies according to order n of matrix A [40].
The RI is a very important index for consistency checking. It is the measure of the average inconsistency observed in the calculation of the consistency index with hundreds of random matrices, which consider the same order of priorities among the criteria, but with different weights assigned at random. The matrix A is considered consistent if CR < 0.1, that is, the inconsistency observed in matrix A is less than 10% of the average observed in hundreds of matrices obtained by random processes that consider the same order of priority between the criteria.
By checking the consistency of the matrix, the weights obtained by the vector w are used in the weighting of the criteria, producing a classification index of the areas, which will be called the feasibility index (FI) and will be used in the production of the maps. In summary, the matrix A is constructed with scores assigned by the planner, the vector w is the vector of theoretical weights calculated by the method and FI is the index obtained by multiplying the weights by the respective normalized values of the criteria.
The weights obtained with vector w are used by the GIS, multiplying the values assumed by the criteria. As the criteria present values of different quantities on different scales, they must be normalized. This normalization will be performed according to Carver (1991) [41]:
s i j = x i j x i j m i n x i j m a x x i j m i n
where:
s i j is the normalized value of criterion i at location j;
x i j is the value assumed by criterion i at location j;
x i j m i n is the lowest value assumed by criterion i at location j; and
x i j m a x is the higher value assumed by criterion i at location j.
This equation is used for the “benefit” criteria, that is, criteria whose increase in value increases the viability in the region. The “cost” criteria, whose increase in value decreases the viability in the region, should change the order of the terms in the numerator of the expression.
The value of the index is calculated by the following equation:
F I j = i = 1 n w i s i j
where:
F I j is the index value at location j; and
w i is the weight of criterion i.

3. Discussion and Results

3.1. Feasibility Areas

To estimate the Brazilian offshore wind potential, it was initially necessary to classify the EEZ areas. This was established using three different planning profiles. Since the grade assignment to structure the two-by-two comparison matrix is subjective, varying with the planner, three different scenarios were produced from the construction of different matrices by different planners. The description of these profiles, as well as the obtained matrices, are displayed in Table 4 and Table 5 below. Table 5 displays (a) the scores assigned to the variables in each scenario, so that the assigned scores correspond to the profile of the planner that produces the respective scenario and (b) the theoretical weights calculated through the EasyAHP.
Table 6 displays the classification of the viability categories by the obtained scores, where the higher the score, the greater the potential for use.
The results indicate that FI < 0.7 presents a combination of wind, depth and distance that does not make potential wind use attractive enough, either due to a low wind speed because the depth of the water column requires the use of highly specific deep-water technology, or because the distance from the shoreline would significantly increase the cabling required for the electricity transmission. Figure 9 presents the maps with the FI-classified areas, allowing for the visualization of high potential areas. In the three scenarios, it is noteworthy that three regions register the greatest viability, namely the northern coast of the Northeast Region, the southeast coast and the south coast. The Northeast Region and the South Region already have a vocation for onshore wind exploitation, while the southeast coast is highlighted nationally concerning oil and gas exploitation.
Areas classified according to Figure 9 allow for the determination of their extensions. Once the areas have been defined using the FI, the measures of their extensions are calculated. Table 7 displays the feasibility regions, by category and by scenario, in addition to the percentage that this area represents as a total of the usable EEZ area.

3.2. Brazilian Offshore Wind Potential

To obtain an estimate of the available power, regions classified as “very feasible” and “feasible” were studied, for presenting the best IF when considering the applied conditions (wind, depth, distance and environmental restrictions). In this estimate, the adopted reference was the GE Haliade 150-6 MW turbine model 150 m in diameter, sweeping a 17,860 m2 area with a tower height of 100 m as a reference aerogenerator.
This choice is based on data from the 2017 European report [42], where the average size of the installed turbines was of 5.9 MW and the average depth of the tower installations was 27.5 m. The average distance of the coast reached 41 km.
In order to simplify the estimates, the calculations were performed conservatively, considering an average wind speed of 8 m/s in the “very feasible” and “feasible” regions and a capacity factor of 0.55, producing an average turbine power of 3.3 MW. Considering that the studied area is significant and presents a variety of wind regimes within the same viability area, these values are considered reasonable.
Assuming that turbulence is a complex process and not represented by deterministic equations, it is more appropriate to use statistical properties. For the sake of simplicity, it is considered that, in large open areas and with the minimum presence of obstacles, the sea surface presents slight turbulences that do not significantly alter the available power. Another important phenomenon is the wake effect, which results in altered wind characteristics as the wind passes through the turbine rotor. This effect spreads for a few tens of meters, varying according to the size of the turbine diameter. Low sea turbulence allows the wake effect to spread over greater distances (these distances are greater in summer compared to winter) [43], and it is necessary to observe the 10-fold diameter distance separating the turbines in the same direction as the wind.
The definition of the distance between the turbines in a wind farm is a measure that seeks to minimize the impacts of the wake effect. The closer the turbines are located amongst themselves, the greater the influence of the wake effect of one turbine on the others, decreasing the energy production in turbines affected by this phenomenon. A rule in the literature states that the distance between turbines installed laterally should be five times the diameter of the rotor and 10 times the diameter for turbines aligned in the same wind direction [6], and was adopted in this research. It is noteworthy that this rule is not unique in the literature, since the conditions presented at the exploration site, such as relief, require a specific study. Some registered parks in operation present variations in the lateral turbine distance from three to five diameters and from five to seven diameters for turbines installed in the same wind direction [44], while others adopt the 7 ha/MW rule [10].
Using these determinants, the adopted turbine occupies, in addition to the sweep of its blades, a surface area of 1.125 km². Finally, by dividing the area values of each viability region obtained in Table 7 by this value, the number of turbines is obtained. Table 8 presents the total number of possible allocated turbines and the available power annual energy production estimates for each scenario and per feasibility area.
The results indicate that, in general, the Brazilian coast presents high offshore wind potential, estimated at around 3 TW, and over 14,800 TWh of average annual electricity production is possible. This amount is equivalent to about 20 times the currently installed electricity capacity in Brazil or the estimated power for onshore wind power, or the equivalent of over 200 Itaipu hydroelectric power plants, the second largest hydroelectric power plant in the world (at 14,000 MW installed power, losing only to the Three Gorges plant in China, at 18,200 MW installed power), located on the border between Brazil and Paraguay.
The exploration of Brazilian offshore potential is still at an early stage. Thus, it is not possible to register offshore wind farms under implementation or in operation throughout the national territory, as the projects in this area are not in the process of prospecting for potential environmental impact studies. Examples include the Asa offshore wind complexes Branca I, Caucaia and Jangada, on the coast of the state of Ceará, a Petrobras pilot plant near the city of Guamaré, on the coast of the state of Rio Grande do Norte, the Maravilha complex on the coast near the city of Campos, in the state of Rio de Janeiro and the Águas Claras complex on the coast near the city of Porto Alegre, in the state of Rio Grande do Sul [16]. Unlike the onshore wind potential in Brazil already estimated at 143 GW [6], research aimed at estimating offshore wind potential is scarce and restricted to limited areas.
In this context, the potential estimated in this research aims to signal this wind resource, allowing for the identification of more attractive areas and regions, so that it can advance in new technical, economic and environmental feasibility studies. It is important to note that the presented potential is indicative. Thus, it is possible to structure scenarios for its use. For example, if a public policy to encourage offshore wind exploration is promoted in Brazil to exploit only 10% of the potential identified in the article, efforts would be mobilized to add an installed capacity of 300 GW, about twice the current installed capacity in Brazil. Another important aspect to consider is that is no legislation is yet available to guide the exploitation of this activity in the country. Thus, a study that considers the generalized occupation of space indicates the need to plan the criteria that will be used to regulate the concession of areas where future offshore wind farms will be built.
It should be noted that this value is much higher than that estimated by Pimenta et al. (2008) and Ortiz and Kampel (2011), since the former only estimated the potential of the Brazilian Southeast, while the latter considered winds at a lower altitude (80 m), with a lower power turbine [13,14]. In addition, that study did not take into account the Betz limit as a restriction, but adopts a coefficient of 40% and, even in these conditions, reports a potential of 1.78 TW.
Even with the applied environmental restrictions, which exclude over 800,000 km² and disregarding the little or no feasibility regions, about 40% of the Brazilian coast displays offshore wind power production potential, as confirmed in Table 7. The excluded area (about 23%) is in accordance with the exclusion area measurements, which indicate a 10% to 46% reduction of the available area, due to competing uses of the same space [45]. Even with the variations observed for the three scenarios, this potential is distributed throughout at least three noteworthy regions: (a) the northern coast of the country, with the north coast of the Northeast Region displaying the greatest feasibility, followed by the north coast of the North Region; (b) the coast ranging from the extreme south of Bahia in the Northeast Region to the coast of Cabo Frio, in the state of Rio de Janeiro, in the southeastern region, with higher feasibility noted on the coast of Rio de Janeiro; (c) the southern coast of the country, especially ranging from Florianópolis to the southern end of the country (Figure 9).
The northeastern coast potential comprises a region whose waters are less than 60 m deep at a distance from the shoreline of less than 50 km, which may favor the beginning of offshore wind farm installations by considerably reducing the cabling costs to the mainland. On the other hand, the South Region displays high potential, but is located in deep waters, i.e., its potential stretches across shorelines at depths greater than 150 m and is located over 100 km away from the coastline, probably limiting its short-term development, at least with existing and operating commercial technologies. However, its indication as a viable area demonstrates how wind resources are thriving in this region, since the area is noteworthy even when combining the depth and distance. This high-depth area can become a site for wind power production through the development and consolidation of floating foundation technologies or the integration with other techniques. The coast of Rio de Janeiro displays sparser viability in an area known for oil and gas drilling.
A natural path is to explore developments which can be integrated with operating oil platforms, optimizing logistics, reducing cabling and thus contributing to obtain a less polluting oil production energy balance. This combination of activities should present adequate synergy with the energy sector, providing significant savings and reducing power supply risks by diversifying power sources. In the south coastal region, exploring wind potential in more distant areas will lead to increased logistics and cabling costs.

3.3. Economic Analysis

In the same way that the quantification of a non-renewable resource—in its physical dimension (reserve)—is not a guarantee of its economic use, the estimation, even if high, of the potential of a renewable resource does not guarantee its use. Thus, it is not possible to extend an energy source in nature through a technical definition associated with a political choice. However, several economic determinants establish spaces for policies that sustain, alter or transform the role to be played by quantified resources into future scenarios.
Thus, the political-economic environment is determinant regarding the rhythm and paths that offshore wind energy will travel in the next decades as a commercial option in competition with other electricity generation technologies in use. It is well known that a series of political-economic choices act strongly on the financial results of an offshore wind farm, impacting tax implementation or establishing mechanisms to support technological and infrastructure development, with reducing costs as a central objective [46].
Regardless of the high Brazilian offshore wind potential identified herein, onshore wind farms are currently competitive against conventional forms of generation, which is also a natural preference when compared with the offshore modality.
Brazilian onshore wind potential was estimated at 143.5 GW in 2001, based on an average land occupation density of 2 MW/km2 and turbines installed at a height of 50 m, for annual average winds equal to or higher than 7.0 m/s. The use of an area comprising 71,735 km2 (0.8% of the national territory) is necessary for this use. In its ongoing review, the new atlas of Brazilian onshore wind potential, now using 100-meter towers, points to a technically feasible extension of 880 GW [47].
In the last auction for energy contracts from hydroelectric, thermoelectric, wind and solar A4 projects, carried out in January 2018, four wind farms presented the lowest prices, corresponding to a final average value of USD 20.16/MWh [48].
Even in view of the attractiveness of onshore exploration, it is necessary for Brazil to develop a political-economic environment that allows exploration of the offshore modality with the perspective of promoting and taking advantage of the reduction cost period that the world has been experiencing due to technological innovations and industry maturity.
The lack of offshore wind development on the Brazilian coast restricts an economic analysis based on accounting for the investment, operating and decommissioning costs. However, it is possible to point out a horizon for which the convergence of a future value for Brazilian offshore wind energy is observed. To do so, the use of the levelized cost of energy (LCOE) is applied, by comparing international projections. The LCOE can be described as the revenue required for each unit of energy produced by an electricity generation project to result in a zero net present value over the life of the project. In other words, the sum of the discounted costs must be equal to the sum of the discounted benefits, according to the following equation:
n = 1 N L C O E   x   E n 1 r n = n = 1 N C n + O M n + D n 1 r n
where:
L C O E is the levelized cost of energy (USD/MWh);
E n is the energy produced by the project in year n;
C n is the capital investment cost incurred in year n;
O M n is the operation and maintenance cost incurred in year n;
D n is the decommissioning cost incurred in year n;
N is the project lifetime; and
r is the discount rate.
By translating the potential of a primary source (wind, irradiance, heat, water potential, etc.) into an economic value (USD/MWh), the LCOE is used to compare the price of energy generated by different sources or even from the same source, but which make use of different technologies: Solar Photovoltaic (PV) or Concentrated Solar Power (CSP), open Natural Gas (NG) or a combined cycle. Figure 10 presents the LCOE history of offshore wind technology compared with the onshore wind LCOE for some countries and also displays two projections for the offshore LCOE by 2030. The graphs are presented to show the convergence of the observed onshore and offshore LCOE values, with the projected global LCOE values. The figure shows the convergence of two graphs: on the left, a graph shows the LCOE values observed between 2010 and 2016; on the right, another graph shows the LCOE projections for the year 2030.
It is assumed that, in the last decade, the LCOEs of both wind farm technologies have fallen throughout this entire period. This can be credited to the increase of investments in projects, promoting technological innovations, research and increasing the efficiency in the construction and commissioning of the wind farms, in addition to increasing the sizes of the projects, producing scale gains. However, it is worth noting that the values practiced in the offshore projects have remained well above those practiced onshore.
In 2018, offshore wind farms in Europe presented average turbine size in the order of 6.8 MW, at an average depth of 27 m and a mean coast distance of 33 km [51], practical values in the verified Brazilian coast reality. In addition, many projects have become concentrated up to 40 m deep and are moving further away from the coast, already exceeding 100 km. With this, it is clear that Brazil presents viability for the adoption of offshore projects as practiced worldwide, with a high installed capacity through large turbines, in shallow waters and near the coast, since the Brazilian potential is concentrated in bands of up to 50 m in depth and 50 km off the coast, leading to perspectives concerning competitive prices in comparison with the trend of certain characteristics verified in the projects that have been implemented so far. Studies currently indicate high offshore wind potential for Brazil and China, at more than 7,000 TWh/year, but still with very high LCOEs compared to the countries displaying less potential [23].
Among the potential areas mapped in this research, the north coast of the Northeast Brazilian Region is the most attractive for the development of offshore wind farms, since it presents the greatest coastal extension with favorable characteristics for this end. Due to its attractions, four pioneering offshore projects totaling 3,715 MW in this region are being prepared [16].
The outstanding area near the coast of Rio de Janeiro presents a more dispersed potential, but suggests an integrated use of oil exploration platforms. This integration can allow for the exploitation of offshore wind farms mainly due to synergy with the petroleum sector in several aspects, especially in the use of skilled labor [11].
On the other hand, the area located in the southern region, although offering high wind resources, is located in deep water areas far from the coast, suggesting exploration development through floating structures, which are more costly among the usually applied foundations. However, it should be noted that this region should not be neglected since, according to Wind Europe, 2017, it is projected that by 2050, cost savings of 38% and 50% for the development of floating structures will occur [50].

4. Conclusions

The wind potential identified throughout the Brazilian coast provides conditions for significant energy sector development, a revolution similar to that noted during the construction period of the first large hydroelectric plants, which are the basis of the firm energy for the country’s electricity system. In addition, there is space for the promotion and development of port infrastructures from the insertion of the offshore wind power source, as well as the naval industry, including other agents that participate in the productive chain related to the sector.
Thus, it is necessary to formulate a Brazilian regulatory policy that promotes the competitiveness of the market segment by enabling the exploration of the offshore wind potential, which guarantees legal certainty to investors and preserves the EEZ’s environmental biodiversity.
It is necessary to establish an ecological economic zoning of the areas displaying the greatest potential identified herein for the beginning of offshore exploration in Brazil. The pretension to launch a specific methodological view on the entire coast, although relevant, brings with it the data limitations and high-quality information for wind, bathymetry or environmental data.
For future studies, smaller areas should be approached, allowing the inclusion of more precise information regarding other environmental nature variables and of details of non-wind uses on the coast, such as the cable and duct network of for oil and gas exploration, the impact on tourism activity and the local landscape as a social variable.
Finally, it is important to highlight the importance of research and innovation for the development of technologies and energy storage capacity, which allow for a production flow without jeopardizing the transmission network and equating the instabilities characteristic of the intermittent nature of energy generated by a wind source.

Author Contributions

Conceptualization, S.S.P.d.A., A.O.P.J., N.F.d.S. and R.S.B.d.A.; methodology, S.S.P.d.A., A.O.P.J. and A.A.C.J.; software, S.S.P.d.A. and A.A.C.J; formal analysis, S.S.P.d.A., N.F.d.S. and A.A.C.J.; validation, S.S.P.d.A., N.F.d.S. and A.A.C.J; investigation, S.S.P.d.A. and A.A.C.J.; resources, S.S.P.D.A., A.A.C.J. and R.S.B.d.A.; data curation, S.S.P.D.A. and A.A.C.J.; writing—original draft preparation, S.S.P.d.A. and N.F.d.S.; writing—review and editing, S.S.P.d.A., A.O.P.J., N.F.d.S. and R.S.B.d.A.; visualization, S.S.P.d.A., A.O.P.J., N.F.d.S. and R.S.B.d.A.; supervision, A.O.P.J., N.F.d.S. and R.S.B.d.A.; project administration, S.S.P.d.A., A.O.P.J., N.F.d.S. and R.S.B.d.A.; funding acquisition, A.O.P.J., N.F.d.S. and R.S.B.d.A. All authors have read and agreed to the published version of the manuscript.

Funding

This research was funded by a scholarship supported by Program CAPES/DINTER at the Federal University of Rio de Janeiro and Federal Institute of Science, Education and Technology of Rio Grande do Norte, financed by CAPES—Brazilian Federal Agency for Support and Evaluation of Graduate Education within the Ministry of Education of Brazil, grant number 023/2014.

Acknowledgments

The authors would like to thank CAPES for enabling the collaboration between PPE/COPPE UFRJ and IFRN within the framework of the DINTER program, CAPES for the financial support and Professor Paulo Victor do Nascimento Araújo for his relevant contributions.

Conflicts of Interest

The authors declare no conflict of interest.

References

  1. Brazil Intended Nationally Determined Contribution: Towards achieving the objective of the United Nations Framework Convention on Climate Change. Available online: http://www.itamaraty.gov.br/images/ed_desenvsust/BRAZIL-iNDC-english.pdf (accessed on 1 July 2019).
  2. ANEEL Usinas Eolielétricas. SIGEL—Sistema de Informações Georreferenciadas do Setor Elétrico. Available online: https://sigel.aneel.gov.br/arcgis/services/PORTAL/Camadas/MapServer/WMSServer (accessed on 19 April 2020).
  3. IBGE Municípios Brasileiros. Bases Cartográficas e Referenciais do Território. Available online: https://mapas.ibge.gov.br/bases-e-referenciais.html (accessed on 19 April 2020).
  4. IBGE População Residente Estimada em 2019. SIDRA—Sistema IBGE de Recuperação Automática. Available online: https://sidra.ibge.gov.br/tabela/6579#notas-tabela (accessed on 19 April 2020).
  5. Brannstrom, C.; Gorayeb, A.; de Souza, W.F.; Leite, N.S.; Chaves, L.O.; Guimarães, R.; Gê, D.R.F. Perspectivas geográficas nas transformações do litoral brasileiro pela energia eólica. Rev. Bras. Geogr. 2018, 63, 3–28. [Google Scholar] [CrossRef] [Green Version]
  6. Amarante, O.A.C.; Brower, M.; Zack, J.; Sá, A.L. Atlas do Potencial Eólico Brasileiro; CRESESB: Brasília, Brasil, 2001. [Google Scholar]
  7. Esteban, M.D.; Diez, J.J.; López, J.S.; Negro, V. Why offshore wind energy? Renew. Energy 2011, 36, 444–450. [Google Scholar] [CrossRef] [Green Version]
  8. Adelaja, A.; McKeown, C.; Calnin, B.; Hailu, Y. Assessing offshore wind potential. Energy Policy 2012, 42, 191–200. [Google Scholar] [CrossRef]
  9. Malhotra, S. Selection, Design and Construction of Offshore Wind Turbine Foundations. Wind Turbines 2011. [Google Scholar] [CrossRef] [Green Version]
  10. Schaffarczyk, A. Understanding Wind Power Technology; John Wiley & Sons: New Jersey, NJ, USA, 2014; ISBN 9781118647516. [Google Scholar]
  11. IRENA. Renewable Energy Benefits: Leveraging Local Capacity for Offshore Wind; IRENA: Abu Dhabi, UAE, 2018; ISBN 978-92-9260-032-7. [Google Scholar]
  12. Villacreses, G.; Gaona, G.; Martínez-Gómez, J.; Jijón, D.J. Wind farms suitability location using geographical information system (GIS), based on multi-criteria decision making (MCDM) methods: The case of continental Ecuador. Renew. Energy 2017, 109, 275–286. [Google Scholar] [CrossRef]
  13. Pimenta, F.; Kempton, W.; Garvine, R. Combining meteorological stations and satellite data to evaluate the offshore wind power resource of Southeastern Brazil. Renew. Energy 2008, 33, 2375–2387. [Google Scholar] [CrossRef]
  14. Ortiz, G.P.; Kampel, M. Potencial de energia eólica offshore na margem do Brasil. In Proceedings of the V Simpósio Brasileiro de Oceanografia, Santos, Brazil, 17–20 April 2011. [Google Scholar]
  15. Lima, D.K.S.; Leão, R.P.S.; dos Santos, A.C.S.; de Melo, F.D.C.; Couto, V.M.; de Noronha, A.W.T.; Oliveira, D.S. Estimating the offshore wind resources of the State of Ceará in Brazil. Renew. Energy 2015, 83, 203–221. [Google Scholar] [CrossRef]
  16. IBAMA Processos de Licenciamento Ambiental. Available online: https://servicos.ibama.gov.br/licenciamento/consulta_empreendimentos.php (accessed on 17 April 2020).
  17. EPE. Potencial dos Recursos Energéticos no Horizonte 2050; EPE: Rio de Janeiro, Brasil, 2018.
  18. UNCLOS United Nations Convention on the Law of the Sea. Int. J. Mar. Coast. Law 1997, 12, 404–412.
  19. BRASIL Lei n° 8.617 de 4 de Janeiro de 1993 (dispõe sobre as divisões da ZEE brasileira). Available online: https://www.planalto.gov.br/ccivil_03/leis/l8617.htm (accessed on 1 May 2020).
  20. CPRM Dados, Informações e Produtos do Serviço Geológico Brasileiro. Available online: http://geosgb.cprm.gov.br/geosgb/downloads.html (accessed on 5 July 2017).
  21. IBGE. Atlas Geográfico das Zonas Costeiras e Oceânicas do Brasil; Diretoria de Geociências: Rio de Janeiro, Brasil, 2011; ISBN 9788524042195.
  22. Heptonstall, P.; Gross, R.; Greenacre, P.; Cockerill, T. The cost of offshore wind: Understanding the past and projecting the future. Energy Policy 2012, 41, 815–821. [Google Scholar] [CrossRef]
  23. Bosch, J.; Staffell, I.; Hawkes, A.D. Global levelised cost of electricity from offshore wind. Energy 2019, 189, 116357. [Google Scholar] [CrossRef]
  24. NOAA ETOPO-1 Global Relief Model. Available online: https://www.ngdc.noaa.gov/mgg/global/ (accessed on 5 September 2017).
  25. BRASIL Lei n° 9.985 de 18 de Julho de 2000 (Institui o Sistema Nacional de Unidades de Conservação da Natureza). Available online: http://www.planalto.gov.br/ccivil_03/leis/l9985.htm (accessed on 1 May 2020).
  26. ICMBio Mapa Temático e Dados Geoestatísticos das Unidades de Conservação Federais. Available online: https://www.icmbio.gov.br/portal/geoprocessamento1/51-menu-servicos/4004-downloads-mapa-tematico-e-dados-geoestatisticos-das-uc-s (accessed on 5 July 2018).
  27. ISA Monitoramento das Unidades de Conservação. Available online: https://uc.socioambiental.org/ (accessed on 2 May 2020).
  28. Waewsak, J.; Landry, M.; Gagnon, Y. Offshore wind power potential of the Gulf of Thailand. Renew. Energy 2015, 81, 609–626. [Google Scholar] [CrossRef]
  29. ECMWF ERA-Interim. Available online: https://www.ecmwf.int/en/forecasts/datasets (accessed on 5 September 2017).
  30. DTU Global Wind Atlas. Available online: https://globalwindatlas.info/ (accessed on 1 January 2020).
  31. CEPEL Atlas Eólico Brasileiro: Simulações 2013. Available online: http://novoatlas.cepel.br/ (accessed on 1 January 2020).
  32. Mahdy, M.; Bahaj, A.B.S. Multi criteria decision analysis for offshore wind energy potential in Egypt. Renew. Energy 2018, 118, 278–289. [Google Scholar] [CrossRef]
  33. Tegou, L.I.; Polatidis, H.; Haralambopoulos, D.A. Environmental management framework for wind farm siting: Methodology and case study. J. Environ. Manag. 2010, 91, 2134–2147. [Google Scholar] [CrossRef]
  34. Bennui, A.; Rattanamanee, P.; Puetpaiboon, U.; Phukpattaranont, P.; Chetpattananondh, K. Site selection for large wind turbine using GIS. In Proceedings of the PSU-UNS International Conference on Engineering and Environment, Songkhla, Thailand, 10–11 May 2007; pp. 561–566. [Google Scholar]
  35. Baban, S.M.J.; Parry, T. Developing and applying a GIS-assisted approach to locating wind farms in the UK. Renew. Energy 2001, 24, 59–71. [Google Scholar] [CrossRef]
  36. Latinopoulos, D.; Kechagia, K. A GIS-based multi-criteria evaluation for wind farm site selection. A regional scale application in Greece. Renew. Energy 2015, 78, 550–560. [Google Scholar] [CrossRef]
  37. Watson, J.J.W.; Hudson, M.D. Regional Scale wind farm and solar farm suitability assessment using GIS-assisted multi-criteria evaluation. Landsc. Urban Plan. 2015, 138, 20–31. [Google Scholar] [CrossRef]
  38. Ramírez-Rosado, I.J.; García-Garrido, E.; Fernández-Jiménez, L.A.; Zorzano-Santamaría, P.J.; Monteiro, C.; Miranda, V. Promotion of new wind farms based on a decision support system. Renew. Energy 2008, 33, 558–566. [Google Scholar] [CrossRef] [Green Version]
  39. Saaty, T. How to make a decision: The analytic hierarchy process. Eur. J. Oper. Res. 1990, 48, 9–265. [Google Scholar] [CrossRef]
  40. Saaty, T.; Tran, L. On the invalidity of fuzzifying numerical judgments in the analytic hierarchy process. Math. Comput. Model. 2007, 46, 962–975. [Google Scholar] [CrossRef]
  41. Carver, S. Integrating multi-criteria evaluation with geographical information systems. Int. J. Geogr. Inf. Syst. 1991, 5, 321–339. [Google Scholar] [CrossRef] [Green Version]
  42. Wind Europe Offshore Wind in Europe—Key Trends and Statistics 2017. Available online: https://windeurope.org/products/product/?id=36 (accessed on 1 March 2018).
  43. Bodini, N.; Lundquist, J.K.; Kirincich, A.U.S. East Coast Lidar Measurements Show Offshore Wind Turbines Will Encounter Very Low Atmospheric Turbulence. Geophys. Res. Lett. 2019, 46, 5582–5591. [Google Scholar] [CrossRef] [Green Version]
  44. Pinto, M. Fundamentos de Energia Eólica; LTC: Rio de Janeiro, Brazil, 2014. [Google Scholar]
  45. Dhanju, A.; Whitaker, P.; Kempton, W. Assessing Offshore Wind Resources: An Accessible Methodology. Renew. Energy 2008, 33, 55–64. [Google Scholar] [CrossRef]
  46. Xie, T.; Pejnovic, N.; Lees, A.; Ewing, E. Wind Energy: A Thorough Examination of Economic Viability. Univ. Chicago 2008, 1, 1–54. [Google Scholar]
  47. Bezerra, F.D.; dos Santos, L.S. Potencialidades da Energia Eólica no Nordeste. Cad. Setorial ETENE 2017, 2–20, year 2, no 5. [Google Scholar]
  48. EPE Leilões de Energia Elétrica de 2018. Available online: http://www.epe.gov.br/pt/imprensa/noticias/informe-tecnico-leiloes-de-energia-nova-de-2018 (accessed on 21 December 2018).
  49. IRENA. Power Generation Costs in 2017; IRENA: Abu Dhabi, UAE, 2018; ISBN 9789292600402. [Google Scholar]
  50. Wind Europe; BVG Associates. Unleashing Europe’s Offshore Wind Potential: A New Resource Assessmente. Available online: https://windeurope.org/wp-content/uploads/files/about-wind/reports/Unleashing-Europes-offshore-wind-potential.pdf (accessed on 1 July 2017).
  51. Wind Europe Offshore Wind in Europe—Key Trends and Statistics 2018. Available online: https://windeurope.org/products/product/?id=61 (accessed on 1 March 2019).
Figure 1. Wind farms in operation in Brazil. Source: [2,3,4].
Energies 13 02557 g001
Figure 2. Delimitation of the Brazilian exclusive economic zone (EEZ). Source: [20].
Energies 13 02557 g002
Figure 3. EEZ divisions. Source: [21].
Energies 13 02557 g003
Figure 4. EEZ depth ranges—bathymetry. Source: [24].
Energies 13 02557 g004
Figure 5. Distance from the coast represented in strips.
Energies 13 02557 g005
Figure 6. Environmental conservation units. Source: ICMBio [26], state agencies and Instituto Socioambiental [27].
Energies 13 02557 g006
Figure 7. Wind resource at 100 m height. Source: [29].
Energies 13 02557 g007
Figure 8. Flow-chart representation of the methodology.
Energies 13 02557 g008
Figure 9. Scenarios produced by applying the feasibility index.
Energies 13 02557 g009
Figure 10. Average onshore levelized cost of energy (LCOE) and offshore 2010–2016 and offshore LCOE estimated for 2015–2030. Source: adapted from IRENA 2018 and Wind Europe 2017 [49,50]. (*) EUR 65/MWh is considered a competitive LCOE value for offshore wind [34].
Energies 13 02557 g010
Table 1. Friedman’s non-parametric statistical test.
PointCEPEL Atlas 100 mGlobal Wind 100 mExtrapolation for 100 m
A8.207.998.41
B8.348.198.57
C9.157.818.38
D9.077.298.39
E8.866.578.36
F9.547.328.62
G8.997.916.76
H7.738.046.69
I4.274.824.41
J7.807.966.46
K7.698.437.92
L8.328.077.62
Source: [29,30,31]. H0: no difference between the adopted approaches; H1: difference is noted between the adopted approaches; degrees of freedom: 11; p-value: 0.234415551, As p-value = 0.234415551, statistical evidence exists for not rejecting the null hypothesis at a 5% significance level. Thus, there is no significant difference between the information given by the Electrical Energy Research Center (CEPEL) atlas, Global Wind Atlas and the extrapolations.
Table 2. Territory areas investigated in studies that apply multicriteria analyses as a methodology for potential offshore wind assessments.
TerritoryArea (km2)
Brazil8,515,770
Brazil EEZ (offshore)3,500,000
Egypt1,001,450
North Sea (offshore)574, 977
Thailand513,120
South Korea99,720
Source: [14,28,32,39,40,41].
Table 3. Definition and explanation of the different scores.
ValueDefinitionExplanation
1Equal importanceThe two criteria contribute in an identical way to the objective
3Little more importantAnalysis and experience indicate that one criterion is a little more important than the other
5Much more importantAnalysis and experience indicate that one criterion is clearly more important than the other
7Fairly importantAnalysis and experience indicate that one of the criteria is predominant for the objective
9Extremely more importantWithout a doubt one of the criteria is absolutely predominant for the objective
2, 4, 6, 8Intermediate ValuesCan also be used
Source: [39].
Table 4. Description of weight attribution profiles for each produced scenario.
ScenarioPlanner Profile
Scenario 1A planner who considers wind quality as the determining variable for the definition of a feasible area. If wind data indicates high available power, then he/she is willing to capture that potential. Sea depth and distance from the coast are minor factors.
Scenario 2A planner who considers wind quality as a determining variable for the definition of a viable area, but depth, due to cost increases, poses a challenge regarding engineering and maintenance, and is considered as important as the wind quality. In addition to wind potential, this investor takes in account both sea depth and distance from the coastline, in order to decide on whether or not to follow through with his/her project. Due to the offshore operating wind farm backlog, most investors resemble this profile. Despite not displaying the same relevance as the wind, depth is very important and distance from the coastline carries a substantial weight in defining the feasible area.
Scenario 3A planner who considers wind quality as a determining variable for the definition of the feasibility area and depth as a secondary relevance variable. Distance from the coastline is a minor factor.
Table 5. Two-by-two matrices and the respective weights for each parameter.
Scenario 1: Wind Determines 72.4% of the Feasible Areas
CriterionWindDepthDistanceModel IndexesWeights
Wind157λ = 3.06772.4%
Depth1/513CI = 0.03419.3%
Distance1/71/31CR = 0.0598.3%
Scenario 2: Wind Determines 55.6% of the Feasible Areas
CriterionWindDepthDistanceModel IndexesWeights
Wind125λ = 3.05455.6%
Depth1/215CI = 0.02735.4%
Distance1/51/51CR = 0.0479.1%
Scenario 3: Wind Determines 64.3% of the Feasible Areas
CriterionWindDepthDistanceModel IndexesWeights
Wind137λ = 3.06864.3%
Depth1/315CI = 0.03428.3%
Distance1/71/51CR = 0.0597.4%
Table 6. Area categorization using the feasibility index.
CategoryVery FeasibleFeasible Slightly FeasibleUnfeasible
Feasibility IndexFI ≥ 0.8 0.8 > FI ≥ 0.70.7 > FI ≥ 0.50.5 ≥ FI
Table 7. Areas (in km2) and percentages for each category in each produced scenario.
CategoryScenario 1%Scenario 2%Scenario 3%
Very feasible427,80616.0360,66913.5379,70014.2
Feasible734,34327.4579,63421.7668,95325.0
Slightly Feasible1,496,23555.91,485,89355.51,607,79360.1
Unfeasible18,8560.7251,0439.420,7940.8
TOTAL2,677,240100.002,677,240100.002,677,240100.00
Table 8. Viable number of turbines and power per feasibility area and annual energy production (AEP).
CategoryScen 1
(N°. Turb.)
Power
(GW)
AEP
(TWh)
Scen 2
(N°. Turb)
Power
(GW)
AEP
(TWh)
Scen 3
(N°. Turb)
Power
(GW)
AEP
(TWh)
Fairly Feasible380,2721,2556,047320,5951,0585,097337,5111,1145,367
Feasible652,7492,15410,378515,2301,7008,191594,6251,9629,453
TOTAL1,033,0213,40916,425835,8252,75813,288932,1363,07614,820

