Article

Micro-Degradation Characteristics and Mechanism of ZnO Varistors under Multi-Pulse Lightning Strike

1
Heilongjiang Meteorological Disaster Prevention Technology Center, Harbin 150030, China
2
Jiangsu Key Laboratory of Meteorological Observation and Information Processing, Nanjing University of Information Science & Technology, Nanjing 210044, China
3
School of Atmospheric Physics, Nanjing University of Information Science & Technology, Nanjing 21004, China
4
Shenzhen Meteorological Service Center, Shenzhen 518000, China
*
Author to whom correspondence should be addressed.
Energies 2020, 13(10), 2620; https://doi.org/10.3390/en13102620
Submission received: 26 April 2020 / Revised: 18 May 2020 / Accepted: 19 May 2020 / Published: 21 May 2020
(This article belongs to the Section F: Electrical Engineering)

Abstract

:
In view of the problem that ZnO varistors are often subjected to thermal breakdown and deterioration due to lightning strikes in low-voltage power distribution systems, this article used a 8/20 µs multi-pulse surge current with a pulse time interval of 50 ms to perform shock experiments on ZnO varistors. SEM scanning electron microscope and an XRD diffractometer were used to analyze the structure of the grain boundary layer and the change of the crystalline phase material of ZnO varistor under the action of a multi-pulse current. The damage mechanism of ZnO varistor under the multi-pulse current was studied at the micro level. The results show that the average impact life of different types of ZnO varistor is significantly different. It was found that the types of trace elements and grain size in the grain boundary layer will affect the ability of ZnO varistor to withstand multi-pulse current. As the number of impulses increases, the grain structure of the ZnO varistor continues to degenerate. The unevenness of internal ion migration and the nonuniformity of the micro-grain boundary layer cause the local energy density to be too large and cause the local temperature rise to be too high, which eventually causes the internal grain boundary to melt through, and the local high temperature may cause the Bi element in the ZnO varistor to change in different crystal phases.

1. Introduction

The installation of a surge protector (SPD) is one of the most economical and effective protection methods for reducing the damage of lightning strikes in low-voltage power distribution systems. ZnO varistors are used for surge protection in low-voltage systems. [1,2]. The problem of the lightning strike failure of ZnO varistors has always been one of the core problems in low-voltage distribution systems. It is of significant value to improve the safety performance of ZnO varistors by studying its failure mechanism in the laboratory [3,4].
In the IEC62305-1 lightning protection standard, it is believed that the multi-pulse contains three to five pulses on average and the interval between each pulse is about 50 ms [5]. Lightning multi-pulse has significantly different physical characteristics compared with the traditional single pulse, especially in terms of energy accumulation and action time. There is a huge difference from single-pulse lightning, resulting in a significant difference in heat absorption and the temperature rise of the ZnO varistor [6,7]. Compared with the single pulse, the ZnO varistor will be more severely tested under the impact of a multi-pulse current due to thermal effects, such as temperature rise, changes in electrical performance parameters and its ability to withstand shocks [8]. There is little research on the thermal effect of a multi-pulse current and its interaction mechanism with ZnO varistors, especially since the microscopic grain boundary change characteristics of a ZnO varistor during the impact process are not clear.
B. Vahidi [9] and C. Heinrich [10] respectively explained the destructive effects of a multi-pulse surge current on ZnO surge arresters in power distribution systems at the 24th International Conference on Lightning Protection. Haryono et al. [11,12] conducted an impact experiment on a ZnO varistor using an 8/20 μs impulse current with five pulses and a pulse interval of 35 ms, and analyzed the multi-pulse destruction effect of the ZnO varistor. It increased the probability of damage. This phenomenon also exists under single pulse impact, because the amplitude of the injected lightning current is proportional to the impact energy. A large current amplitude will inevitably make the ZnO varistor have a higher temperature rise. However, the damage result of the ZnO varistor is not related to the thermal effect of a multi-pulse lightning current. Some scholars analyzed the microscopic characteristics of a ZnO varistor by means of microscopic observation. Lou Jiayi [13] compared and analyzed the microstructural damage characteristics of a ZnO varistor under single-pulse and multi-pulse conditions, using scanning electron microscope (SEM) and material composition analysis. An X-ray diffractometer (XRD) was used to study the accompanying material changes during the impact. Under the multi-pulse, the ZnO varistor had obvious squeezing failure within the grain boundary and the degree of damage to the unit cell structure in different parts varied greatly. When the ZnO varistor was subjected to multi-pulse impact, the continuous high temperature causes damage to the internal material composition of the ZnO varistor, which leads to its failure [14]. Zhang Yijun et al. [15,16] carried out the SPD endurance test under natural lightning strike conditions at the Guangzhou Lightning Experiment Base. The nominal 20 kA SPD was damaged by a 1.64 kA lightning multi-pulse current. When a multi-pulse strikes a ZnO varistor, even if the peak current of the lightning impulse is relatively small, the energy it releases is much greater than the energy generated by the single-pulse current impulse test simulated by the laboratory. However, the observation results of a field lightning test can only be analyzed as a case, and it is not repeatable and statistical.
In this paper, through an in-depth observation of the micro-grain boundary structure of the ZnO varistor, we can more fully grasp the internal microstructure and material properties of the ZnO varistor during the impact process, and obtain the micro-damage mechanism of the ZnO varistor under a multi-pulse impact. We expected the research results to provide a theoretical basis for multi-pulse lightning protection.

2. Experiment

2.1. Impulse Test and Waveform

The experimental platform built in this paper can produce a lightning strike process similar to natural lightning in the laboratory environment. The test platform is shown in Figure 1.
According to “IEC62305-1 Lightning Protection Part 1: General Provisions”, lightning with an average of three to four lightning strikes and a lightning strike interval of approximately 50 ms is defined as multi-pulse. This experiment waveform therefore used multi-pulse current as the number of pulses was five and the pulse interval was 50 ms, the pulse amplitude was the nominal discharge current of the ZnO varistor, and the waveform on the oscilloscope is shown in Figure 2. In the Figure, the five yellow vertical lines zooming in and out represent five pulses, respectively, and the 8/20 μs waveform below is a full waveform diagram of a single pulse.

2.2. Experimental Procedure

(1)
Sample selection: three ZnO varistor samples of A, B and C specifications were selected in the experiment. All the samples had a nominal discharge current 20 kA, a maximum discharge current 40 kA and a maximum continuous operating voltage of 385 V. Measured for its static parameter varistor voltage value and leakage current value, the sample with the closest static parameter electrical characteristics was selected as the test product and the varistor voltage was about 680 V. Nine samples of the same batch were selected for each specification.
(2)
Impulse test: use multi-pulse current to perform an impulse test on the ZnO varistor. The impulse test process is shown in Figure 3. Every five pulse currents were recorded as a group and a test was performed. Each adjacent two impact groups had time intervals of 30 min, as this time interval was enough to allow the ZnO varistor to cool to room temperature and then perform the next test until the ZnO varistor static parameter varistor voltage change exceeded the original ±10%, or the leakage current exceeded 20 μA or the mechanical damage occurred directly. When the ZnO varistor failed, the impulse test was stopped and the relevant data was recorded.
(3)
After each test measure the temperature, varistor voltage and leakage current of the surface of the ZnO varistor and checked whether the ZnO varistor was broken or perforated and took a picture of the damaged ZnO varistor.
(4)
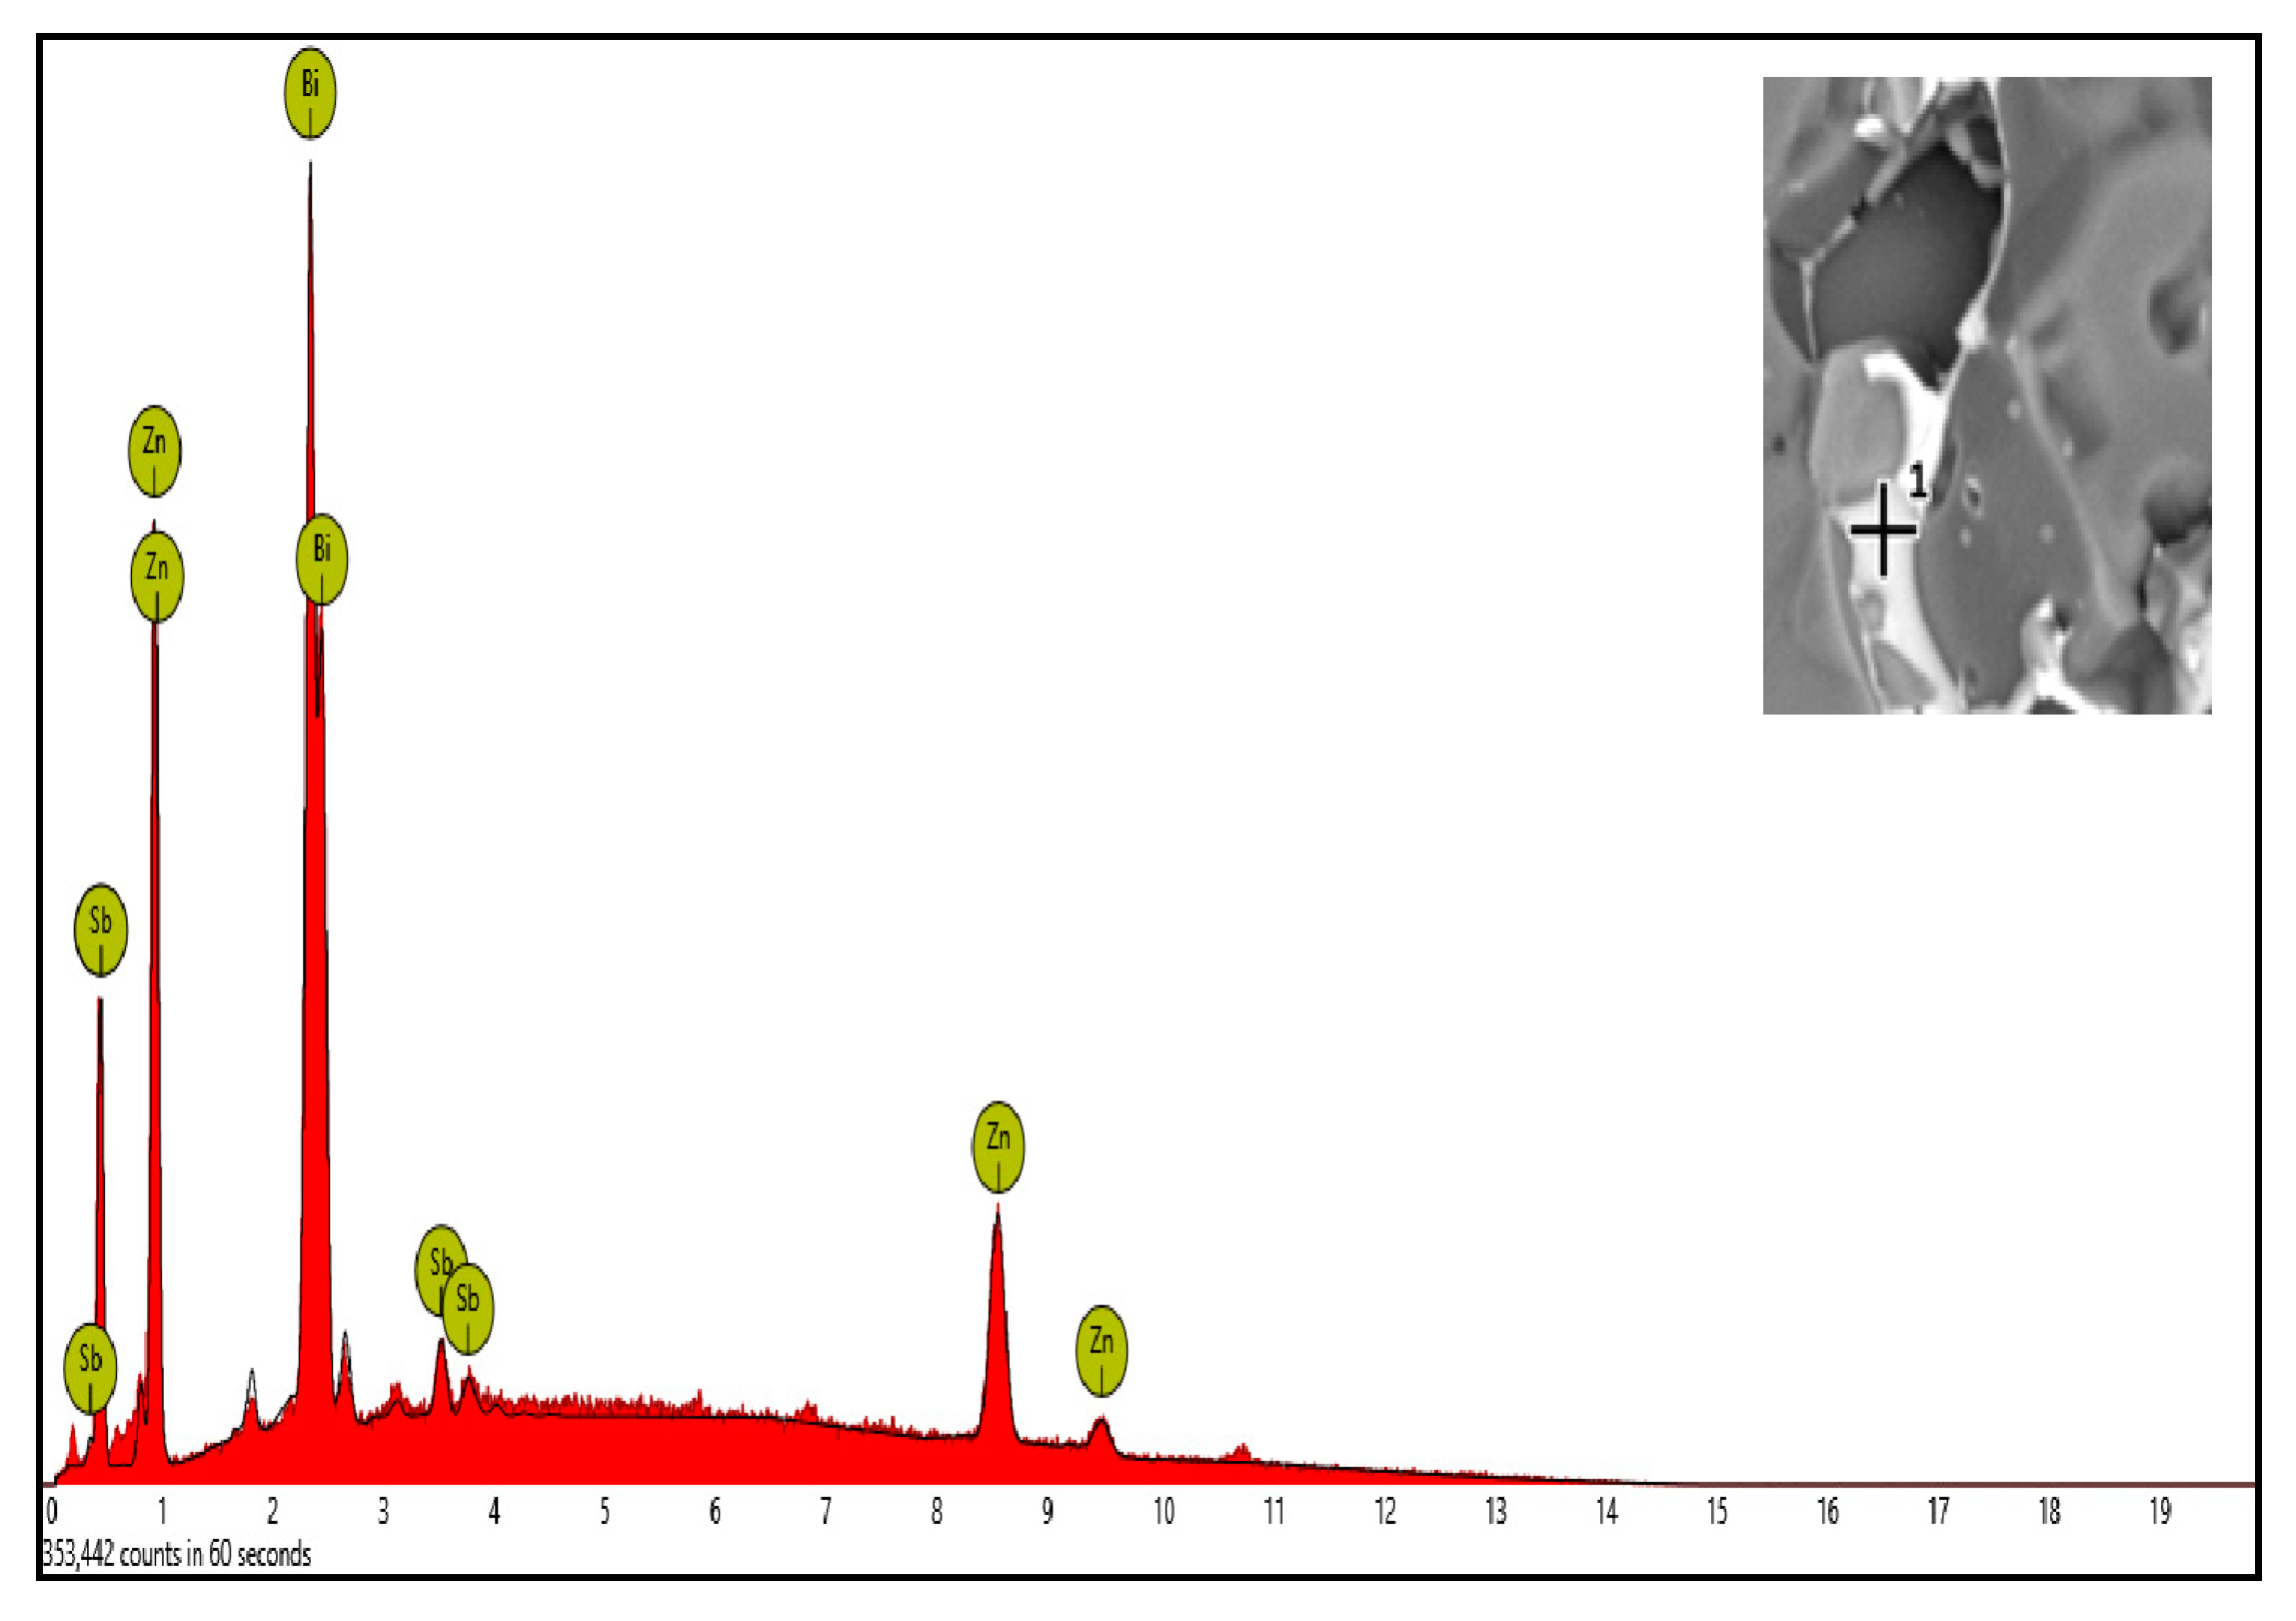
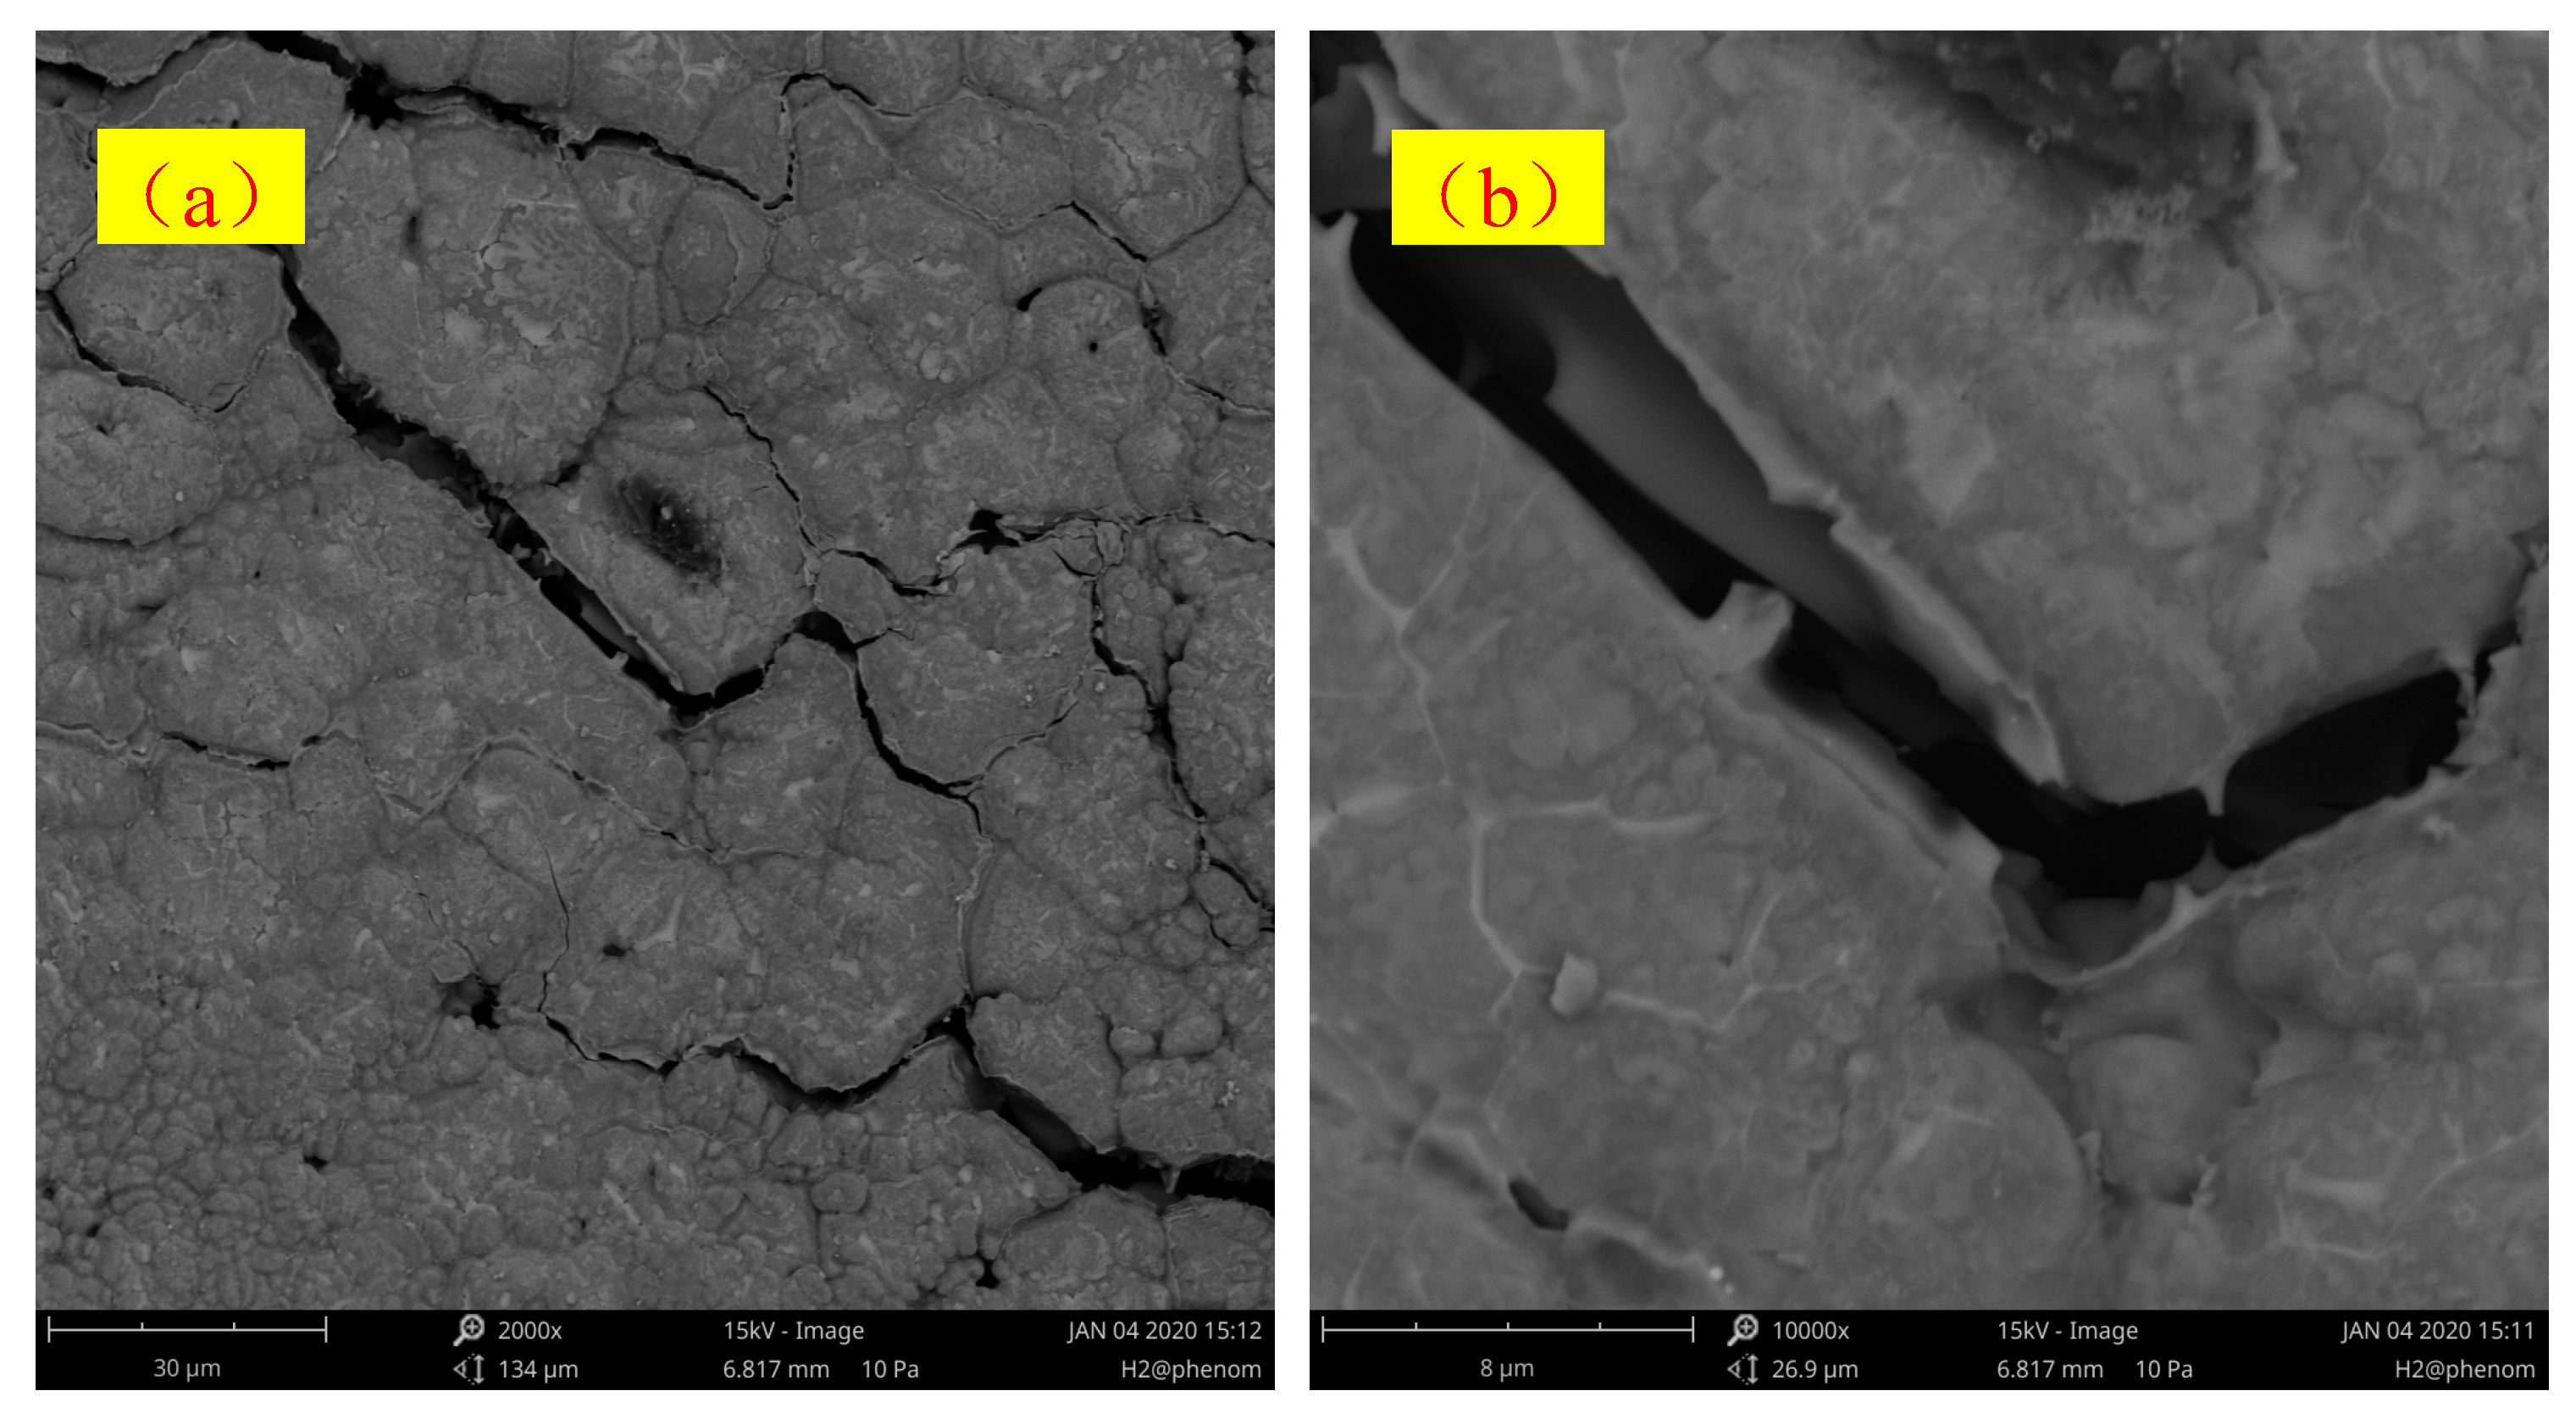
Scanning electron microscope (SEM) was used to scan the ZnO varistor samples before and after the impact and the X-ray diffractometer (XRD) was used to diffract and to observe the microstructure characteristics and phase structure changes of the ZnO varistor.

3. Results and Discussion

3.1. Relationship between Microstructure Characteristics and Impact Life of ZnO Varistor

Analysis of the microscopic characteristics of the ZnO varistor. Sample B2 was taken as an example. Figure 4 is the SEM scan image of the ZnO varistor B2 before impact. It was composed of four crystal phases, which are marked as +1, +2, +3 and +4.
EDS spectrum analysis was performed on four positions of +1, +2, +3 and +4. The element composition and atomic percentage of each position are shown in Table 1 and Figure 5. It can be seen that the main component of the ZnO varistor of this sample was ZnO and in addition it contained a small amount of Bi and Sb compounds.
The white bright area at the +1 position was the grain boundary layer. The EDS spectrum analysis is shown in Figure 6. Four elements were detected in this area, namely Zn, O, Bi and Sb, of which Zn accounted for 7.47%, O accounted for 60.75%, Bi accounted for 20.59% and Sb accounted for 2.48%. The area at +2 was a gray–white boundary area. Three elements were detected in this area, namely Zn, O and Bi, of which Zn accounted for 53.34%, O accounted for 31.14% and Bi accounted for 15.51%. The +3 position area was a gray area. Three elements were detected in this area, namely Zn, O and Bi, of which Zn accounted for 51.87%, O accounted for 47.94% and Bi accounted for 0.19%. It can be seen that this region was mainly ZnO, and there were very few other impurities and compounds. The +4 position area was a black area. Four elements were detected in this area, namely Zn, O, Bi and Sb, of which Zn accounted for 88.03%, O accounted for 9.98%, Bi accounted for 1.13% and Sb accounted for 0.86%. It can be seen that this area contained other impurities and trace element compounds.
The impact life of the different types of varistors is shown in Table 2. The average life of sample A was 4, the average life of sample B was 7 and the average life of sample C was 16. At the same time, the impact life dispersion in each sample was very small, so the average life can be used for characteristic analysis.
Similarly, by analyzing the microscopic characteristics and the impact life of the three ZnO varistors, it can be seen that the basic structural composition of different types of ZnO varistors is similar, which are composed of ZnO grains, grain boundary layers, spinel and pores. However, the added impurity components inside are different. The average impact life of the different types of ZnO varistors and the corresponding types of trace elements are shown in Figure 7. The horizontal axis is the type of ZnO varistor, the left vertical axis is the average impact life and the right vertical axis is the trace element type. The C type ZnO varistor has the most added trace elements, a total of five types—Bi, Sb, Zr, Co, Ni—an average impact life of 4 and the worst ability to withstand the impact. The type A ZnO varistor has the least added trace elements—only the Bi element—an average impact life of 16 and the best impact resistance. It can be seen that, without considering the influence of other factors, the increase in the trace element types in this study did not improve the average impact life of the ZnO varistors under the multi-pulse, and it may also reduce the average impact life.
The average impact life of the ZnO varistor is also closely related to the microstructure parameters such as grain size. Only from the comprehensive analysis of multiple parameters can we reach a more scientific conclusion. The grain size of the ZnO varistor sample corresponding to the median life was statistically analyzed, as shown in Figure 8. It can be seen from the Figure that the number of the impact resistance of a ZnO varistor is inversely proportional to the grain size. The smaller the grain size, the larger the number of average impact life.

3.2. The Transformation of ZnO Varistor Grain Structure during Impulse

The five-pulse impact experiment of the sample was micro-analyzed. The SEM scanning image of the ZnO varistor before the impact is shown in Figure 9a, with a resolution of 30 µm. The SEM photos without aging before impact have regular cross-sections. The ZnO grains in the image are full with high density, more uniform distribution, larger particles and the average grain size is about 15–20 µm and the grain boundary with the grain is clearly distinguishable. The SEM scanning image of the ZnO varistor after the first impact is shown in Figure 9b. Compared with before the impact, the grain size after the first impact becomes smaller and the area of the white area increases. The difference in the microstructure of the ZnO material indicates that the multi-pulse lightning current will cause the ZnO grain structure to change after the first impact. It can be seen that the next impact of multiple pulses will affect the ZnO grain structure, which is obviously different from that under the single pulse. Under the single pulse, the structure of the grain boundary layer hardly changes after the first impact.
Under the continuous multi-pulse current, a large amount of heat was generated in the sample and could not be released in time. Some of the grains and grain boundaries with poor thermal conductivity were destroyed by the thermal effect of the impact current. They were transferred from the thermal equilibrium state to the non-thermal equilibrium status. After the third impact, a low-resistance region was locally formed in the varistor. In this region, a clear through-type crack channel appeared at the grain-to-grain boundary. As shown in Figure 10, the width of the crack channel was about 0.5 µm.
As the number of impacts increases, the current density in the low-resistance region will increase, resulting in a local temperature increase, which will cause the surface of the grain to melt through or merge between the grains and this thermal destruction process will be transmitted to the adjacent grain in the boundary–grain structure, resulting in a series of aging. The SEM image of the microstructure of the ZnO varistor in the later stages of impact is shown in Figure 11. It can be seen that the width of the crack gap continued to increase, the width capable of reaching about 2 µm, and the grain morphology changed, the contour of the grain edge being no longer clearly visible.
As the grain boundary is severely damaged, the performance of the ZnO varistor in the small- and medium-current region deteriorates. Under the microscope, the inner wall surface of the breakdown channel exhibits obvious melting characteristics. At the bottom of the breakdown channel, some molten craters produced by arc ablation can be seen. When impact damage leads to the serious failure of the ZnO material or even grain crushing, as shown in Figure 12a, the grains are completely crushed at this time, the entire grain boundary shows a molten state and the melting point of Bi2O3 in the grain boundary layer is generally 820 °C. It can be inferred that the temperature at the current breakdown channel of the ZnO varistor was quite high. Through the partial magnification observation, the image after 10,000 times magnification is shown in Figure 12b, and the state of the “cauliflower”-shaped crystal grains can be observed. This phenomenon has never been found in single pulse research.
The SEM image of the damage of the ZnO varistor under a single pulse impact is shown in Figure 13. It can be seen that under the single pulse impact, the main body of the micro-grain boundary changed a little, and many debris appeared. This situation is obviously different from the multi-pulse impact.

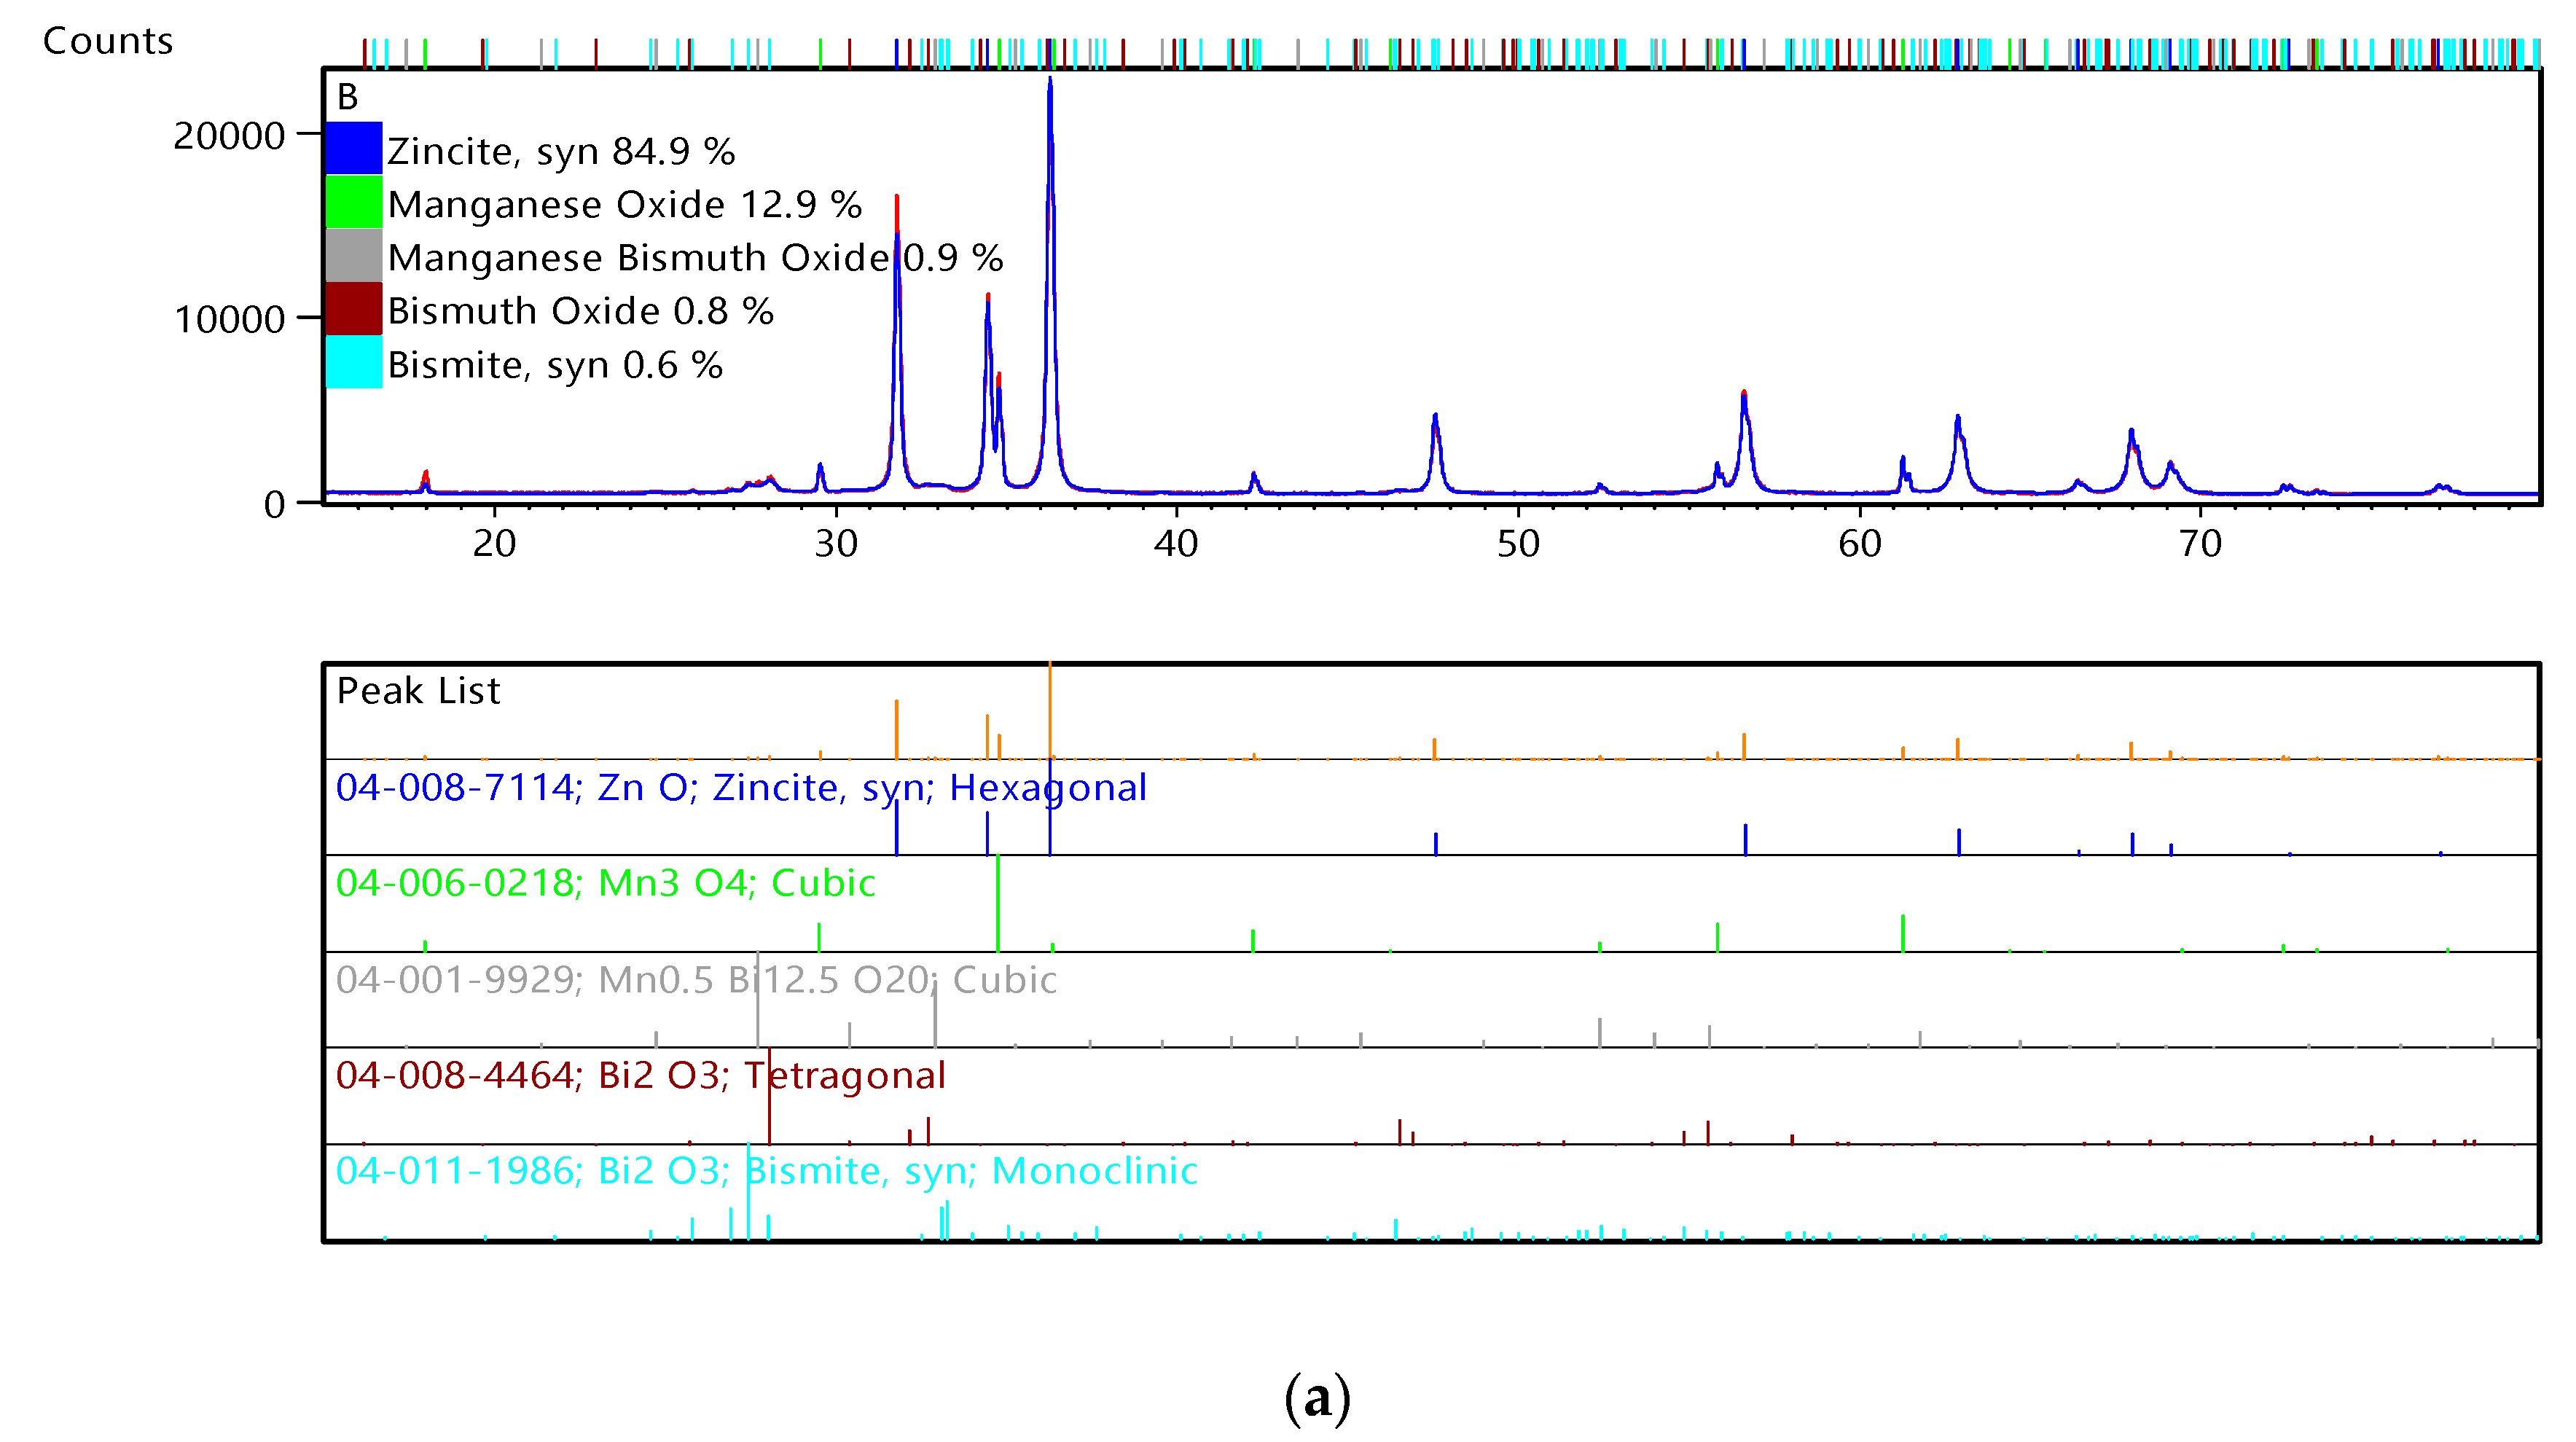
3.3. Variation of Crystalline Materials of ZnO Varistor

In order to study the crystalline phase change characteristics of a ZnO varistor after multi-pulse impact, an XRD diffractometer was used to perform the diffraction observation on the cross-section of the ZnO varistor before and after the impact.
As shown in Figure 14a, the XRD diffraction pattern of the ZnO varistor before the impact shows that the crystal phase composition of the ZnO varistor mainly including five parts: the zinc oxide red zinc ore phase, MnO cubic crystal phase, manganese bismuth oxidation material cubic crystal phase, Bi2O3 cubic crystal phase and the Bi2O3 tetragonal crystal phase.
Figure 14b shows the XRD diffraction pattern of the ZnO varistor after impact. By analyzing the two figures, it can be seen that the Bi element existed in the three crystal phases before the impact, the manganese bismuth oxide cubic crystal phase, Bi2O3 cubic crystal phase and the Bi2O3 tetragonal phase. The proportion of Bi in several crystal phases was 0.9%, 0.8% and 0.6%, respectively. After impact, the Bi element existed in two forms of the Bi2O3 cubic crystal phase and the Bi2O3 tetragonal crystal phase, and their proportions were 1.0% and 1.3%, respectively. The total amount of Bi elements was conserved, but the proportions in several crystal phases before and after the impact changed, indicating that the internal crystal phase structure of the ZnO varistor had undergone transformation.

3.4. Micro-Damage Mechanism Based on Linear Chain Theory

The microstructure of the ZnO varistor is composed of grains and discontinuous grain boundary layers surrounding the grains. The simplified microstructure and the equivalent circuit of the crystal unit are shown in Figure 15. The basic unit of the ZnO varistor is a hexagon. The volume represents an approximate polygon [17]. The simplified microstructure was mainly composed of ZnO grains and grain boundary layers. The equivalent circuit of the crystal unit was composed of grain resistance, grain boundary resistance and grain boundary capacitance. According to the theory of linear chain aging, the effect of capacitance can be ignored under the impact of a large current. The equivalent circuit can be regarded as a linear grain resistance Rg and a variable grain boundary resistance Rb connected in series. Rb is the part that produces the varistor effect. Multiple Rg and multiple Rb are connected in series to form a voltage-dependent chain. The ZnO varistor can be regarded as a network system consisting of n varistor chains connected in parallel in the conduction direction [18].
In this paper, a typical voltage-dependent chain was selected for the dynamic analysis of a multi-pulse current, supposing the time when the multi-pulse causes the destruction of the ZnO varistor is t0, and each variable grain boundary resistance Rb can withstand the energy limit of E0 during the entire impact process. After setting a certain time t1 between 0 and t0, taking a short time t near this point, then this short time current can be regarded as a constant current I. During the first impact, the resistance value of the voltage-dependent chain is the sum of all Rg and Rb. At this time, the voltage-dependent chains are not damaged, so the shunt is relatively uniform and is recorded as Ii. The energy sustained by the variable grain boundary resistance Rb of a unit cell on the chain is expressed by the Formula (1):
E 1 = I i 2 R b t i ( i = 1 , 2 n )
when E1 is less than E0, it will not cause the variable grain boundary resistance of the unit cell to melt through. Due to the accumulation of internal damage and the migration of ions, the unit cells are constantly damaged. During the last impact before damage, the crystal interface of the unit cell of each varistor chain was damaged, resulting in a decrease in the sum of the resistance values of Rg and Rb on each varistor chain. At the same time, due to the unevenness of ion migration and the nonuniformity of the micro-grain boundary layer, the damage of the interface of the ZnO grain unit cell on each voltage-dependent chain is different and the voltage-dependent chain damaged by perforation is the most severely damaged, that is, the voltage-dependent chain R g + R b is smaller than other chains, so the current Ij obtained by the voltage-dependent chain. When Ij is higher than Ii, the energy sustained by the R g + R b of a undamaged unit cell interface on the chain is expressed by Formula (2):
E 2 = I j 2 R b t i ( i = 1 , 2 n )
At this time, E2 is greater than E0, causing the unit cell variable grain boundary resistance to melt through.
The varistor voltage and leakage current of the ZnO varistor were measured during multiple impacts and the trend of the average level of the varistor voltage and leakage current with the number of impacts was plotted, as shown in Figure 16. It can be seen from Figure 16 that the average number of impacts that the ZnO varistor can withstand is 16, and the variation laws of the varistor voltage and leakage current of ZnO varistor samples of different individuals tend to be consistent with the leakage current increasing. Whilst the increase rate is relatively fast, the average growth rate can reach 0.66 µA/time. The varistor voltage decreases with the increase in the number of impacts. The varistor voltage drops after the first impact, with an average decrease of up to 6%. The intermediate changes show fluctuations. After the 16th impact, the varistor voltage drops sharply, and the average amplitude of the drop exceeds 10% of the original varistor voltage, and the ZnO varistor fails. After another impact, the ZnO varistor was damaged. The varistor voltage is proportional to the sum of the grain boundary resistances. From this, it can be seen that as the number of impact tests increases, the total resistance gradually decreases.
Therefore, theoretically, the destruction of the multi-pulse current is mainly due to the unevenness of the various parts of the varistor and the accumulation of heat, which causes the variable grain boundary resistance of the cell to melt through, resulting in the reduction of the total variable resistance of the ZnO varistor.

4. Conclusions

In this study, experiments were conducted to investigate the properties of ZnO varistors under multi-pulse currents:
(1)
The composition of the trace elements added in the grain boundary layer of the ZnO varistor and the average grain size were different, resulting in different impact resistance performances. Under multiple pulses, the addition of the trace elements did not improve the impact capability of the ZnO varistor. The number of the impact resistance of the ZnO varistor was inversely proportional to the grain size: the smaller the grain size, the greater the number of the impact resistance;
(2)
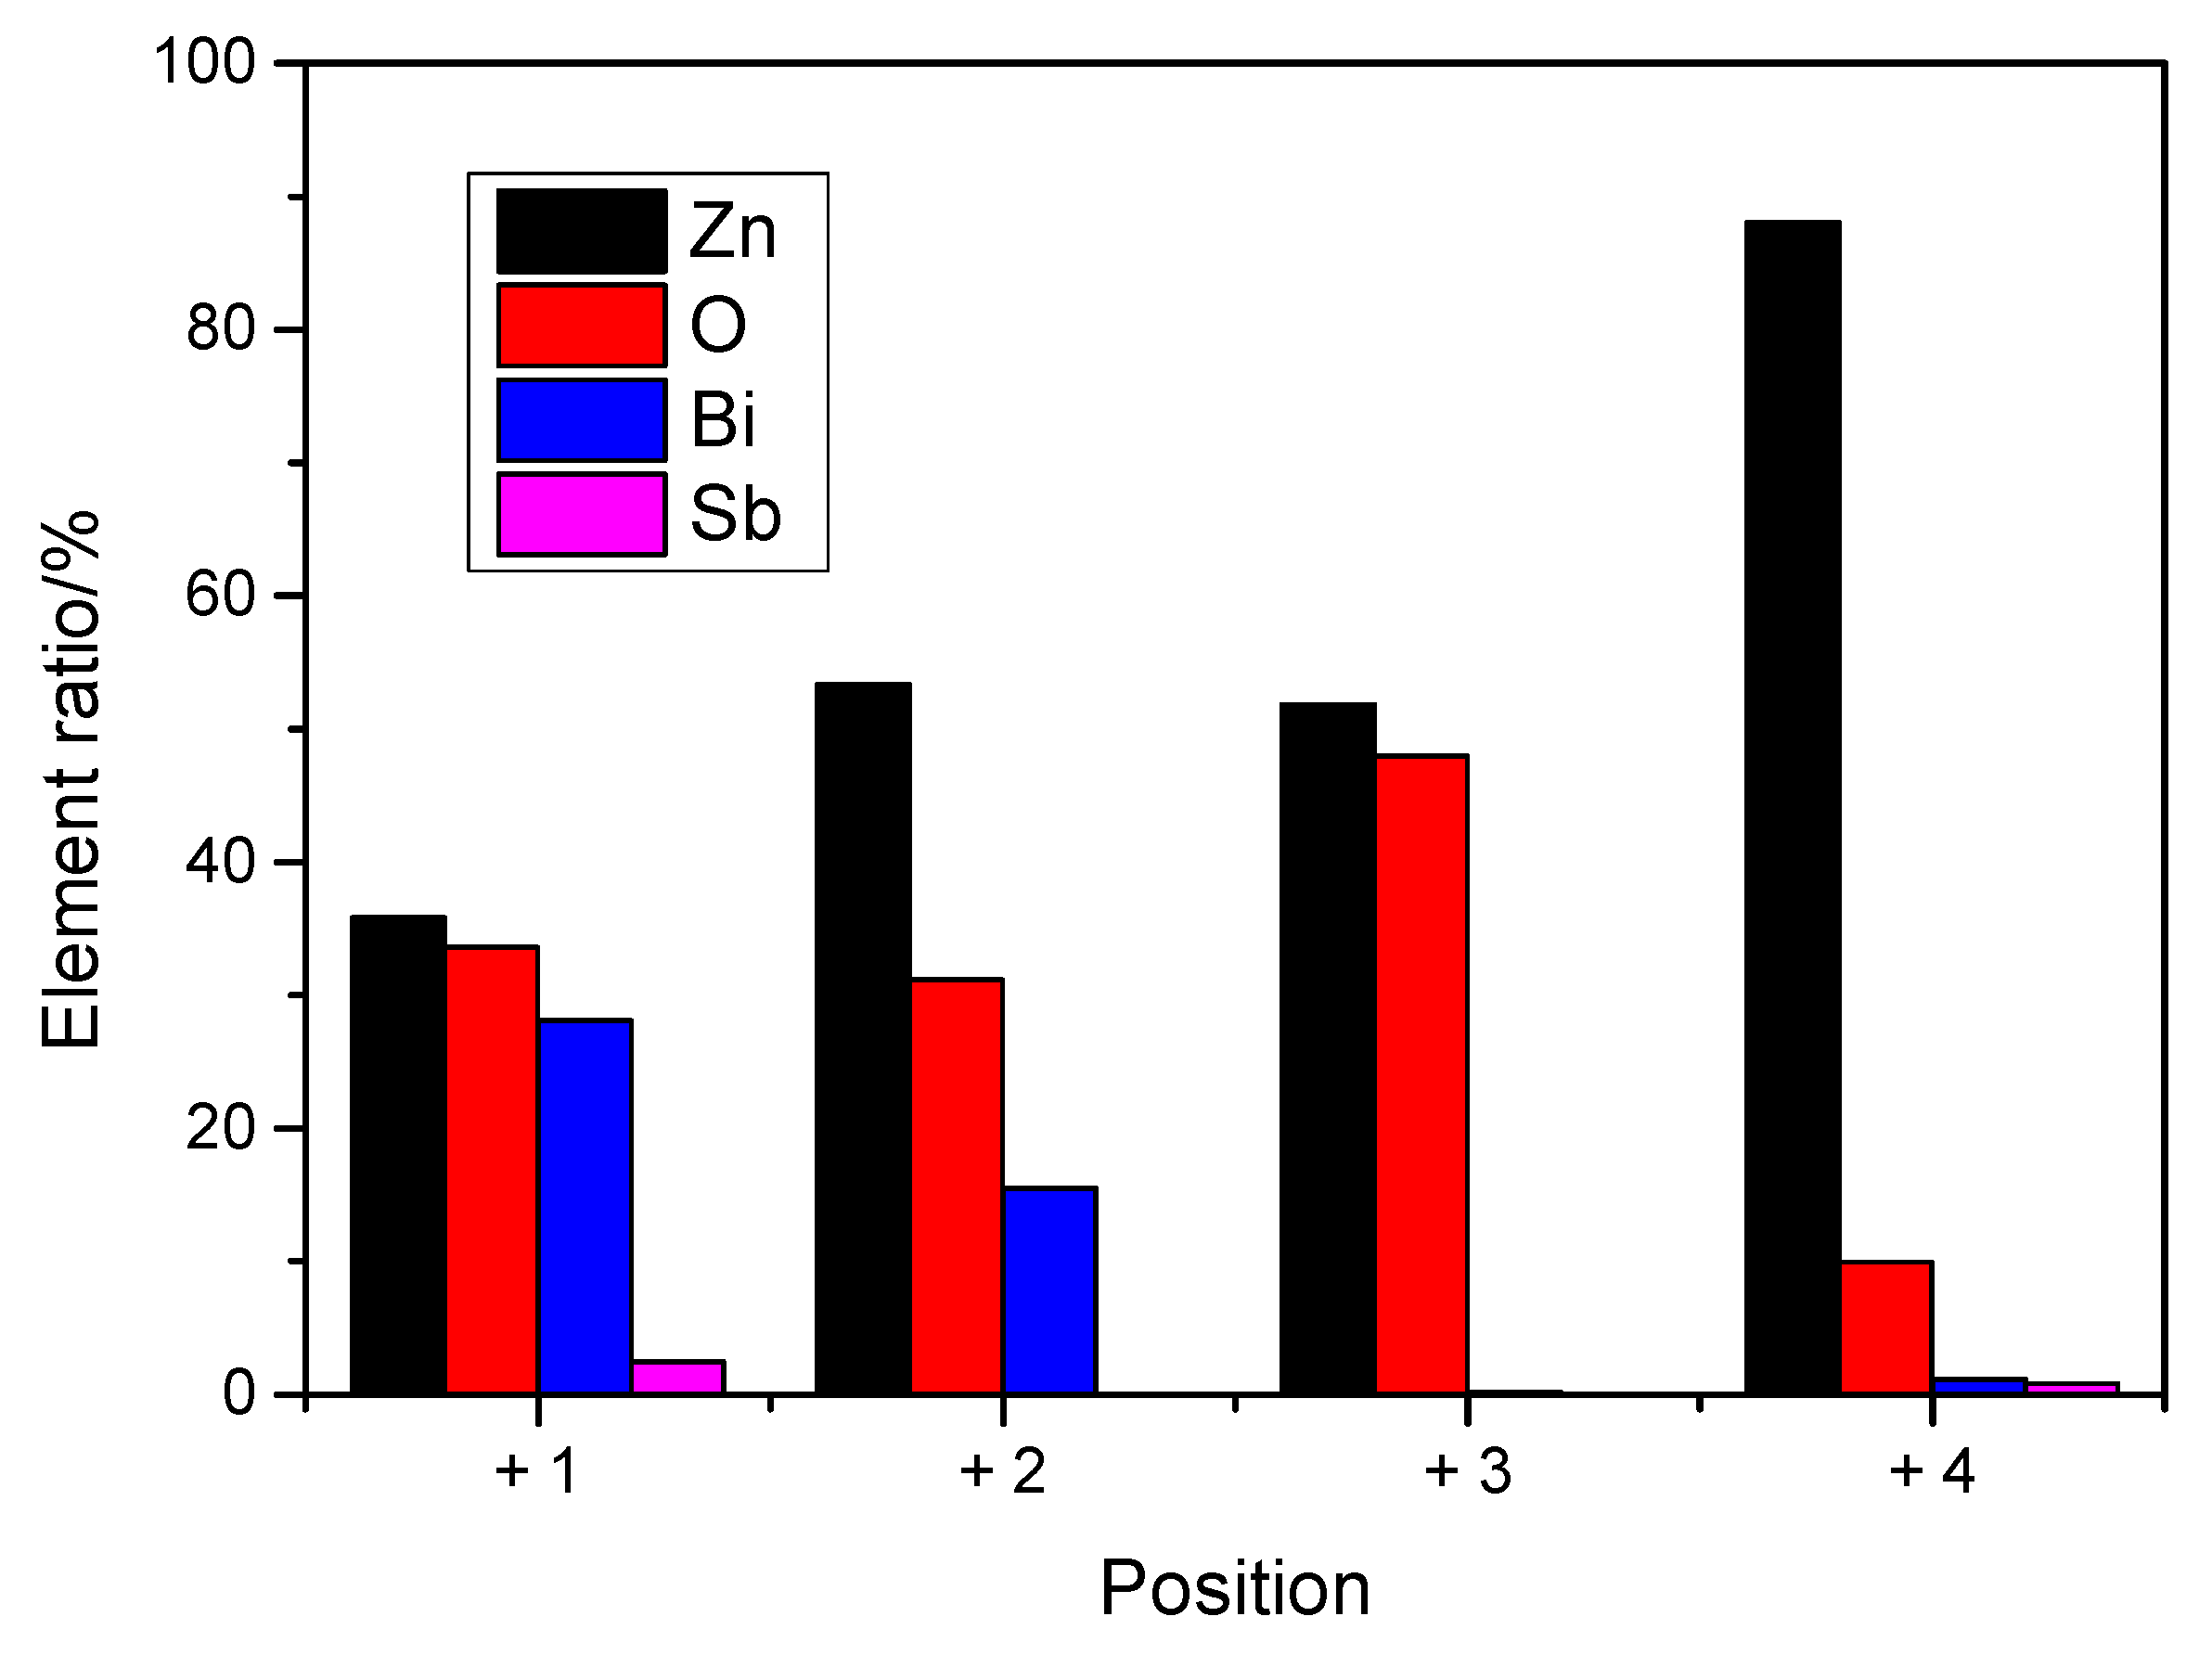
The multi-pulse lightning current caused the grain size of the ZnO varistor to become smaller and the grain boundary to grow and there was obvious crack channels. The gap width of the crack channel increased with the increase in the number of impacts. Metamorphosis occurred, which eventually led to the severe destruction or even crushing of the grains. The proportion of Bi in several crystal phases was changed. The high temperature of the injected current caused the internal crystal phase structure of the ZnO varistor to change;
(3)
The destruction of the multi-pulse current was mainly due to the unevenness of the various parts of the varistor and the accumulation of heat, which caused the unit cell variable grain boundary to melt through, resulting in a reduction in the overall resistance of the ZnO varistor.

Author Contributions

Investigation, R.C.; Formal analysis, H.X.; Data curation, C.L.; Writing—review & editing, D.L.; Writing—original draft, C.Z. All authors have read and agreed to the published version of the manuscript.

Funding

This research was funded by the National Nature Science Foundation of China grant number 61671248 and The APC was funded by Heilongjiang Natural Fund Joint Guidance Project(LH2019E120).

Conflicts of Interest

The authors declare no conflict of interest.

References

  1. Su, Y.; Sun, L.; Yang, Z. Research progress of low voltage varistor. Electron. Compon. Mater. 2010, 29, 74–78. [Google Scholar]
  2. Yang, Z.; Chen, L. Analysis and application of capacitance change during the deterioration of zinc oxide varistor. High Volt. Technol. 2010, 36, 2167–2172. [Google Scholar]
  3. Li, X.; Zhang, J.; Chen, L. Research on the design method of combined surge protector. Electr. Porcelain Arrester 2017, 4, 16–22. [Google Scholar]
  4. Yang, D.; Zhang, X.; Xu, Y. The failure mode and failure reason of SPD in low-voltage power supply system. Electr. Porcelain Arrester 2007, 4, 43–46. [Google Scholar]
  5. Protection Against Lightning—Part 1: General Principles; IEC 62305-1; International Electrotechnical Commission: Geneva, Switzerland, 2010.
  6. Heidler, F.; Flisowski, Z.; Zischank, W.; Bouquegneau, C.; Mazzetti, C. Parameters of lightning current given in IEC 62305-background, experiments and outlook. In Proceedings of the 2008 ICLP, Uppsala, Sweden, 23–26 June 2008. [Google Scholar]
  7. Yang, S.; Chen, S.; Zhang, Y. Characteristics analysis of the induced overcurrent generated by close triggered lightning on the overhead transmission power line. J. Trop. Meteorol. 2010, 16, 59–65. [Google Scholar]
  8. Yaacob, M.M.; Ghani, R.A. Voltage-current characteristics of metal oxide varistors for low voltage telephone lightning protector under the application of multiple lightning impulse. In Proceedings of the Conference Record of the 1998 IEEE International Symposium on Electrical Insulation, Arlington, VA, USA, 7–10 June 1998. [Google Scholar]
  9. Vahidi, B.; Cornick, K.; Greaves, D. Effects of multiple stroke on ZnO surge arresters. In Proceedings of the 24th International Conference on Lightning Protection, Birmingham, UK, 14–18 September 1998; pp. 960–963. [Google Scholar]
  10. Heinrich, C.; Wagner, S.; Richter, B.; Kalkner, W. Multipulse tests on surge arresters for medium and low voltage systems. In Proceedings of the 24th International Conference on Lightning Protection, Birmingham, UK, 14–18 September 1998; pp. 790–794. [Google Scholar]
  11. Haryono, T.; Sirait, K.T.; Tumiran, K. The damage of ZnO arrester block due to multiple impulse currents. Telkomnika 2011, 9, 171–182. [Google Scholar] [CrossRef] [Green Version]
  12. Haryono, T.; Sirait, K.T.; Tumiran, K. Effect of multiple lightning strikes on the performance of ZnO lightning arrester block. High Volt. Eng. 2011, 37, 2763–2771. [Google Scholar]
  13. Lou, J. Research on the Destruction Mechanism of MOV Based on Microstructure under Different Impact Conditions. Master’s Thesis, Nanjing University of Information Science and Technology, Nanjing, China, 2016. [Google Scholar]
  14. Tsuboi, T.; Takami, J.; Okabe, S. Energy absorption capacity of a 500 kV surge arrester for direct and multiple lightning strokes. IEEE Trans. Dielectr. Electr. Insul. 2014, 22, 916–924. [Google Scholar] [CrossRef]
  15. Zhang, Y.; Lv, W.; Chen, S. Ten-year progress of Guangdong field lightning comprehensive observation experiment. J. Meteorol. 2016, 74, 655–671. [Google Scholar]
  16. Zhang, Y.; Lv, W.; Zhang, Y. Observation and characteristic analysis of the process of ground flashover in Guangzhou area. High Volt. Technol. 2013, 39, 383–392. [Google Scholar]
  17. Xu, L.; Yang, Z.; You, Z. Research on dynamic characteristics of zinc oxide varistor before and after deterioration. Electr. Porcelain Arrester 2014, 4, 132–138. [Google Scholar]
  18. Lee, B.H.; Kang, S.M. Properties of ZnO varistor blocks under multiple lightning impulse voltages. Curr. Appl. Phys. 1997, 12, 1168–1175. [Google Scholar] [CrossRef]
Figure 1. A 20-pulse surge current generator.
Energies 13 02620 g001
Figure 2. A 5-pulse surge current waveform.
Energies 13 02620 g002
Figure 3. Schematic diagram of the multi-pulse test process.
Energies 13 02620 g003
Figure 4. SEM image of the ZnO varistor B2 (5000 times magnification).
Energies 13 02620 g004
Figure 5. Element ratio of the EDS spectrum analysis of the B2 sample at different positions.
Energies 13 02620 g005
Figure 6. EDS spectroscopic analysis of the +1 position of the ZnO varistor B2 sample.
Energies 13 02620 g006
Figure 7. The average impact life of different kinds of ZnO varistors and the number of corresponding trace elements.
Energies 13 02620 g007
Figure 8. Average impact life and the corresponding grain size of different kinds of ZnO varistors.
Energies 13 02620 g008
Figure 9. SEM scanning image of the ZnO varistor (a) before the impact (b) after the first impact.
Energies 13 02620 g009
Figure 10. SEM image of the microstructure of the ZnO varistor after the third impact.
Energies 13 02620 g010
Figure 11. SEM image of the microstructure of the ZnO varistor in the later stages of the impact: (a) 2000 times magnification; and (b) 10,000 times magnification.
Energies 13 02620 g011
Figure 12. SEM image of the microstructure of the ZnO varistor damaged after the multi-pulse currents: (a) 2000 times magnification; and (b) 10,000 times magnification.
Energies 13 02620 g012
Figure 13. SEM image of the microstructure of the ZnO varistor damaged after single pulse: (a) 2000 times magnification; and (b) 10,000 times magnification.
Energies 13 02620 g013
Figure 14. XRD diffraction results of the ZnO varistor under the multi-pulse current: (a) before the impact; and (b) after the impact.
Energies 13 02620 g014aEnergies 13 02620 g014b
Figure 15. Simplified microstructure of the ZnO varistor and the equivalent circuit of the crystal unit.
Energies 13 02620 g015
Figure 16. Variation trend of the varistor voltage and the leakage current of the ZnO varistor under 5 pulses.
Energies 13 02620 g016
Table 1. Element distribution of the B2 varistor SEM image at different positions.
Position/ElementZn (%)O (%)Bi (%)Sb (%)
+135.8533.5928.072.48
+253.3431.1415.510
+351.8747.940.190
+488.039.981.130.86
Table 2. Impact life of the different samples.
Sample Serial NumberA1A2A3A4A5A6A7A8A9
Impact Life151615161615161617
Sample Serial NumberB1B2B3B4B5B6B7B8B9
Impact Life676787778
Sample Serial NumberC1C2C3C4C5C6C7C8C9
Impact Life344354543

