Article

Comparative Study of the Heat and Mass Transfer Characteristics between Counter-Flow and Cross-Flow Heat Source Towers

1
School of Civil Engineering, Chongqing University, Chongqing 400044, China
2
Commission for Discipline Inspection of Nankai District, Tianjin 300100, China
*
Author to whom correspondence should be addressed.
Energies 2020, 13(11), 2674; https://doi.org/10.3390/en13112674 (registering DOI)
Submission received: 23 March 2020 / Revised: 15 May 2020 / Accepted: 20 May 2020 / Published: 26 May 2020
(This article belongs to the Section G: Energy and Buildings)

Abstract

:
The heat source tower (HST), as a cleaner energy production, which can absorb the low-grade energy from ambient air to drive the heat pump unit without emissions has attracted more and more interest. In addition, HST has excellent economic applicability by using cooling tower equipment, which was idle in winter. However, there are few studies on comparative analysis of thermal behavior between counter-flow and cross-flow HST. A mathematical model suitable for both HST types was developed to identify the performance discrepancies between them. Then a parametric study was carried out in order to investigate the impact of solution and air as well as packing material properties on energy transfer of HSTs. Finally, the characteristics of solution dilution and dehumidification were investigated. As the inlet solution temperature increases, increases first, then decreases gradually, but a transition point occurs in the solution at −5 °C. Moreover, the transition section of moisture transfer direction for counter-flow HST was located in the 0.78 m and 0.26–1.56 m of packing material height, under the condition that the air relative humidity was 50%. In summary, this work intuitively indicates the thermal performance difference between counter-flow and cross-flow HST, also could assist the selection of proper operating conditions in HSTs.

Graphical Abstract

1. Introduction

A heat source tower (HST), also known as a reversibly used cooling tower (RUCT) [1,2,3], absorbs low-grade energy from the air and supplies the heat to a building. It is generally believed that the heating tower is applicable in multiple countries and regions, especially for areas with high outdoor temperatures and humidity [4]. HST has several advantages compared with traditional heating units. One of the advantages is that HST can absorb low-grade energy from the atmosphere. In addition, the heat pump unit can drive low-level energy, which is more environmentally friendly. Furthermore, the conventional heating unit produces a series of toxic and harmful substances through combustion, which seriously affects the natural environment [5]. Hence, recent concerns about environmental pollution have greatly increased the attention paid to cleaner heating units like HST.
In fact, the thermal behavior discrepancies between cooling towers and HSTs are on account of several aspects. First, the direction of energy transfer is reversed. A cooling tower removes the excess heat from a building during the summer, while on the contrary, heat is applied to meet the user demand in winter [6]. The thermal behavior of the tower depends on different air properties, which are determined by the season. Second, prior studies have revealed that the thermal performance of HSTs is quite different from that of cooling towers [7,8], mainly caused by different types of circulating heat transfer media [9,10]. Third, latent heat transfer (LHT) exists in HSTs but not in cooling towers. Hence, there remains a need for investigation of the thermal behavior on HSTs. Zhang et al. [11] developed an optimization index of the mismatch coefficient γ, which can measure the influence of inlet parameters on the solution dehumidification module, and it also used for fluid flow channel and thermal performance optimization. Three typical flow channels were compared, and the results showed that the heating supply temperature can be decreased by 15 °C through optimization. System performance optimization studies of HSTs were also conducted by Zhang et al. [12], who experimentally and theoretically discussed the influence of mass transfer unit number NTUm on the thermal performance of a HST, and when the NTUm taken as 4, the optimal value of HST energy transfer is obtained. Further, the HST system COP can be increased by using an inter-stage cycle value under 3.5. Cui and Li [2,3], carried out some studies on spray HST, where the thermal behavior of the HST was studied comparing between downward spray and upward spray through parameter analysis. The results pointed out that downward gas-flow and upward solution-flow are beneficial to enhance the energy transfer, moreover, smaller droplet diameters have a significant effect on the thermal performance of a HST. At the same time, micro-scale heat transfer also has a significant impact on the heat transfer performance of HSTs. Many numerical studies have shown that wettability of the solid surface [13,14] and nature roughness of solid surface [15] have a significant effect on the heat flux of the system.
Tan and Deng’s research [16] was based on cooling towers, but it provides a fundamental basis for studying the thermal performance of HSTs, and a mathematical model suitable for HST was proposed. However, the cross-section properties cannot be calculated through this model. Besides, this model was only suitable for calculating counter-flow HSTs. In order to address this limitation, Tan and Deng [9] established the HST model, but like Huang et al. [17], this model does not consider Lewis numbers. Further, a mathematical model coupling Lewis number and energy transfer was proposed by Zhang et al. [6]. Since Lewis number is considered, this model is more accurate. Furthermore, many studies were based on this model. Wang et al. [18] experimentally determined the influence of air humidity on the energy transfer of HST, showing that the ε-NTU model is not suitable for extremely high air humidity conditions by increasing the air humidity ratio from 20 g·kg−1 to 160 g·kg−1 gradually. Song et al. [19] performed some optimization research based on NTUm under the above assumption. Prior studies have mainly focused on counter-flow HST or dehumidification modules, in order to better characterize the cross-flow HST.
Some studies were conducted on cross-flow HSTs. Wen et al. [20] numerically investigated the impact of air and solution properties on the energy transfer of a cross-flow HST. The results showed that the air-flow and solution-flow play a significant role in the energy transfer increase. Meanwhile, the effect of solution and air temperature on heat transfer are slight. Huang et al. [17] took glycol as a circulating heat transfer medium to experimentally study the system behavior and energy transfer characteristics without consideration of the Lewis number, and correlation expressions were presented using the solution mass flow and air mass flow. Given the above studies, there were some studies comparing the thermal behavior between counter-flow and cross-flow HSTs and the Lewis number effect. Huang et al. [21], identified the evolution of sensible heat and latent heat transfer characteristics with the gas-liquid ratio under low-temperature conditions. Their results indicated that HST system performance can be improved by adjusting the operating parameters. Liang et al. [22] claimed that the air inlet temperature has a greater effect on the solution regeneration rate of HSTs. Other studies [23] have found that HSTs have the risk of freezing during winter, which was caused by the solution, but there is few studies on the dilution and humidification characteristics of the solution in HSTs. Therefore, a new comparative discussion about the thermal behavior in counter-flow and cross-flow HSTs is necessary, including solution dilution and the humidification characteristics of the packing material.
The aim of our research is to identify the influence of air and solutions as well as packing material properties on the thermal behavior within HST. A mathematical model validated by experimental data was developed to predict the latent and sensible heat transfer of a HST. The influence of the properties on sensible and latent heat transfer was examined. Additionally, solution dilution and dehumidification characteristics were studied. This research could assist the selection of proper operating conditions for existing HSTs.

2. Theoretical Model

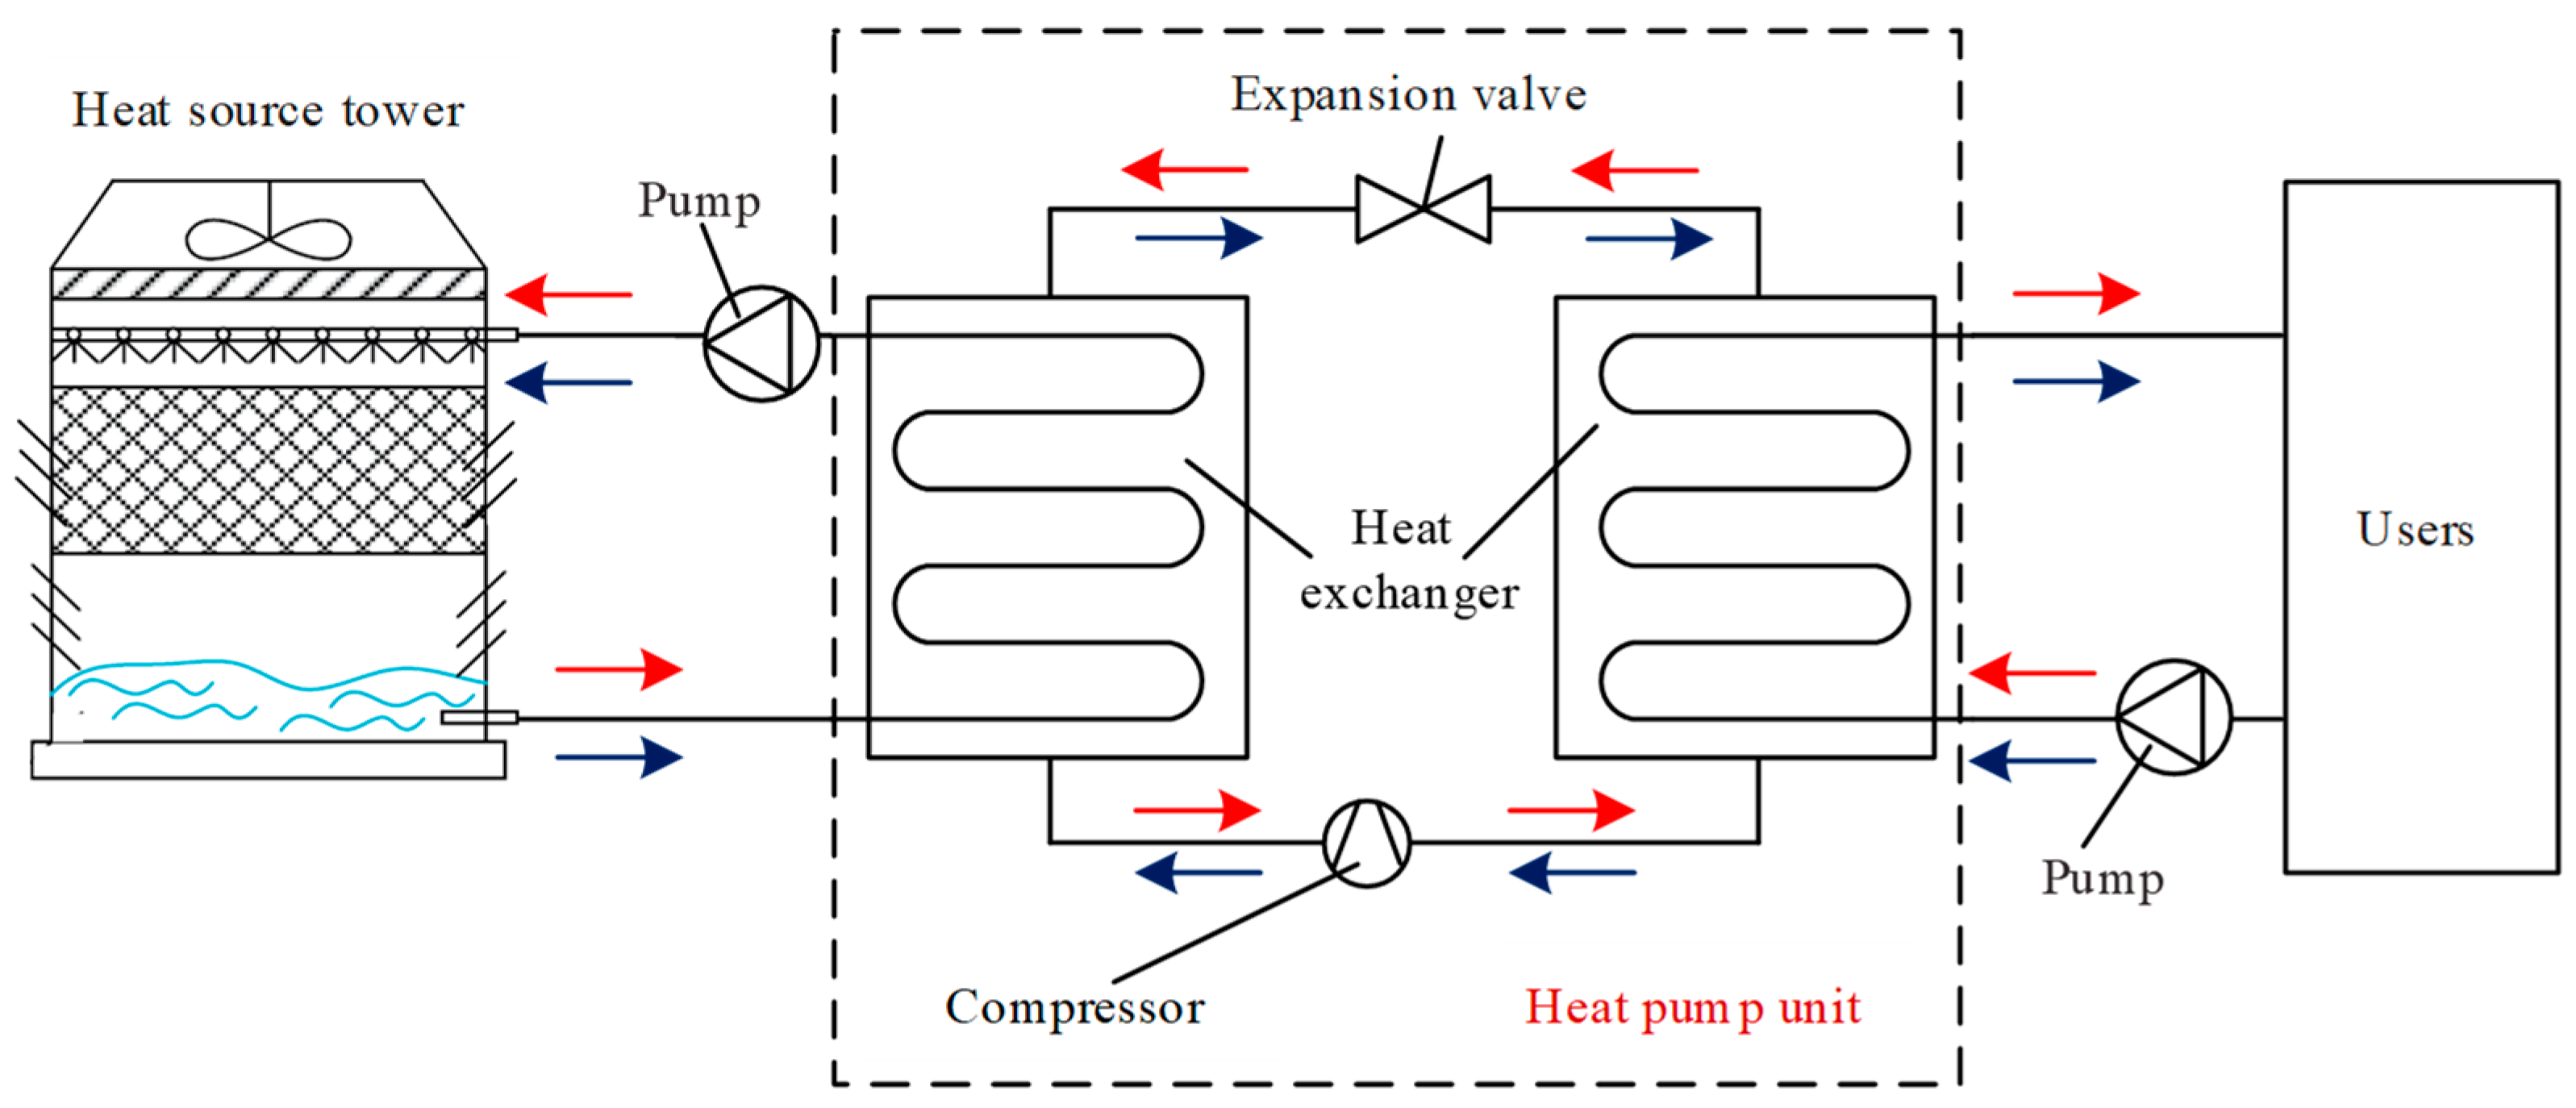
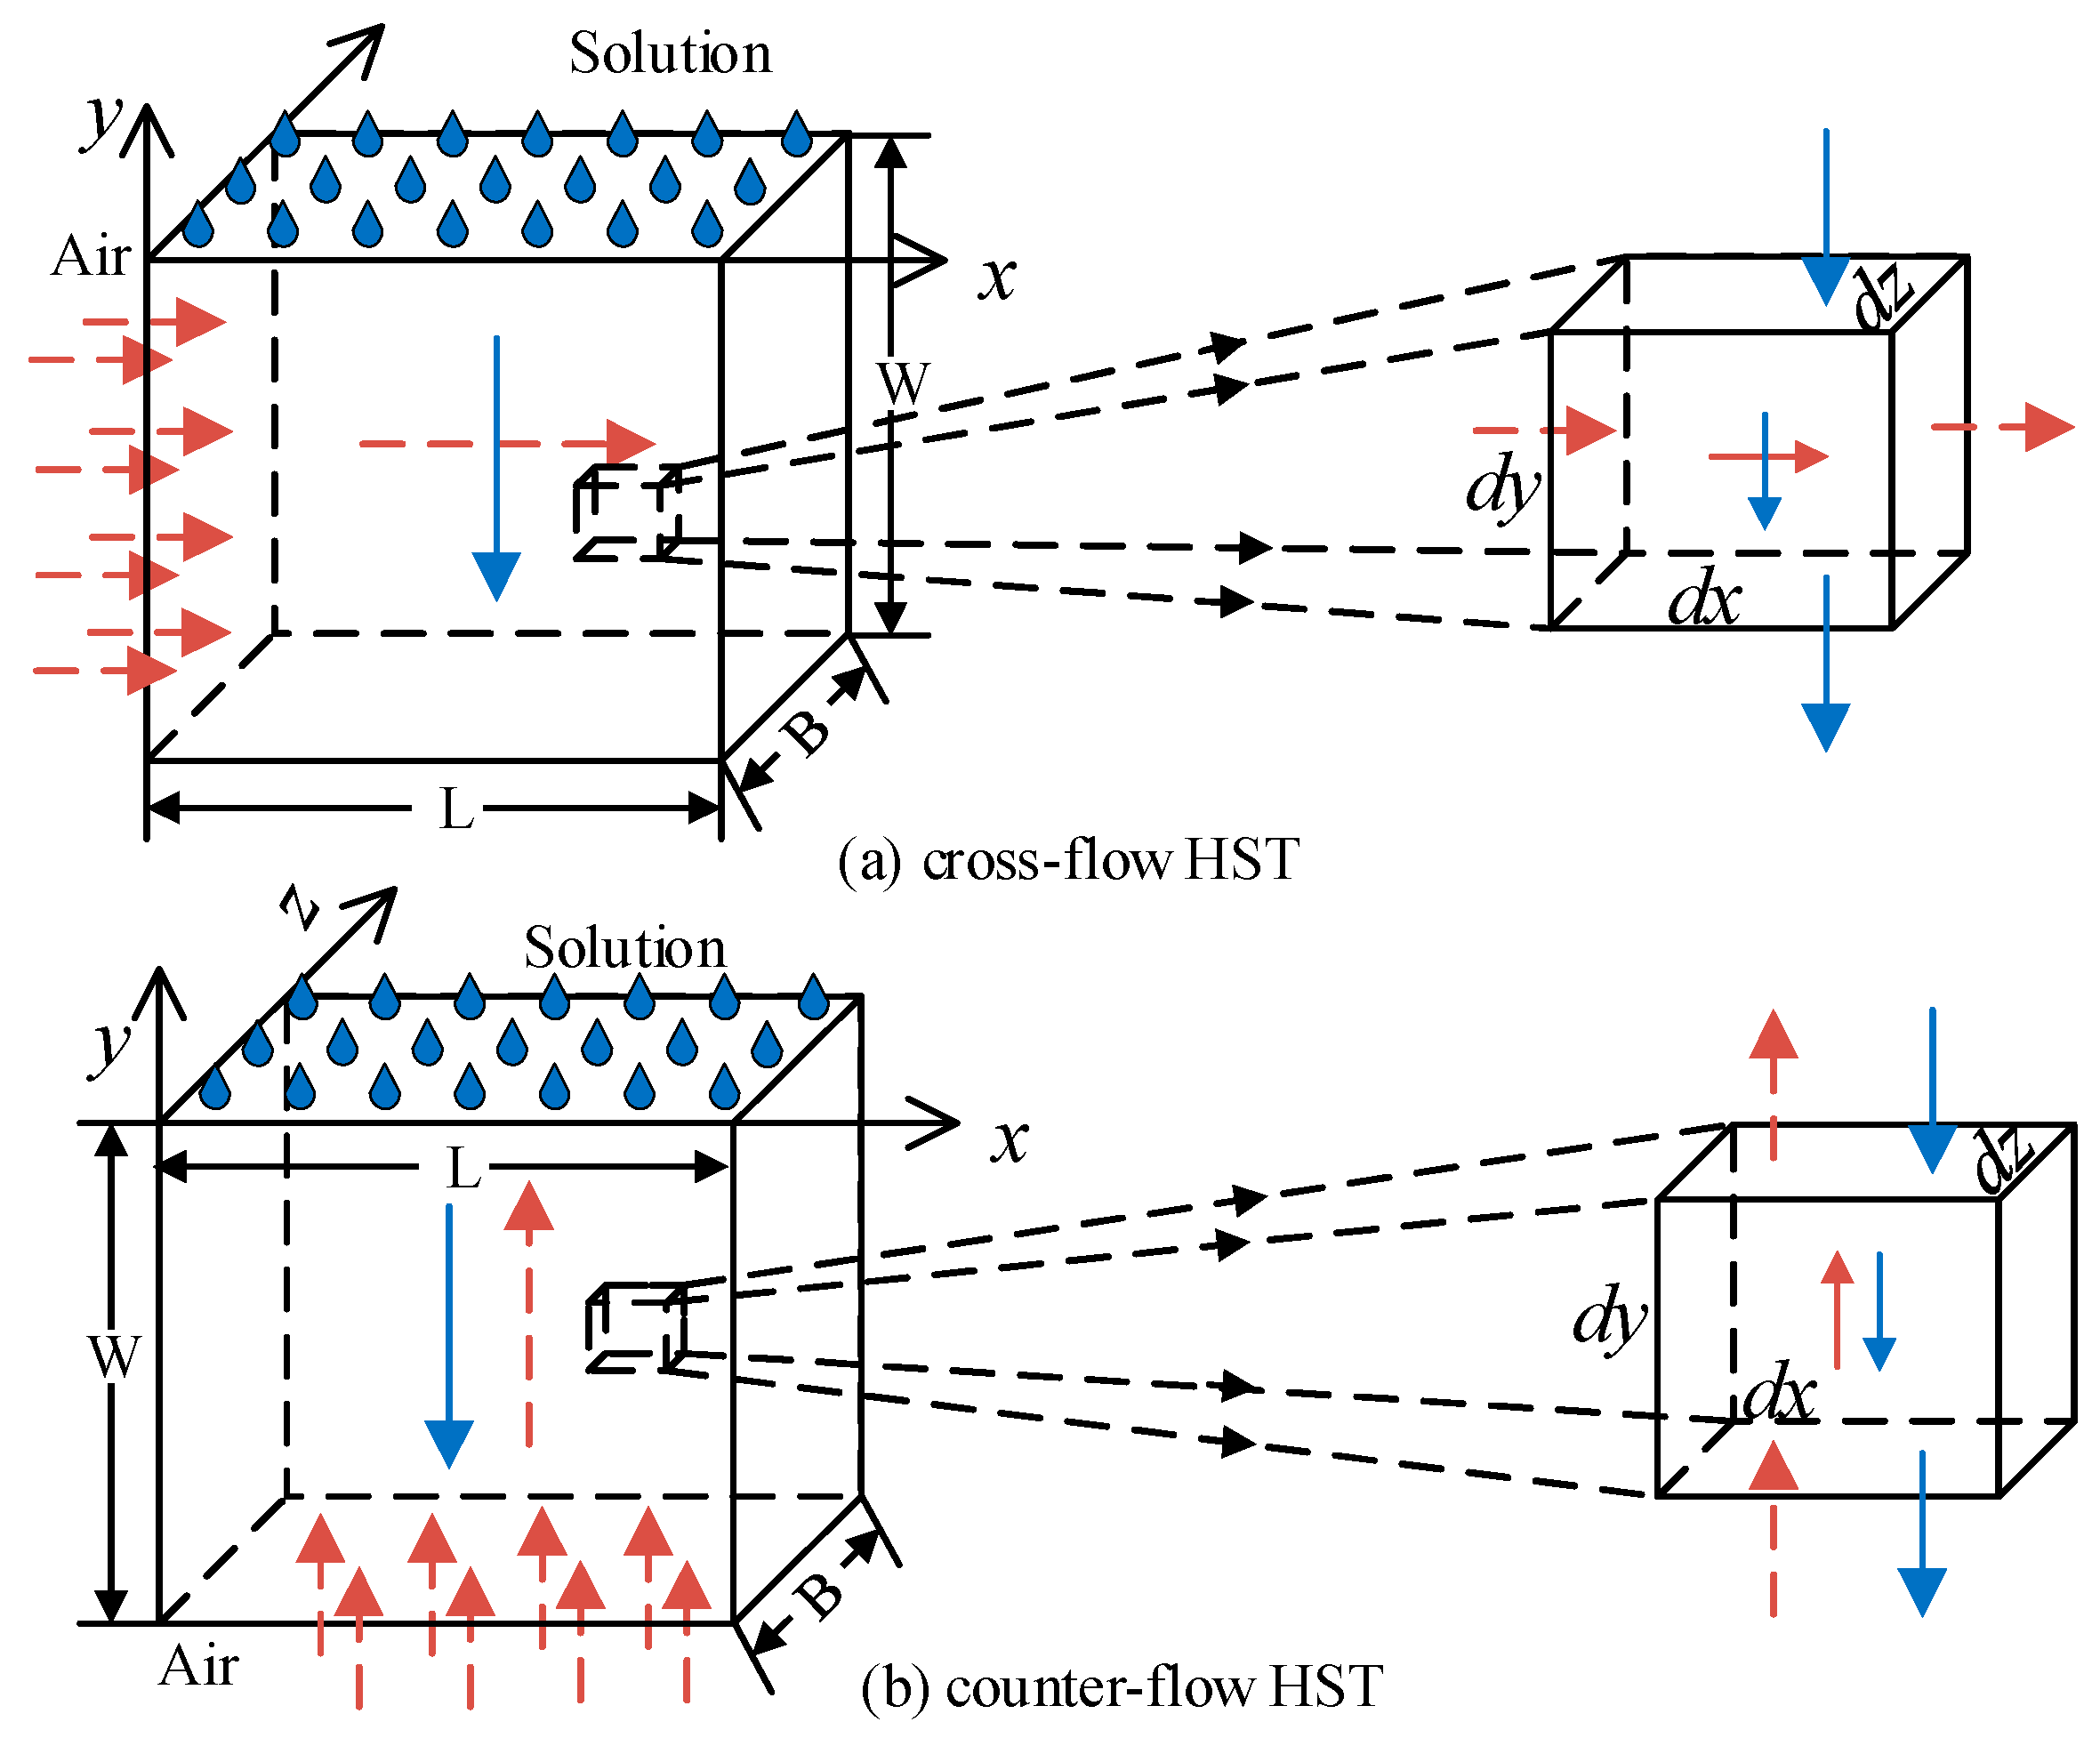
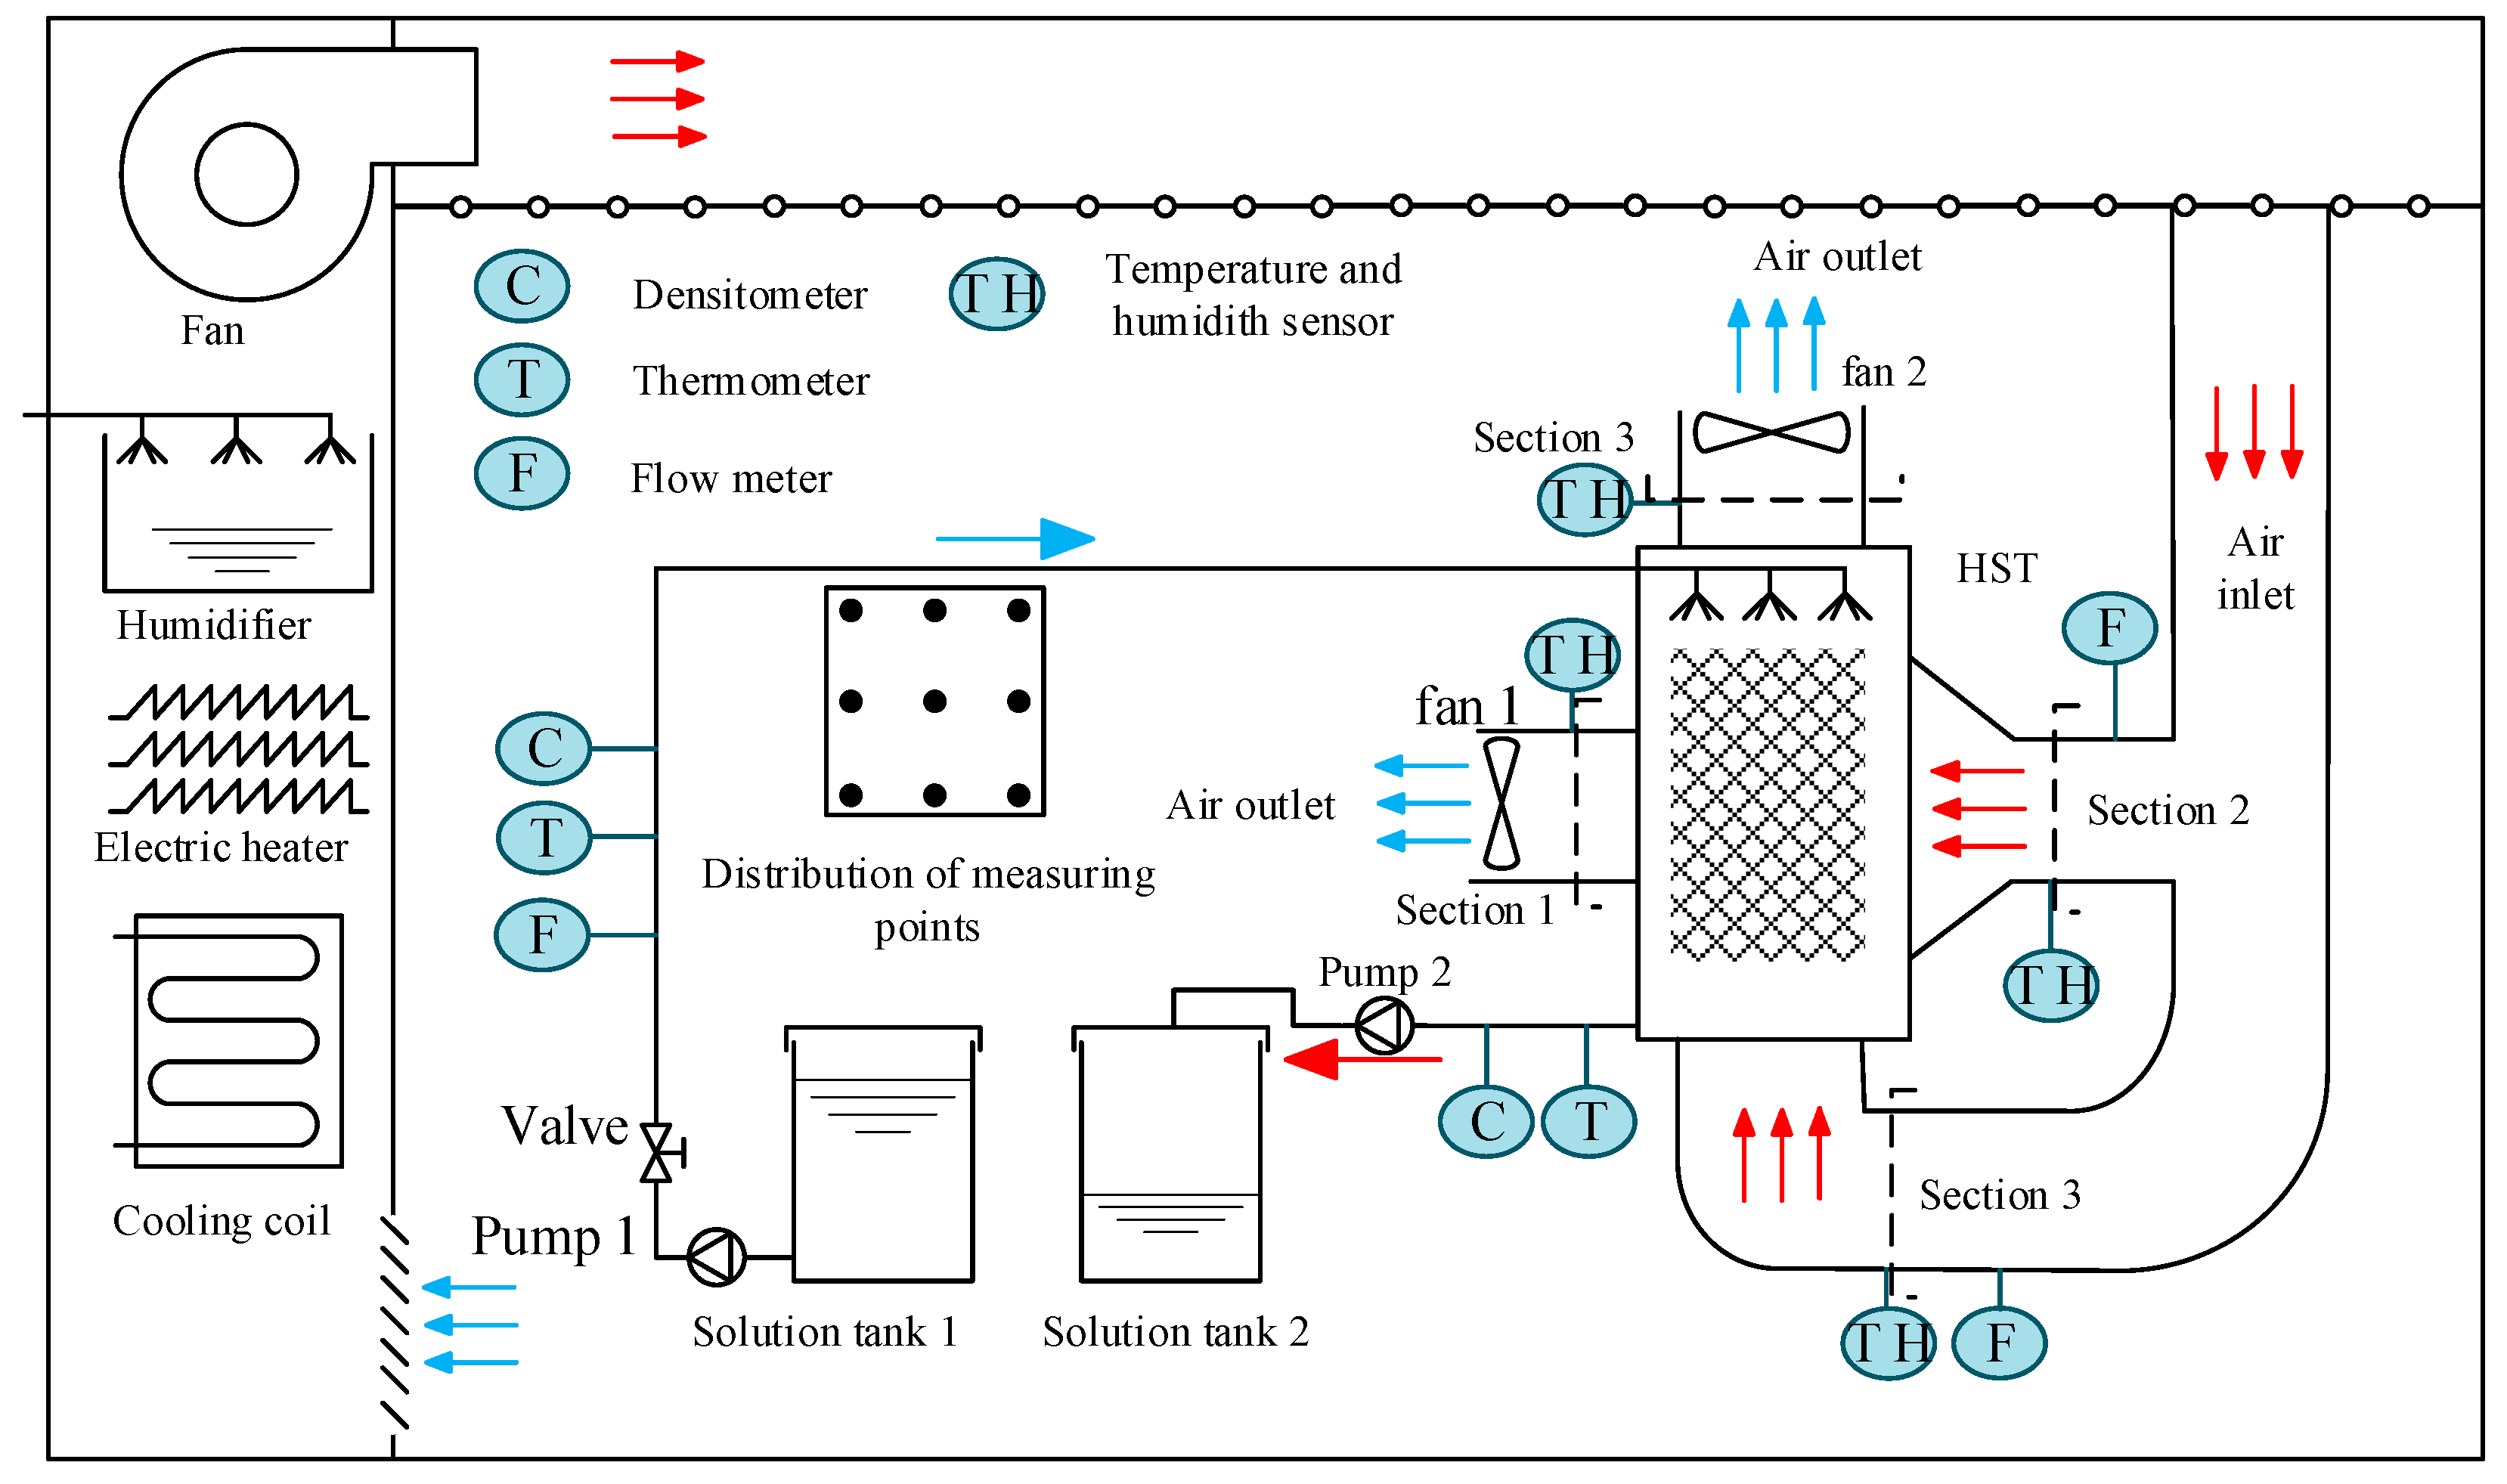
2.1. Description of the Two Types of HST

The schematic diagrams of the adiabatic cross-flow HST module and the counter-flow HST module are shown in Figure 1, respectively. The solutions are sprayed uniformly onto the packing materias from the top surface to the bottom of the HST by the nozzles. According to the air flow direction in the HST, HSTs are divided into two types. When air enters from the side and flows out from the opposite side it is a cross-flow HST, and if air enters from the bottom side and out of the top side it is a counter-flow HST. The energy transfer arises on the packing material between the solution and the air. When the HST is operating in summer, the air flows through the material in the HST, where the air is humidified and heated, so that the enthalpy of the air increases while the solution temperature decreases.
When the HST is operating in winter, the circulating heat transfer medium is replaced by an antifreeze solution with a freezing point below 0 °C. Unlike a HST running in the summer, the air will be cooled and dehumidified, and the solution concentration is diluted while the temperature of the solution rises.
Figure 2 illustrates the operating mode of the HST system. The red arrow highlights the heating condition and the blue arrow outlines the cooling condition. When the HST system is operating during the summer, the cooling of the circulating heat transfer medium was carried out by direct evaporation. After pumping the cooling water to the condenser, the heat released by the heat transfer circulating medium is absorbed by the refrigerant in the compressor, and then the circulating cooling water flows out of the condenser.
The HST system collects low-grade heat energy in the outdoor air in winter, the circulating heat transfer medium is an aqueous solution of calcium chloride. The antifreeze solution flows out of the heat pump unit and then flows into the HST. After absorbing heat from the air, the solution enters the evaporator through the water pump, the refrigerant gains heat through the phase change process, and the circulating process occurs again to transfer the heat.

2.2. Establishment of Mathematical Equations

A mathematical model was developed to investigate the thermal performances of cross-flow and counter-flow HSTs. The major simplifications and assumptions for the mathematical model are as follows:
(1)
The specific heat and density are constant with temperature [12,20];
(2)
The heat and mass exchange through the tower surface to the environment are negligible;
(3)
Heat and mass transfer perpendicular to the flow direction is ignored;
(4)
The thermal resistance between the solution and the air occurs on the airside;
(5)
The properties of the packing material are uniform and stable;
(6)
There is no loss of solute during HST operation;
(7)
Both inlet air and solution flow rates are steady and uniform.
Based on the above assumptions, the cross-flow HST can be simplified into a two-dimensional model, and the counter-flow HST can be simplified into a one-dimensional model. Because both the inlet air and solution flow rates are steady and uniform, any one of the control volumes can be selected for analysis throughout the entire model. The control volumes of a cross-flow and counter-flow HST are shown in Figure 3.

2.2.1. Development of Governing Equations

The control volume is shown in Figure 3. Every control volume follows the conservation of energy. Therefore, for any of the control volumes, there are the following rules: The value of variables that fluids enter the control volume + the increment of variables produced by the interaction between control volume and fluids = the value of variables that fluids leave the control volume + the cumulative value of variables in the control volume. The packing material is thermally insulated and has no internal heat source inside, and then the energy is completely released between the air and the solution. Therefore, the energy generated and accumulated by the control volume is none [6].
Extracted to the conservation of energy, the enthalpy of the inlet and outlet should be equal, thus, which can be written as Equation (1):
H o H i = 0
The input enthalpy of the control volume can be written as below:
H i = m a H a W B d y d z d x + m s H s L W d x d z d y
The output enthalpy of the control volume can be written as Equation (3):
H o = ( m a H a W B + m a H a W B x ) d y d z d x + ( m s H s L W + m s H s L W y ) d x d z d y
Combining Equations (2) and (3), the energy conservation equation of the control volume can be rewritten as Equation (4):
1 B · x ( m a H a ) + 1 L · y ( m s H s ) = 0
The mass of water brought into the control volume by air and solution is equal to that of water brought out of the control volume by air and solution. Similarly, the water vapor mass balance equation can be written as Equation (5):
m s ω s L W d x d z d y ( ( m a ω a W B + m a ω a W B x ) d y d z d x + ( m s ω s L W + m s ω s L W y ) d x d z d y ) = 0
Simplifying Equation (5) we get Equation (6):
1 B x ( m a ω a ) + 1 L · m s y = 0
It is assumed that the solute of the antifreeze solution does not change, that is, the solute has no loss [24], then Equation (7) can be written as:
d ( m s ζ ) = 0
where ζ is the solute mass fraction of the antifreeze solution, %.
As can be seen from above, the properties of the packing material are uniform and stable. Assume that A is packing material heat and mass transfer surface. According to the literature, the value can be calculated as Equation (8):
A = β L W B D
where β is the packing material porosity, it is the ratio of the void volume of the total volume. D is the packing material spacing, m. During the energy transfer process, the energy transfer of the air is caused by two effects. On the one hand, convective heat transfer occurs between air and solution. On the other hand, the water vapor undergoes a phase change process, the air condenses and liquefies and rapidly releases the latent heat of condensation.
So, the energy transfer equation of the control volume can be written as Equation (9):
m a H a W B x d x d y d z = h c A L W B ( T s T a ) d x d y d z + r m a ω a W B x d x d y d z
Simplifying Equation (9) we get Equation (10):
( m a H a ) x = h c A L ( T s T a ) + r ( m a ω a ) x
Similarly, during the mass transfer process, the difference in air humidity ratio is due to the convective mass transfer process, so the control volume moisture transfer equation can be written as Equation (11):
m a ω a W B x d y d z d x = h m A L W B ( ω s ω a ) d x d y d z
Simplifying Equation (11) we get Equation (12):
( m a ω a ) x = h m A L ( ω s ω a )
The enthalpy difference between moist air can be written as Equation (13):
c p ( T s T a ) + r ( ω s ω a ) = H s H a
where Cp is specific heat of air (kJ·kg−1·K−1) and r is water latent heat of condensation at 0 °C (kJ·kg−1·K−1). The mass transfer unit number NTUm is a dimensionless number that measures the heat transfer capacity within different fluids. The Lewis number Le representing the ratio of thermal diffusion coefficient to the mass diffusion coefficient. It describes the extent of heat transfer and mass transfer during convective heat transfer. The NTUm and the Le can be written as Equations (14) and (15):
h m A m a = N T U m
L e = h c h m c p
The transfer coefficient varies linearly. Cp represents the specific heat of air (kJ·kg−1·K−1), hm is the evaporation coefficient. Combined with Equations (12)–(17) this becomes:
H a x = L e N T U m S ( H s H a + r ( 1 L e 1 ) ( ω s ω a ) )
ω a x = N T U m S ( ω s ω a )
Equations (4), (6), (7), (16) and (17) establish the major energy transfer model in a cross-flow HST. Therefore, through similar steps, the counter-flow conservation of energy Equation (18) can be rewritten as below:
m a H a L W d x d z d y + m s H s L W d x d z d y = ( m a H a L W + m a H a L W y ) d x d z d y + ( m s H s L W + m s H s L W y ) d x d z d y
The counter-flow mass conservation can be written as Equation (19):
m a ω a L W d x d z d y + m s ω s L W d x d z d y ( ( m a ω a L W + m a ω a L W y ) d x d z d y + ( m s ω s L W + m s ω s L W y ) d x d z d y ) = 0
The heat transfer process can be written as Equation (20):
m a H a L W y d x d y d z = h c A L W B ( T s T a ) d x d y d z + r L W y d x d y d z
The mass transfer process can be written as Equation (21):
m a ω a L W y d x d y d z = h m A L W B ( ω s ω a ) d x d y d z
Taking Equation (16) into Equations (20) and (21), and then simplifying it with Equations (18) and (19), the conservation of energy can be rewritten as Equation (22):
m a y ( H a ) + y ( m s H s ) = 0
The mass balance equation can be rewritten as Equations (23) and (24):
y ( m a ω a + m s ) = 0
d ( m s ζ ) = 0
The heat transfer process can be rewritten as Equation (25):
H a y = L e N T U m B ( H s H a + r ( 1 L e 1 ) ( ω s ω a ) )
The mass transfer process can be rewritten as Equation (26):
ω a y = N T U m B ( ω s ω a )

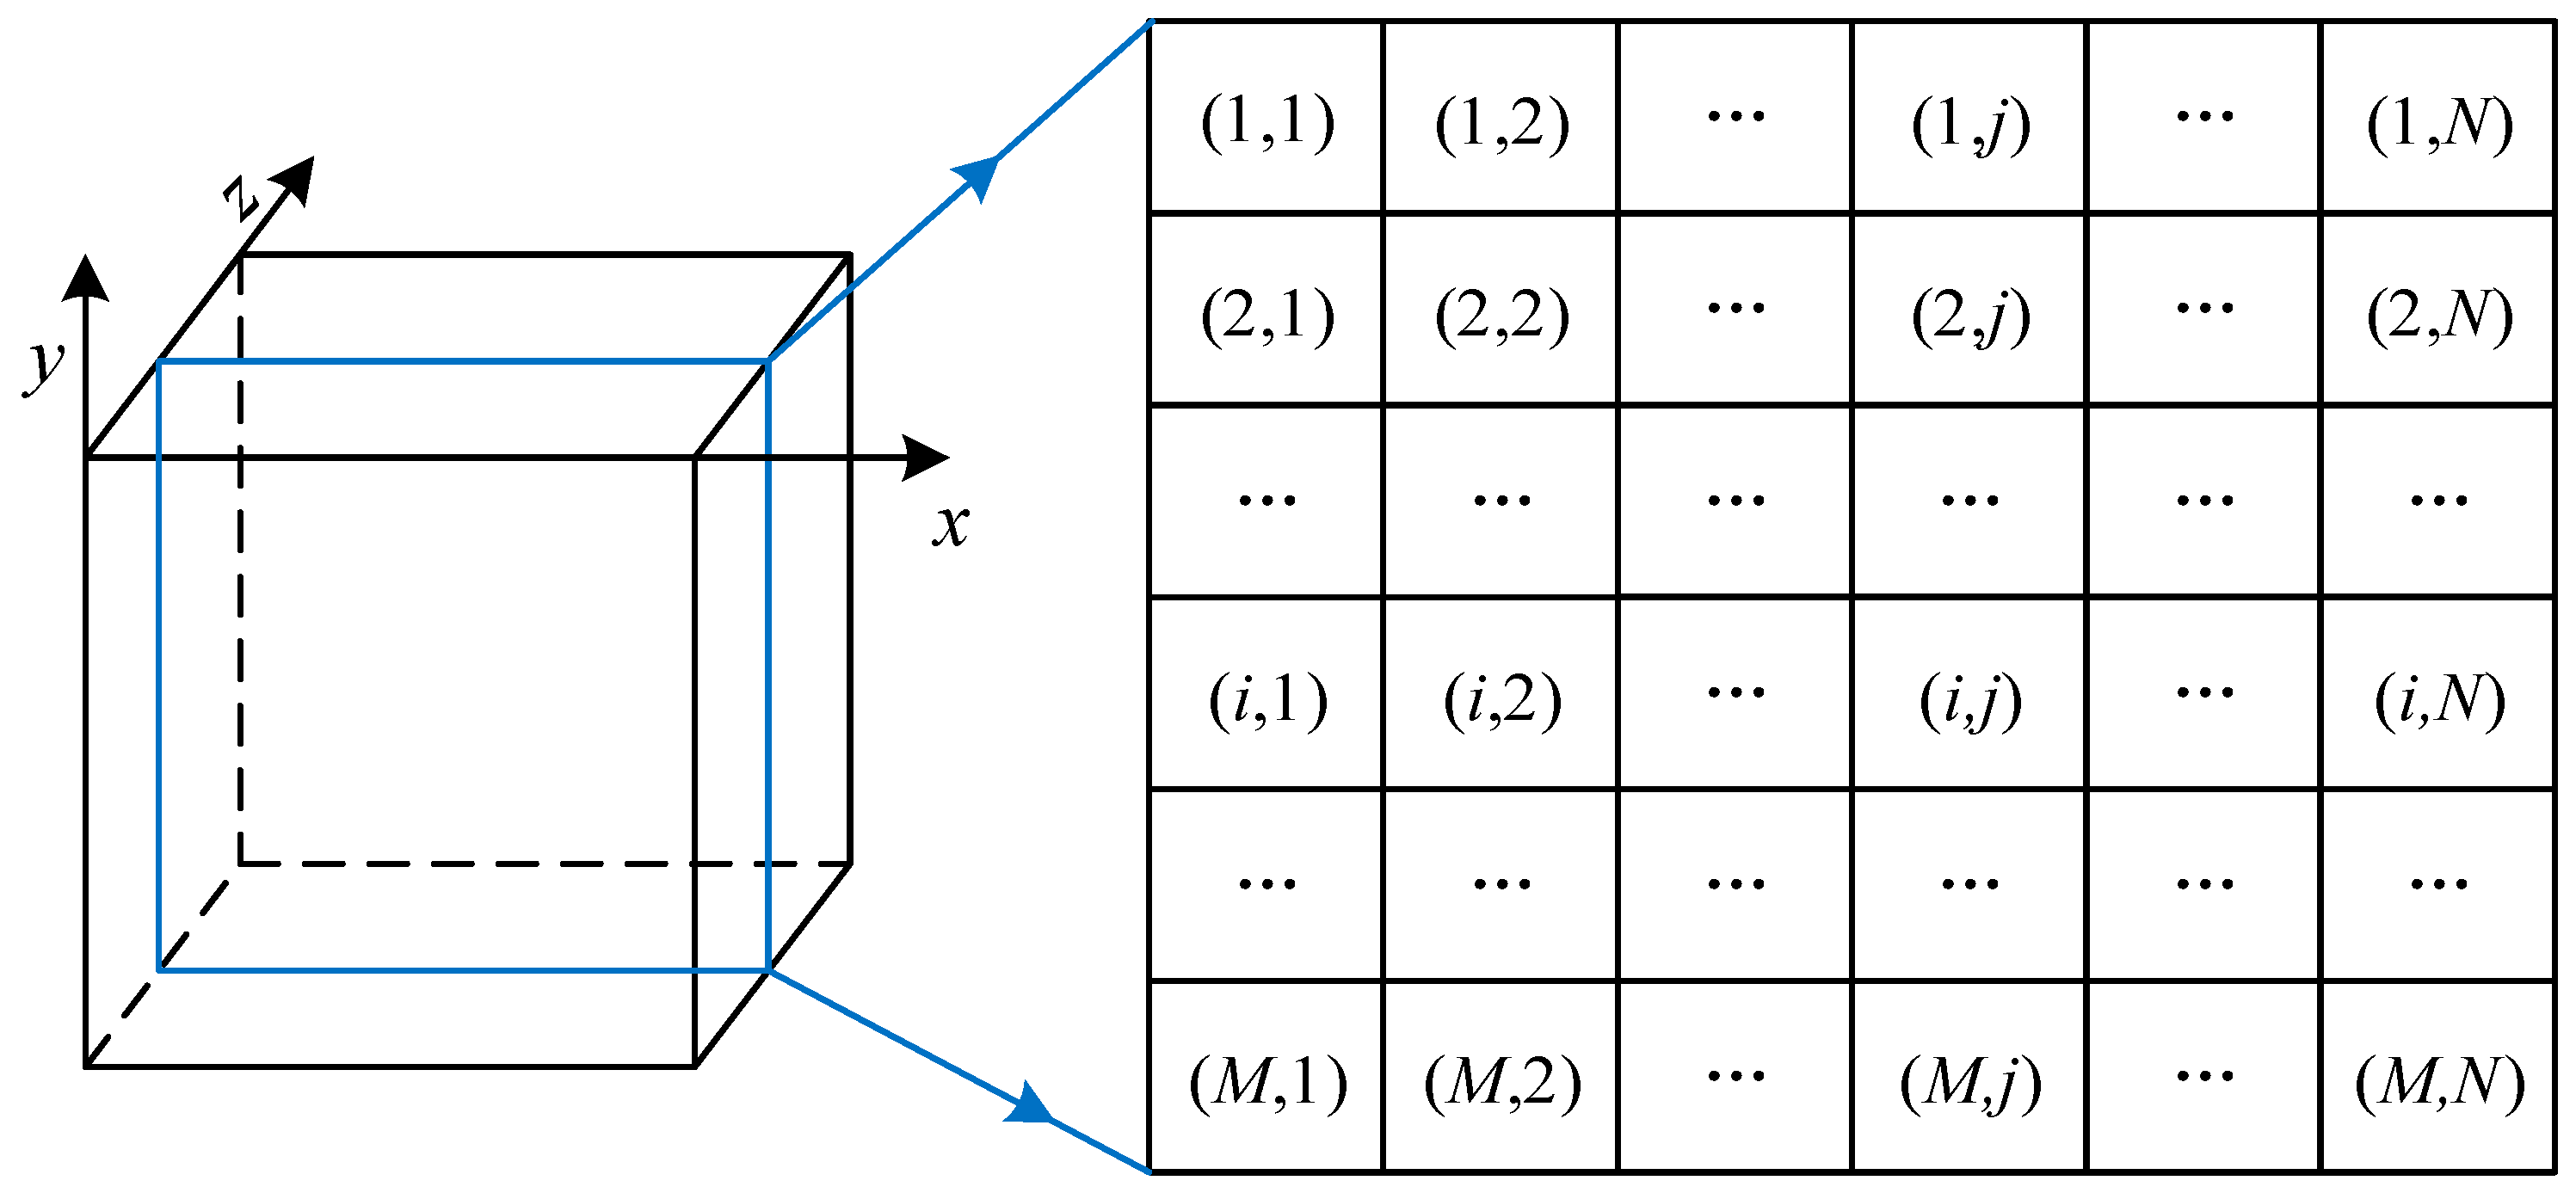
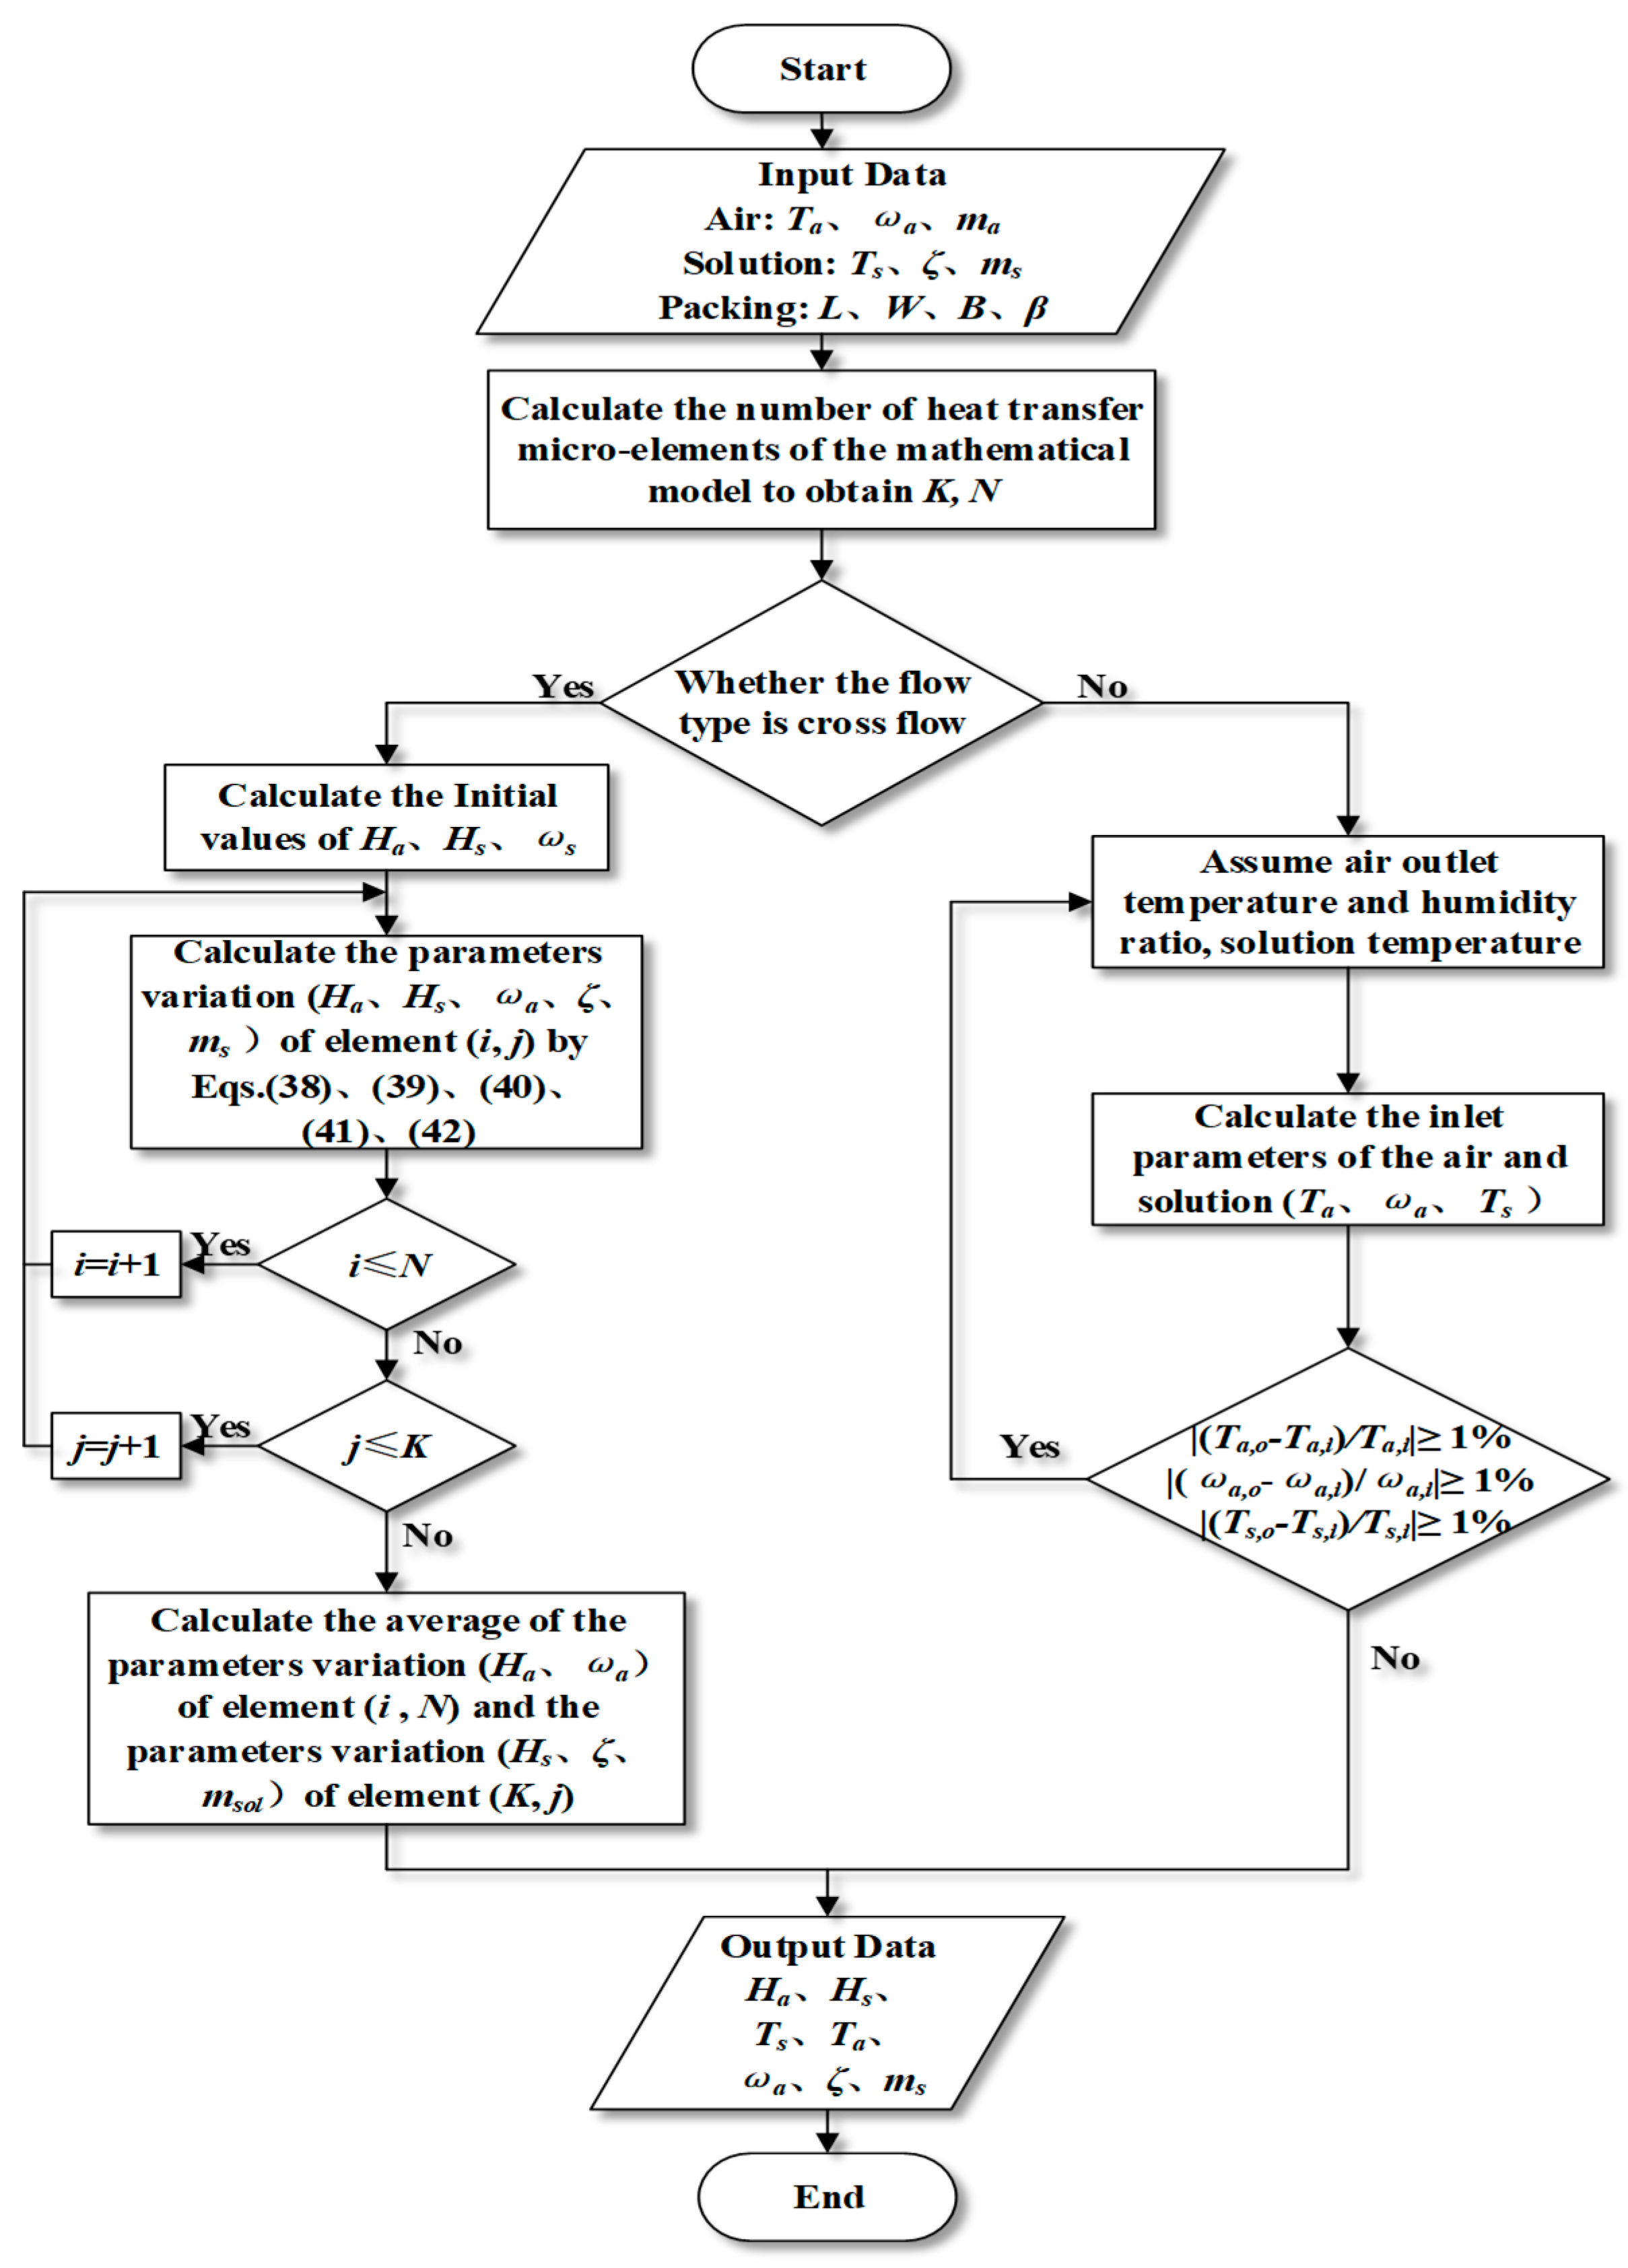
2.2.2. Numerical Methods

In order to solve the equation using the finite difference method, the governing equation is rewritten into the form of a differential equation [25,26].
Figure 4 explains method intuitively. The section can be seen as a two-dimensional mathematical model, which divides the packing material into N parts of the x direction and into K parts of the y direction. For any control volume (i, j) in this model, the input parameters are the enthalpy of the solution hsi,j, air enthalpy hai,j, solution mass flow rate msi,j, air humidity ratio ωai,j, and solution concentration ζi,j, respectively. The output parameters are hsi + 1,j, hai,j + 1, msi + 1,j, ωai,j + 1, ζ i + 1,j (where i < K, j < N).
For the (i + 1, j) or (i, j + 1) control volumes, the same calculation process is performed to obtain the import of the next volume, and then repeating the calculation process [25,26]. When the values of K and N are large enough, the result can be considered reliable [6].
For mesh (i, j), the Equations (22)–(26) can be discretized as follows:
m s i + 1 , j ζ i + 1 , j = m s i , j ζ i , j
N m a H a i , j + 1 + K m s i + 1 , j H s i + 1 , j = N m a H a i , j + K m s i , j H s i , j
N m a ω a i , j + 1 + K m s i + 1 , j = N m a ω a i , j + K m s i , j
h a i , j + 1 = h a i , j + L e N T U m N ( h s i , j h a i , j + r ( 1 L e 1 ) ( ω s i , j ω a i , j ) )
ω a i , j + 1 = ω a i , j + N T U m N ( ω s i , j ω a i , j )
This model uses an aqueous solution of calcium chloride as fluid. The boundary layer generated while the solution contact with air, the energy transfer process occurs on the boundary layer, simultaneously. The humidity ratio of moist air in the boundary layer can be written as Equation (32):
ω s = ω a , 0 = 0.622 P f P a t m P f
The air enthalpy can be written as Equation (33):
H a = 1.01 × T a + 1001 ω a ( 2501 + 1.84 T a )
The enthalpy of solution can be written as Equations (34)–(36) [27]:
Δ H s = Δ H s , o [ 1 + ( φ λ 1 ) λ 2 ] λ 3
φ = ζ λ 4 ζ
Δ h d , 0 = λ 5 + λ 6 × T s o l
The values of the correlation coefficients are shown in Table 1. Combining Equations (34)–(36) and Table 1, Equation (34) can be rewritten as below:
Δ H s = ( 955.69 + 3011.974 T s ) [ 1 + ( ζ 0.855 ( 0.8 ζ ) ) 1.965 ] 2.265

2.3. Determination of Other Parameters

For both forms of HSTs, the solution specific heat and the packing NTUm are the same, so the two forms of packing materials can be discussed together.

2.3.1. Solution Specific Heat

For aqueous calcium chloride solutions in the non-crystalline region, the specific heat can be calculated using Equations (38)–(42) [27]:
τ = T s + 273.15 228 1
c p , H 2 O = ξ 1 + ξ 2 τ 0.02 + ξ 3 τ 0.04 + ξ 4 τ 0.06 + ξ 5 τ 1.8 + ξ 6 τ 8
f 1 ( T s ) = a τ 0.02 + b τ 0.04 + c τ 0.06
f 2 ( ζ ) = d ζ + e ζ 2 + f ζ 3
c p = c p , H 2 O [ 1 f 1 ( T s ) f 2 ( ζ ) ]
where, ξi (i = 1, 2, …, 6), a–e and f are all constant value, and their values areas below in Table 2.

2.3.2. Packing Material NTUm

The mass transfer coefficient is difficult to determine in the Equation (14). And the relation between Sherwood number (Sh) and hm can be obtained from the following formula:
h m = S h ρ a D a d s
in which ds is the equivalent diameter of the channel as defined by Al-Farayedhi et al. [28].
Therefore, the Sherwood number (Sh) was introduced into Equation (14). The Sherwood number of the packing material can be obtained by fitting the experimental data. So, NTUm can be rewritten as Equation (44):
N T U m = S h ρ a D a A m a d s
with Equations (8) and (43), then Equation (45) can be written as:
N T U m = S h ρ a D a β L W B m a d s D

2.3.3. Heat and Mass Transfer Coefficient

According to literature [26], the heat transfer coefficient hc can be calculated as follows:
h m = D a D ( 2 + 0.6 Re 1 / 2 S c 1 / 3 )
h c = k a D ( 2.0 + 0.6 Re 1 / 2 Pr 1 / 3 )
A program written in MATLAB (R2018b, The MathWorks, Inc., Natick, MA, USA) is used to solve the mathematical models. The computational flow of the program is illustrated below in Figure 5.

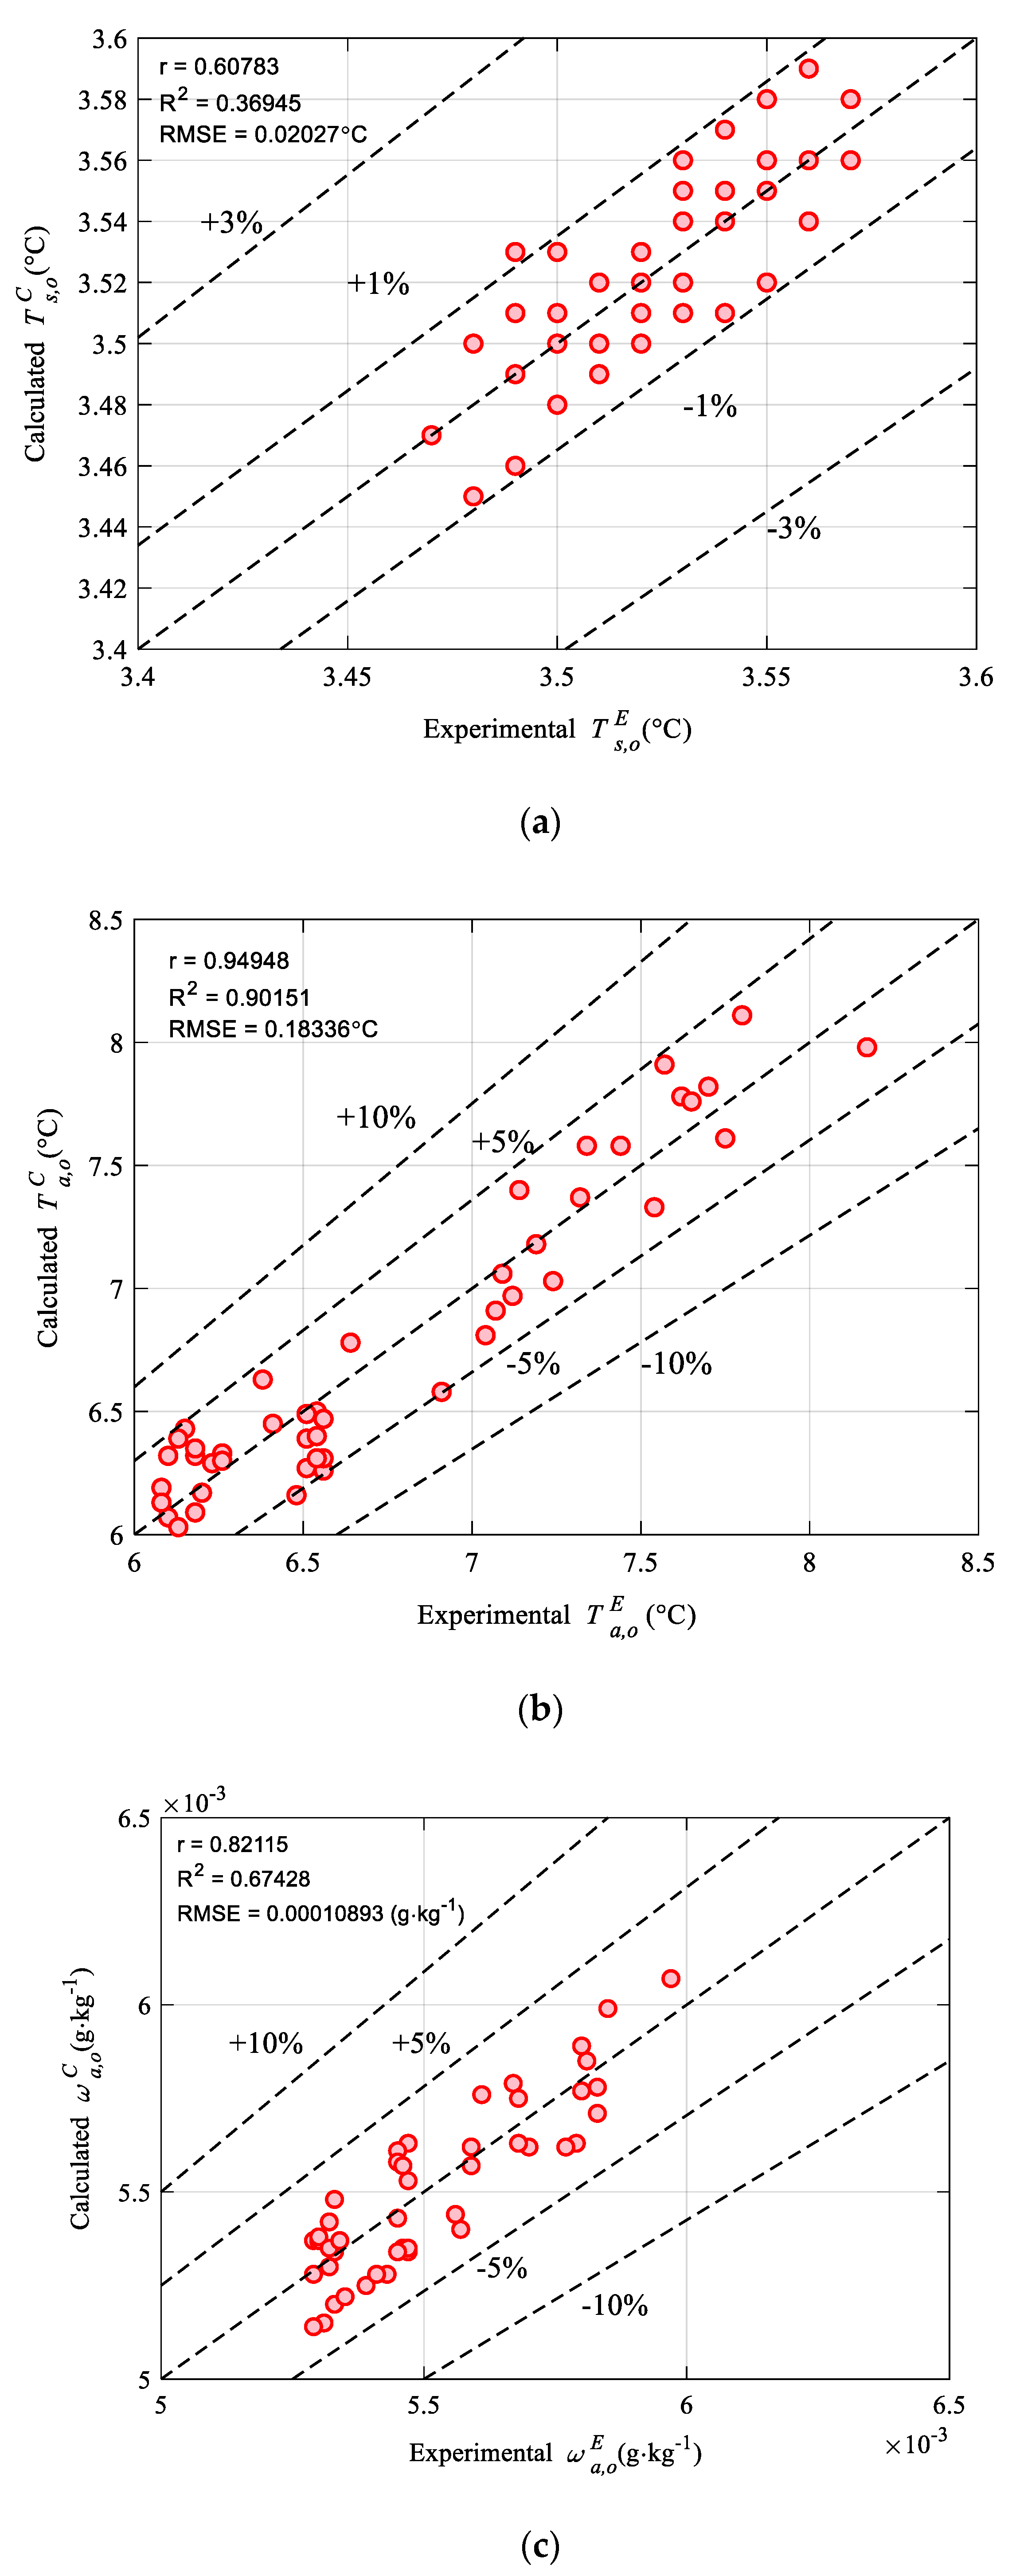
3. Experiment and Model Verification of the HST

To validate the developed mathematical model, field experimental work has been carried out by our group in Chongqing City. Figure 6 shows the major structure of the experimental platform. The experimental device used in the experiment is shown in Table 3.
The packing material used was a structured PVC (polyvinyl chloride) material with dimensions of 5000 mm long × 3300 mm wide × 2900 mm high for counter-flow, and 1460 mm long × 970 mm wide × 1060 mm high for cross-flow. The counter-flow HST experiment was carried out during the 11:50–18:30 period within five days under outdoor inlet air conditions, while the cross-flow experiment was carried out during the 14:30–18:15 period.
Ts,o, Ta,o and ωa,o were selected for verification. Figure 7 demonstrates the difference between the simulation data and the experimental data. The R2, r and RMSE (root mean square error) were carried during the model verification. The model verification of the cross-flow model is based on the experimental data from Appendix A, and the model was also used for counter-flow verification using the data from Lu [29].
The parameters used to quantify the packing material are mainly the porosity and packing space. The influence of these parameters on the thermal behaviour of the filler was discussed in Section 4.3. Different flow directions cannot directly affect these parameters, but they will cause different heat and mass transfer processes between the air and the solution inside the packing material, which indirectly affects the thermal performance of HST. Therefore, the thermal behaviour of a counter-flow HST and a cross-flow HST are different.

4. Parametric Study

Through the mathematical model verified in the previous section, the mass and energy transfer of HST can be predictable, to compare the thermodynamic characteristics between the cross-flow and counter-flow HST, the same inlet boundary conditions are used for the calculation.
It can be reflected in Figure 8 that the air temperature decreases as the solution temperature increases. This figure shows the distribution of air and solution temperature inside the packing material. The form of this figure is a box diagram, where the box is used to represent the parameter distribution of cross-flow at the same height, the upper and lower boundaries are the maximum and minimum values of a set of data, and the upper and lower limits of the box are a set of 1/4 quantile of data. This phenomenon mainly due to the temperature difference between the air and the solution. Therefore, SHT (sensible heat transfer) occurs due to the temperature difference, and latent heat transfer (LHT) occurs simultaneously. The air temperature decreases from 6.0 °C to 1.88 °C with the solution temperature increases from −3.0 °C to −1.126 °C. In addition, for the cross-flow HST, the air temperature decreases from 3.82 °C to 3.09 °C as the solution temperature increases from −3.0 °C to −0.924 °C. Table 4 shows the Simulation boundary conditions.
Figure 9a derives the temperature contour of the air in the HST. The air temperature decreases along the airflow direction (X-direction), and the air temperature changes slightly following the Y-axis. The maximum temperature appears in the lower-left area of the X-Y plane, where the temperature difference between air and solution is the minimum. However, in the upper right corner of the X-Y plane, the air temperature taken lowest value here, which is caused by the maximum temperature difference between the solution and air in this area. Further, a solution temperature contour can be obtained as shown in Figure 9b. Compared with Figure 9a, the solution temperature decreases along the Y-direction, and the air temperature changes slightly along the X-axis. A rapid change of the solution temperature appears in the lower-left part of the X-Y plane. The temperature difference between the two fluids on the left side of the positive X-axis region is higher, which can be the major cause of the solution temperature evolution.
The variation of the air humidity ratio is revealed in Figure 10. The air humidity ratio in both HSTs decreased along the fluid flow channel. The counter-flow air humidity ratio decreases from 4.50 g/kg to 3.82 g/kg and the cross-flow HST decrease is from 4.024 g/kg to 4.157 g/kg. Part of the reason for this discovery is that a pressure difference exists between the water vapor surface and the solution surface, so consequently the moisture in the air is continuously transmitted to the solution side under the pressure difference. In addition, the LHT is spontaneously generated in the process. Moreover, the cross-flow humidity ratio decreased faster than in the counter-flow configuration.
The evolution of the solution mass flow rate is displayed in Figure 11. The solution mass flow rate varies from 37.70 kg/s to 37.73 kg/s for cross-flow, while the counter-flow solution mass flow increased to 37.726 kg/s. A major source for this is that the solution is diluted under the water vapor pressure difference, the solution temperature is far below the freezing point, so the solution will continuously absorb moisture from the air. However, as the freezing point approaches 0 °C, the system will have a risk of freezing, so the characteristics of solution dilution should be investigated.

4.1. Impact of Inlet Air Parameters on Energy Transfer

A parametric study is carried out using the above constant boundary conditions as benchmarks. In order to compare the thermodynamic properties of two HST, the SHT, LHT and ξ of two HST under different air, solution and material boundary conditions will be investigated.

4.1.1. Impact of Inlet-Air Temperature

The energy transfer inside the HST is indicated in Figure 12. With the inlet air temperature elevates, the SHT in the HST increases, while the LHT decreases slightly and the difference of SHT between the two HSTs also increases. The counter-flow SHT increases from 73.2 kW to 281.2 kW, while the SHT varies from 79.81 kW to 312.5 kW for the cross-flow setup. However, the counter-flow LHT decreases from 69.16 kW to 64.37 kW when the cross-flow varies from 78.7 kW to 70.45 kW. This suggests that the air inlet temperature has a significant effect on the SHT, but has little influence on the LHT.
ξ indicates the proportion of LHT caused by moisture transfer in THT. With the inlet air temperature increases, not solely counter-flow ξ decreases from 0.4858 to 0.1863 significantly, but also cross-flow ξ decreased from 0.4965 to 0.184. As the air inlet temperature increases, resulting in a reduction in the air humidity ratio, the capacity of the air moisture content also decreases, following, a decrease in the LHT further triggered by a decrease in the mass transfer between the air and the solution, finally the ξ decreases gradually. Accordingly, the inlet air temperature has a majority effect on ξ, the cross-flow ξ is more sensitive to the inlet air temperature subsequently.

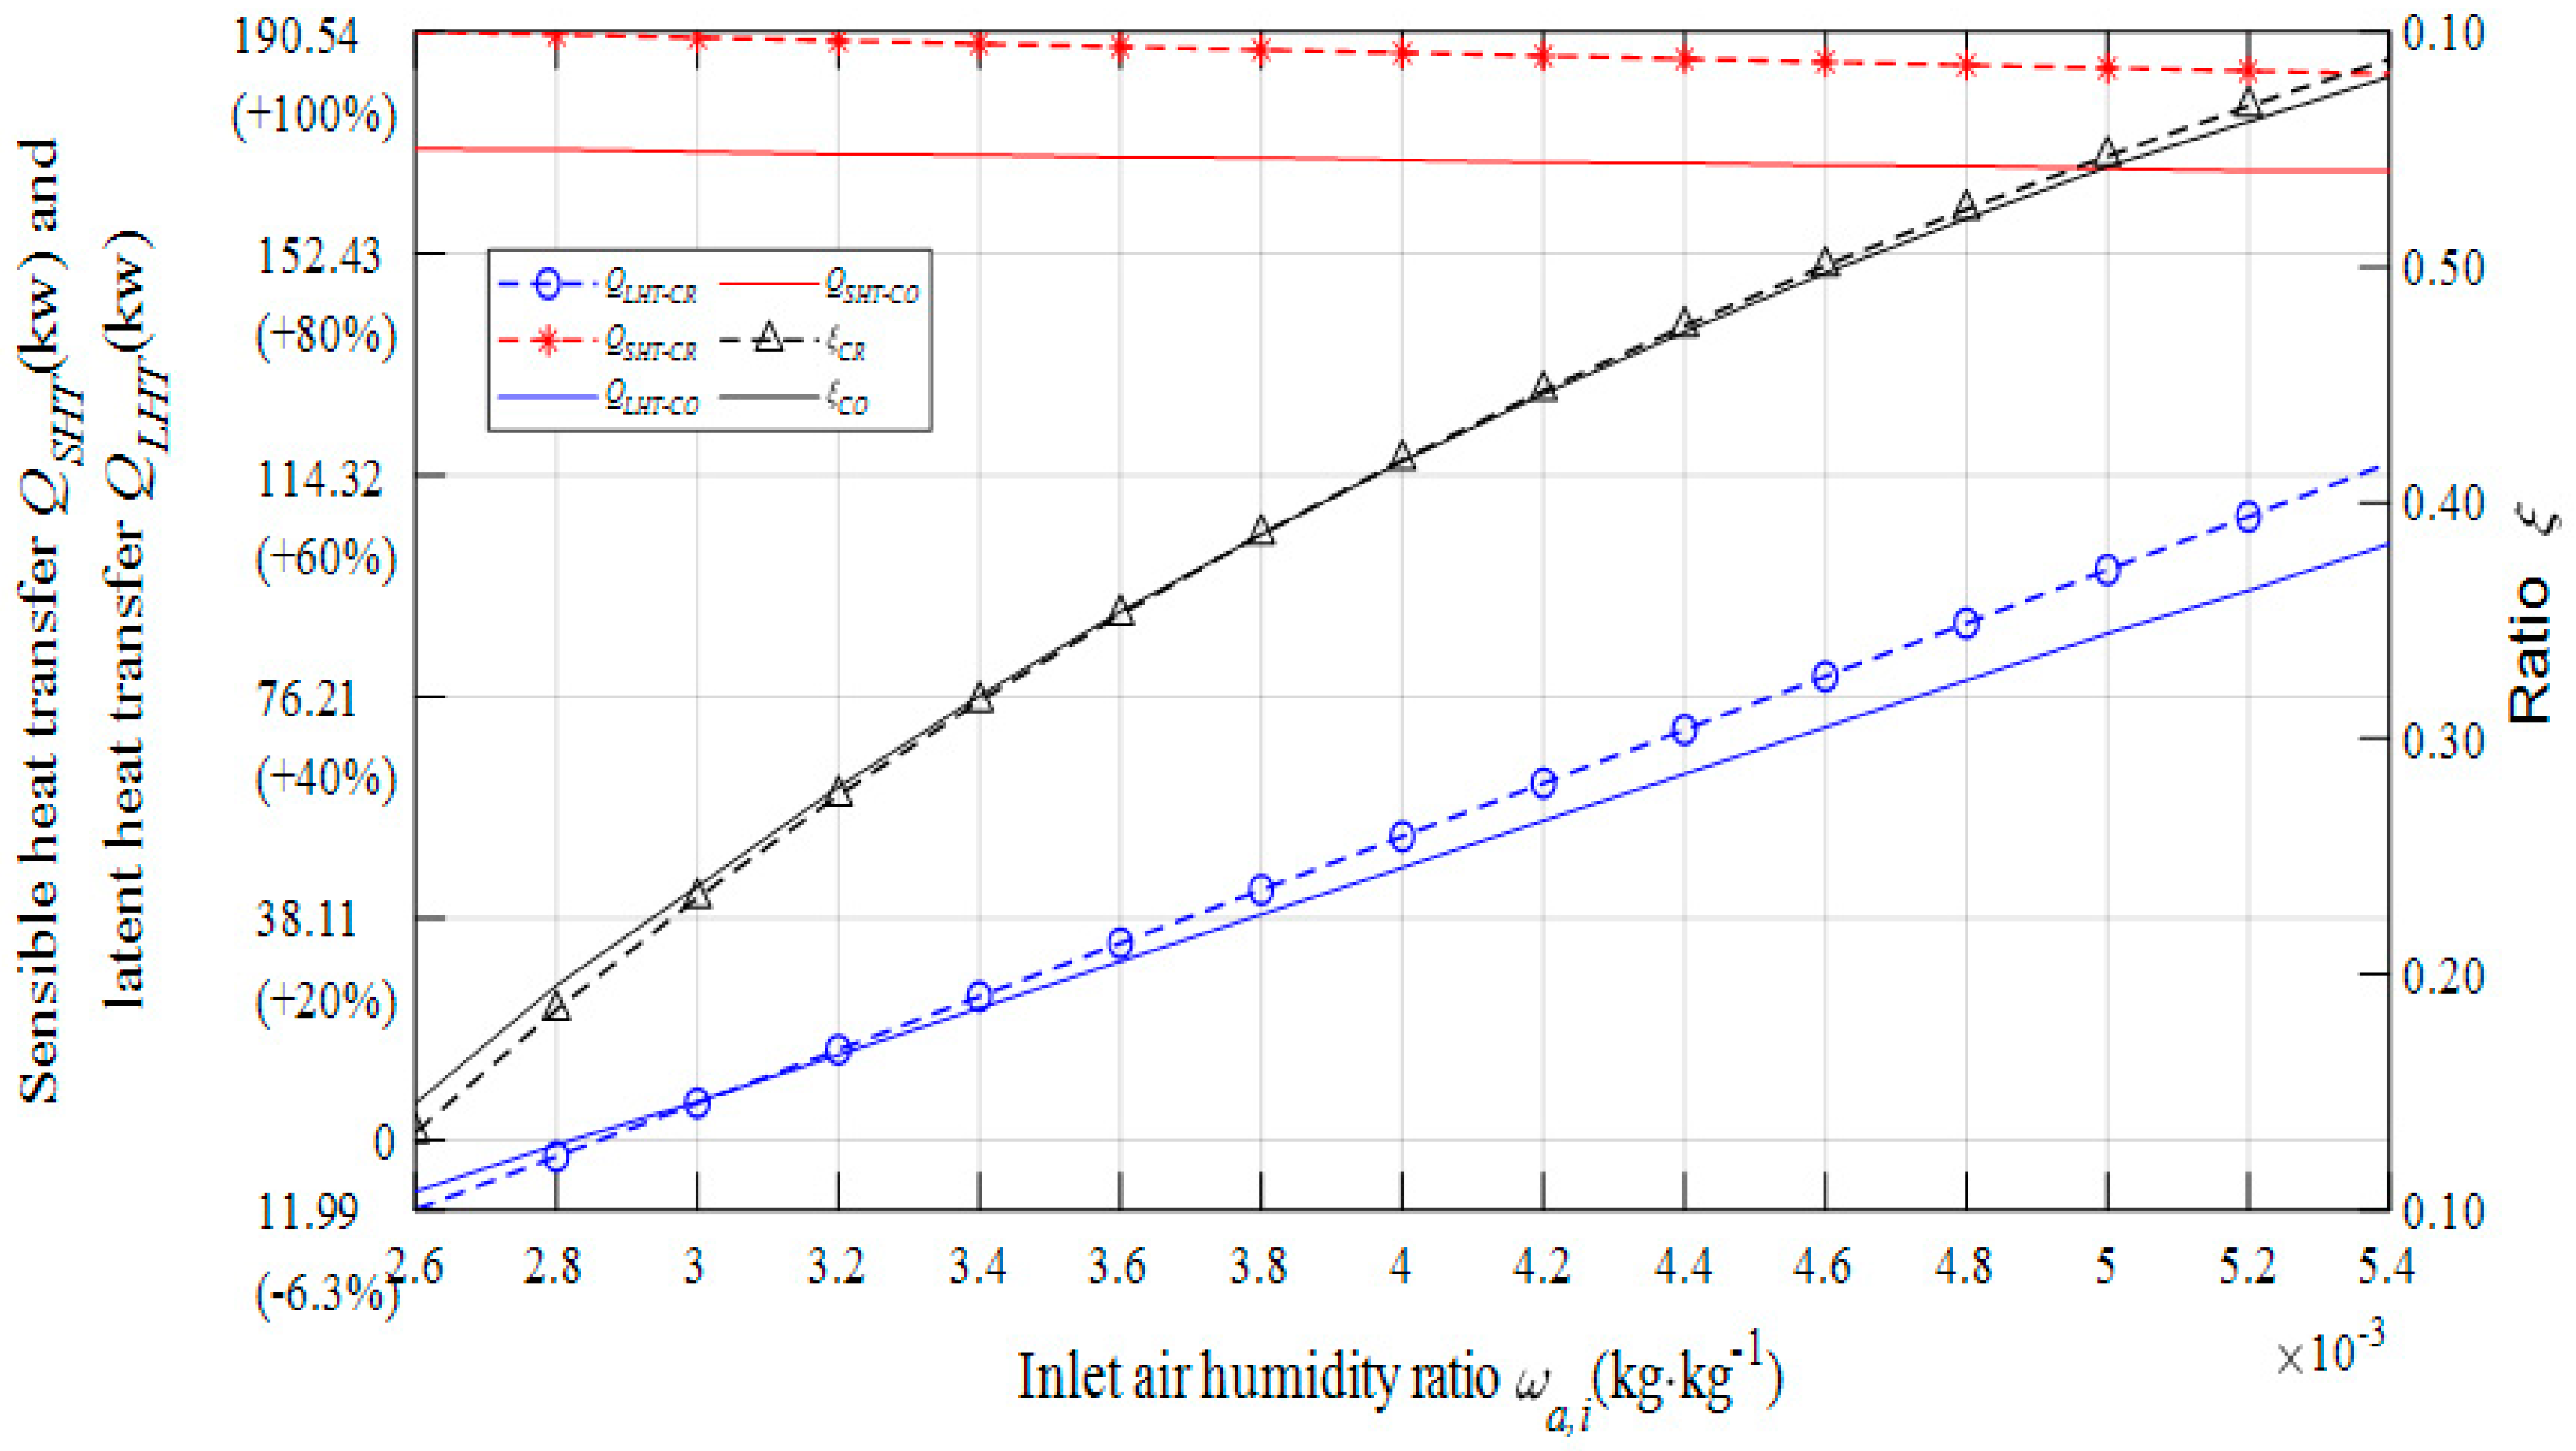
4.1.2. Impact of Inlet Air Humidity Ratio

The effect of inlet air humidity ratio on energy transfer in the HST is presented in Figure 13 when the inlet air humidity ratio varies from 2.6 g/kg to 5.4 g/kg, the LHT in the HST increases, while the SHT slightly attenuate, the difference of LHT between two HSTs also increases. It is contrary to inlet air temperature, the counter-flow SHT decreases from 170.4 kW to 166.6 kW, with the cross-flow SHT varies from 190.5 kW to 183.2 kW. Furthermore, the counter-flow LHT increases quickly from −8.858 kW to 102.5 kW when cross-flow varies from −12 kW to 116.3 kW, in contrast to the inlet air temperature, the inlet air humidity ratio causes a pivotal contribution to the LHT but has little amelioration on the SHT.
It is distinct from the ξ of air inlet temperature, the counter-flow ξ rises from −0.055 to 0.381 along with the cross-flow ξ increases from −0.067 to 0.389. The LHT between the fluids enhanced as the inlet air humidity ratio increased, However, the increase in air humidity doesn’t drive the air temperature increases. In other words, the temperature difference is still constant, thus the SHT remains almost unchanged and even a decline is obtained. Nevertheless, the water vapor partial pressure highly increased with the air humidity ratio amplified, then the increase of LHT results in an ξ increment, especially for the cross-flow HST. Hence, the inlet air humidity ratio has a significant influence on ξ. In spite of the LHT increase, the solution is also diluted, therefore, the HST system is at risk of freezing.

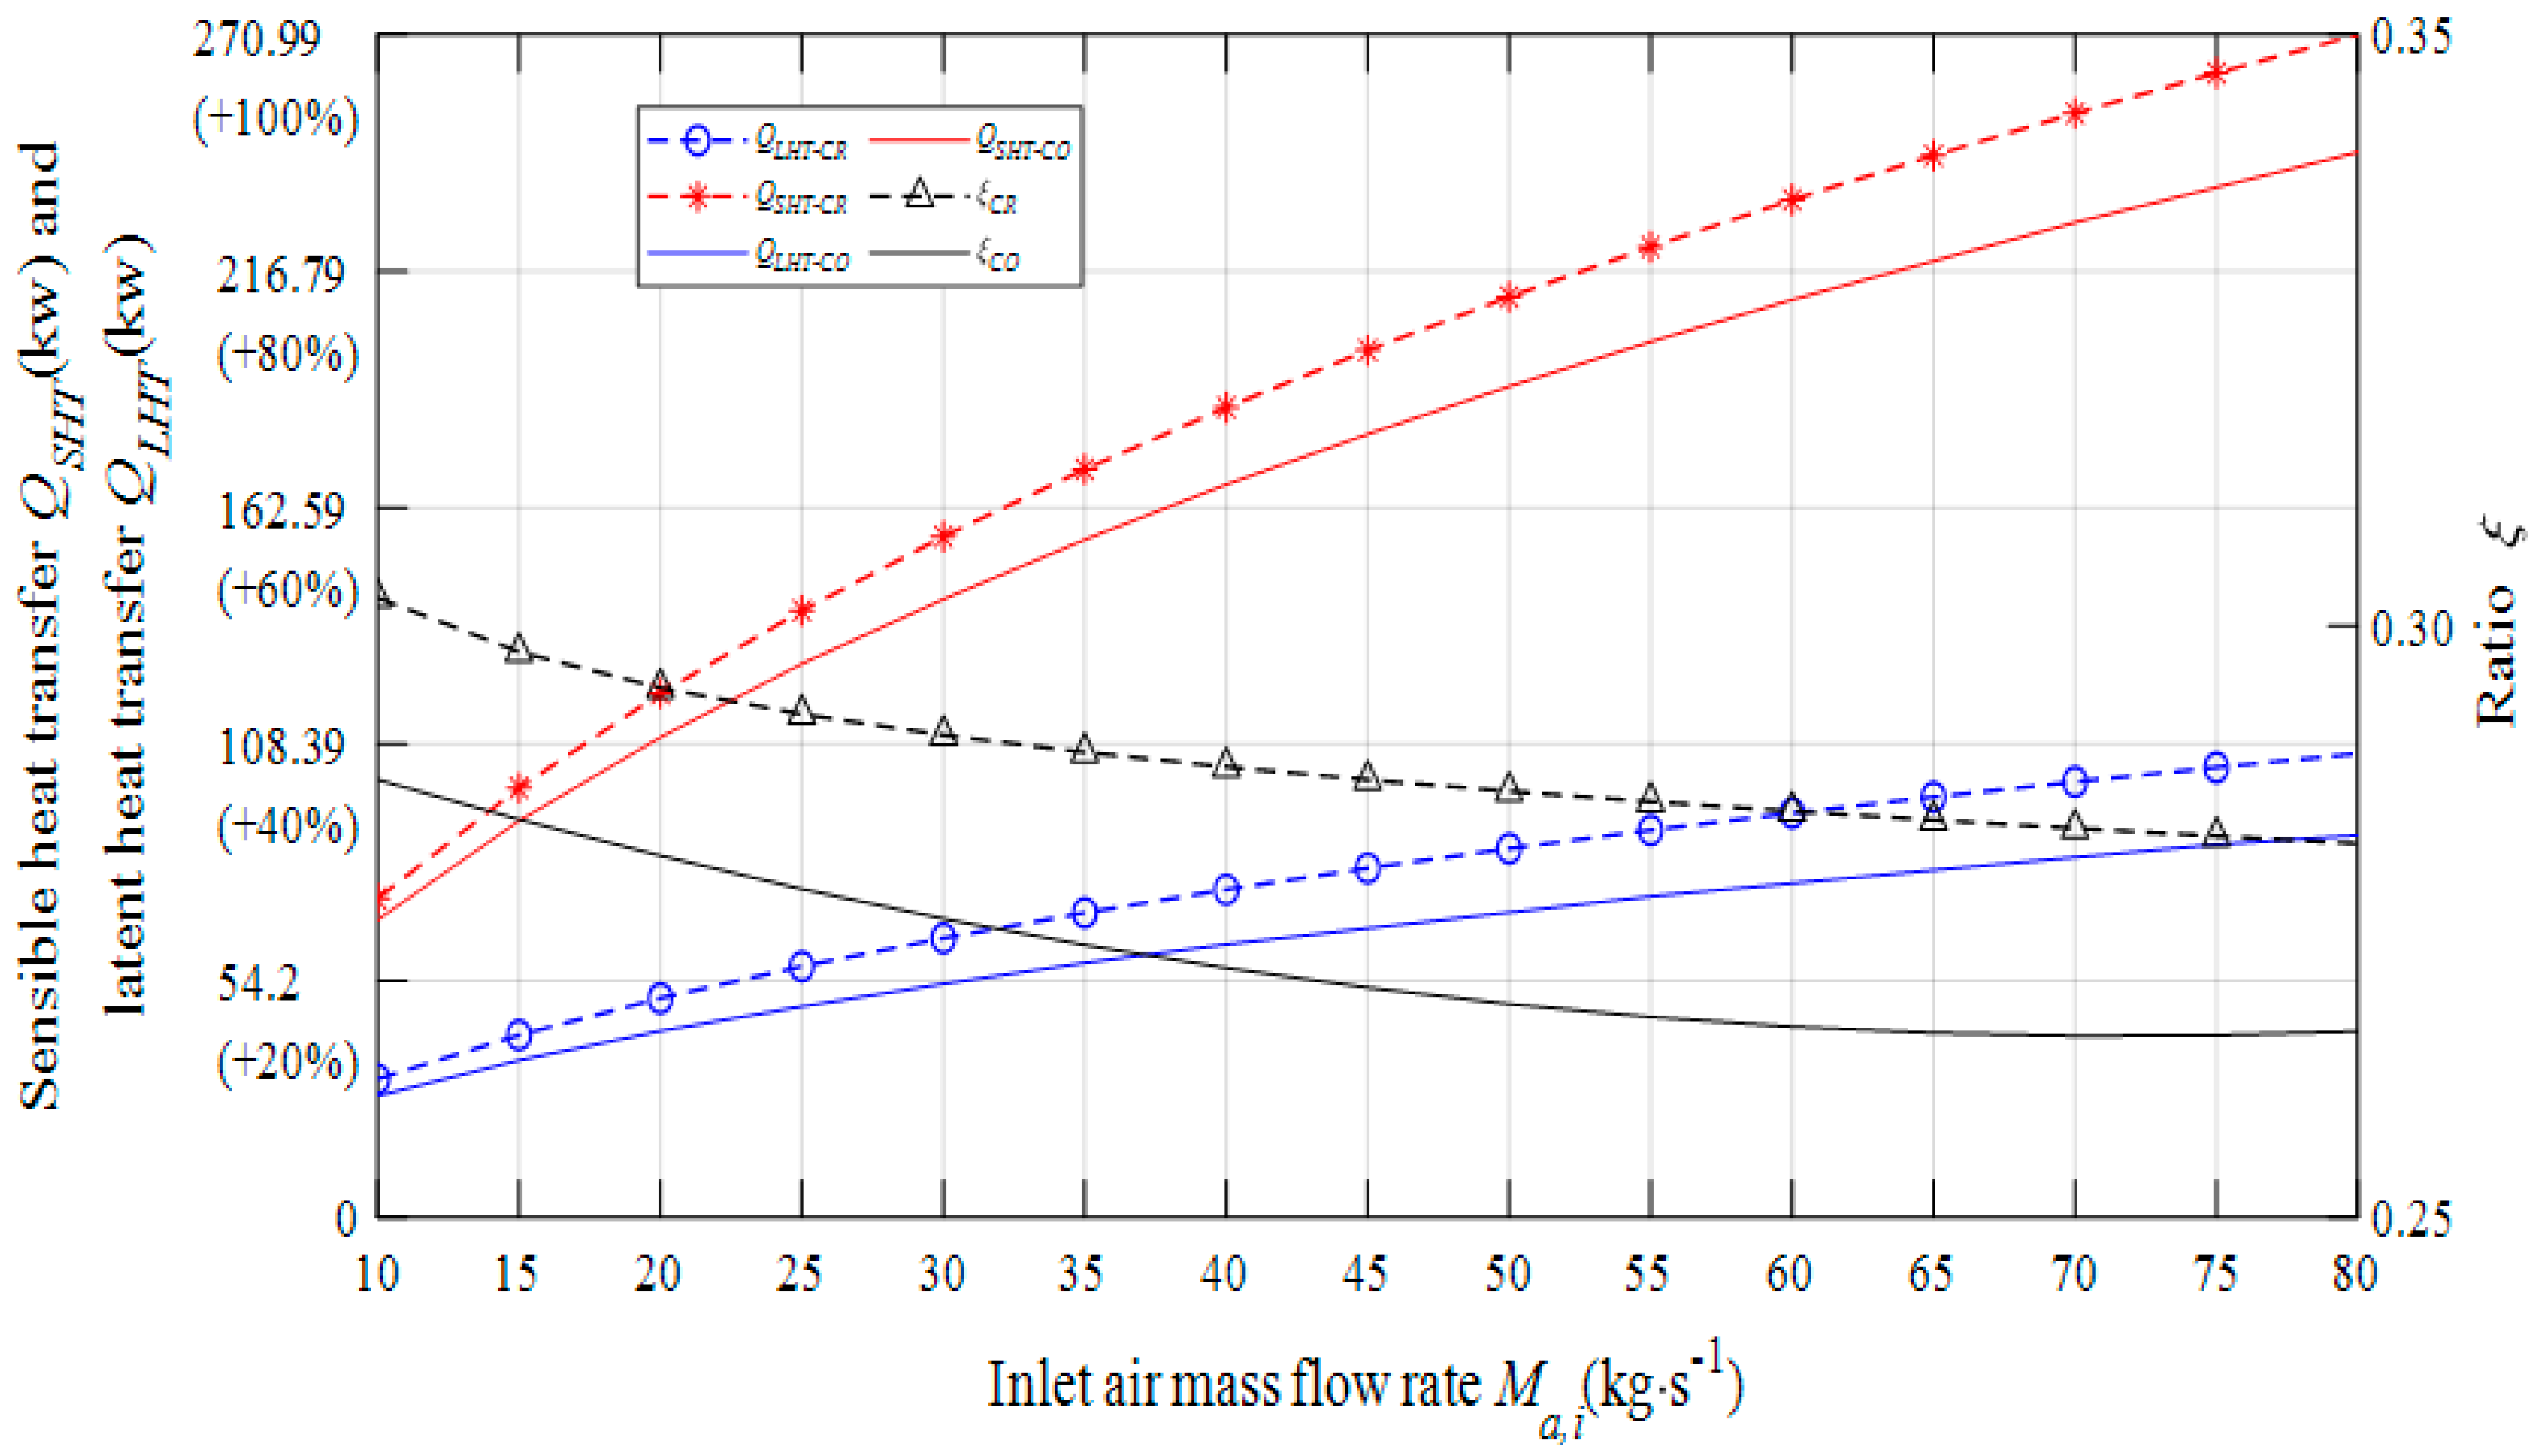
4.1.3. Impact of Inlet Air Mass Flow Rate

With the inlet air mass flow rate rises, both SHT and LHT increase, the difference between SHT and HST among the two HSTs also increased, which is shown in Figure 14. The counter-flow SHT increases from 68.12 kW to 244.1 kW, as well as the cross-flow SHT, which varies from 73 kW to 271 kW. Besides, the counter-flow LHT increases from 27.75 kW to 87.54 kW when the cross-flow varies from 31.64 kW to 106.2 kW. This conveys that the air inlet mass flow rate leads to a functional increase in both SHT and LHT. By contrast, the counter-flow ξ decreased from 0.287 to 0.265 with the cross-flow ξ reduced from 0.302 to 0.282.
Different from inlet air temperature and humidity ratio, there is no direct effect on the air enthalpy, on the contrary, the heat and mass transfer coefficients are indirectly changed by the air mass flow rate, which can enhance the SHT and LHT, owing to the SHT, which increases much more than LHT, so ξ decreases, particularly in a counter-flow configuration. Importantly, the energy transfer times were reduced even though the energy transfer coefficients were strengthened, as a consequence, decreases in the increase rates of SHT and HST were obtained.

4.2. Impact of Inlet Solution Parameters on Energy Transfer

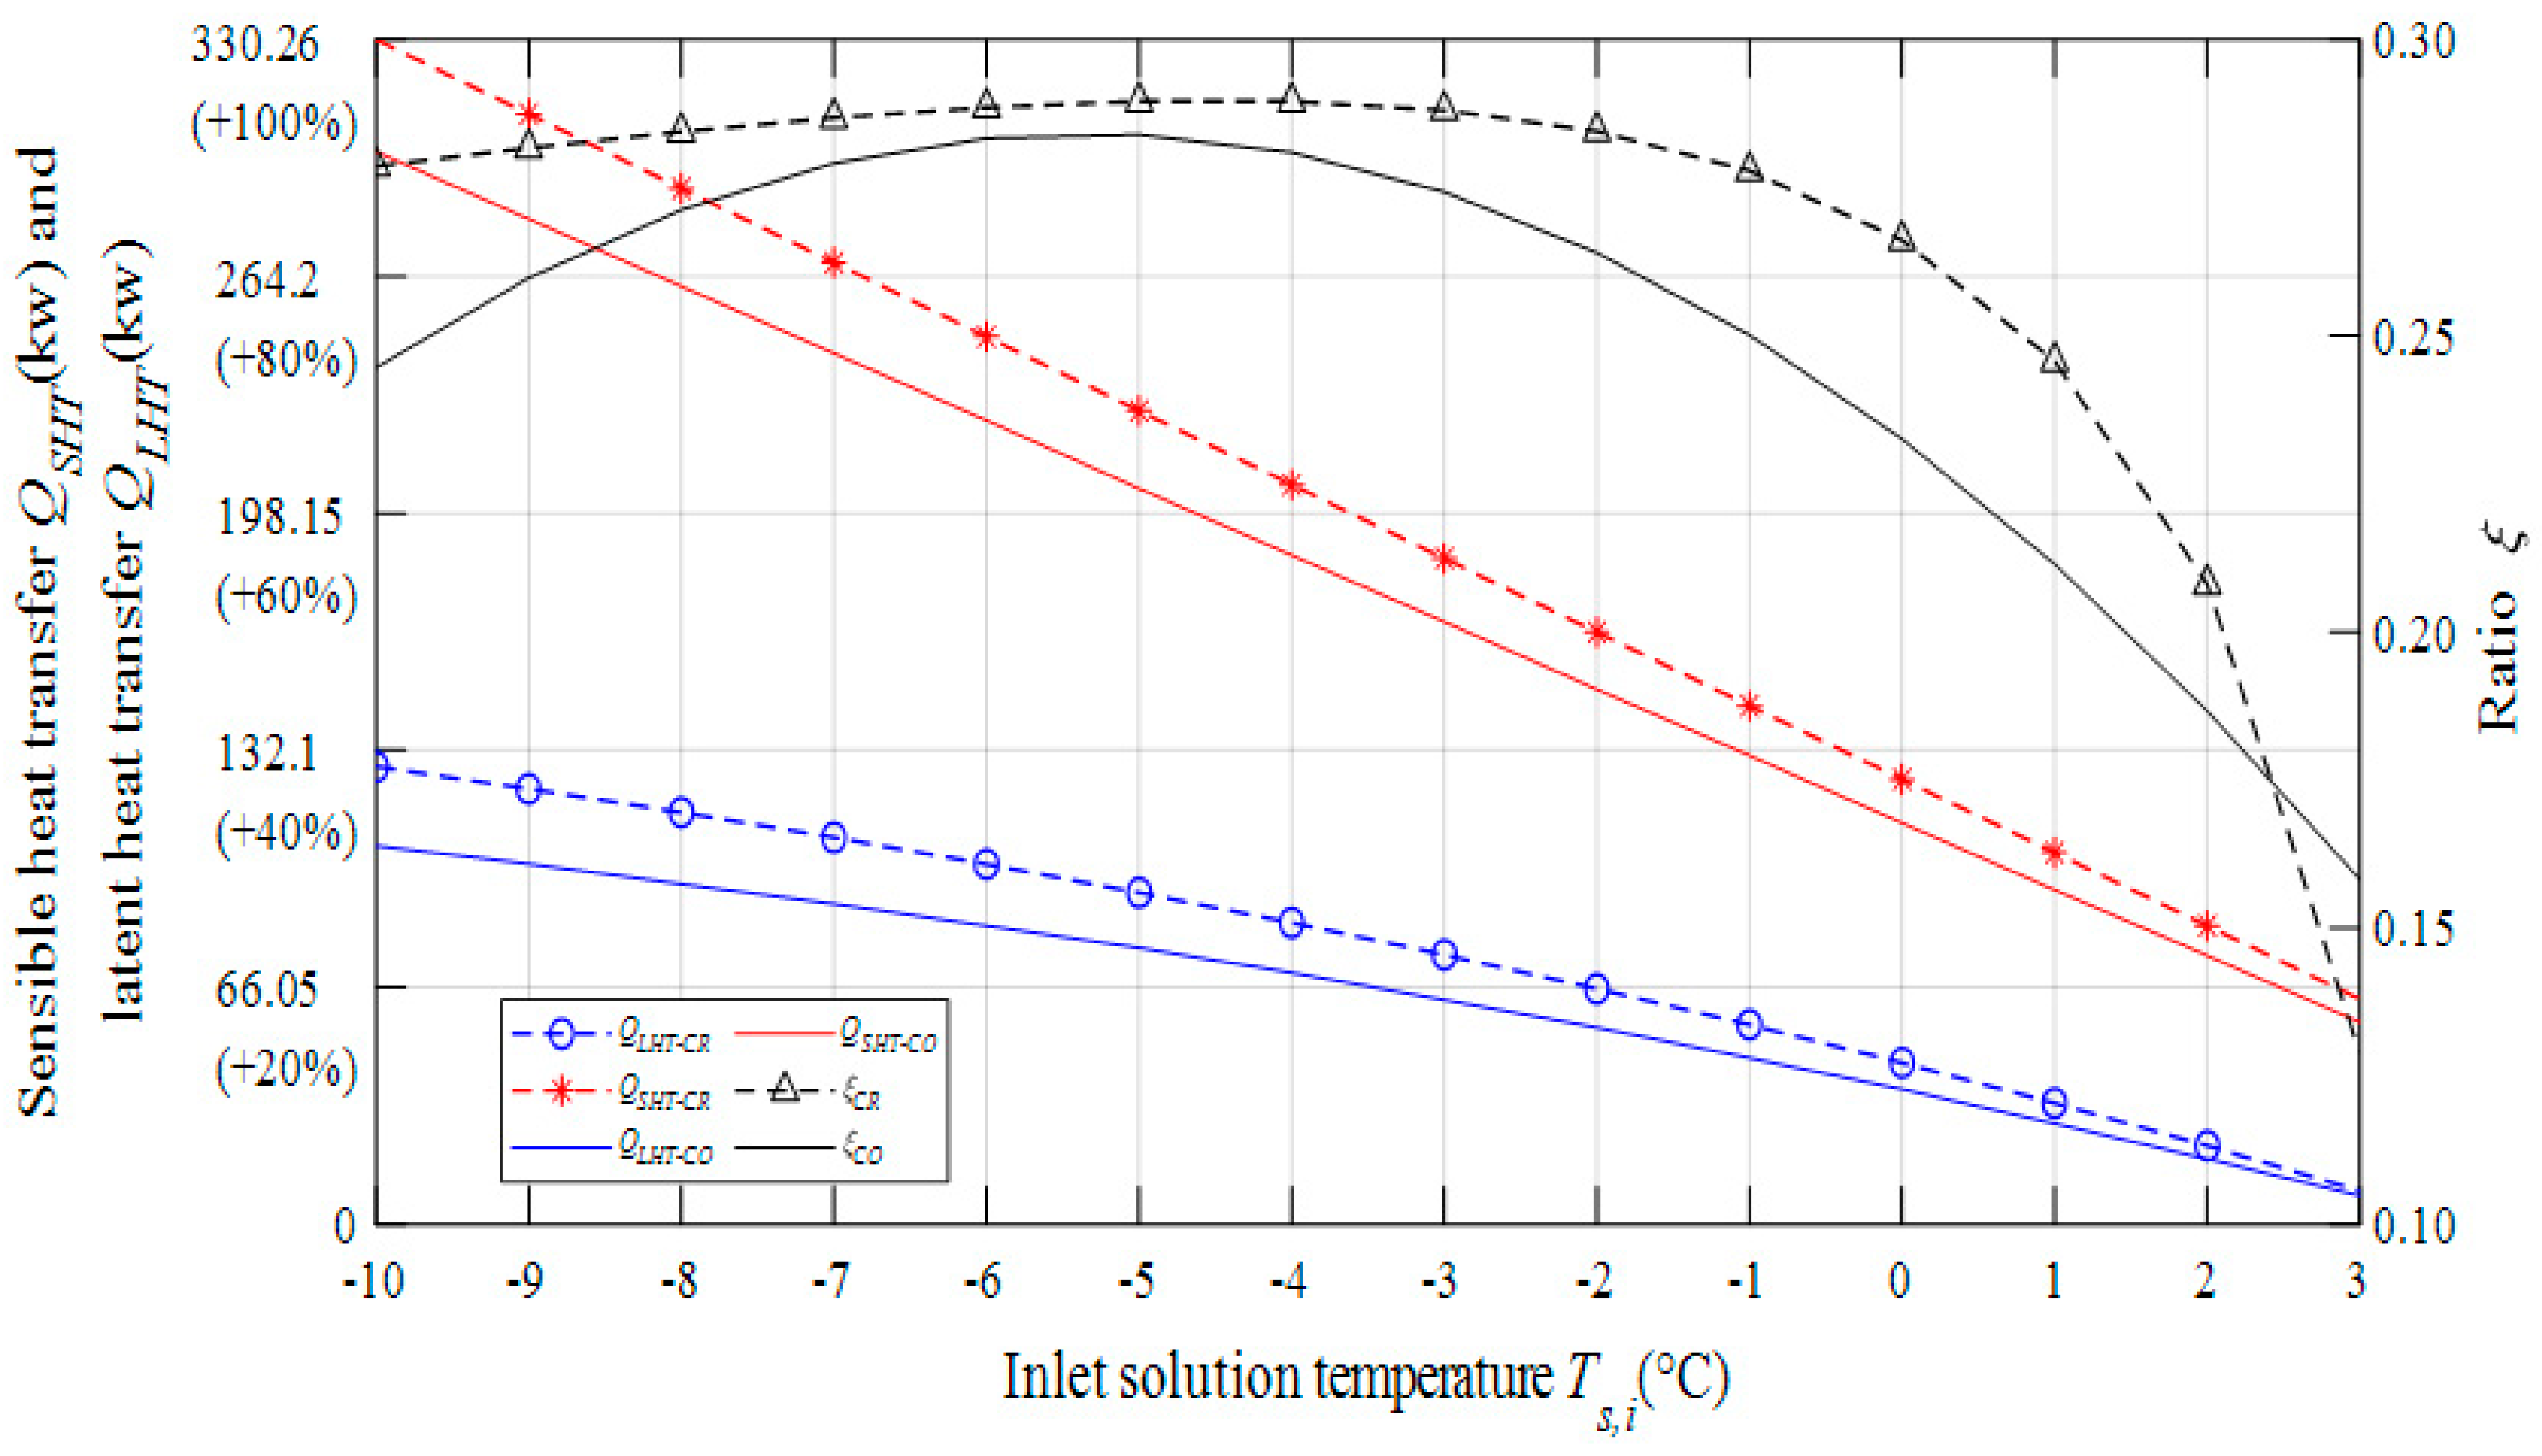
4.2.1. Impact of Inlet Solution Temperature

The variation of SHT and LHT with solution inlet temperature varies is observed in Figure 15. The counter-flow SHT decreases from 299 kW to 56.26 kW with the cross-flow SHT varies from 330.3 kW to 62.79 kW. Besides, the counter-flow LHT decreases from 105.4 kW to 7.96 kW when the cross-flow varies from 127.6 kW to 9.29 kW. The results have shown that the solution inlet temperature has greatly decreased the ability of SHT and LHT.
As the inlet solution temperature increases, ξ increases first, then decreases gradually. A transition temperature occurs at −5 °C, ξ is 0.284 and 0.289, especially for counter-flow and cross-flow. Additionally, with the increase in solution temperature, LHT decreases rapidly. Although it can weaken the solution dilution, conversely, the energy transfer was reduced. As a result, the solution inlet temperature should be selected according to the HST system operating conditions.

4.2.2. Impact of Inlet Solution Mass Flow Rate

It was previously found that both SHT and LHT can strengthen significantly with the air mass flow rate is increased. The influence of the solution inlet mass flow rate on energy transfer characteristics is shown as Figure 16. The counter-flow SHT increases from 129.8 kW to 178.1 kW with the cross-flow SHT varies from 135.2 kW to 200.2 kW. Then, the counter-flow LHT increases only from 45.05 kW to 66.26 kW and likewise cross-flow varies from 50.18 kW to 80.61 kW. The results have revealed that the solution mass flow rate has little influence on SHT and LHT.
When the inlet mass flow reaches 25 kg/s, the value of ξ almost remains constant. As a matter of fact, both SHT and LHT stay at a high value. In addition, a higher solution mass flow rate brings about a slower increment of energy transfer. Therefore, the solution mass flow rate should be selected precisely.

4.3. Impact of Material Parameters on Energy Transfer

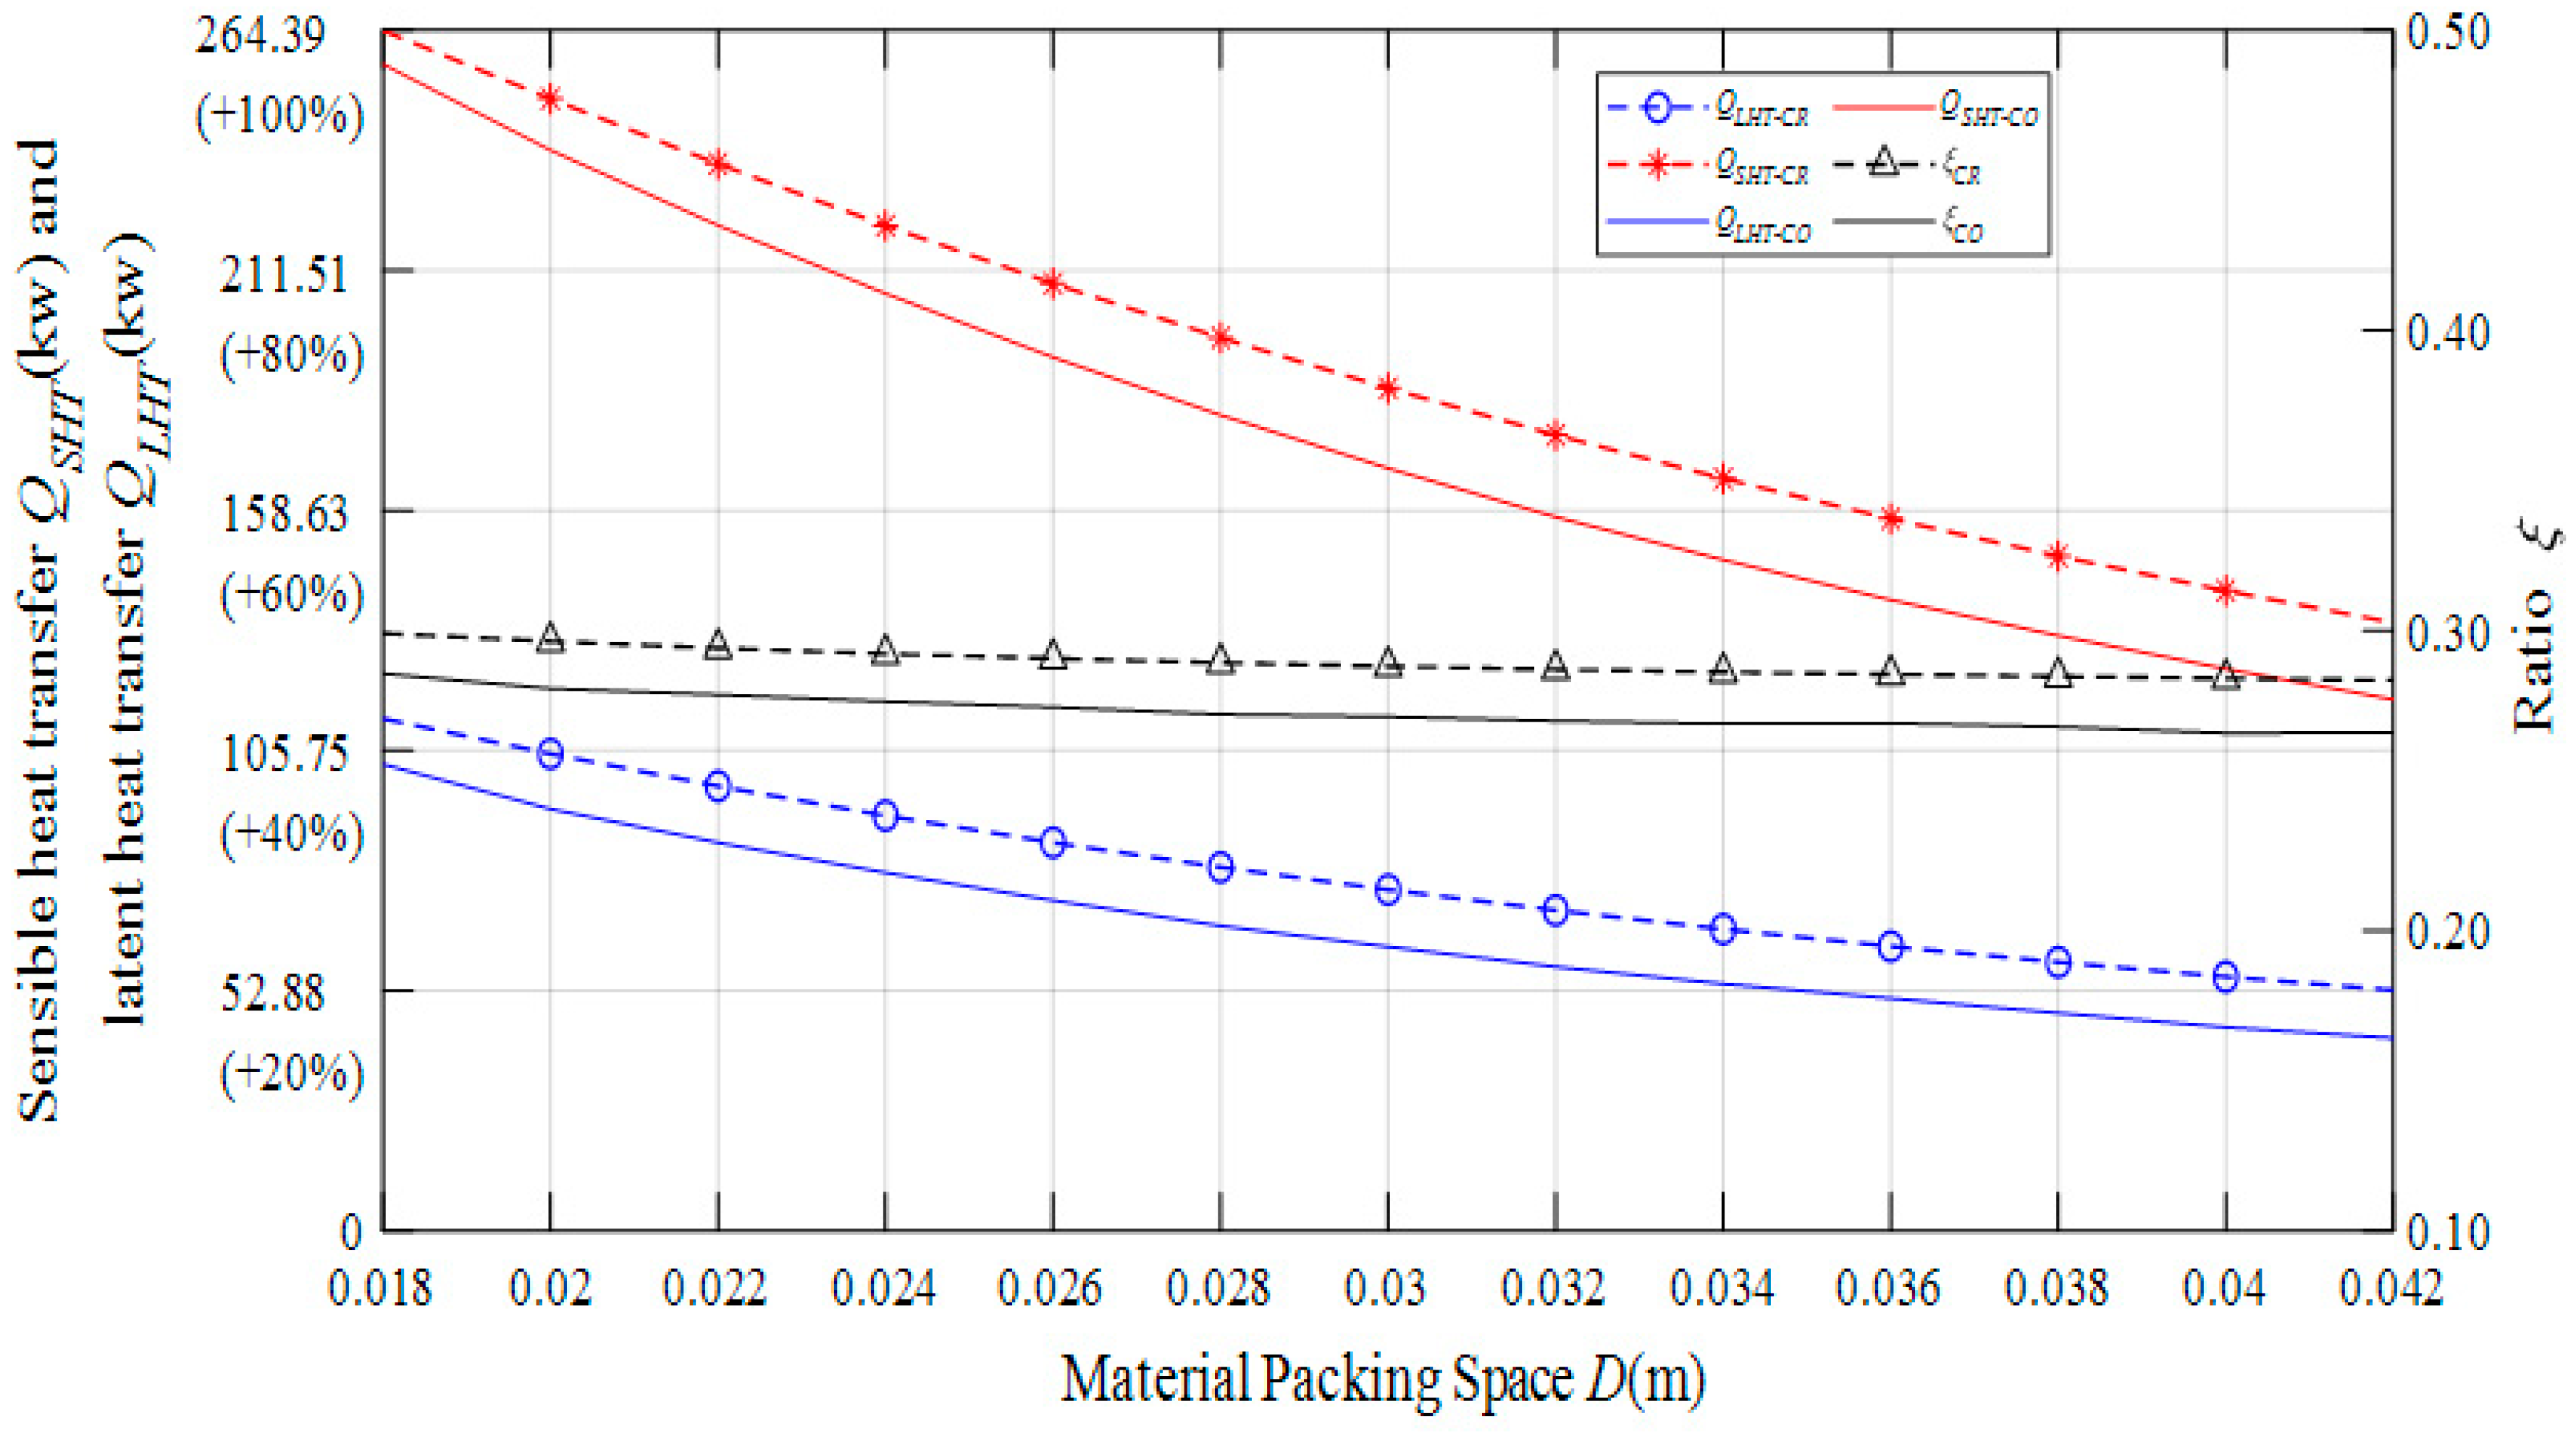
4.3.1. Impact of Material Packing Space

The influence of material packing space with SHT and LHT is presented in Figure 17. The counter-flow SHT decreases from 257 kW to 117 kW with the cross-flow SHT varies from 264.4 kW to 133.9 kW. Moreover, the counter-flow LHT decreases from 102.8 kW to 42.39 kW as the cross-flow varies from 112.8 kW to 52.98 kW. Furthermore, it is also seen that the value of ξ keeps decreasing slightly with the increase of material packing space. The cross-flow ξ decreases from 0.2991 to 0.2835 and from 0.2856 to 0.2666 for counter-flow. The above results indicate that the solution material packing space should be as small as possible under demand.

4.3.2. Impact of Material Porosity

The influence of material porosity with SHT and LHT is proposed in Figure 18. The counter-flow SHT increases from 109.4 kW to 168 kW with the cross-flow SHT varies from 125.8 kW to 185.6 kW. Moreover, the counter-flow LHT increases from 39.6 kW to 62.52 kW when the cross-flow varies from 49.63 kW to 75.1 kW. Furthermore, it is also seen that the value of ξ keeps increasing slightly with the increase of material porosity. The counter-flow ξ increases from 0.265 to 0.272 and from 0.282 to 0.288 for cross-flow.

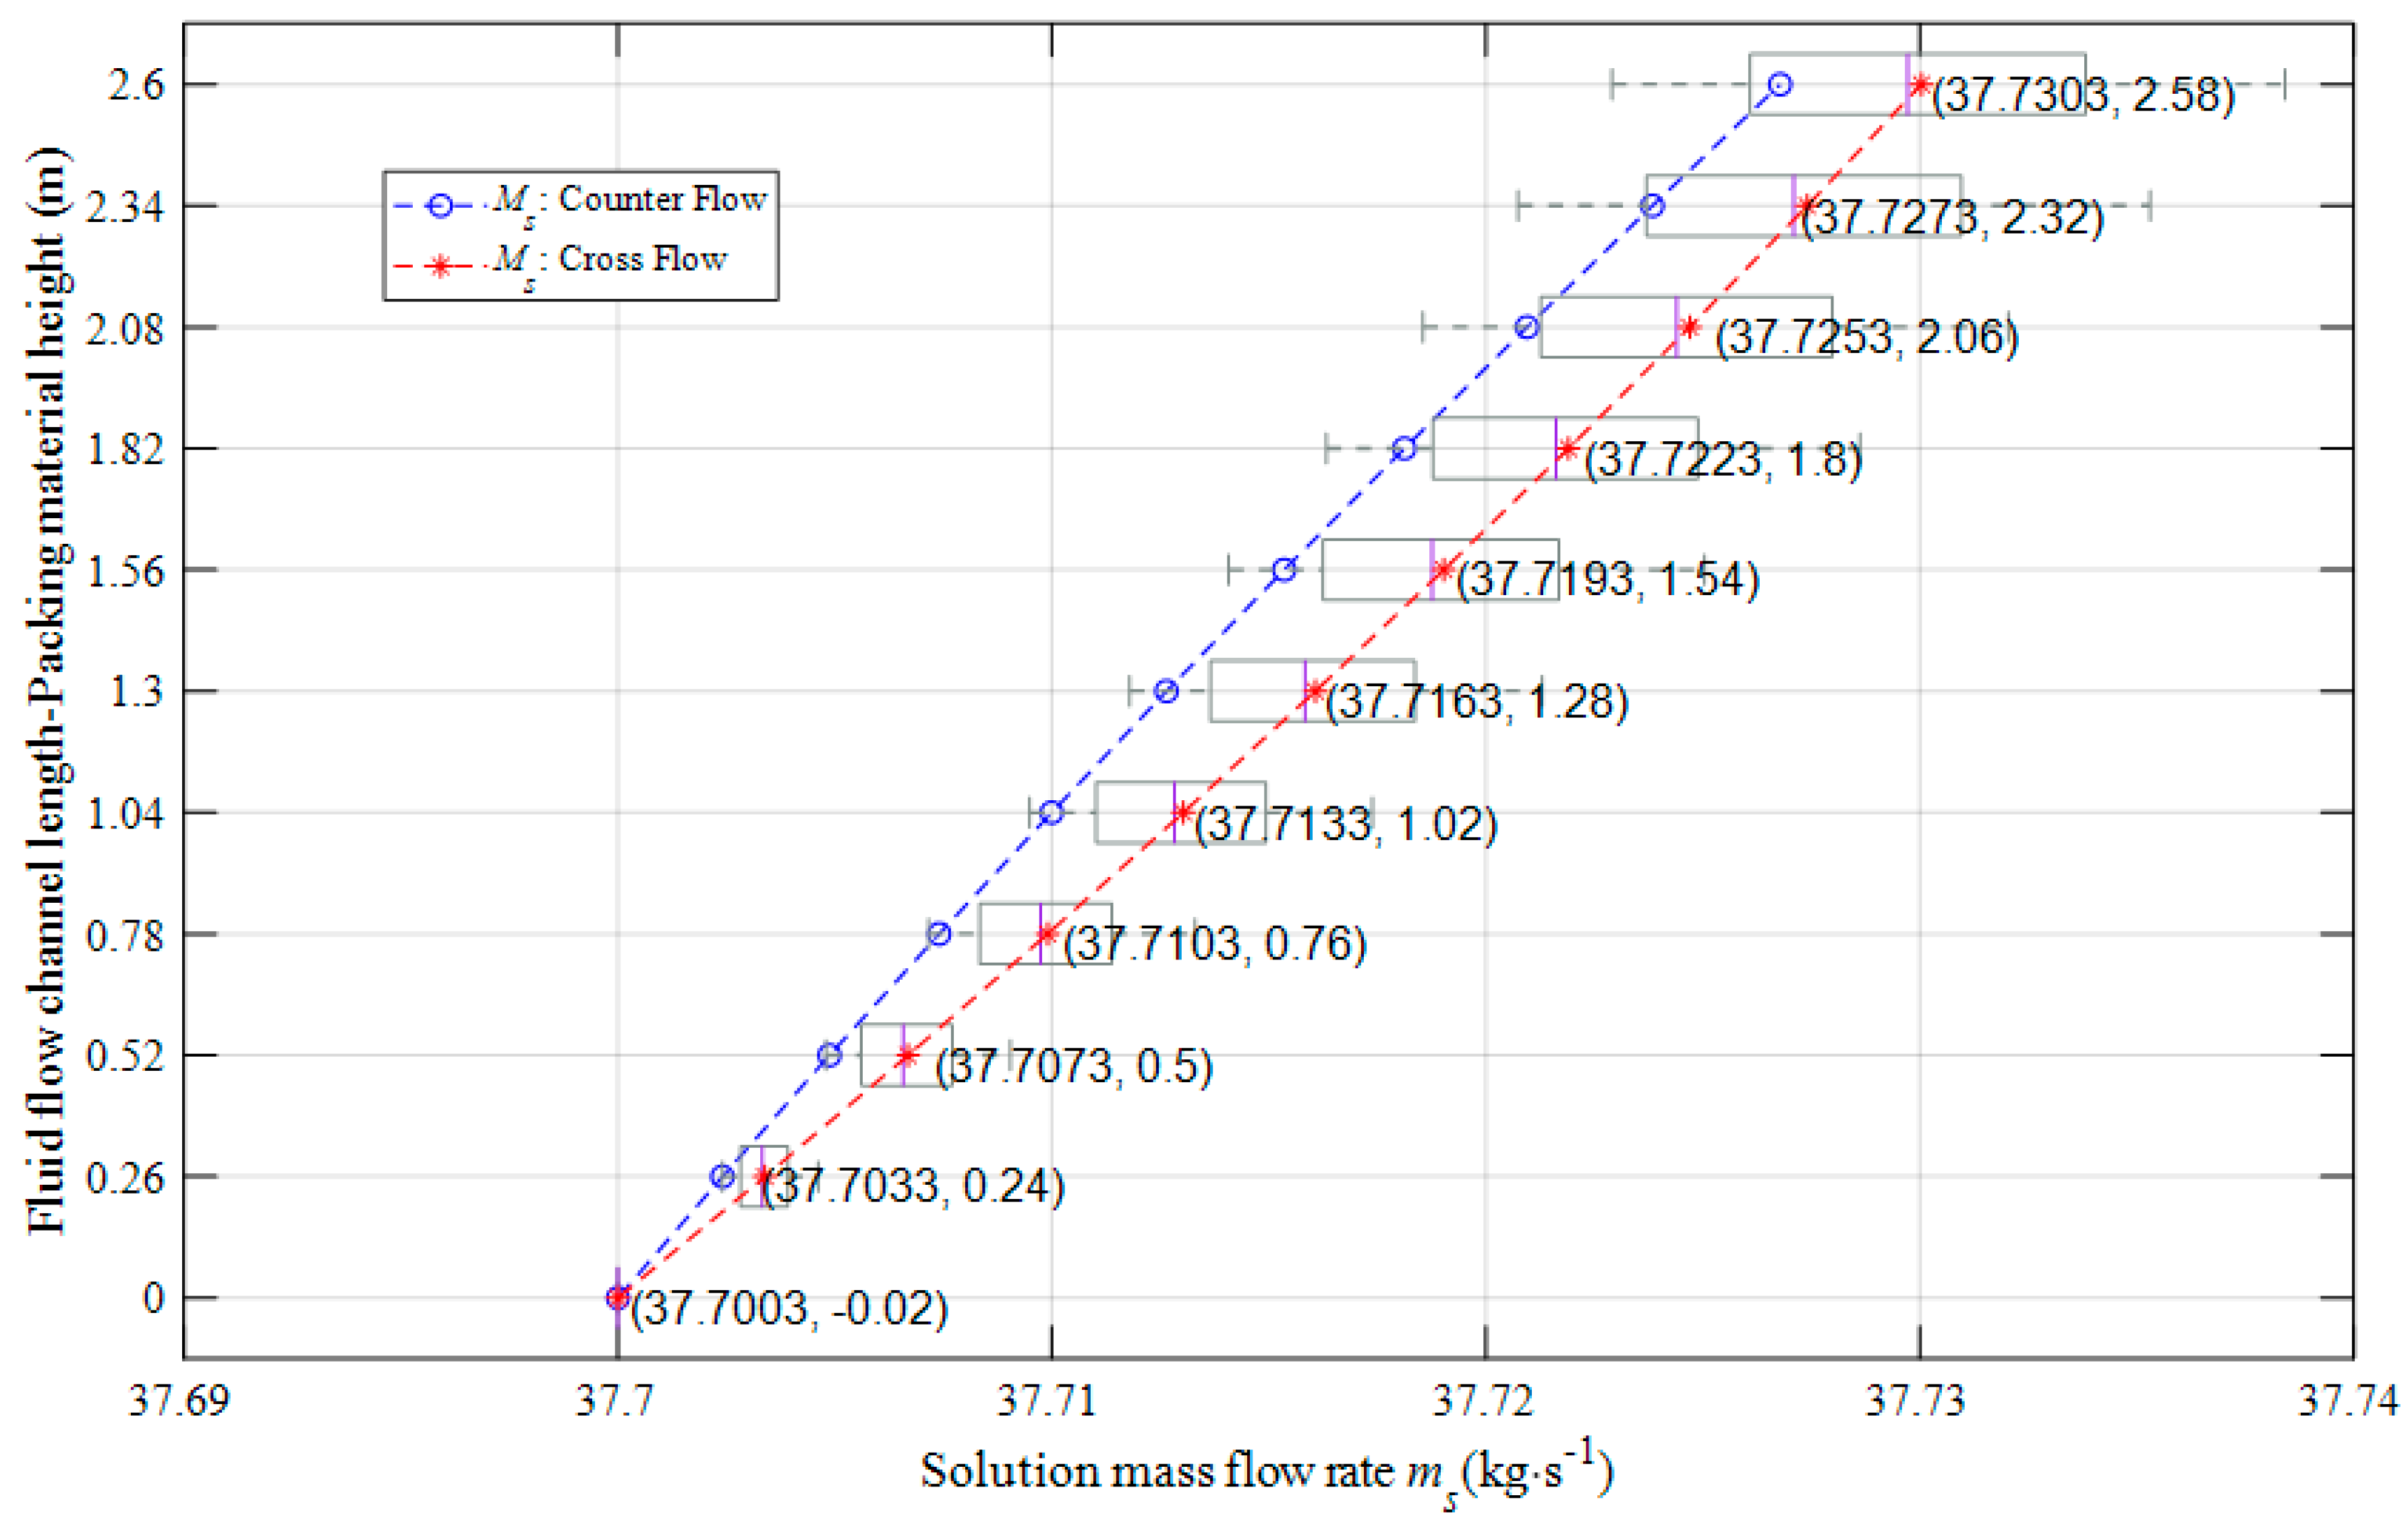
4.4. Investigation on Solution Dilution Characteristics

The above parametric study about air, solution and packing material revealed the effect on energy transfer, then the previous research has specifically shown a strong link between mass flow as well as humidity ratio and LHT. Nevertheless, LHT derives from moisture transfer between air and solution which may cause the solution freezing point to raise and even the HST system to break down. Thus, there are further reasons to investigate solution dilution characteristics thoroughly.
When the air relative humidity varies from 10% to 100%, the direction of moisture transfer also changes, which as shown in Figure 19. First, when the air relative humidity within 10–49%, the solution in both cross-flow and counter-flow HST is dehumidified, while, the air is humidified. Second, when the air relative humidity is between 49–60%, the direction of moisture transfer will be reversed in counter-flow HST, in other words, the solution will be diluted and dehumidified for counter-flow and cross-flow, respectively. Third, when the air relative humidity higher than 60%, solution in both cross-flow and counter-flow HST are diluted, while the air is dehumidified. Therefore, it can be seen from the previous research that although cross-flow HST has a better energy transfer coefficient than the counter-flow, the counter-flow HST can operate under 49–60% air relative humidity, while the cross-flow HST can only operate above 60% air relative humidity in winter.
Further analysis needs to be performed on the moisture transfer of internal HST under 50% air relative humidity conditions, in order to analyze the reasons why the mass transfer direction changed. The variation of air humidity ratio in the air flow ωa and air humidity ratio at the air-solution interface ωs along the fluid flow channel length under 50% air relative humidity are shown in Figure 20. As the air flows upward, the difference in humidity ratio between the solution boundary layer and the air decreases below 0.78 m height, for counter-current HST, meanwhile, the solution humidity ratio is always higher than the air humidity ratio, this suggests that the air absorbs moisture from the solution. Conversely, the solution absorbs moisture from the air above the 0.78 m. For cross-flow, there is a transition zone, which lies between 0.26–1.56 m. Ultimately, the solution absorbed moisture from the air for whole packing material, and the moisture transfer rate is 0.8933 g/s and −11.01 g/s for counter-flow and cross-flow respectively. It can be concluded that moisture transfer occurs in different directions at different heights, the transition surface is located in the 0.78 m for counter-flow and 0.26–1.56 m for cross-flow of the material packing height under 50% air relative humidity.

5. Conclusions

This paper numerically investigated the energy transfer characteristics in the HST with packing material. A mathematical model validated by experiments was developed for predicting the HST, considering counter-flow and cross-flow simultaneously. The main conclusions are as follows:
  • A higher air inlet temperature can improve the energy transfer performance of the HST. The above studies illustrated that as the inlet air temperature increases, the SHT increases, while the LHT and ξ are decreased, especially for cross-flow. Besides, the air inlet temperature leads to a significant effect on the SHT and ξ, but has little influence on the LHT. Conversely, when the air humidity ratio increases, the LHT increases, while the SHT and ξ decrease. Moreover, the inlet air humidity ratio causes a pivotal contribution to the LHT and ξ but has little amelioration effect on the SHT. However, the air inlet mass flow rate leads to a functional increase in both SHT and LHT.
  • The results have shown that inlet solution temperature greatly decreases the ability of SHT and LHT, and both SHT and LHT decrease when the solution inlet temperature increases. Further, as the inlet solution temperature increases, ξ increases first, then decreases gradually, but a transition point occurs in the solution at −5 °C. In addition, the solution mass flow rate has little influence on SHT and LHT.
  • The variation of packing space is opposite to that of packing porosity. The SHT and the LHT are simultaneously reduced as the packing space increases. Meanwhile, the SHT and the LHT increase as the packing porosity increases. The influence of the packing spacing on the energy transfer is higher than that of the packing porosity. Additionally, counter-flow HST is less affected than cross-flow. The results have found that solution material packing space should be as small as possible under demand conditions.
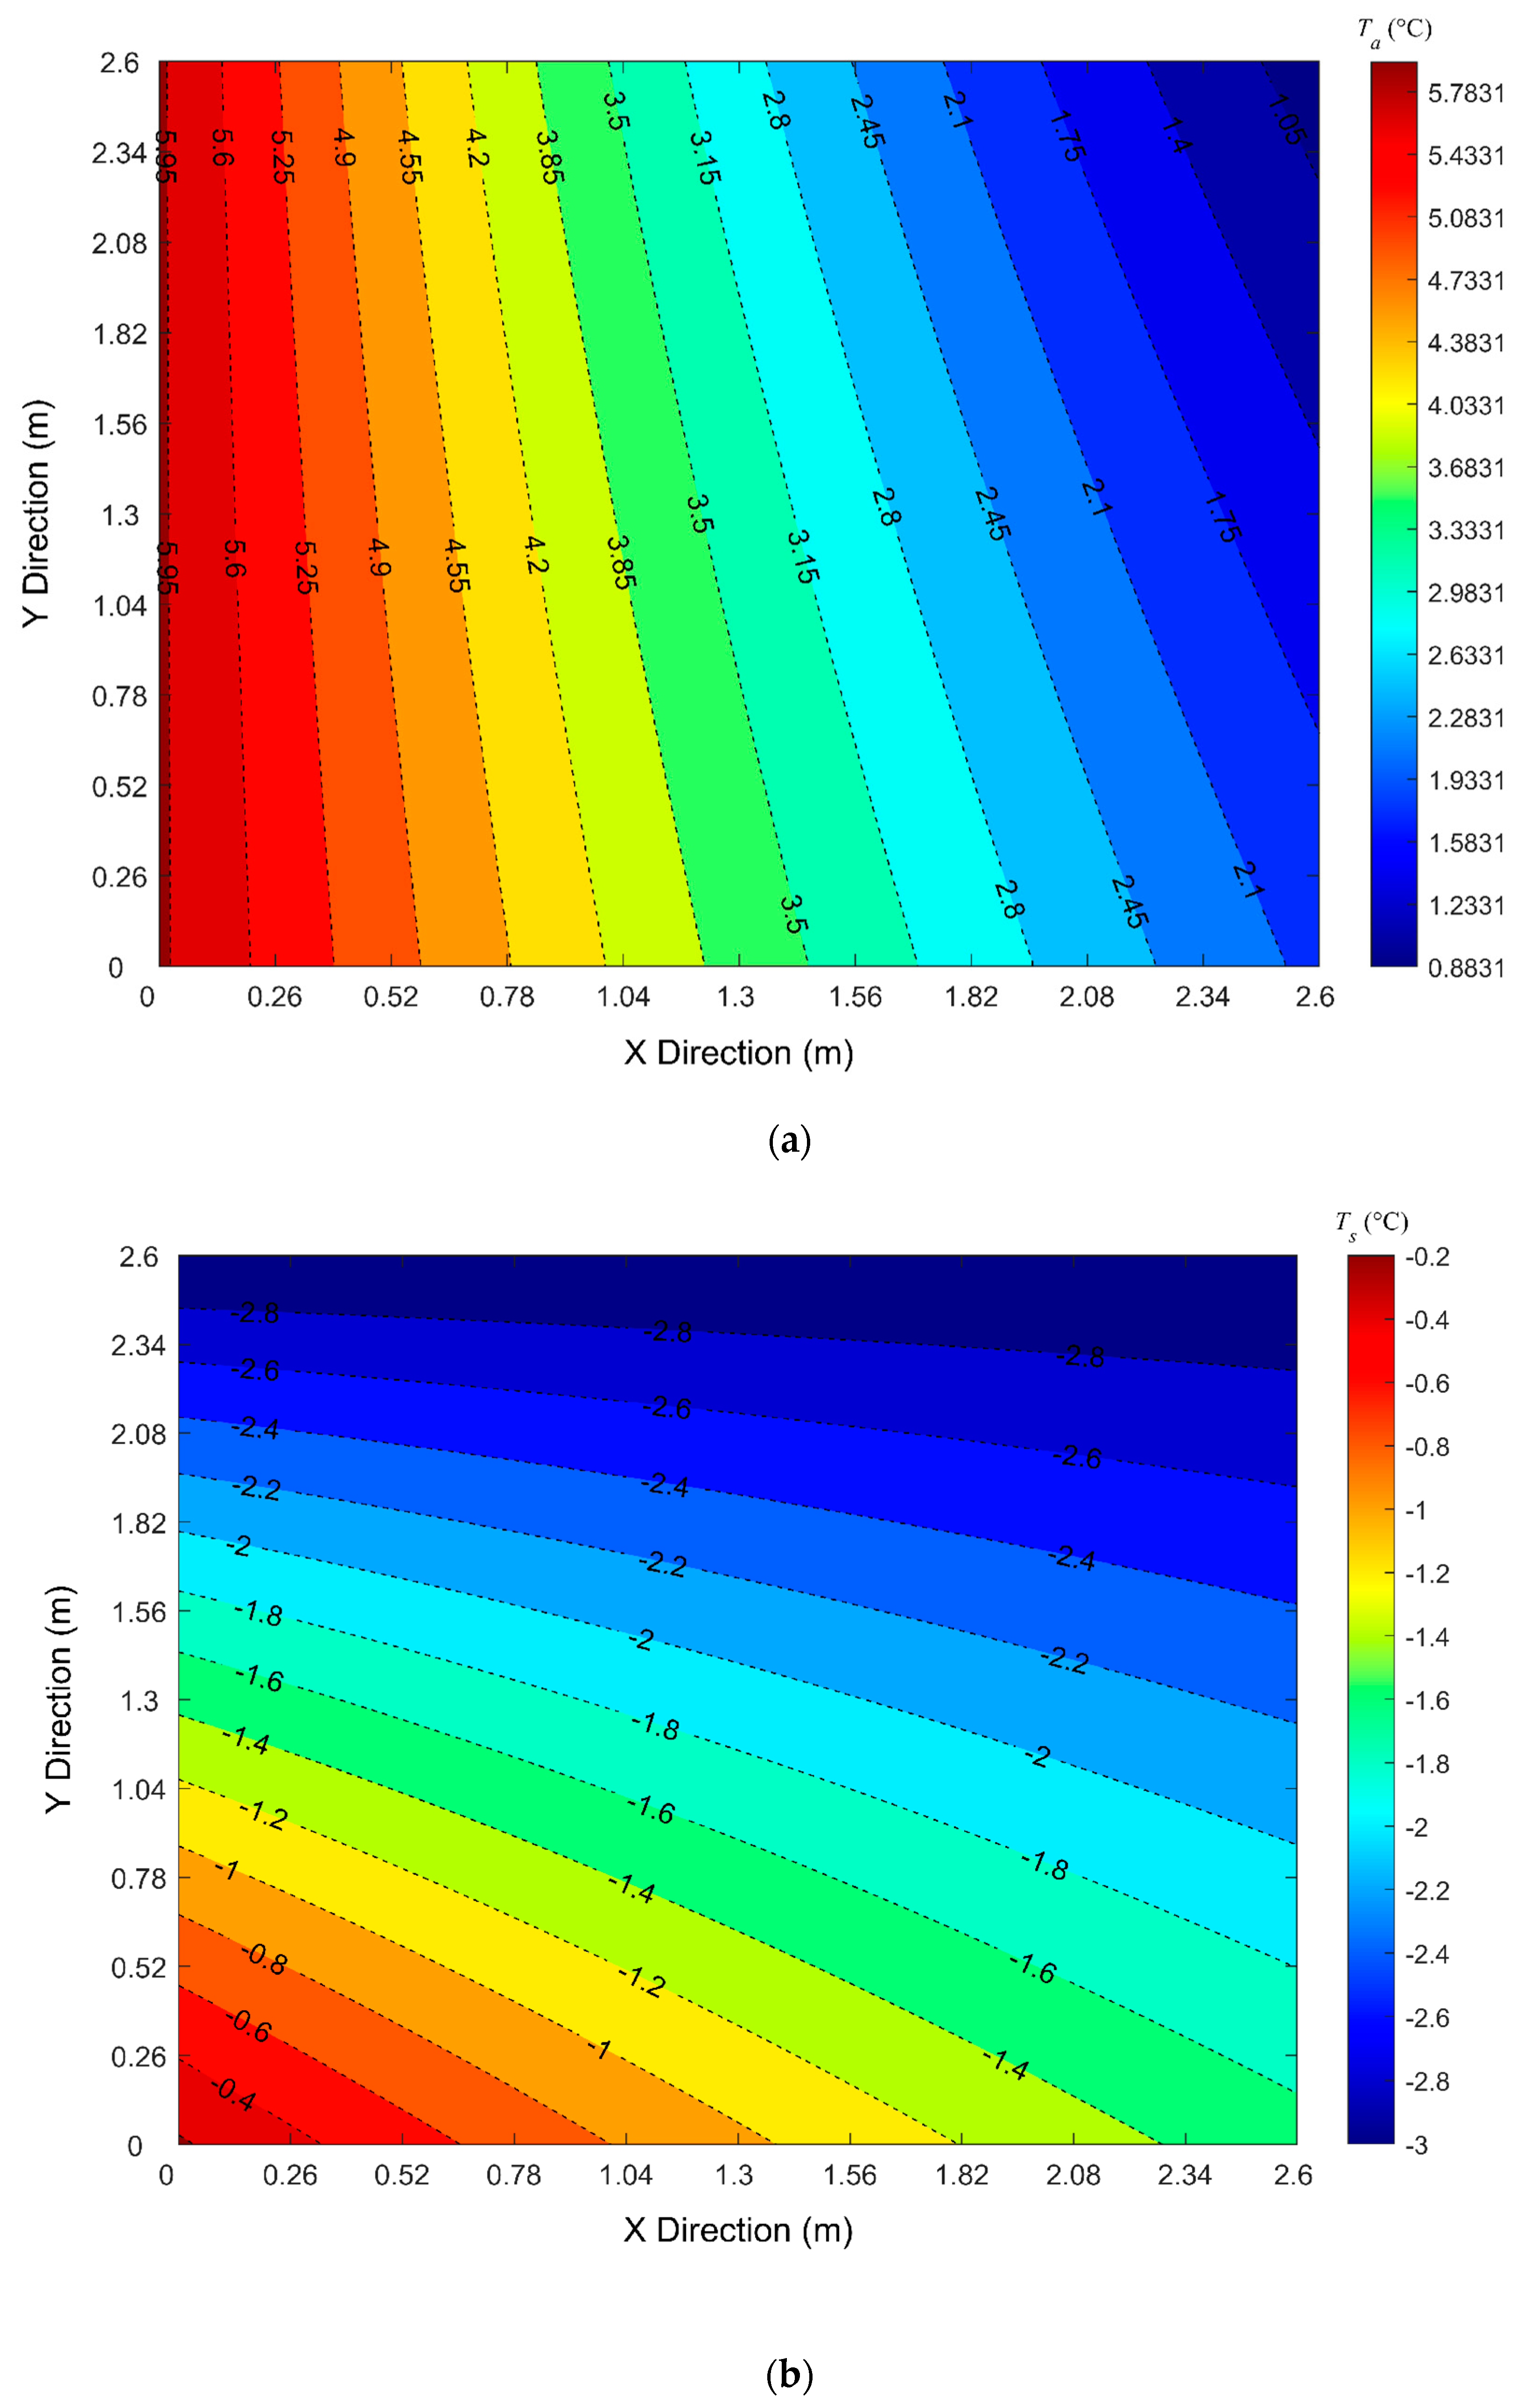
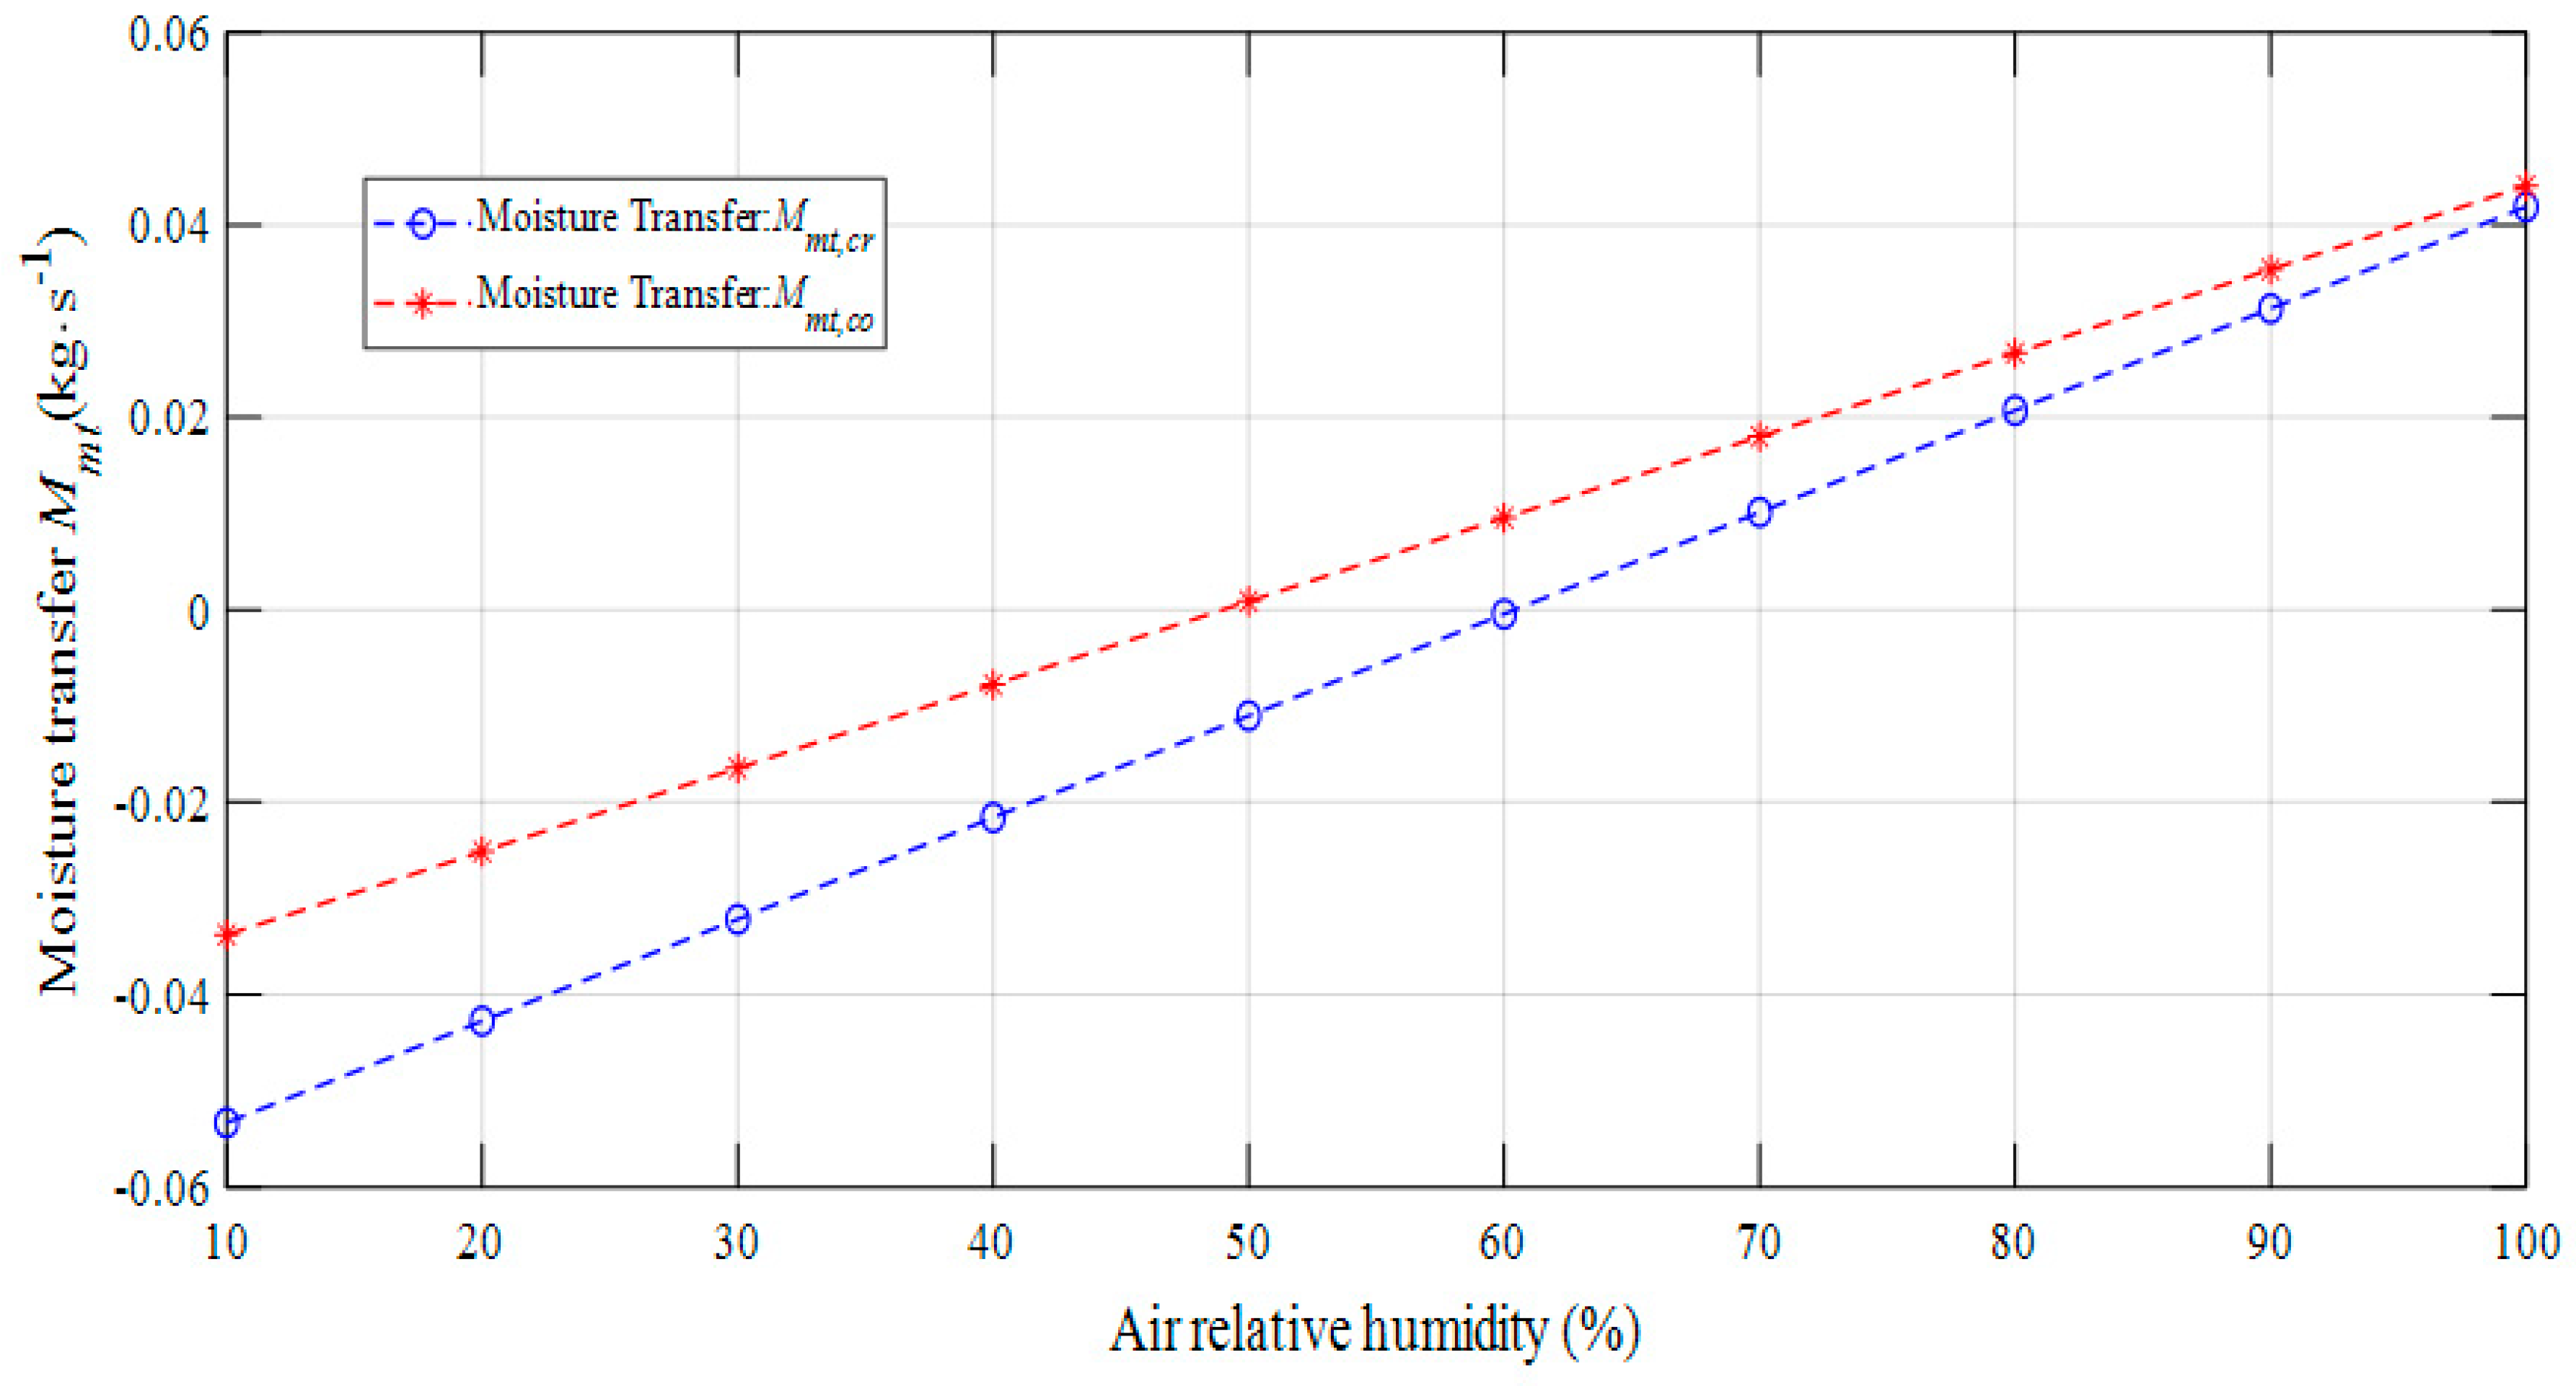
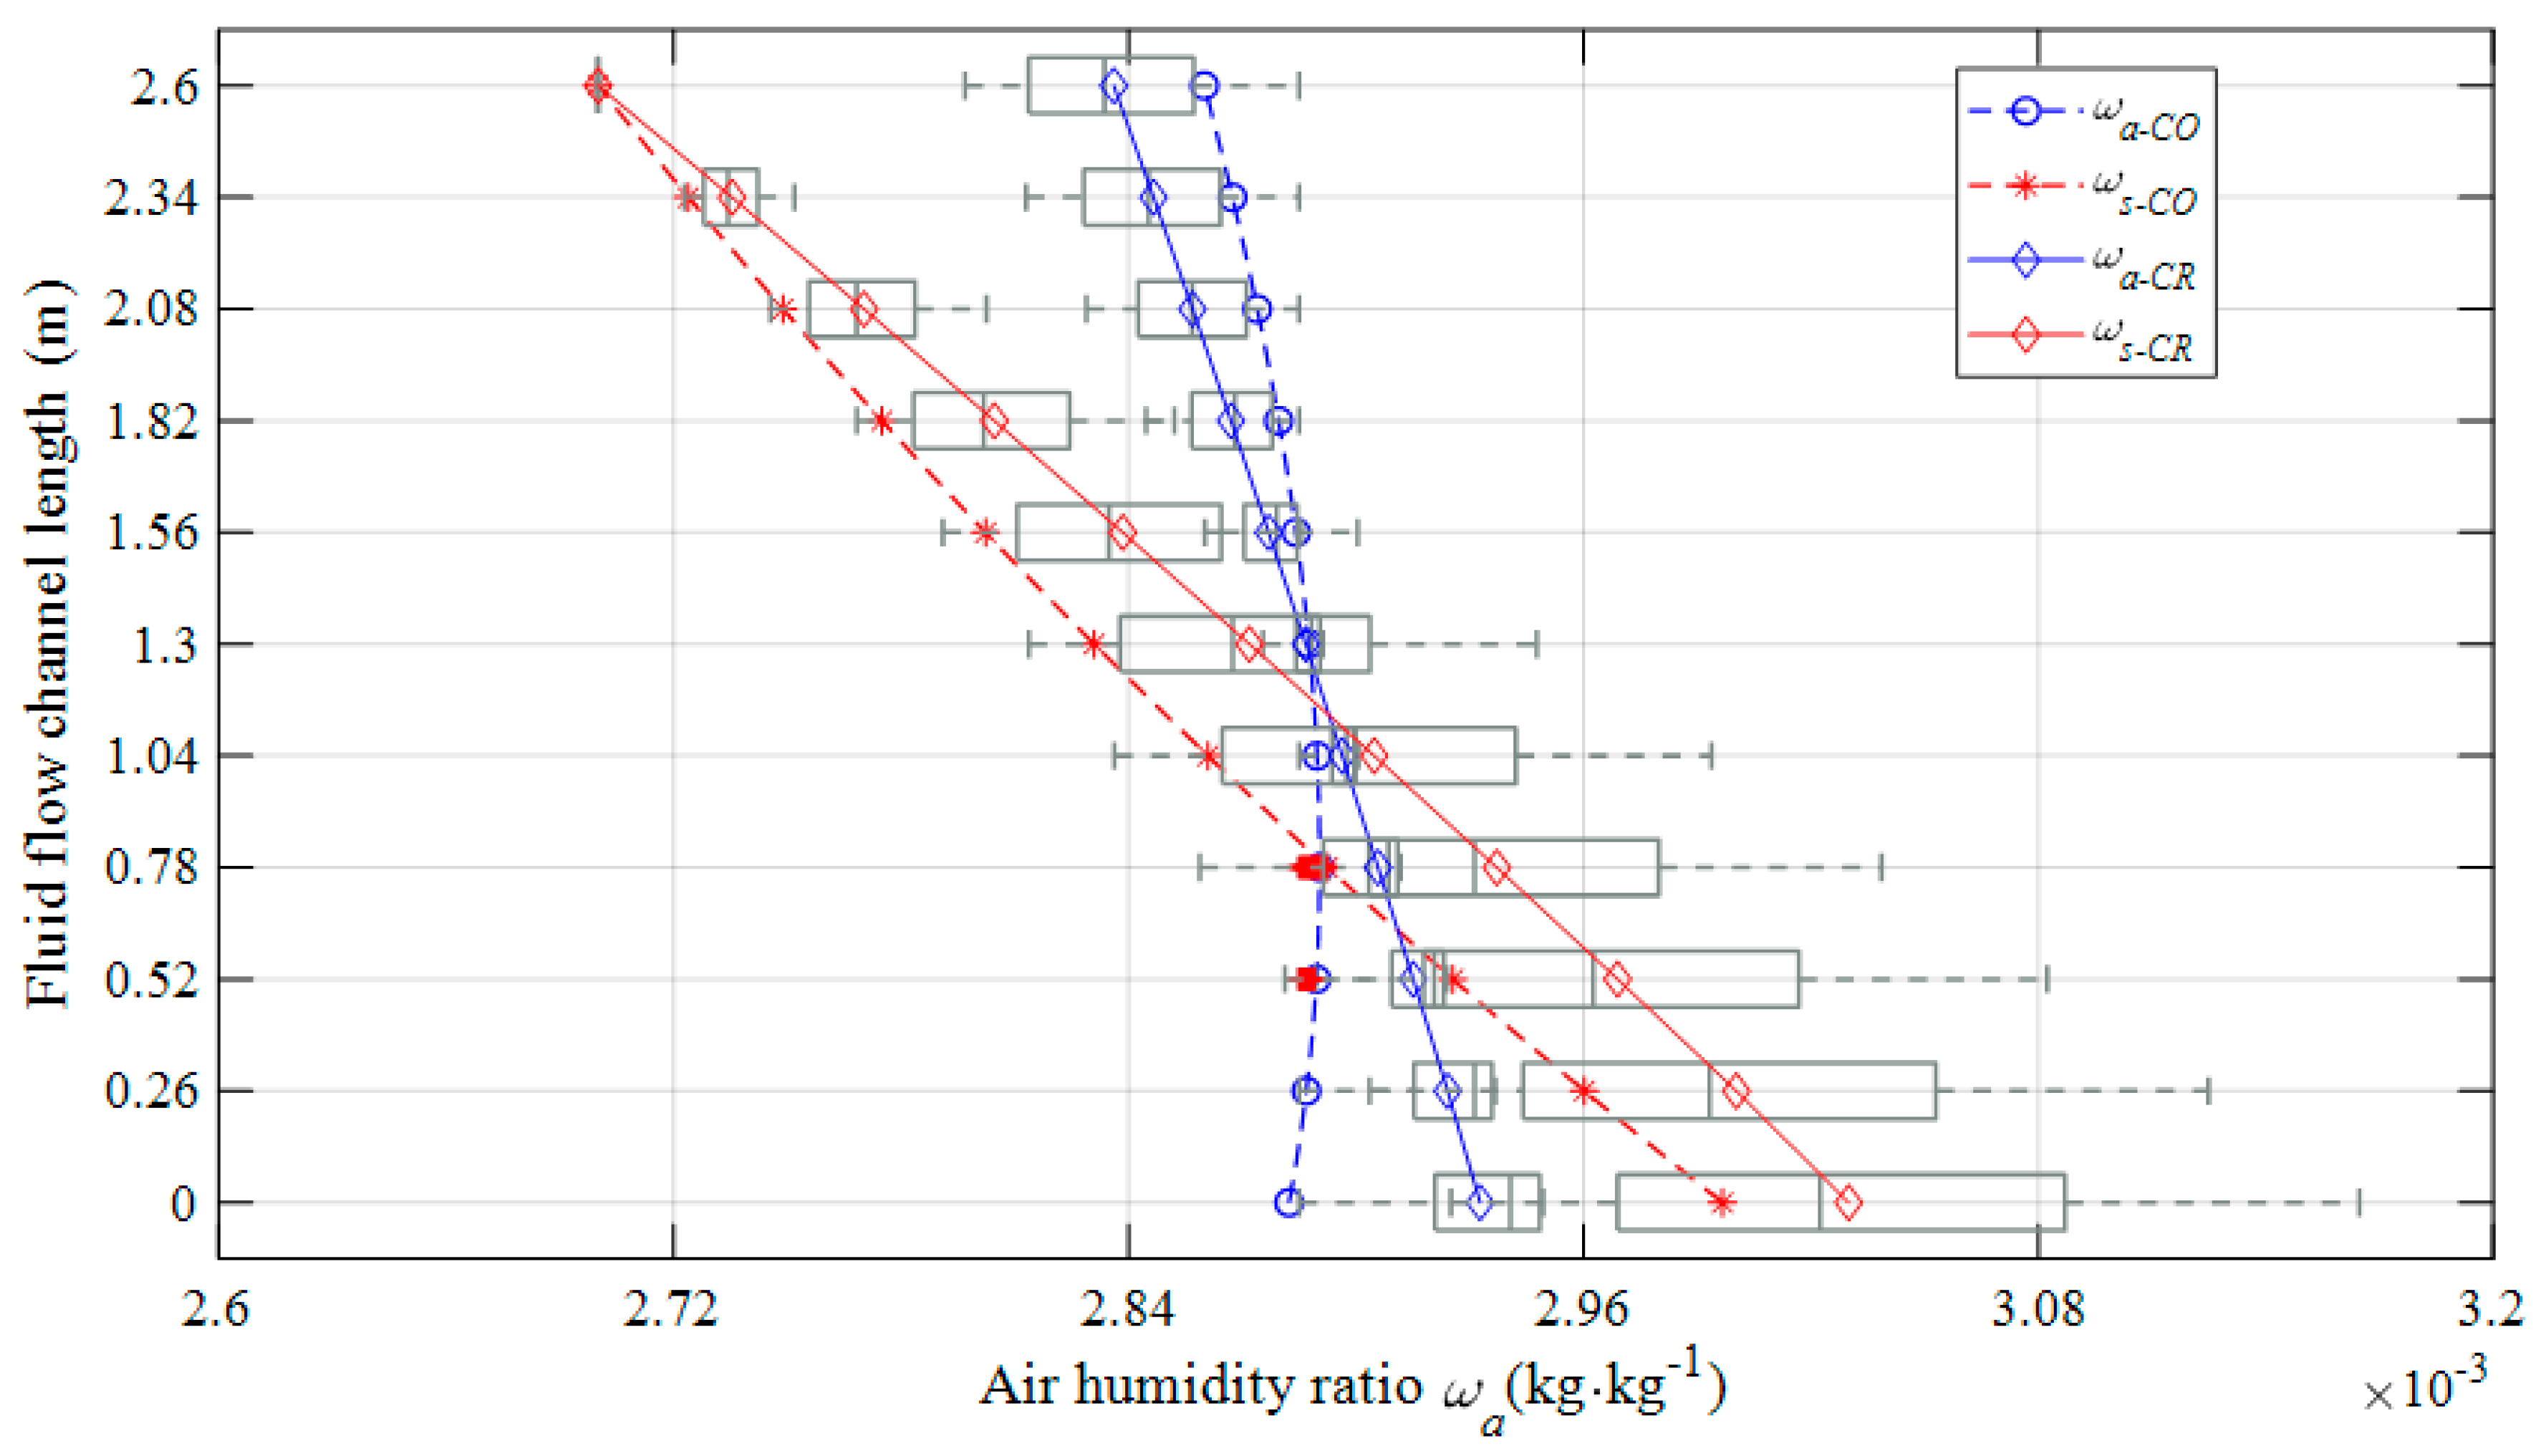
  • The mass transfer amount and direction vary with the air relative humidity. The transition air relative humidity of the mass transfer direction is 50% and 60%, respectively, for the counter-flow and cross-flow HST. It also can be concluded that moisture transfer occurs in different directions at different heights, the counter-flow transition surface is located at 0.78 m, while the cross-flow transition area lies between 0.26–1.56 m of the material packing height under 50% air relative humidity.

Author Contributions

Conceptualization, Y.L. (Yifei Lv); methodology, Y.L. (Yifei Lv); software, L.Y. (Lulu Yang); validation, L.Y. (Linlin Yuan); formal analysis, Y.L. (Yongcai Li) and L.X.; investigation, J.L.; resources, J.L.; data curation, L.X.; writing—original draft preparation, Y.L. (Yifei Lv); writing—review and editing, Y.L. (Yifei Lv); visualization, Y.L. (Yongcai Li); supervision, J.L.; project administration, J.L.; funding acquisition, J.L. All authors have read and agreed to the published version of the manuscript.

Funding

This work was supported by the National Science Foundation of China [No. 51478058 and No. 51708054].

Conflicts of Interest

The authors declare no conflict of interest.

Nomenclature

APacking material heat and mass transfer surface, m2
CpSpecific heat of air, kJ · kg 1 · K 1
C p , H 2 O Specific heat of water, kJ · kg 1 · K 1
DMaterial packing space, (m)
DaDiffusion coefficient of water vapor in the air, m 2 · s 1
dsThe equivalent diameter of the packing material, m
WWidth of the packing material, m
HEnthalpy, kJ · k g 1
HiThe sum of the enthalpy entering the control volume, kJ · k g 1
HoThe sum of the enthalpy flowing out of the control volume, kJ · k g 1
HsSolution enthalpy, kJ · k g 1
Hi,j,sSolution control volume enthalpy in row i and column j, kJ · k g 1
HaAir enthalpy, kJ · k g 1
Hi,j,aAir control volume enthalpy in row i and column j, kJ · k g 1
hcHeat transfer coefficient, W · m 2 · K 1
hmMass transfer coefficient, W · m 2 · K 1
KaThe thermal conductivity of air, W · m 1 · ° C 1
KThe grid numbers in the y directions
LeLewis number
LLength of the packing material, m
maAir mass flow rate, kg · s 1
mi,j,aAir control volume mass flow rate in row i and column j, kg · s 1
MaiInlet air mass flow rate, kg · s 1
MmtMoisture transfer, g · s 1
msSolution mass flow rate, kg · s 1
mi,j,sSolution control volume mass flow rate in row i and column j, kg · s 1
Ms,iInlet solution mass flow rate, kg · s 1
NThe grid numbers in the x-directions
NTUmMass transfer unit number
PatmLocal standard atmospheric pressure, kPa
PcCritical pressure of water, kPa
PfSolution vapor partial pressure on the boundary layer of the solution, kPa
PrPrandtl number
rWater latent heat of condensation at 0 °C, kJ · k g 1 · k 1
ReReynolds number
ScSchmidt number
ShSherwood number
QSHTSensible heat transfer, kW
QSHT–CrCross-flow sensible heat transfer, kW
QSHT–CoCounter-flow sensible heat transfer, kW
QLHTLatent heat transfer, kW
QLHT–CrCross-flow latent heat transfer, kW
QLHT–CoCounter-flow latent heat transfer, kW
TaAir temperature, °C
Ta,iInlet air temperature, °C
TcThe critical temperature of the water, K
Tssolution temperature, °C
Ts,o–CrCounter-flow outlet solution temperature, °C
Ts,o–CoCross-flow outlet solution temperature, °C
Ts,iInlet solution temperature, °C
Ts,oOutlet solution temperature, °C
BHeight of the packing material, m
ωsSolution boundary layer humidity ratio, kg · k g 1
ωs,CoCounter-flow solution boundary layer humidity ratio, kg · k g 1
ωs,CrCross-flow solution boundary layer humidity ratio, kg · k g 1
ωsi,jSolution boundary layer control volume humidity ratio in row i and column j, kg · k g 1
ωaAir humidity ratio, kg · k g 1
ωa,CoCounter-flow air humidity ratio, kg · k g 1
ωa,CrCross-flow air humidity ratio, kg · k g 1
ωai,jAir control volume humidity ratio in row i and column j, kg · k g 1
ωa,iInlet air humidity ratio, kg · k g 1
ζi,jsolution control volume concentration in row i and column j, mol · k g 1
ξCoCounter-flow ratio of latent heat transfer to total heat transfer
ξCrCross-flow ratio of latent heat transfer to total heat transfer
Subscripts
aAir
CoCounter-flow
CrCross-flow
iInlet
oOutlet
sSolution
LHTLatent heat transfer
SHTSensible heat transfer
mtMoisture transfer
PConstant pressure
Superscripts
iThe ith control volume
jThe jth control volume
Greek symbols
ωHumidity ratio, kg · k g 1
ζSolution concentration, mol · k g 1
βPacking material porosity
ρaAir density, kg · m 3
ρsSolution density, kg · m 3
ξThe ratio of latent heat transfer to total heat transfer

Appendix A

Table A1. The calculated and experimental values of cross-flow HST.
Time T a , i E   ( ° C ) T s , i E   ( ° C ) ω a , i E   ( k g / k g ) T a , o E   ( ° C ) T a , o C   ( ° C ) T s , o E   ( ° C ) T s , o C   ( ° C ) ω a , o E   ( kg / kg ) ω a , o C   ( kg / kg )
14:3011.252.170.006276.916.583.483.50.005460.00535
14:3511.202.320.006247.197.183.473.470.005700.00562
14:4011.302.150.006267.447.583.493.490.005830.00578
14:4511.152.240.006217.547.333.53.50.005790.00563
14:5011.182.240.006247.247.033.513.490.005670.00579
14:5511.202.160.006226.646.783.53.510.005470.00563
15:0011.182.250.006196.516.273.493.510.005430.00528
15:0511.182.130.006206.386.633.483.450.005390.00525
15:1011.102.120.006166.266.333.493.530.005330.0052
15:1511.202.150.006236.186.323.513.500.005320.0053
15:2011.152.110.006176.156.433.53.480.005310.00515
15:2511.252.230.006256.16.073.513.520.005290.00514
15:3011.202.260.006216.086.193.533.520.005290.00528
15:3511.182.230.006176.086.133.553.520.005290.00537
15:4011.222.250.006206.16.323.563.590.005300.00537
15:4511.152.250.006166.136.393.573.560.005300.00538
15:5011.252.250.006196.26.173.563.540.005330.00534
15:5511.202.120.006186.186.093.553.560.005320.00535
16:0011.202.310.006186.136.033.543.570.005320.00542
16:0511.052.230.006116.186.353.523.50.005330.00548
16:1011.272.140.006166.236.293.533.540.005340.00537
16:1511.102.330.006136.266.303.553.580.005350.00522
16:2011.392.30.006176.416.453.563.540.005410.00528
16:2511.492.30.006216.516.393.543.540.005450.00543
16:3011.372.270.006146.566.263.523.510.005470.00534
16:3511.392.280.006176.566.313.533.510.005470.00553
16:4011.392.20.006166.546.313.523.50.005450.00561
16:4511.252.280.006146.546.403.533.560.005450.00534
16:5011.222.280.006126.546.503.523.530.005450.00558
16:5511.152.280.006106.566.473.513.490.005470.00535
17:0010.832.320.006106.486.163.523.520.005450.00534
17:0511.012.260.006136.516.493.53.530.005460.00557
17:1011.082.150.006188.177.983.53.530.005970.00607
17:1511.422.270.006217.046.813.513.490.005560.00544
17:2011.542.180.006237.076.913.493.460.005570.0054
17:2511.322.290.006187.097.063.53.480.005590.00562
17:3011.272.220.006187.126.973.523.510.005590.00557
17:3511.222.20.006157.147.403.533.560.005610.00576
17:4011.202.220.006227.327.373.533.520.005680.00563
17:4511.182.280.006237.347.583.543.510.005680.00575
17:5011.422.20.006237.577.913.553.550.005770.00562
17:5511.422.170.006227.627.783.543.550.005800.00589
18:0011.252.270.006177.657.763.563.560.005800.00577
18:0511.222.230.006237.77.823.573.580.005810.00585
18:1011.302.270.006257.757.613.553.580.005830.00571
18:1511.352.230.006267.88.113.533.550.005850.00599

References

  1. Cui, H.; Li, N.; Peng, J.; Cheng, J.; Li, S. Study on the dynamic and thermal performances of a reversibly used cooling tower with upward spraying. Energy 2016, 96, 268–277. [Google Scholar] [CrossRef]
  2. Cui, H.; Li, N.; Peng, J.; Yin, R.; Li, J.; Wu, Z. Investigation on the thermal performance of a novel spray tower with upward spraying and downward gas flow. Appl. Energy 2018, 231, 12–21. [Google Scholar] [CrossRef]
  3. Cui, H.; Li, N.; Wang, X.; Peng, J.; Li, Y.; Wu, Z. Optimization of reversibly used cooling tower with downward spraying. Energy 2017, 127, 30–43. [Google Scholar] [CrossRef]
  4. Huang, S.; Ye, Y.; Han, X.; Zuo, W.; Zhang, X.; Jiang, L. Performance evaluation of heating tower heat pump systems over the world. Energy Convers. Manag. 2019, 186, 500–515. [Google Scholar] [CrossRef]
  5. Man, Y.; Han, Y.; Hu, Y.; Yang, S.; Yang, S. Synthetic natural gas as an alternative to coal for power generation in China: Life cycle analysis of haze pollution, greenhouse gas emission, and resource consumption. J. Clean. Prod. 2016, 172, 2503–2512. [Google Scholar] [CrossRef]
  6. Zhang, Q.; Wu, J.; Zhang, G.; Zhou, J.; Guo, Y.; Shen, W. Calculations on performance characteristics of counterflow Reversibly Used Cooling Towers. Int. J. Refrig. 2012, 35, 424–433. [Google Scholar] [CrossRef]
  7. Chen, X.; Sun, F.; Chen, Y.; Gao, M. New retrofit method to improve the thermal performance of natural draft wet cooling towers based on the reconstruction of the aerodynamic field. Int. J. Heat Mass Transf. 2019, 132, 671–680. [Google Scholar] [CrossRef]
  8. Jahangiri, A.; Borzooee, A.; Armoudli, E. Thermal performance improvement of the three aligned natural draft dry cooling towers by wind breaking walls and flue gas injection under different crosswind conditions. Int. J. Therm. Sci. 2019, 137, 288–298. [Google Scholar] [CrossRef]
  9. Tan, K.; Deng, S. A numerical analysis of heat and mass transfer inside a reversibly used water cooling tower. Build. Environ. 2003, 38, 91–97. [Google Scholar] [CrossRef]
  10. Tan, K.; Deng, S. A simulation study on a water chiller complete with a desuperheater and a reversibly used water cooling tower (RUWCT) for service hot water generation. Build. Environ. 2002, 37, 741–751. [Google Scholar] [CrossRef]
  11. Zhang, L.; Wei, H.; Zhang, X. Theoretical analysis of heat and mass transfer characteristics of a counter-flow packing tower and liquid desiccant dehumidification systems based on entransy theory. Energy 2017, 141, 661–672. [Google Scholar] [CrossRef]
  12. Zhang, L.; Liu, X.; Wei, H.; Zhang, X. Experimental study and analysis of heat and mass transfer ability of counter-flow packing tower and liquid desiccant dehumidification system. Energy Build. 2018, 158, 150–161. [Google Scholar] [CrossRef]
  13. Vo, T.Q.; Kim, B.H. Interface thermal resistance between liquid water and various metallic surfaces. Int. J. Precis. Eng. Manuf. 2015, 16, 1341–1346. [Google Scholar] [CrossRef]
  14. Guo, Y.; Surblys, D.; Kawagoe, Y.; Matsubara, H.; Liu, X.; Ohara, T. A molecular dynamics study on the effect of surfactant adsorption on heat transfer at a solid-liquid interface. Int. J. Heat Mass Transf. 2019, 135, 115–123. [Google Scholar] [CrossRef]
  15. Surblys, D.; Kawagoe, Y.; Shibahara, M.; Ohara, T. Molecular dynamics investigation of surface roughness scale effect on interfacial thermal conductance at solid-liquid interfaces. J. Chem. Phys. 2019, 150. [Google Scholar] [CrossRef]
  16. Tan, K.; Deng, S. A method for evaluating the heat and mass transfer characteristics in a reversibly used water cooling tower ( RUWCT ) for heat recovery. Int. J. Refrig. 2002, 25, 552–561. [Google Scholar]
  17. Huang, S.; Lv, Z.; Liang, C.; Zhang, X. Experimental study of heat and mass transfer characteristics in a cross-flow heating tower. Int. J. Refrig. 2017, 77, 116–127. [Google Scholar] [CrossRef]
  18. Wang, Z.; Zhang, X.; Li, Z. Investigation on the coupled heat and mass transfer process between extremely high humidity air and liquid desiccant in the counter-flow adiabatic packed tower. Int. J. Heat Mass Transf. 2017, 110, 898–907. [Google Scholar] [CrossRef]
  19. Song, X.; Zhang, L.; Zhang, X. NTUm-based optimization of heat or heat pump driven liquid desiccant dehumidification systems regenerated by fresh air or return air. Energy 2018, 158, 269–280. [Google Scholar] [CrossRef]
  20. Wen, X.; Liang, C.; Zhang, X. Experimental study on heat transfer coefficient between air and liquid in the cross-flow heat-source tower. Build. Environ. 2012, 57, 205–213. [Google Scholar] [CrossRef]
  21. Huang, Y.; Ge, F.; Wang, C.; Hu, Z. Numerical study on the heat and mass transfer characteristics of the open-type cross-flow heat-source tower at low ambient temperature. Int. J. Heat Mass Transf. 2019, 145, 118756. [Google Scholar] [CrossRef]
  22. Liang, C.; Wen, X.; Liu, C.; Zhang, X. Performance analysis and experimental study of heat-source tower solution regeneration. Energy Convers. Manag. 2014, 85, 596–602. [Google Scholar] [CrossRef]
  23. Li, W.; Wang, H.; Wang, J.; Duan, C.; Zhao, Y. Effect mechanism of exit-water temperature distribution characteristics on the anti-freezing of natural draft dry cooling tower. Appl. Therm. Eng. 2019, 161. [Google Scholar] [CrossRef]
  24. Liu, X.H.; Jiang, Y.; Qu, K.Y. Heat and mass transfer model of cross flow liquid desiccant air dehumidifier/regenerator. Energy Convers. Manag. 2007, 48, 546–554. [Google Scholar] [CrossRef]
  25. Qi, X.; Liu, Z.; Li, D. Performance characteristics of a shower cooling tower. Energy Convers. Manag. 2007, 48, 193–203. [Google Scholar] [CrossRef]
  26. Zheng, S. Experimental Study of Heat Transfer Performance of Mechanical Draft Salt-water Cooling Tower.pdf; Zhejiang University: Hangzhou, China, 2012. [Google Scholar]
  27. Conde, M.R. Properties of aqueous solutions of lithium and calcium chlorides: Formulations for use in air conditioning equipment design. Int. J. Therm. Sci. 2004, 43, 367–382. [Google Scholar] [CrossRef]
  28. Al-Farayedhi, A.A.; Gandhidasan, P.; Al-Mutairi, M.A. Evaluation of heat and mass transfer coefficients in a gauze-type structured packing air dehumidifier operating with liquid desiccant. Int. J. Refrig. 2002, 25, 330–339. [Google Scholar] [CrossRef]
  29. Lu, J.; Li, W.; Li, Y.; Zeng, L.; Yang, L.; Xie, L.; Li, Q.; Wang, M. Numerical study on heat and mass transfer characteristics of the counter-flow heat-source tower (CFHST). Energy Build. 2017, 145, 318–330. [Google Scholar] [CrossRef] [Green Version]
Figure 1. Schematic diagram of fluid flow direction in packing material. (a): Counter-flow (b): Cross-flow.
Energies 13 02674 g001
Figure 2. Schematic of the HST operating mode.
Energies 13 02674 g002
Figure 3. Schematic diagram of the cross-flow and counter-flow HST control volume.
Energies 13 02674 g003
Figure 4. The finite difference method of cross-flow and counter-flow HST.
Energies 13 02674 g004
Figure 5. The flowchart of cross-flow and counter-flow HST program.
Energies 13 02674 g005
Figure 6. Schematic diagram of the experimental device setup.
Energies 13 02674 g006
Figure 7. The experimental data vs. the simulated data of cross-flow HST: (a) outlet solution temperature; (b)outlet air temperature Ta,o; (c)outlet air humidity ratio ωa,o.
Energies 13 02674 g007
Figure 8. Variation of fluid temperature within the fluid flow channel length.
Energies 13 02674 g008
Figure 9. Solution and air temperature distributions in the packing material (cross-flow): (a) Air temperature; (b) Solution temperature.
Energies 13 02674 g009
Figure 10. Variation of air humidity ratio within the fluid flow channel length.
Energies 13 02674 g010
Figure 11. Profile of solution mass flow rate along the fluid flow channel length.
Energies 13 02674 g011
Figure 12. Influence of inlet air temperature on energy transfer characteristics.
Energies 13 02674 g012
Figure 13. Influence of inlet air humidity ratio on energy transfer characteristics.
Energies 13 02674 g013
Figure 14. Influence of air inlet mass flow rate on energy transfer characteristics.
Energies 13 02674 g014
Figure 15. Influence of solution inlet temperature on energy transfer characteristics.
Energies 13 02674 g015
Figure 16. Influence of solution inlet mass flow rate on energy transfer characteristics.
Energies 13 02674 g016
Figure 17. Influence of material packing space on energy transfer characteristics.
Energies 13 02674 g017
Figure 18. Influence of material packing porosity on energy transfer characteristics.
Energies 13 02674 g018
Figure 19. Influence of the relative humidity on moisture transfer.
Energies 13 02674 g019
Figure 20. Variation of ωa and ωs along the fluid flow channel length—RH = 50%.
Energies 13 02674 g020
Table 1. The enthalpy calculation coefficient of calcium chloride [27]. Reproduced from [28], International Journal of Thermal Sciences: 2003.
Coefficientλ1λ2λ3λ4λ5λ6
Value0.855−1.965−2.2650.8−955.6903011.974
Table 2. Constant value for calculating.
abcdef
58.5225−105.634347.79481.63799−1.690021.05124
ξ1ξ2ξ3ξ4ξ5ξ6
88.7891−120.1958−16.926452.46540.108260.46988
Table 3. Experimental parameters and instruments.
ParametersPositionInstrumentsTypeAccuracyRange
AirFlow rateRotary AnemometerTesto±0.03 m/s0–20 m/s
Inlet Ta,i and ωa,iTemperature and Humidity RecorderHIOKI 3641-20T: ±0.5 °CT: −20.0 °C–70.0 °C
ω: ±5%ω: 0.0–100.0%
Outlet Ta,o and ωa,oTemperature and Humidity RecorderHIOKI 3641-20T: ±0.5 °CT: −20.0 °C–70.0 °C
ω: ±5%ω: 0.0–100.0%
SolutionFlow rateUltrasonic Flow meterDCT 1288±0.5%−12–12 m/s
Inlet Ts,iThermometerPt 100±1%−200 °C–650 °C
Outlet Ts,oThermometerPt 100±1%−200 °C–650 °C
Inlet ρsDensitometer-±0.010.6–2.0
Outlet ρsDensitometer-±0.010.6–2.0
Data Data automatic recorderAgilent 34970A--
Table 4. Simulation boundary conditions.
Simulation Condition T a , i   ( ° C ) T s , i   ( ° C ) M a , i ( k g · s 1 ) M s , i ( k g · s 1 ) ω a , i ( k g · k g 1 ) D(m)β
Inlet air temperature0–12−34037.70.00450.030.98
Inlet solution temperature6−10–+34037.70.00450.030.98
Inlet air mass flow rate6−310–8037.70.00450.030.98
Inlet solution mass flow rate6−34010–800.00450.030.98
Air inlet humidity ratio6−34037.70.0026–0.00540.030.98
Material packing space6−34037.70.00450.018–0.0420.98
Material porosity6−34037.70.00450.030.54–0.98

