To Whom Should We Grant a Power Plant? Economic Effects of Investment in Nuclear Energy in Poland


Abstract
:
1. Introduction
2. Background
2.1. Rationale for Nuclear Energy in Poland
2.2. Development of Nuclear Energy in Poland
- Capital costs: These include site preparation and building the reactor, which involve manufacturing (steel and concrete), construction services, commissioning, and financing not only nuclear power plant but also its immediate surrounding. That involves employment of thousands of workers as well.
- Plant operating costs: These include the costs of fuel, operation, and maintenance. An important part of this category is the costs of decommissioning the plant and managing the costs of waste and used fuel. Operating costs are divided into two subcategories: (a) fixed costs, which exist whether the plant is generating electricity or not, and (b) variable costs, which vary depending on the output.
- External costs to society: These are the societal costs of operating the plant, which in the case of nuclear power are sometimes neglected. These comprise, e.g., the costs of dealing with a serious accident exceeding limit of insurance and in practice shifted on the government.
- Other costs: These include system costs and nuclear-specific taxes.
2.3. Selection of Locations for Nuclear Power Plants
- Integration into the electric grid system
- Geology, tectonics, and volcanic studies
- Seismology and seismic engineering
- Hydrology (including ground water, floods, and tsunamis)
- Cooling water availability, intake, and discharge
- Demography and land use
- Meteorology and atmospheric dispersion (including wind patterns, tornados, and hurricanes)
- Study of flora and fauna
- Nuclear safety and radiation protection aspects
- General environmental effects
- Risks from man-made events
- Local infrastructure
- Cultural and historic sites
- Access and emergency response roads
- Air, land, and sea transportation patterns
- Legal aspects
- Public consultation
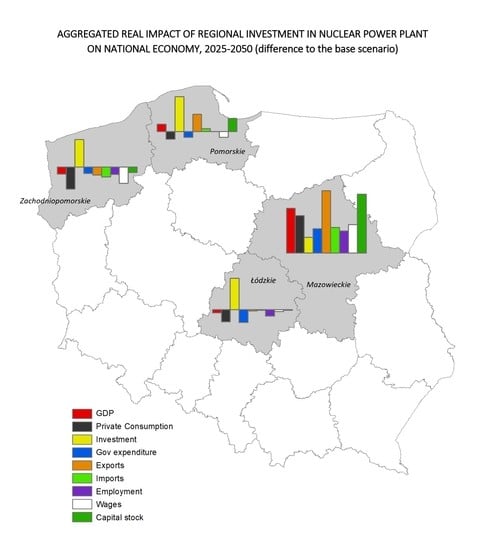
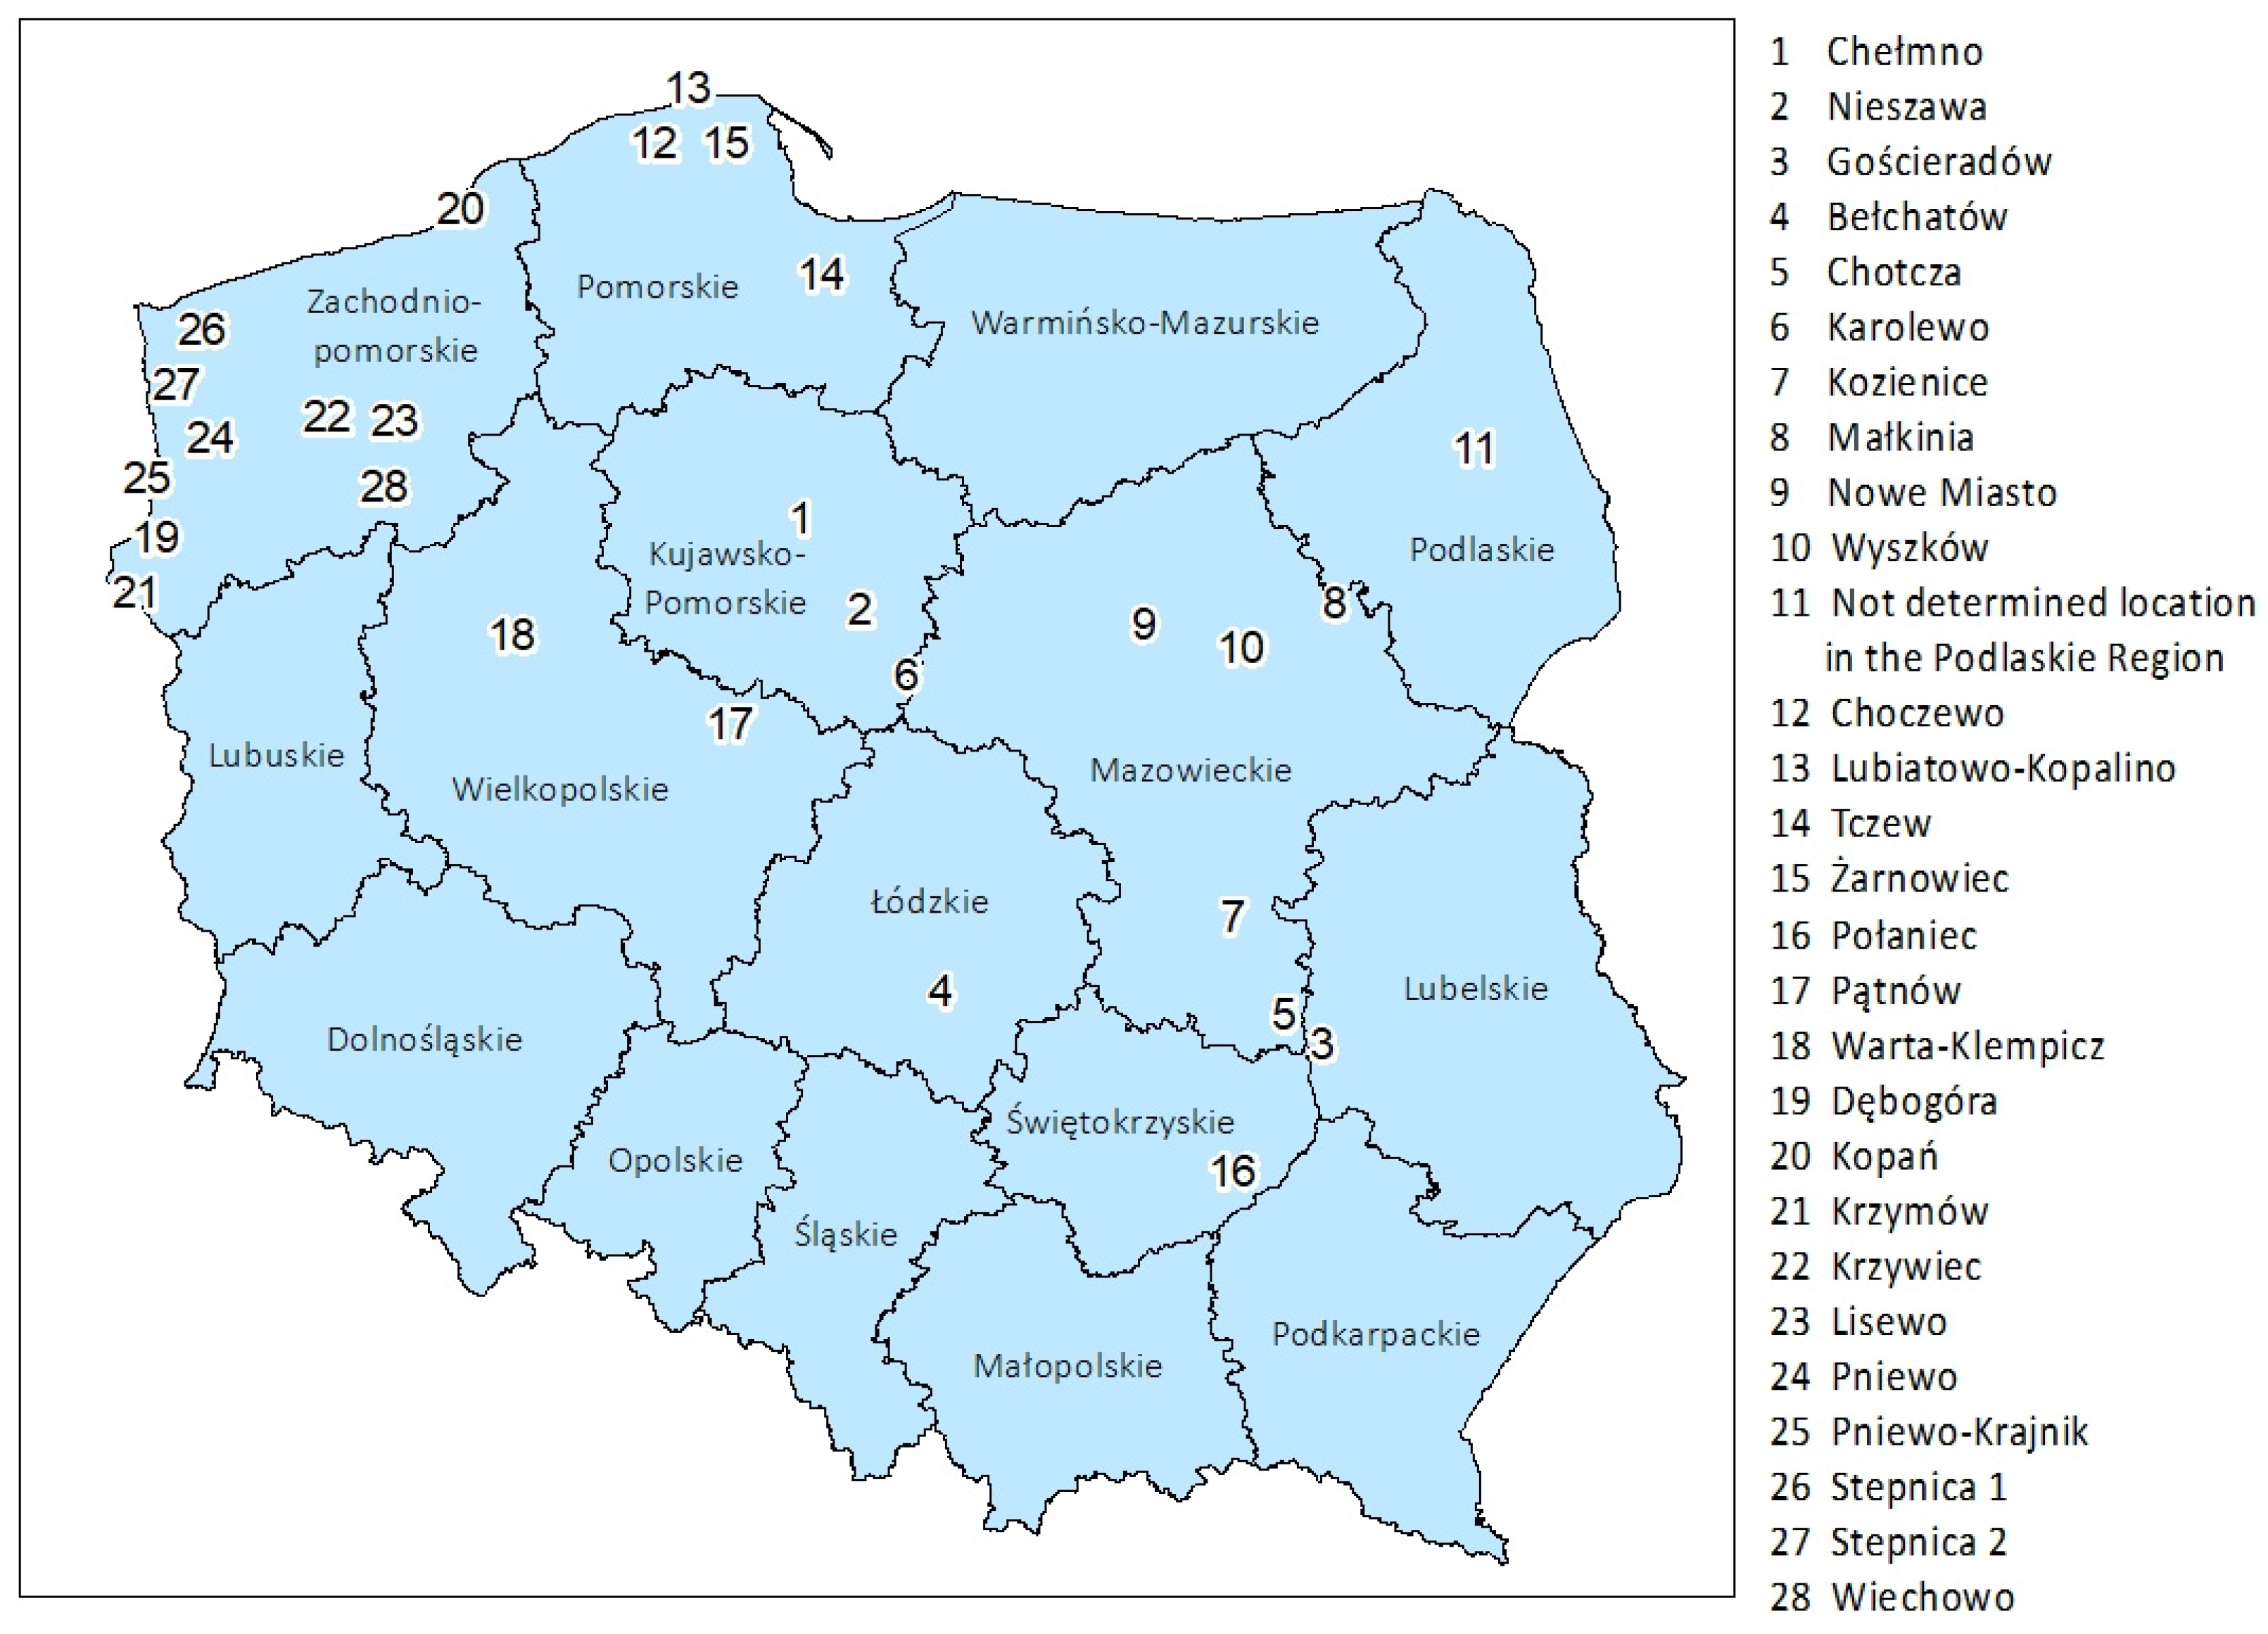
- Pomorskie region, located in North Central Poland (with Żarnowiec site ranked first, marked as No. 15 on Figure 3).
- Zachodniopomorskie region, located in Northwest Poland (with Kopań site ranked third, marked as No. 20 on Figure 3)
- Mazowieckie region, the capital region in Central Poland (with Nowe Miasto site ranked fourth, marked as No. 9 on Figure 3)
- Łódzkie region, located in Central Poland (with Bełchatów site ranked fifth, marked as No. 4 on Figure 3)
3. Materials and Methods
3.1. POLTERMDyn Model and Data
- (a)
- For outmigration rate by region (as share of age cohort):
- (b)
- For immigration total, the equation is as follows:
3.2. Simulating a Nuclear Power Plant in POLTERMDyn
- The shock variable is investments in the electric sector in each region separately for years 2025–2040.
- Shock statement is: tshock < year > xinvitot ("elecgas",“REG”).
- Shock variables:
- ○
- first, reverting investments in 2041 and turning into capital;
- ○
- second, taking away part of coal power.
- Shock statement 1: ashock faccum(“elecgas”,“REG”) = X.
- Shock statement 2: ashock faccum("elecgas",NONNREG).
4. Results
4.1. National Economic Results
4.2. Regional Economic Results
5. Discussion
6. Conclusions
Author Contributions
Funding
Acknowledgments
Conflicts of Interest
Appendix A

| Location: | Location: Region | Evaluation criteria | |||||||||||||||||
|---|---|---|---|---|---|---|---|---|---|---|---|---|---|---|---|---|---|---|---|
| Site | 1 | 2 | 3 | 4 | 5 | 6 | 7 | 8 | 9 | 10 | 11 | 12 | 13 | 14 | 15 | 16 | 17 | ||
| Integration into the Electric Grid System | Geology, Tectonics and Volcanic Studies | Seismology an Seismic Engineering | Hydrology (incl. Ground Water, Floods | Cooling Water Availability, Intake and Discharge | Demography and Land Use | Meteorology and Atmospheric Dispersion | Study on Flora and Fauna | Nuclear Safety and Radiation Protection | General Environmental Effect | Risks from Man-Made Events | Local Infrastructure | Cultural and Historical Sites | Access and Emergency Response Roads | Air, Land and Sea Transportation Patterns | Legal Aspects | Public Consultations | Total | ||
| Żarnowiec | Pomorskie | 4.7 | 4 | 5 | 3.5 | 0 | 5 | 5 | 5 | 3.2 | 5 | 3 | 4.7 | 5 | 3 | 4.5 | n.a. | 5 | 65.6 |
| Warta-Klempicz | Wielkopolskie | 4.3 | 4 | 5 | 4.5 | 1 | 5 | 3 | 2 | 3.4 | 3 | 3 | 4.7 | 5 | 3 | 4 | n.a. | 5 | 59.9 |
| Kopań | Zachodnio-Pomorskie | 2 | 3 | 5 | 3.5 | 5 | 5 | 5 | 2 | 2.6 | 0 | 3 | 4.7 | 5 | 3 | 4 | n.a. | 3 | 55.8 |
| Nowe Miasto | Mazowieckie | 2.7 | 4 | 5 | 4.5 | 1 | 5 | 4 | 5 | 3.2 | 5 | 3 | 1.9 | 5 | 3 | 3 | n.a. | 0 | 55.3 |
| Bełchatów | Łódzkie | 0.3 | 2 | 3 | 4.5 | 1 | 3 | 3 | 5 | 2.8 | 5 | 3 | 4.5 | 5 | 5 | 3 | n.a. | 3 | 53.1 |
| Nieszawa | Kujawsko-Pomorskie | 1.7 | 3 | 5 | 5 | 4 | 4 | 3 | 2 | 1.6 | 3 | 1 | 4.7 | 5 | 3 | 3 | n.a. | 3 | 52 |
| Tczew | Pomorskie | 4 | 4 | 5 | 1.5 | 4 | 3 | 3 | 1 | 2 | 3 | 3 | 4.8 | 5 | 5 | 3.5 | n.a. | 0 | 51.8 |
| Choczewo | Pomorskie | 2.3 | 4 | 5 | 3.5 | 5 | 5 | 5 | 2 | 3.2 | 0 | 3 | 4.5 | 5 | 2 | 1.5 | n.a. | 0 | 51 |
| Połaniec | Świętokrzyskie | 2 | 3 | 4 | 3 | 1 | 5 | 3 | 1 | 3 | 3 | 3 | 4.7 | 5 | 3 | 3 | n.a. | 3 | 49.7 |
| Chotcza | Mazowieckie | 2 | 3 | 5 | 4.5 | 1 | 5 | 3 | 5 | 2.2 | 5 | 3 | 4.4 | 5 | 0 | 1.5 | n.a. | 0 | 49.6 |
| Małkinia | Mazowieckie | 3.3 | 5 | 5 | 5 | 1 | 5 | 3 | 0 | 3.4 | 0 | 3 | 4.4 | 5 | 5 | 1 | n.a. | 0 | 49.1 |
| Krzywiec | Zachodnio-Pomorskie | 1.3 | 5 | 4 | 4 | 0 | 5 | 3 | 1 | 3.2 | 3 | 3 | 4.5 | 0 | 5 | 4 | n.a. | 3 | 49 |
| Krzymów | Zachodnio-Pomorskie | 1.3 | 4 | 5 | 2 | 1 | 5 | 3 | 0 | 2.8 | 0 | 3 | 4.7 | 5 | 5 | 4 | n.a. | 3 | 48.8 |
| Kozienice | Mazowieckie | 1.7 | 4 | 5 | 5 | 1 | 5 | 3 | 0 | 2.8 | 0 | 3 | 4.7 | 5 | 5 | 3 | n.a. | 0 | 48.2 |
| Wyszków | Mazowieckie | 3 | 5 | 5 | 5 | 1 | 3 | 3 | 0 | 2.8 | 0 | 3 | 4.7 | 5 | 5 | 2.5 | n.a. | 0 | 48 |
| Pniewo | Zachodnio-Pomorskie | 1.3 | 5 | 5 | 2 | 1 | 5 | 3 | 0 | 2.8 | 0 | 3 | 4.8 | 5 | 3 | 4 | n.a. | 3 | 47.9 |
| Pniewo-Krajnik | Zachodnio-Pomorskie | 1.3 | 5 | 5 | 2 | 1 | 5 | 3 | 0 | 2.8 | 0 | 3 | 4.8 | 5 | 3 | 4 | n.a. | 3 | 47.9 |
| Lubiatowo-Kopalino | Pomorskie | 2 | 3 | 5 | 3.5 | 5 | 5 | 5 | 1 | 3 | 0 | 3 | 4.7 | 0 | 2 | 2 | n.a. | 3 | 47.2 |
| Dębogóra | Zachodnio-Pomorskie | 1.3 | 4 | 5 | 4 | 1 | 5 | 3 | 2 | 2.6 | 0 | 3 | 4.8 | 0 | 3 | 4.5 | n.a. | 3 | 46.2 |
| Stepnica 1 | Zachodnio-Pomorskie | 1 | 3 | 4 | 2.5 | 1 | 5 | 4 | 0 | 3 | 0 | 2 | 4.8 | 5 | 3 | 4 | n.a. | 3 | 45.3 |
| Stepnica 2 | Zachodnio-Pomorskie | 1 | 3 | 4 | 2.5 | 1 | 5 | 4 | 0 | 3 | 0 | 2 | 4.8 | 5 | 3 | 4 | n.a. | 3 | 45.3 |
| Wiechowo | Zachodnio-Pomorskie | 1.3 | 4 | 4 | 4 | 0 | 5 | 3 | 1 | 3 | 3 | 3 | 4.4 | 0 | 3 | 3.5 | n.a. | 3 | 45.2 |
| Karolewo | Mazowieckie | 1.7 | 4 | 5 | 5 | 4 | 5 | 4 | 3 | 1.6 | 0 | 3 | 4.5 | 0 | 2 | 2 | n.a. | 0 | 44.8 |
| Lisowo | Zachodnio-Pomorskie | 1.3 | 3 | 4 | 4 | 0 | 5 | 3 | 1 | 3 | 3 | 3 | 4.5 | 0 | 3 | 4 | n.a. | 3 | 44.8 |
| Gościeradów | Lubelskie | 2.7 | 3 | 5 | 4.5 | 1 | 5 | 3 | 1 | 3 | 0 | 3 | 4.4 | 0 | 3 | 2 | n.a. | 3 | 43.6 |
| Chełmno | Kujawsko-Pomorskie | 2 | 3 | 5 | 5 | 4 | 2 | 3 | 2 | 2 | 3 | 1 | 4.7 | 0 | 3 | 2.5 | n.a. | 0 | 42.2 |
| Pątnów | Wielkopolskie | 1.3 | 3 | 5 | 5 | 0 | 3 | 4 | 0 | 2.6 | 0 | 3 | 4.7 | 0 | 5 | 3 | n.a. | 0 | 39.6 |
| NACE 19 Sections: | Impact on Zachpomorskie (% Change) | Impact on the National Economy (in 16 Regions) * | Impact on Pomorskie (% Change) | Impact on the National Economy (in 16 Regions) * | Impact on Mazowieckie (% Change) | Impact on the National Economy (in 16 Regions) * | Impact on Łódzkie(% Change) | Impact on the National Economy (in 16 Regions) * |
|---|---|---|---|---|---|---|---|---|
| 1. Agriculture (A) | −0.04 | 0 | −0.02 | 2 | 0.00 | 12 | −0.02 | 0 |
| 2. MiningQuaring (B) | 0.00 | 1 | 0.00 | 7 | 0.00 | 12 | 0.00 | 2 |
| 3. Manufacturing (C.) | −0.02 | 0 | −0.09 | 3 | 0.01 | 16 | −0.05 | 0 |
| 4. Electricity&Gas (D) | 0.95 | 1 | 1.27 | 1 | 0.53 | 1 | 1.12 | 1 |
| 5. Water&Waste (E.) | −0.01 | 3 | −0.01 | 5 | 0.00 | 14 | 0.00 | 2 |
| 6. Construction (F) | 0.96 | 2 | 0.76 | 2 | 0.14 | 9 | 0.39 | 9 |
| 7. Trade (G) | 0.23 | 1 | 0.18 | 1 | 0.08 | 1 | 0.16 | 1 |
| 8. Transport (H) | −0.02 | 0 | 0.00 | 3 | 0.01 | 6 | −0.01 | 0 |
| 9. Accomod&Food (I) | 0.02 | 10 | 0.01 | 8 | 0.01 | 10 | 0.00 | 5 |
| 10. ICT (J) | −0.05 | 14 | −0.06 | 15 | −0.01 | 15 | −0.02 | 14 |
| 11. Finance&Insurance (K) | −0.01 | 6 | 0.01 | 7 | 0.02 | 16 | 0.00 | 2 |
| 12. RealEst (L) | 0.07 | 4 | 0.08 | 6 | 0.05 | 11 | 0.05 | 1 |
| 13. RandD (R&D from M) | 0.00 | 1 | 0.00 | 5 | 0.00 | 16 | 0.00 | 1 |
| 14. Proffes (Rest of M) | 0.02 | 1 | −0.02 | 15 | −0.01 | 15 | −0.01 | 14 |
| 15. AdmINSup (N) | 0.01 | 5 | 0.02 | 2 | 0.01 | 10 | 0.01 | 1 |
| 16. PubAdm (O) | 0.15 | 2 | 0.13 | 2 | 0.05 | 1 | 0.13 | 1 |
| 17. Education (P) | 0.12 | 2 | 0.12 | 2 | 0.04 | 1 | 0.11 | 1 |
| 18. Health (Q) | 0.13 | 2 | 0.11 | 2 | 0.04 | 1 | 0.11 | 1 |
| 19. All other (R+S+T+U) | 0.09 | 1 | 0.07 | 2 | 0.03 | 1 | 0.06 | 1 |
| Sum of growing sectors** | 12 | 56 | 13 | 90 | 16 | 168 | 12 | 57 |
References
- European Commission. A Clean Planet for All—A European Long-Term Strategic Vision for a Prosperous, Modern, Competitive and Climate Neutral Economy; COM (2018) 773; European Commission: Brussels, Belgium, 2018; p. 114. [Google Scholar]
- European Commission. Long-Term Low Greenhouse Gas Emission Development Strategy of the European Union and its Member States; European Commission: Brussels, Belgium, 2020; Available online: https://ec.europa.eu/clima/policies/strategies/2050_en (accessed on 20 May 2020).
- European Commission. The European Green Deal; COM (2019) 640; European Commission: Brussels, Belgium, 2019; pp. 47–65. [Google Scholar]
- United Nations. Paris Agreement; United Nations: New York, NY, USA, 2010; Available online: https://unfccc.int/process-and-meetings/the-paris-agreement/the-paris-agreement (accessed on 20 May 2020).
- European Commission. Proposal for a Regulation of the European Parliament and of the Council Establishing the Framework for Achieving Climate Neutrality and Amending Regulation (EU) 2018/1999 (European Climate Law) EN; COM (2020) 80; European Commission: Brussels, Belgium, 2020; pp. 1–58. [Google Scholar]
- World Nuclear Association Nuclear Power in the World Today. Available online: https://www.world-nuclear.org/information-library/current-and-future-generation/nuclear-power-in-the-world-today.aspx (accessed on 20 May 2020).
- Polish Ministry of Economy. Polish Nuclear Power Programme; Polish Ministry of Economy: Warsaw, Poland, 2014. [Google Scholar]
- International Energy Agency. Key World Energy Statistics; International Energy Agency: Paris, France, 2019. [Google Scholar]
- Hofmeester, K.; van der Linden, M. Handbook Global History of Work; Walter de Gruyter GmbH: Berlin, Germany, 2017. [Google Scholar]
- EUROSTAT Energy Balances. Available online: https://ec.europa.eu/eurostat/web/energy/data/energy-balances (accessed on 20 May 2020).
- Ministerstwo Energii. Polityka Energetyczna Polski do 2040 Roku (PEP2040); Ministry of Energy: Warsaw, Poland, 2018. [Google Scholar]
- Chadwick, A.; Glasson, J. Auditing the socio-economic impacts of a major construction project: The case of Sizewell B nuclear power station. J. Environ. Plan. Manag. 1999, 42, 811–836. [Google Scholar] [CrossRef]
- Štrubelj, L.; Žagar, T. The impact of Nuclear Energy sector to Socio-Economic Development in Slovenia and European Union. In Proceedings of the 21st International Conference Nuclear Energy for New Europe, Ljubljana, Slovenia, 5–7 September 2012. [Google Scholar]
- Broderick, J.; Anderson, K.; Jones, C.; Watson, J. A Review of Research Relevant to New Build Nuclear Power Plants in the UK; Friends of the Earth: London, UK, 2013. [Google Scholar]
- Olsen, S.M.; Wolff, H. Nuclear Reactors in the US: Housing Values, Sorting, Migration, and Employment. 2013. Available online: https://econ.washington.edu/sites/econ/files/old-site-uploads/2014/06/Olsen-Wolff-2014-NuclearPaper.pdf (accessed on 20 May 2020).
- Frantál, B.; Malý, J.; Ouředníček, M.; Nemeškal, J. Distance matters. Assessing socioeconomic impacts of the Dukovany nuclear power plant in the Czech Republic: Local perceptions and statistical evidence. Morav. Geogr. Rep. 2016, 24, 2–13. [Google Scholar] [CrossRef] [Green Version]
- Alexeeva, V.; Beestermoeller, R.; Black, G.; Bradish, D.; Cameron, R.; Colakoglu, I.; Emeric, J.; Lee, M.; Karmanoc, F.; Keppler, J.H.; et al. Measuring Employment Generated by the Nuclear Power Sector; Nuclear Energy Agency: Paris, France, 2018. [Google Scholar]
- Hwang, W.S.; Oh, I.; Lee, J.D. Assessing the Socio-Economic Effects of Korea’s Nuclear Power Policy. Energy Environ. 2014, 25, 931–952. [Google Scholar] [CrossRef]
- Welsch, H.; Ochsen, C. Dismantling of nuclear power in Germany: Sectoral and macroeconomic effects. Energy Policy 2001, 29, 279–289. [Google Scholar] [CrossRef]
- Bretschger, L.; Ramer, R.; Zhang, L. Economic Effects of a Nuclear Phase-Out Policy: A CGE Analysis. SSRN 2012, 28. [Google Scholar] [CrossRef] [Green Version]
- Yamazaki, M.; Takeda, S. An assessment of nuclear power shutdown in Japan using the computable general equilibrium model. J. Integr. Disaster Risk Manag. 2013, 3, 36–55. [Google Scholar] [CrossRef]
- Davis, L.; Hausman, C. Market impacts of a nuclear power plant closure. Am. Econ. J. Appl. Econ. 2016, 8, 92–122. [Google Scholar] [CrossRef] [Green Version]
- Fuentes-Saguar, D.P.; Vega-Cervera, A.J.; Cardenete, M.A. Socio-economic impact of a nuclear power plant: Almaraz (Spain). Appl. Econ. 2017, 49, 4782–4792. [Google Scholar]
- Jarvis, S.; Deschenes, O.; Jha, A. The Private and External Costs of Germany’s Nuclear Phase-Out; National Bureau of Economic Research: Cambridge, MA, USA, 2019; Volume 26598, Available online: https://www.nber.org/papers/w26598 (accessed on 20 May 2020).
- Johnson, M.; Bennett, J. An input-output model of regional environmental and economic impacts of nuclear power plants. Land Econ. 1979, 55, 236–252. [Google Scholar] [CrossRef]
- International Atomic Energy Agency. Nuclear Technology and Economic Development in the Republic of Korea; IAEA: Vienna, Austria, 2009. [Google Scholar]
- Shibusawa, H.; Miyata, Y. Evaluating production effects of economic activity in zones surrounding the nuclear power station in Shizuoka Prefecture, Japan. Asia Pac. J. Reg. Sci. 2017, 1, 291–306. [Google Scholar] [CrossRef]
- Conrad, K.; Henseler-Unger, I. The economic impact of coal-fired versus nuclear power plants: An application of a general equilibrium model. Energy J. 1986, 7, 51–63. [Google Scholar]
- Galinis, A.; Van Leeuwen, M.J. A CGE model for Lithuania: The future of nuclear energy. J. Policy Model 2000, 22, 691–718. [Google Scholar] [CrossRef]
- Bohringer, C.; Muller, A.; Wickart, M. Economic impacts of a premature nuclear phase-out in Switzerland: An applied general equilibrium analysis. Rev. Suisse Econ. Stat. 2003, 139, 461–506. [Google Scholar]
- Glasson, J. Better monitoring for better impact management: The local socio-economic impacts of constructing Sizewell B nuclear power station. Impact Assess. Proj. Apprais. 2005, 23, 215–226. [Google Scholar] [CrossRef]
- Nuclear Energy Institute. Nuclear Energy’s Economic Benefits; Nuclear Energy Institute: Washington, DC, USA, 2012. [Google Scholar]
- Adler, D.B.; Jha, A.; Severnini, E. Considering the nuclear option: Hidden benefits and social costs of nuclear power in the U.S. since 1970. Resour. Energy Econ. 2020, 59. [Google Scholar] [CrossRef]
- Clark, D.E.; Michelbrink, L.; Allison, T.; Metz, W.C. Nuclear power plants and residential housing prices. Growth Chang. 1997, 28, 496–519. [Google Scholar] [CrossRef]
- Folland, S.; Hough, R. Externalities of nuclear power plants: Further evidence. J. Reg. Sci. 2000, 40, 735–753. [Google Scholar] [CrossRef]
- Yamane, F.; Ohgaki, H.; Asano, K. Nuclear Power-Related Facilities and Neighboring Land Price: A Case Study on the Mutsu-Ogawara Region, Japan. Risk Anal. Int. J. 2011, 31, 1969–1994. [Google Scholar] [CrossRef]
- Badyda, K.; Kuźniewski, M. Economic viability analysis of a nuclear power plant construction in Poland. Energetyka 2015, 695–701. Available online: http://elektroenergetyka.pl/upload/file/2015/11/Badyda.pdf (accessed on 20 May 2020).
- Sasin, R.; Kołacińska, K. Analiza kosztów i korzyści wdrożenia energetyki jądrowej w Polsce. Rynek Energii 2016. [Google Scholar]
- Instytut na rzecz Ekorozwoju. Available online: https://www.pine.org.pl/raport-o-stanie-swiatowego-przemyslu-jadrowego-2019/ (accessed on 20 May 2020).
- Rodriguez-Penalonga, L.; Soria, B.Y.M.; Ocaña-Pastor, P.; Martín-Cañas, P.; Belda-Sánchez, B.; Cortes-Sanz, N.; Estadieu, M.; Linares-Hurtado, J.I.; Vidal-Bernardez, J.M.; Niño-Serrano, M. Spent nuclear fuel management: Levelized cost of electricity generation and analysis of various production scenarios. Energies 2016, 9, 178. [Google Scholar] [CrossRef] [Green Version]
- Gao, R.; Nam, H.O.; Ko, W.I.; Jang, H. National options for a sustainable nuclear energy system: MCDM evaluation using an improved integrated weighting approach. Energies 2017, 10, 2017. [Google Scholar] [CrossRef] [Green Version]
- Lang, P.A. Nuclear power learning and deployment rates; disruption and global benefits forgone. Energies 2017, 10, 2169. [Google Scholar] [CrossRef] [Green Version]
- International Atomic Energy Agency. Basic Infrastructure for a Nuclear Power Project; International Atomic Energy Agency: Vienna, Austria, 2006; p. 55. Available online: https://www.iaea.org/publications/7541/basic-infrastructure-for-a-nuclear-power-project (accessed on 20 May 2020).
- Dziennik Urzędowy RP. MONITOR POLSKI 2014.
- Horridge, M.; Madden, J.; Wittwer, G. The impact of the 2002–2003 drought on Australia. J. Policy Model. 2005, 27, 285–308. [Google Scholar] [CrossRef]
- Horridge, M.; Meeraus, A.; Pearson, K.; Rutherford, T.F. Handbook of Computable General Equilibrium Modeling SET, Vols. 1A and 1B; Elsevier: Amsterdam, The Netherlands, 2013; Volume 1, ISBN 9780444595683. Available online: https://www.sciencedirect.com/handbook/handbook-of-computable-general-equilibrium-modeling/vol/1/suppl/C (accessed on 20 May 2020).
- Wittwer, G.; Horridge, M. Bringing regional detail to a cge model using census data. Spat. Econ. Anal. 2010, 5, 229–255. [Google Scholar] [CrossRef]
- Centre of Policy Studies the TERM Model. Available online: https://www.copsmodels.com/term.htm#Developments (accessed on 20 May 2020).
- Centre of Policy Studies GEMPACK General Equilibrium Modelling Software. Available online: https://www.copsmodels.com/gempack.htm (accessed on 20 May 2020).
- EUROSTAT ESA Supply, Use and Input-Output Tables. Available online: https://ec.europa.eu/eurostat/web/esa-supply-use-input-tables/data/database (accessed on 20 May 2020).
- EUROSTAT Regional Statistics by NUTS Classification. Available online: https://ec.europa.eu/eurostat/web/regions/data/database (accessed on 20 May 2020).
- Wittwer, G. (Ed.) Economic Modeling of Water: The Australian CGE Experience; Springer Science & Business Media: Berlin, Germany, 2012; Volume 3, ISBN 9789400728752. [Google Scholar]
- Zawalińska, K.; Tran, N.; Płoszaj, A. R&D in a post centrally-planned economy: The macroeconomic effects in Poland. J. Policy Model. 2018, 40, 37–59. [Google Scholar] [CrossRef]
- Horridge, M.; Rokicki, B.; Zawalińska, K. Regionalny Model Równowagi Ogólnej TERM i przykłady jego zastosowania w Polsce; Wydawnictwa Uniwersytetu Warszawskiego: Warsaw, Poland, 2017. [Google Scholar]
- Zawalińska, K.; Giesecke, J.; Horridge, M. The consequences of Less Favoured Area support: A multi-regional CGE analysis for Poland LFA measure in Poland. Agric. Food Sci. 2013, 272–287. [Google Scholar] [CrossRef] [Green Version]
- Thomas, J.R.; Clark, S.J. More on the cohort-component model of population projection in the context of HIV/AIDS: A Leslie matrix representation and new estimates. Demogr. Res. 2011, 25, 39–102. [Google Scholar] [CrossRef] [Green Version]
- Central Statistical Office Demographic Database. Available online: http://demografia.stat.gov.pl/bazademografia/ (accessed on 20 May 2020).
- Central Statistical Office Bank of Local Data (BDL). Available online: https://bdl.stat.gov.pl/BDL/start (accessed on 20 May 2020).
- Törmä, H.; Kujala, S.; Kinnunen, J. The employment and population impacts of the boom and bust of Talvivaara mine in the context of severe environmental accidents—A CGE evaluation. Resour. Policy 2015, 46, 127–138. [Google Scholar] [CrossRef]
- Kinnunen, J.; Honkatukia, J.; Rauhanen, T. Effects of past and future vat reforms in Finland. In Proceedings of the ECOMOD 2011 Conference, Ponta Delgada, Portugal, 29 Jun–1 July 2011. [Google Scholar]
- Kleven, H.J.; Kreiner, C.T. The marginal cost of public funds: Hours of work versus labor force participation. J. Public Econ. 2006, 90, 1955–1973. [Google Scholar] [CrossRef]
- Meghir, C.; Phillips, D. Labour Supply and Taxes. In Dimensions of Tax Design: The Mirrlees review; Mirrlees, J., Adam, S., Besley, T., Blundell, R., Bond, S., Chote, R., Gammie, M., Johnson, P., et al., Eds.; Oxford University Press: Oxford, UK, 2010; pp. 1–1391. [Google Scholar]
- Finnish Ministry of Finance. Final Report of the Working Group for Developing the Finnish Tax System; Finnish Ministry of Finance: Helsinki, Finland, 2020. [Google Scholar]
- Krugman, P. Increasing returns and Economic Geography. J. Polit. Econ. 1991, 99, 483–499. [Google Scholar] [CrossRef]
- Minerva, A.; Ottaviano, G.I.P. Endogenous growth theories: Agglomeration benefits and transportation costs. In Handbook of Regional Growth and Development Theories; Capello, R., Nijkamp, P., Eds.; Edward Elgar Publishing: Cheltenham, UK, 2009. [Google Scholar]
- Kernohan, D.; Rognlien, L. Wider Economic Impacts of Transport Investments in New Zealand; New Zealand Transport Agency: Wellington, New Zealand, 2011; ISBN 9780478380088. [Google Scholar]
- Central Statistical Office. Input-Output Tables at Basic Prices in 2010; Central Statistical Office: Warsaw, Poland, 2014. [Google Scholar]
- Central Statistical Office. Input-Output Table at Basic Prices in 2015; Central Statistical Office: Warsaw, Poland, 2019. [Google Scholar]
- Central Statistical Office. Statistical Yearbook of the Regions–Poland; Central Statistical Office: Warsaw, Poland, 2019. [Google Scholar]
- The Dutch Disease. Economist 1977, 26, 82–83.
- Honkatukia, J.; Pursiheimo, E. Tutkimukset165; VTT: Finalnd, 2013; ISBN 9789515619938. Available online: https://www.doria.fi/bitstream/handle/10024/148702/t165.pdf?sequence=1 (accessed on 20 May 2020).
- Piton, S. Economic Integration and the Non-tradable Sector: The European Experience. Papers ppi361. Job Market Papers 2017, 1–33. Available online: https://ideas.repec.org/p/jmp/jm2017/ppi361.html (accessed on 20 May 2020).
- Popczyk, J. Elektrownie Jądrowe w Polsce i Ich Alternatywa. 2015. Available online: https://www.cire.pl/pliki/2/ekspertyza_ep_ni_vs_ejjan_popczyk.pdf (accessed on 20 May 2020).
- Brook, B.W.; Alonso, A.; Meneley, D.A.; Misak, J.; Blees, T.; van Erp, J.B. Why nuclear energy is sustainable and has to be part of the energy mix. Sustain. Mater. Technol. 2014, 1–2, 8–16. [Google Scholar] [CrossRef] [Green Version]
- Schneider, M.; Froggatt, A.; Ayukawa, Y.; Burnie, S.; Thomas, S.; Hazemann, J. The World Nuclear Industry Status Report 2014; Mycle Schneider Consulting: Paris, France, 2014. [Google Scholar]
- Suna, D.; Resch, G. Is nuclear economical in comparison to renewables? Energy Policy 2016, 98, 199–209. [Google Scholar] [CrossRef]
- Biuro Studiów i Projektów Energetycznych Energoprojekt–Warszawa S.A. Ekspertyza na Temat Kryteriów Lokalizacji Elektrowni Jądrowych Oraz Wstępna Ocena Uzgodnionych Lokalizacji, Warszawa 2009. 2009. Available online: http://img.trojmiasto.pl/download/Prezentacja_Lok_EJ_1.pdf (accessed on 20 May 2020).


| Sources | 2020 | 2025 | 2030 | 2035 | 2040 |
|---|---|---|---|---|---|
| Lignite | 26.6 | 26.8 | 24.8 | 12.9 | 7.7 |
| Coal | 42.7 | 38.5 | 31.4 | 25.0 | 20.2 |
| Nuclear Energy | 0.0 | 0.0 | 0.0 | 9.6 | 13.6 |
| Gas fuels | 6.8 | 8.1 | 10.3 | 14.7 | 17.0 |
| Heating oil | 1.1 | 1.0 | 0.9 | 0.8 | 0.8 |
| Wind energy | 13.3 | 14.1 | 19.0 | 21.5 | 24.4 |
| Solar energy | 1.1 | 2.4 | 3.4 | 5.1 | 6.6 |
| Biomass | 5.4 | 5.2 | 5.8 | 5.4 | 4.6 |
| Biogas | 0.9 | 1.4 | 1.9 | 2.4 | 2.6 |
| Hydropower | 1.4 | 1.5 | 1.5 | 1.4 | 1.4 |
| Hydropower from pumping water | 0.4 | 0.4 | 0.4 | 0.6 | 0.7 |
| Municipal and industrial waste | 0.4 | 0.5 | 0.5 | 0.6 | 0.6 |
| SUM: | 100 | 100 | 100 | 100 | 100 |
| Specification | Installed Power | Production | Consumption | RES | Production to Consumption |
|---|---|---|---|---|---|
| MW | GWh | GWh | % | % | |
| Poland | 42,989.7 | 170,039.5 | 166,840 | 12.7 | 101.9 |
| Dolnośląskie | 2379.5 | 9917.7 | 14,080 | 6.5 | 70.4 |
| Kujawsko-pomorskie | 1983.3 | 6798.8 | 8549 | 48.7 | 79.5 |
| Lubelskie | 565.8 | 2066.8 | 6339 | 22.9 | 32.6 |
| Lubuskie | 785.3 | 3290.8 | 3960 | 19.9 | 83.1 |
| Łódzkie | 6536.7 | 38,641.0 | 13,509 | 3.8 | 286.0 |
| Małopolskie | 1890.9 | 5888.7 | 13,631 | 7.0 | 43.2 |
| Mazowieckie | 6795.9 | 30,441.0 | 28,046 | 4.8 | 108.5 |
| Opolskie | 2034.3 | 10,087.2 | 5600 | 5.2 | 180.1 |
| Podkarpackie | 1039.9 | 2462.0 | 5708 | 23.1 | 43.1 |
| Podlaskie | 412.9 | 1051.2 | 3230 | 68.3 | 32.5 |
| Pomorskie | 1943.7 | 4104.9 | 8464 | 51.3 | 48.5 |
| Śląskie | 7218.7 | 24,905.9 | 27,273 | 3.2 | 91.3 |
| Świętokrzyskie | 1941.9 | 11,213.1 | 5521 | 16.2 | 203.1 |
| Warmińsko-mazurskie | 477.3 | 1170.2 | 3998 | 82.8 | 29.3 |
| Wielkopolskie | 3615.4 | 9840.7 | 12,694 | 21.3 | 77.5 |
| Zachodniopomorskie | 3368.2 | 8159.4 | 6238 | 44.2 | 130.8 |
| Construction Phase 2025–2040 | The Whole Policy Simulation 2025–2050 | |||||||
|---|---|---|---|---|---|---|---|---|
| % Changes in Real Terms | Location: ZachPom | Location: Pomors | Location: Mazow | Location: Łódz | Location: ZachPom | Location: Pomors | Location: Mazow | Location: Łódz |
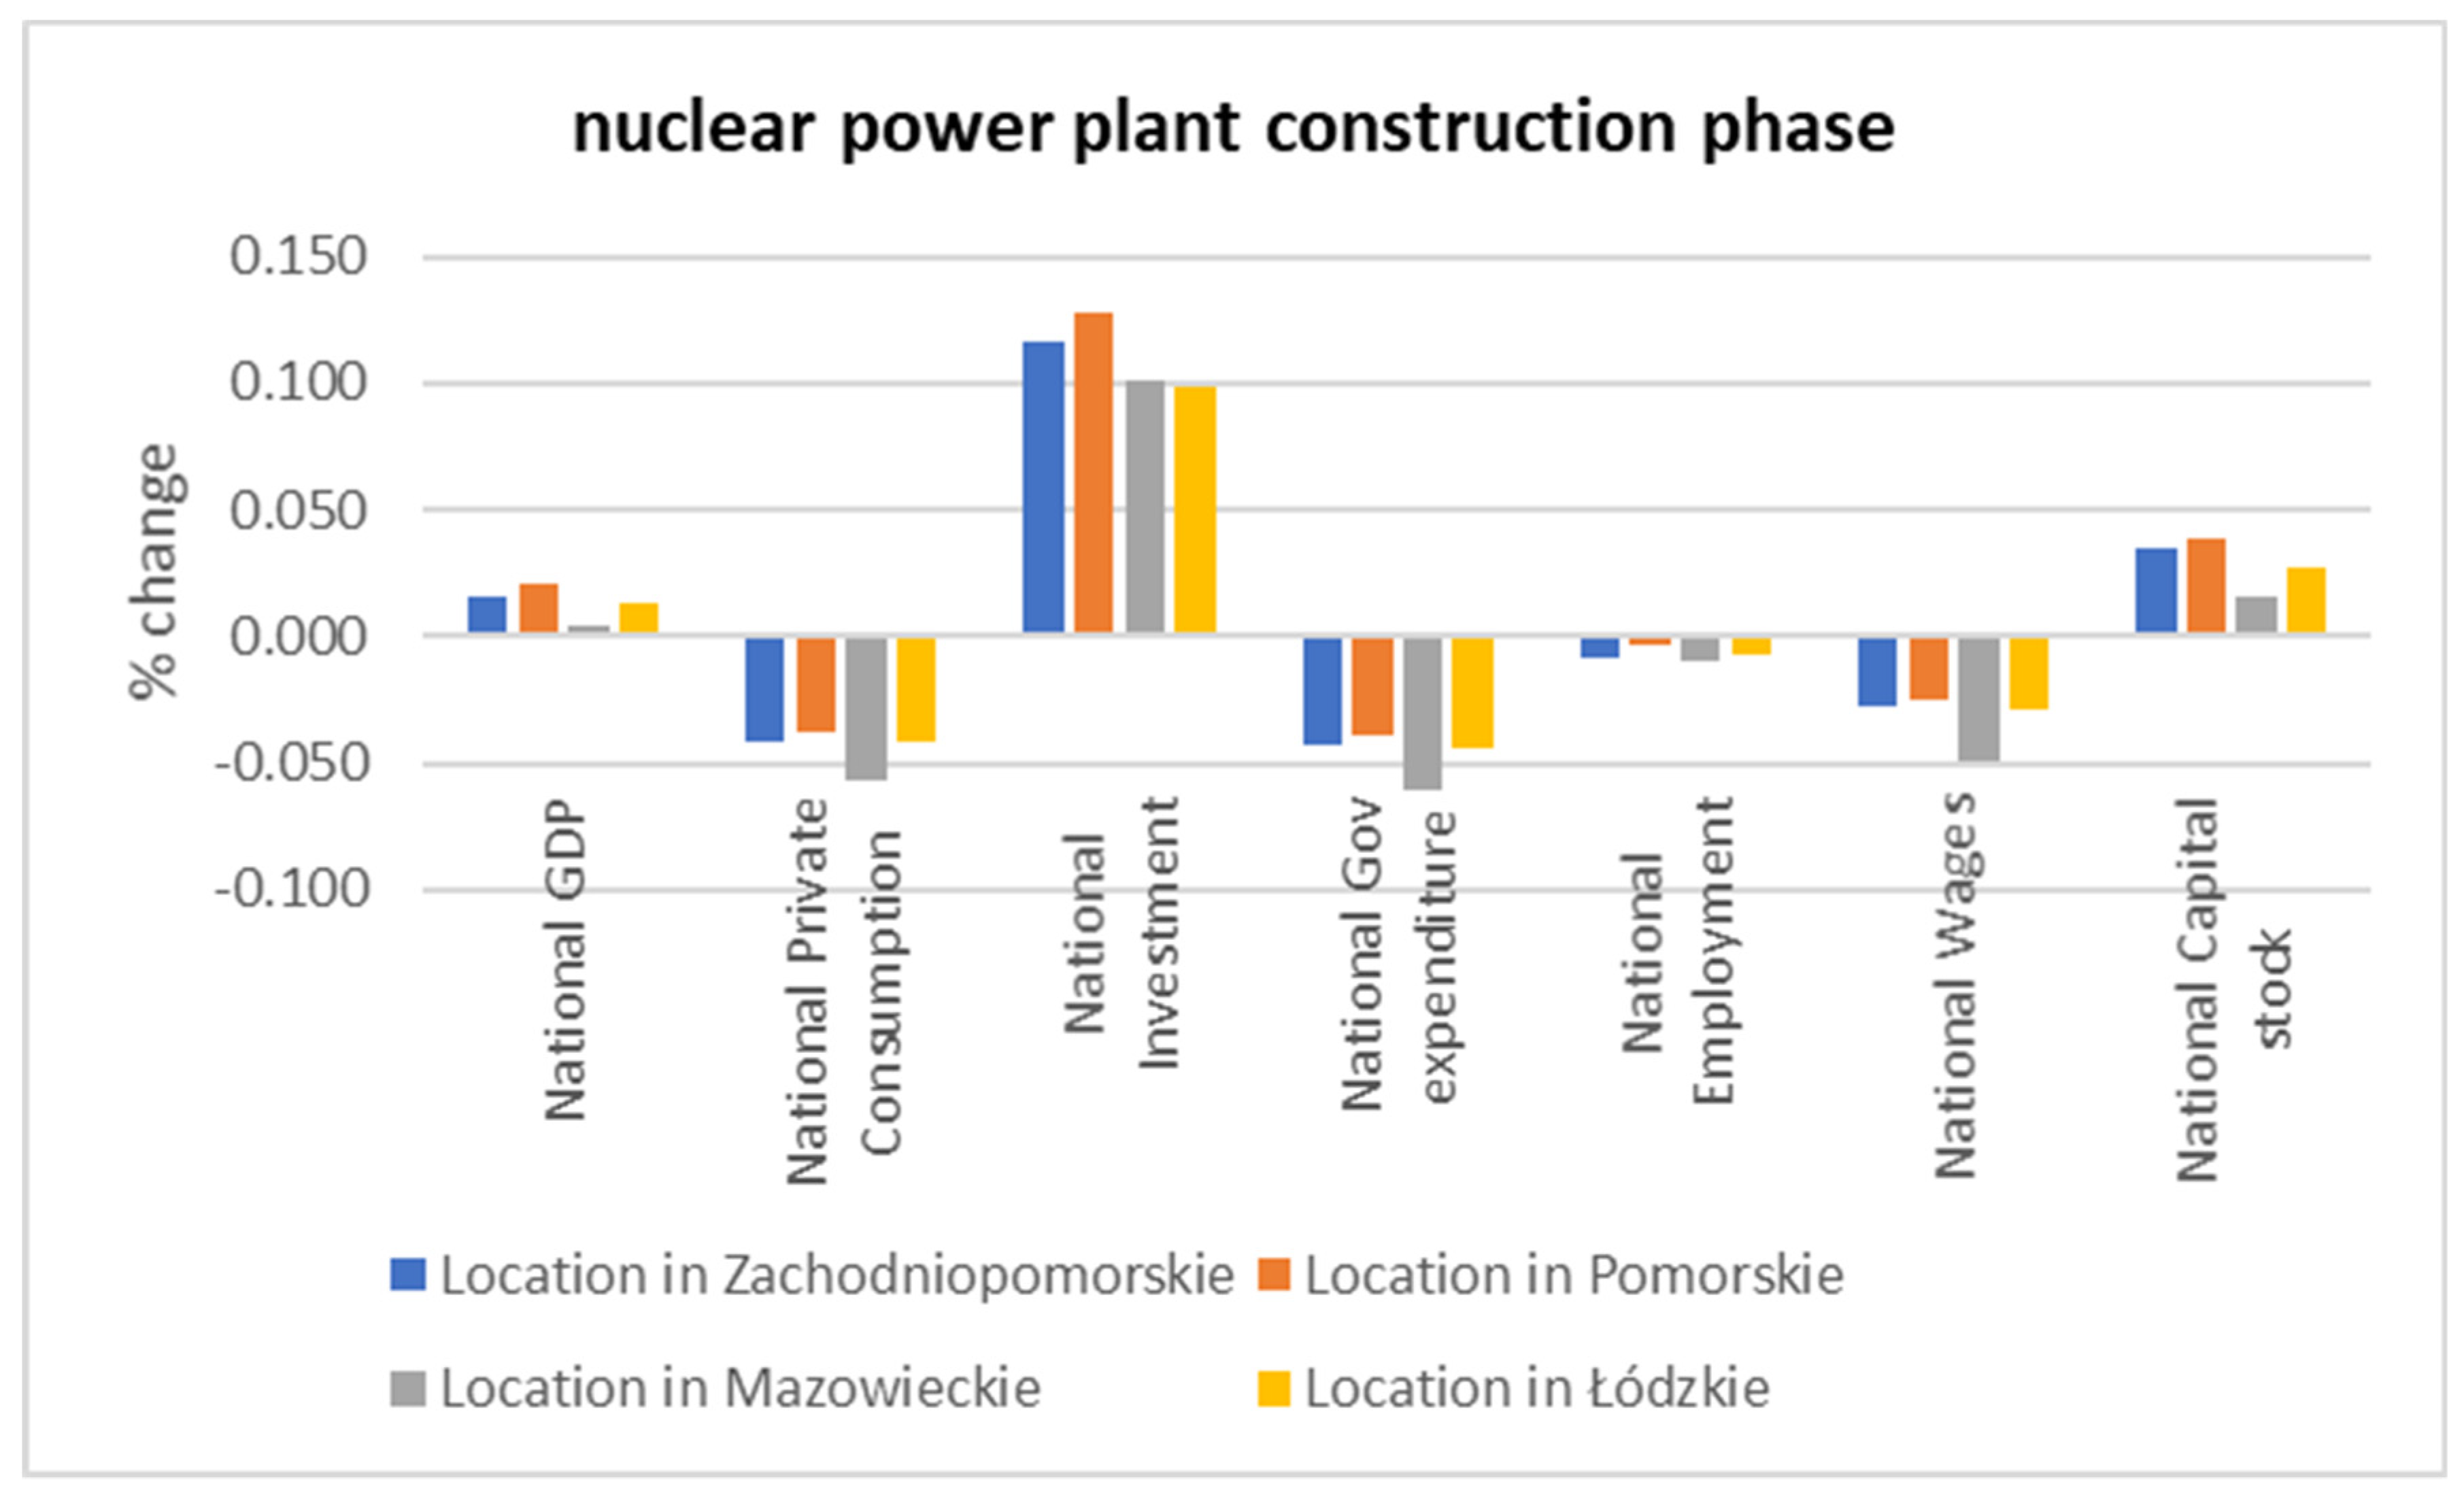
| National GDP | 0.016 | 0.020 | 0.004 | 0.012 | −0.014 | 0.014 | 0.086 | −0.006 |
| National Private Consumption | −0.041 | −0.037 | −0.057 | −0.042 | −0.042 | −0.014 | 0.072 | −0.023 |
| National Investment | 0.117 | 0.128 | 0.101 | 0.098 | 0.053 | 0.067 | 0.030 | 0.060 |
| National Gov expenditure | −0.043 | −0.039 | −0.061 | −0.045 | −0.012 | −0.011 | 0.047 | −0.025 |
| National Exports | 0.047 | 0.048 | 0.058 | 0.054 | −0.015 | 0.033 | 0.119 | −0.002 |
| National Imports | −0.012 | −0.009 | −0.012 | −0.009 | −0.019 | 0.005 | 0.049 | −0.001 |
| National Employment | −0.009 | −0.004 | −0.010 | −0.007 | −0.015 | 0.000 | 0.042 | −0.012 |
| National Wages | −0.027 | −0.025 | −0.050 | −0.029 | −0.031 | −0.011 | 0.055 | −0.004 |
| National Capital stock | 0.035 | 0.038 | 0.016 | 0.028 | −0.011 | 0.025 | 0.113 | −0.001 |
© 2020 by the authors. Licensee MDPI, Basel, Switzerland. This article is an open access article distributed under the terms and conditions of the Creative Commons Attribution (CC BY) license (http://creativecommons.org/licenses/by/4.0/).
Share and Cite
Zawalińska, K.; Kinnunen, J.; Gradziuk, P.; Celińska-Janowicz, D. To Whom Should We Grant a Power Plant? Economic Effects of Investment in Nuclear Energy in Poland. Energies 2020, 13, 2687. https://doi.org/10.3390/en13112687
Zawalińska K, Kinnunen J, Gradziuk P, Celińska-Janowicz D. To Whom Should We Grant a Power Plant? Economic Effects of Investment in Nuclear Energy in Poland. Energies. 2020; 13(11):2687. https://doi.org/10.3390/en13112687
Chicago/Turabian StyleZawalińska, Katarzyna, Jouko Kinnunen, Piotr Gradziuk, and Dorota Celińska-Janowicz. 2020. "To Whom Should We Grant a Power Plant? Economic Effects of Investment in Nuclear Energy in Poland" Energies 13, no. 11: 2687. https://doi.org/10.3390/en13112687