Electrochemically Reduced Titania Nanotube Synthesized from Glycerol-Based Electrolyte as Supercapacitor Electrode

 , , , , and
Abstract
:1. Introduction
2. Materials and Methods
2.1. Synthesis of TNTs
2.2. Electrochemical Reduction of TNTs
2.3. Material Characterizations and Electrochemical Measurements
3. Results and Discussion
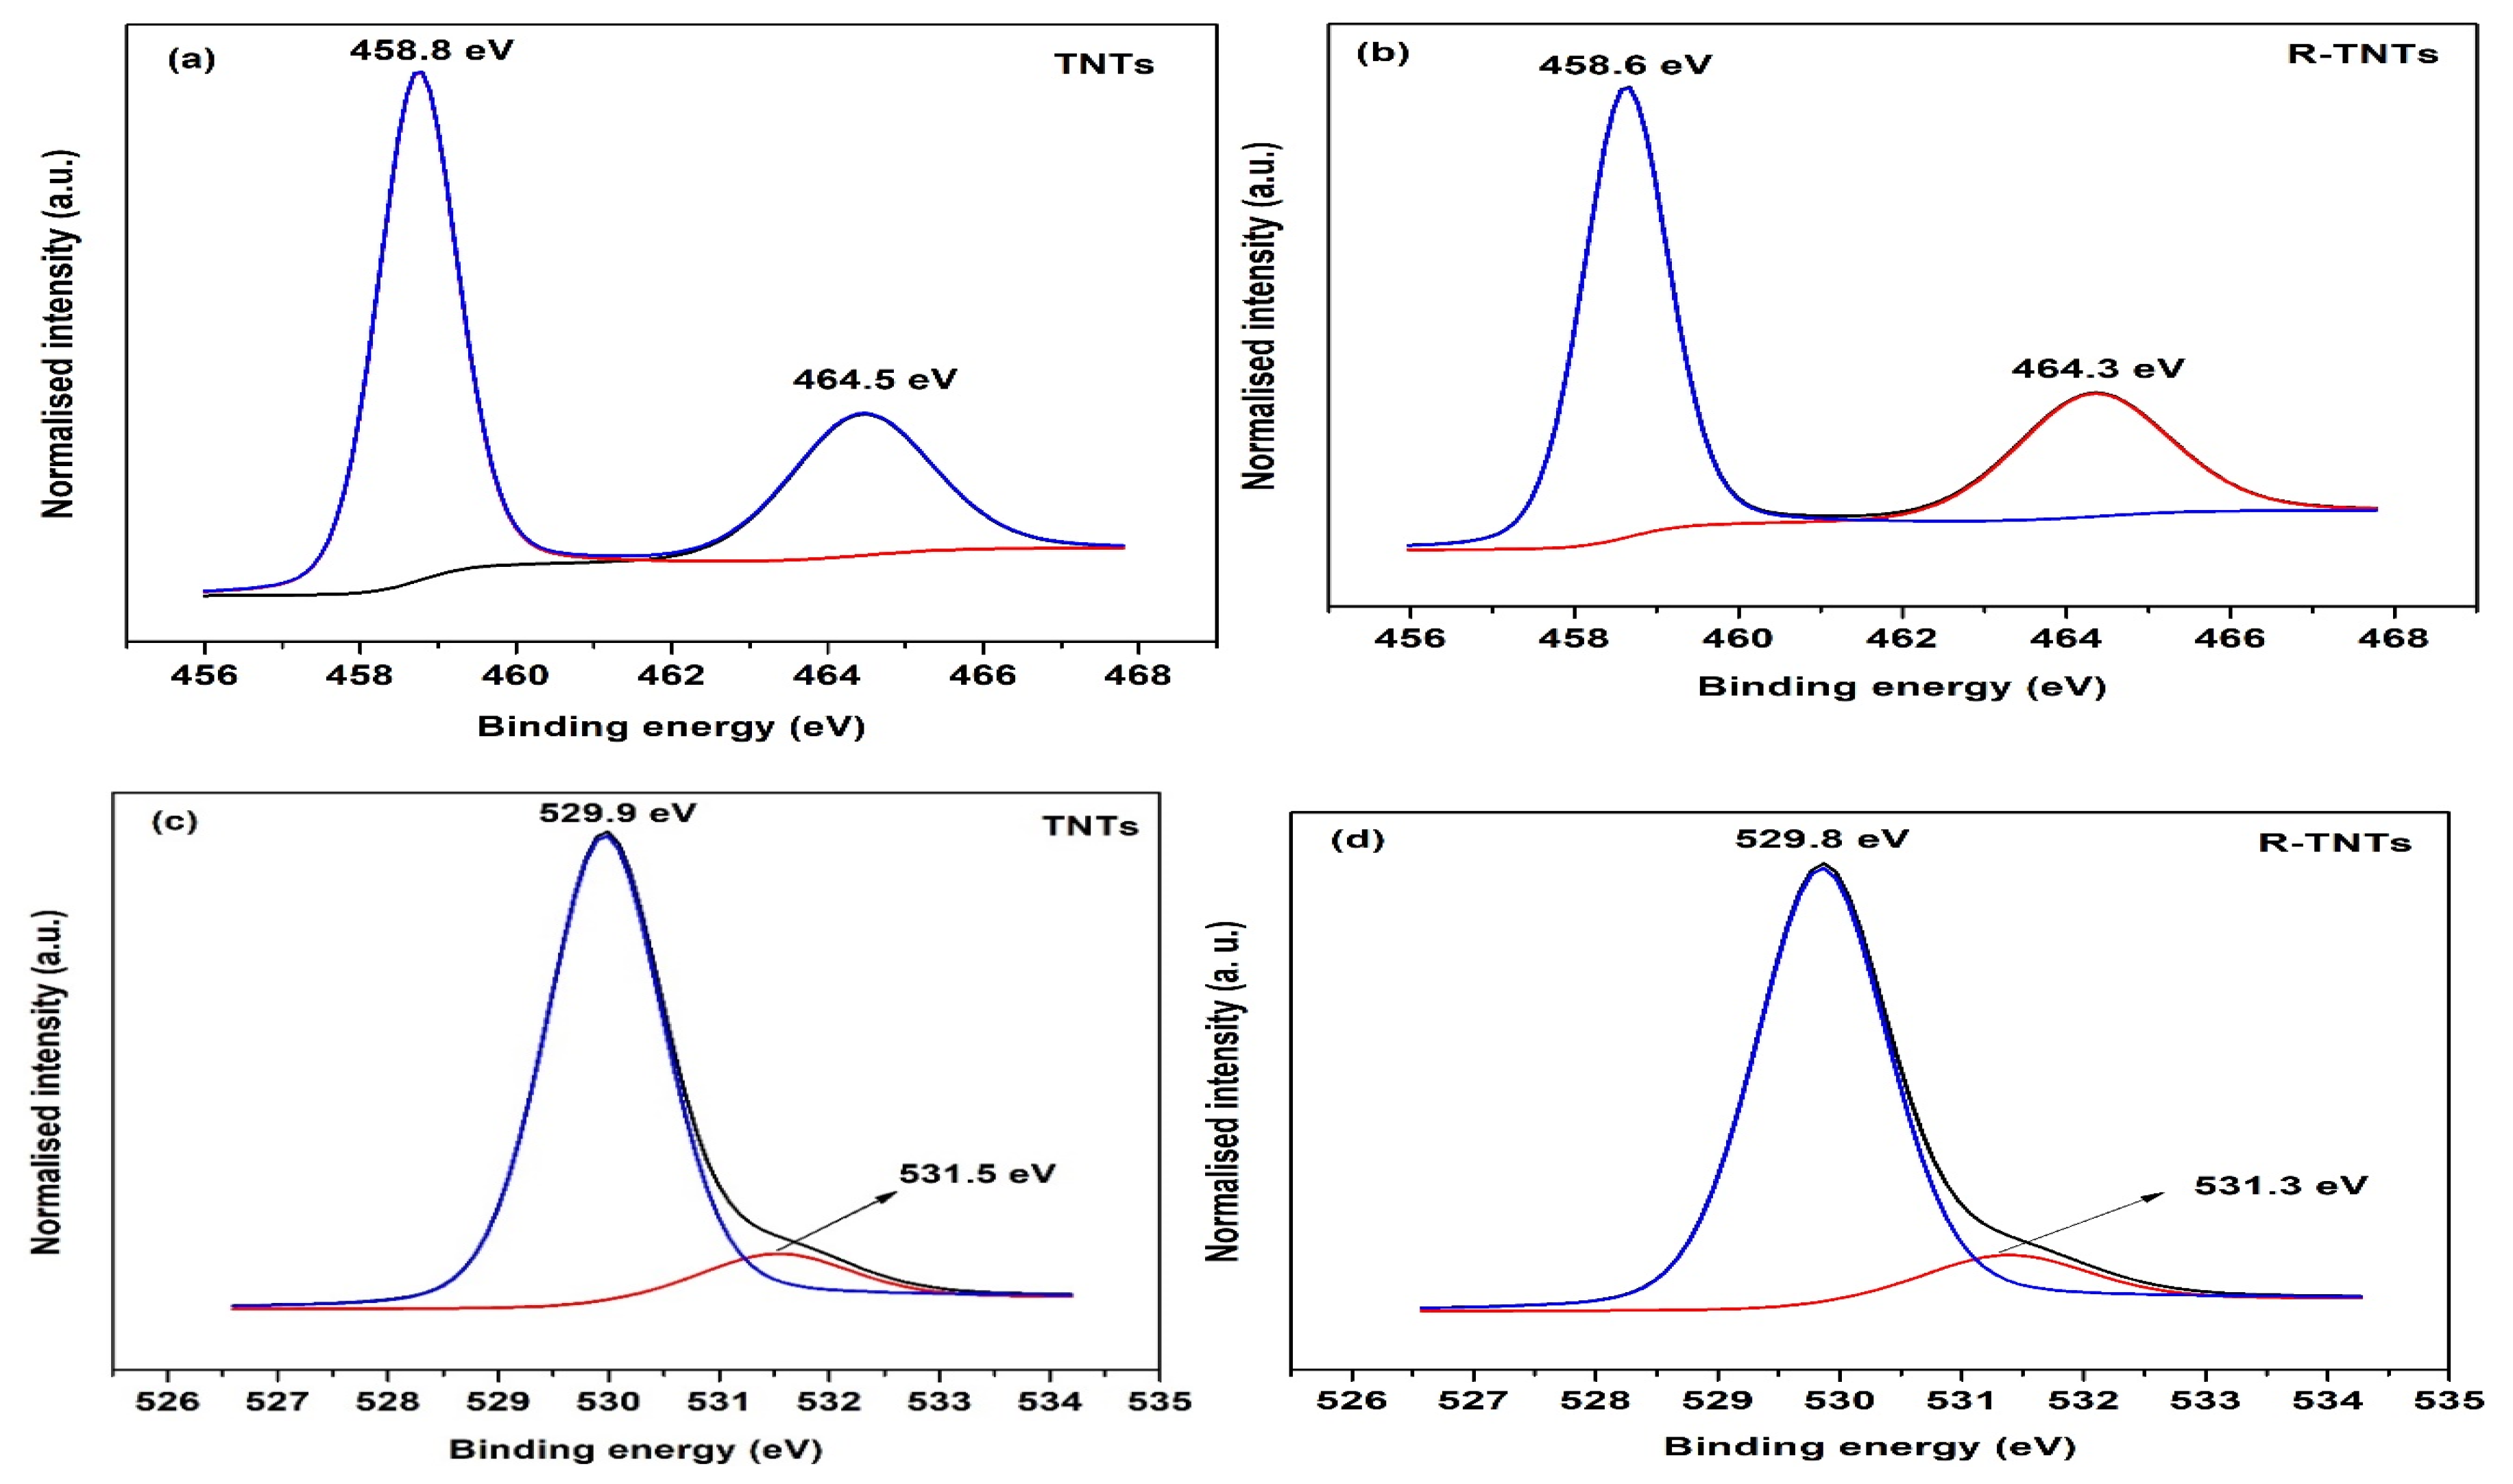
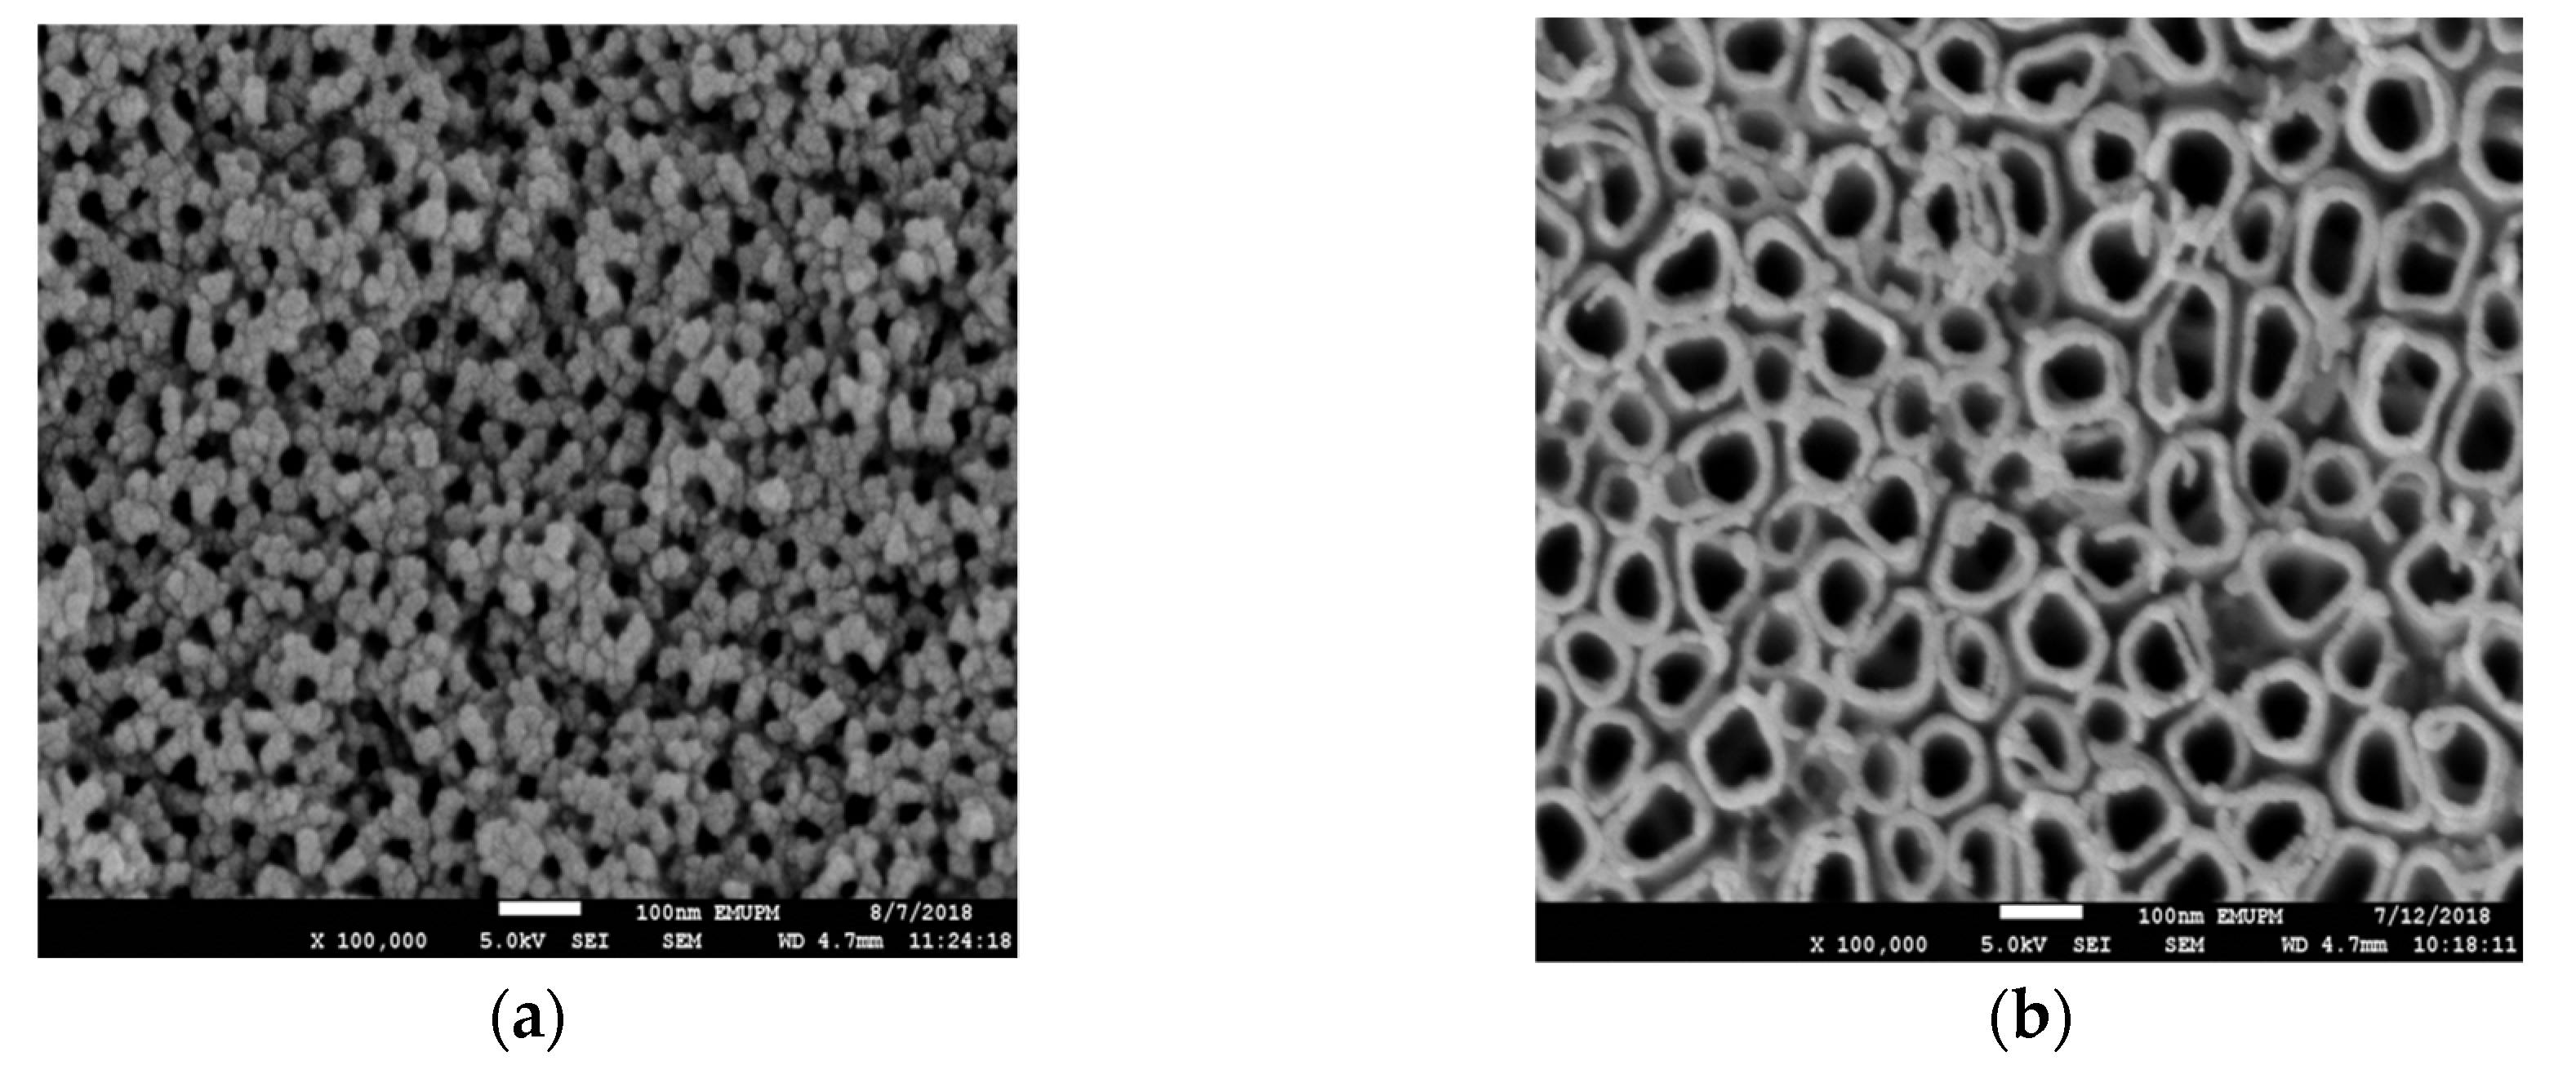
3.1. Material Characterizations
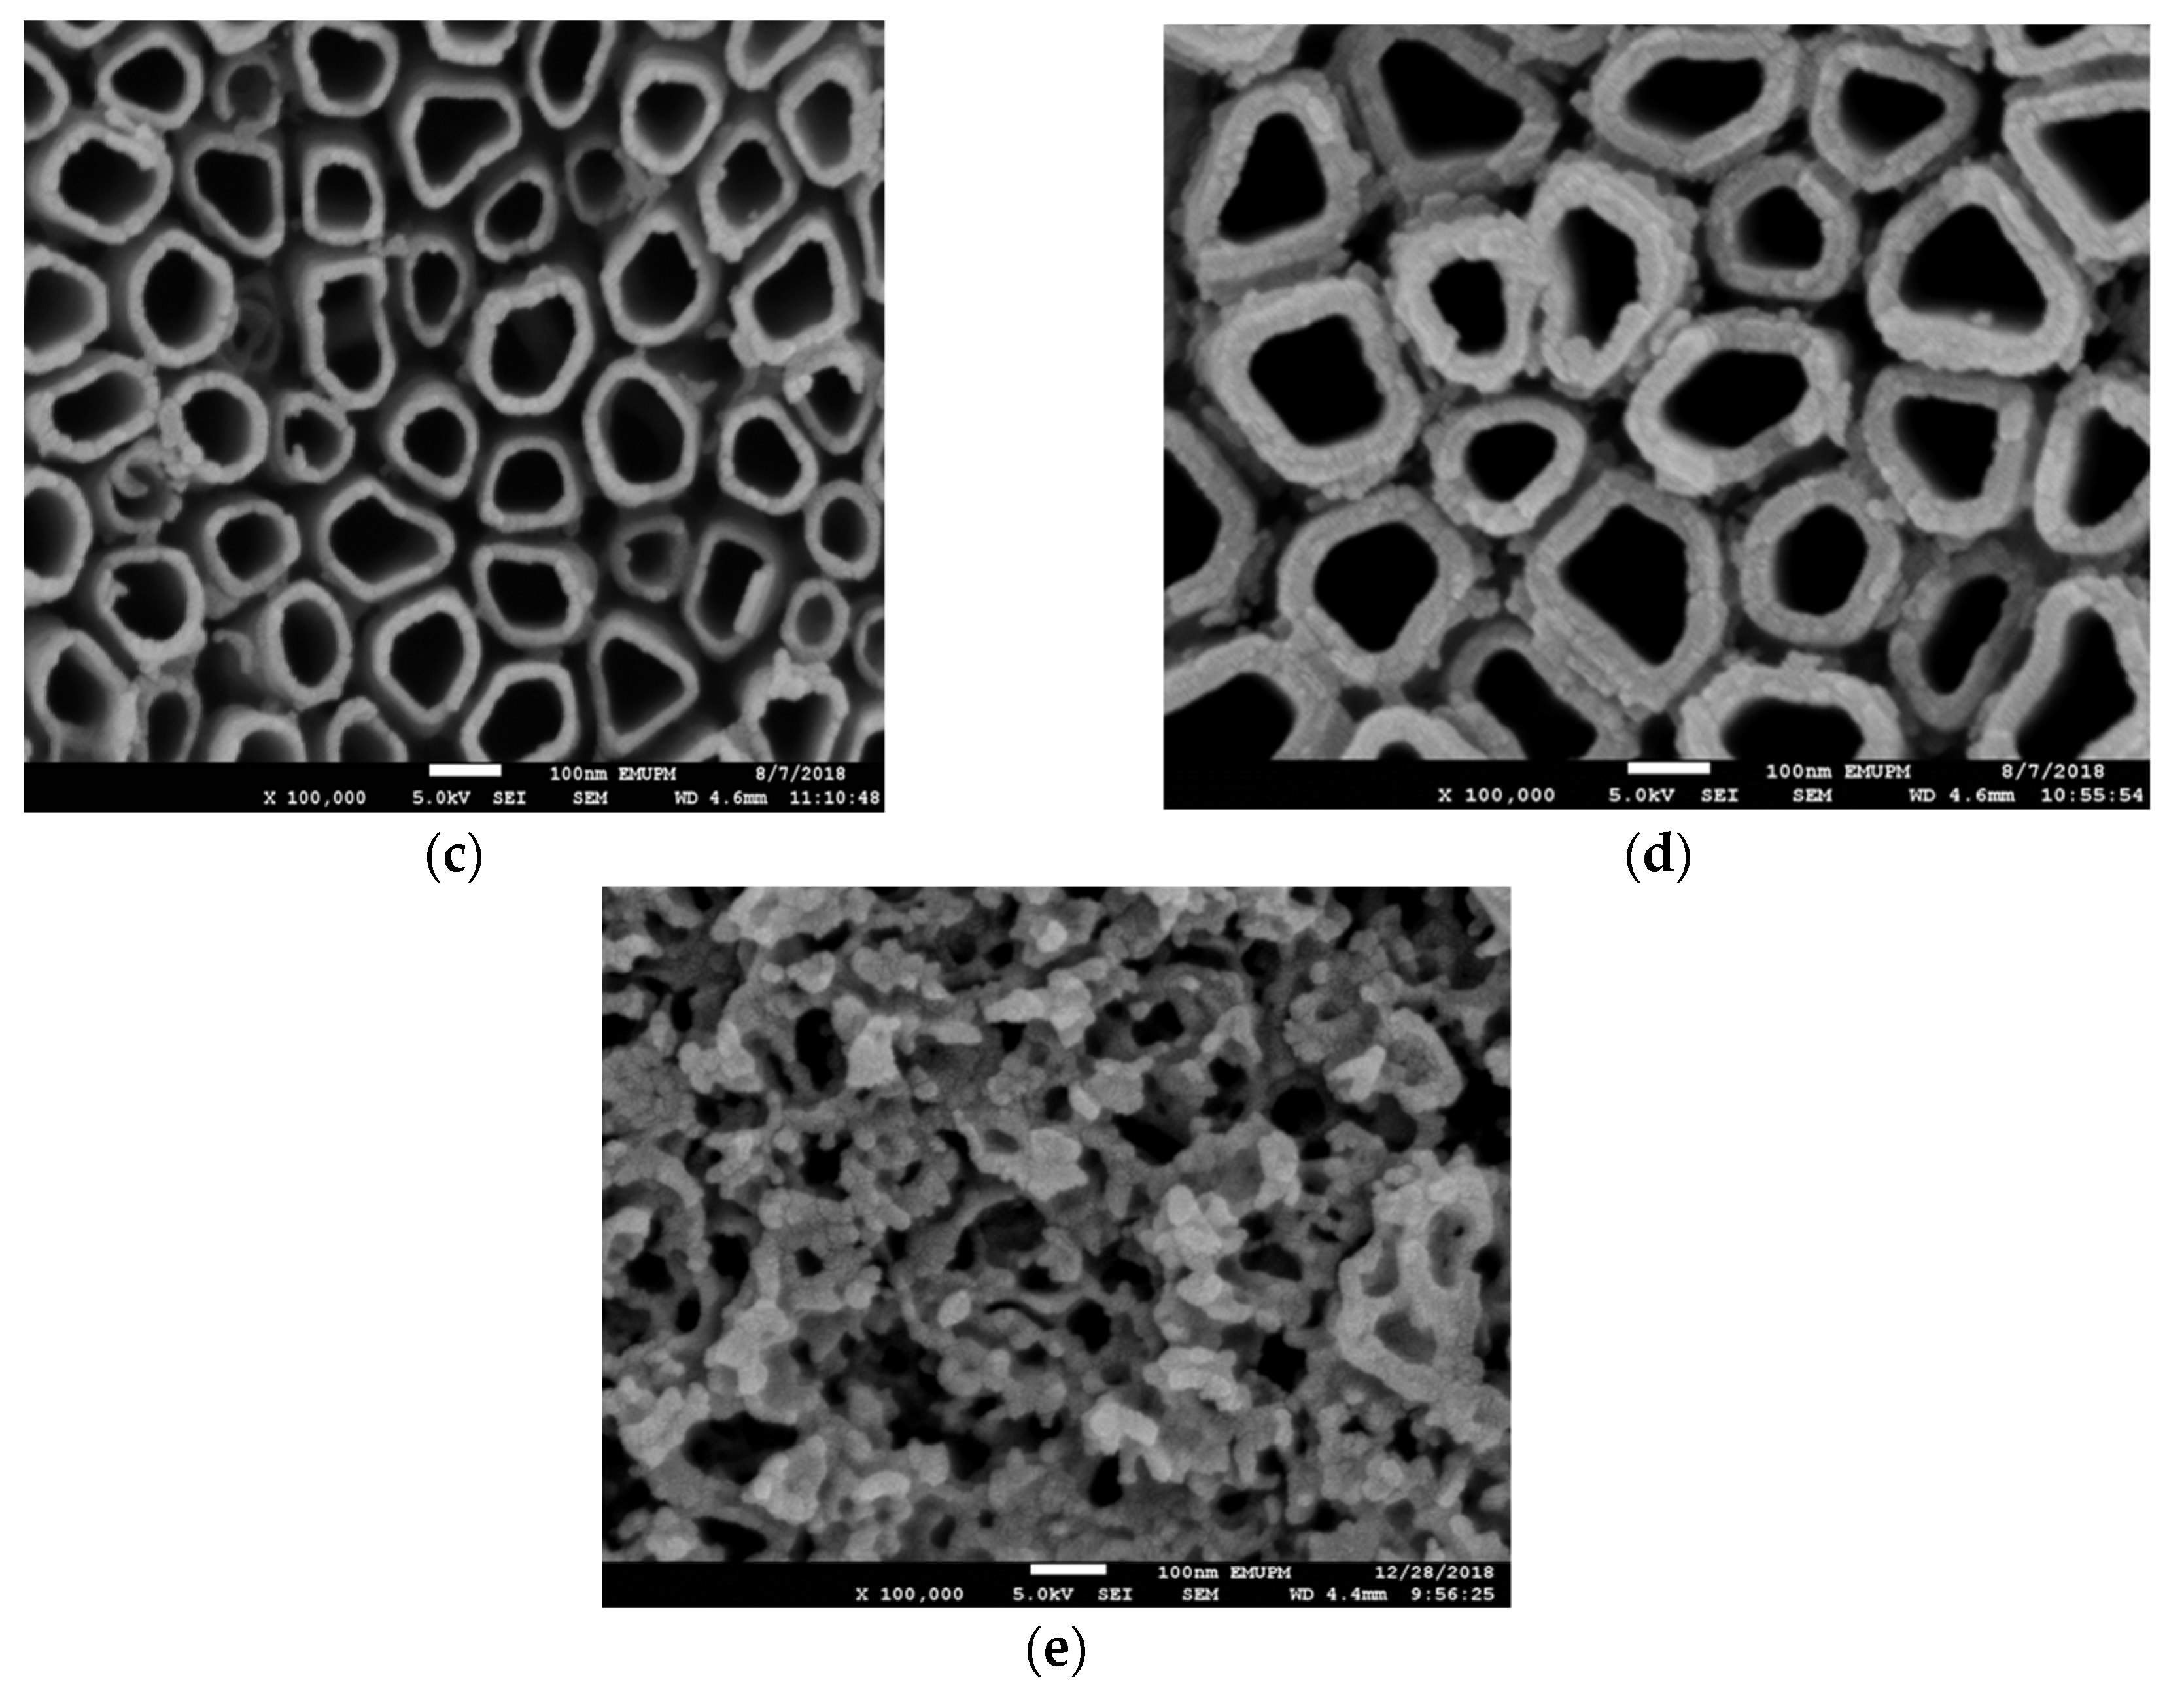
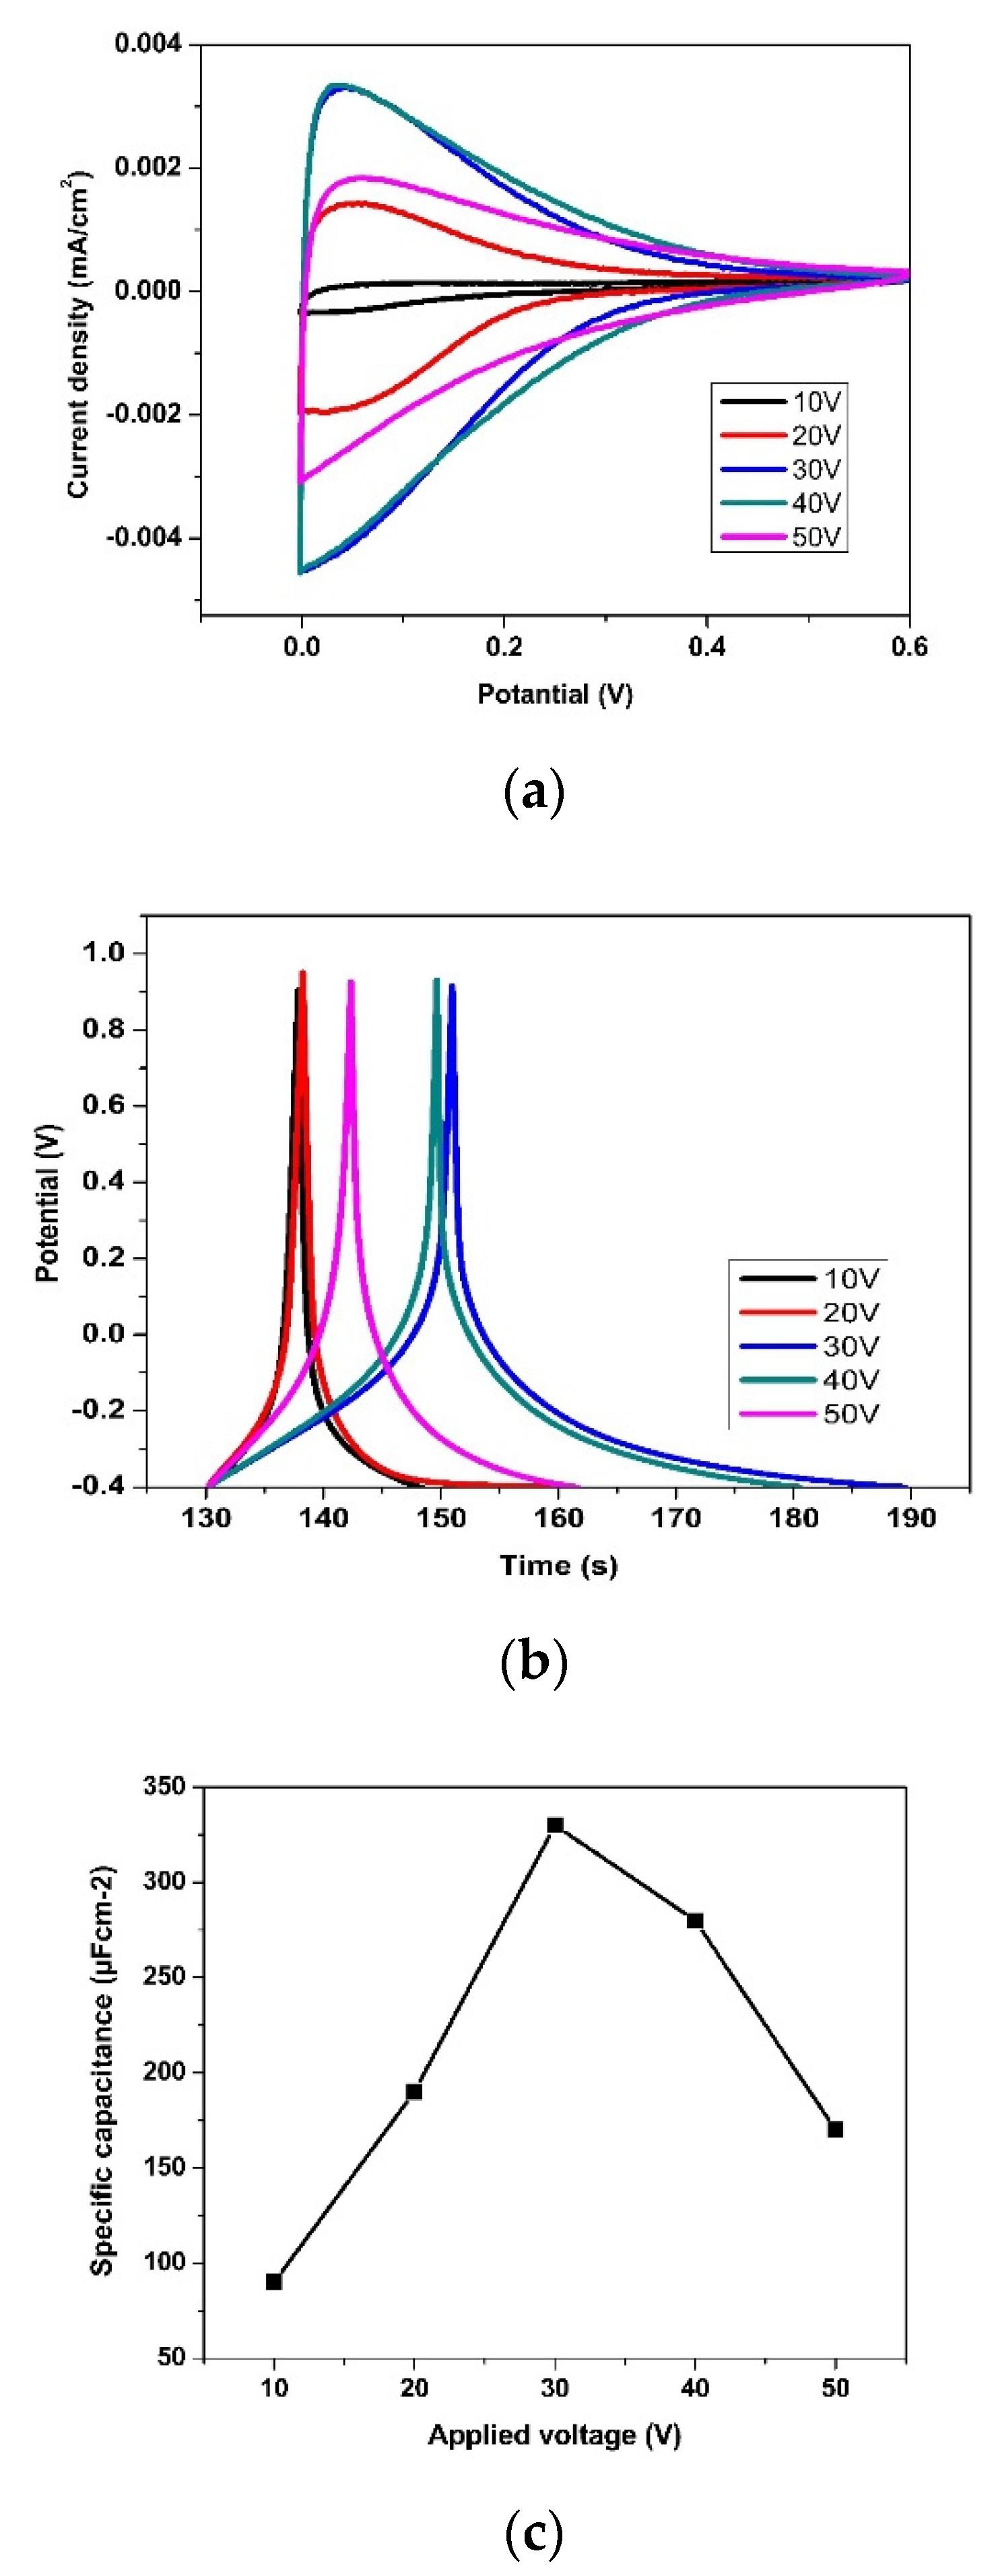
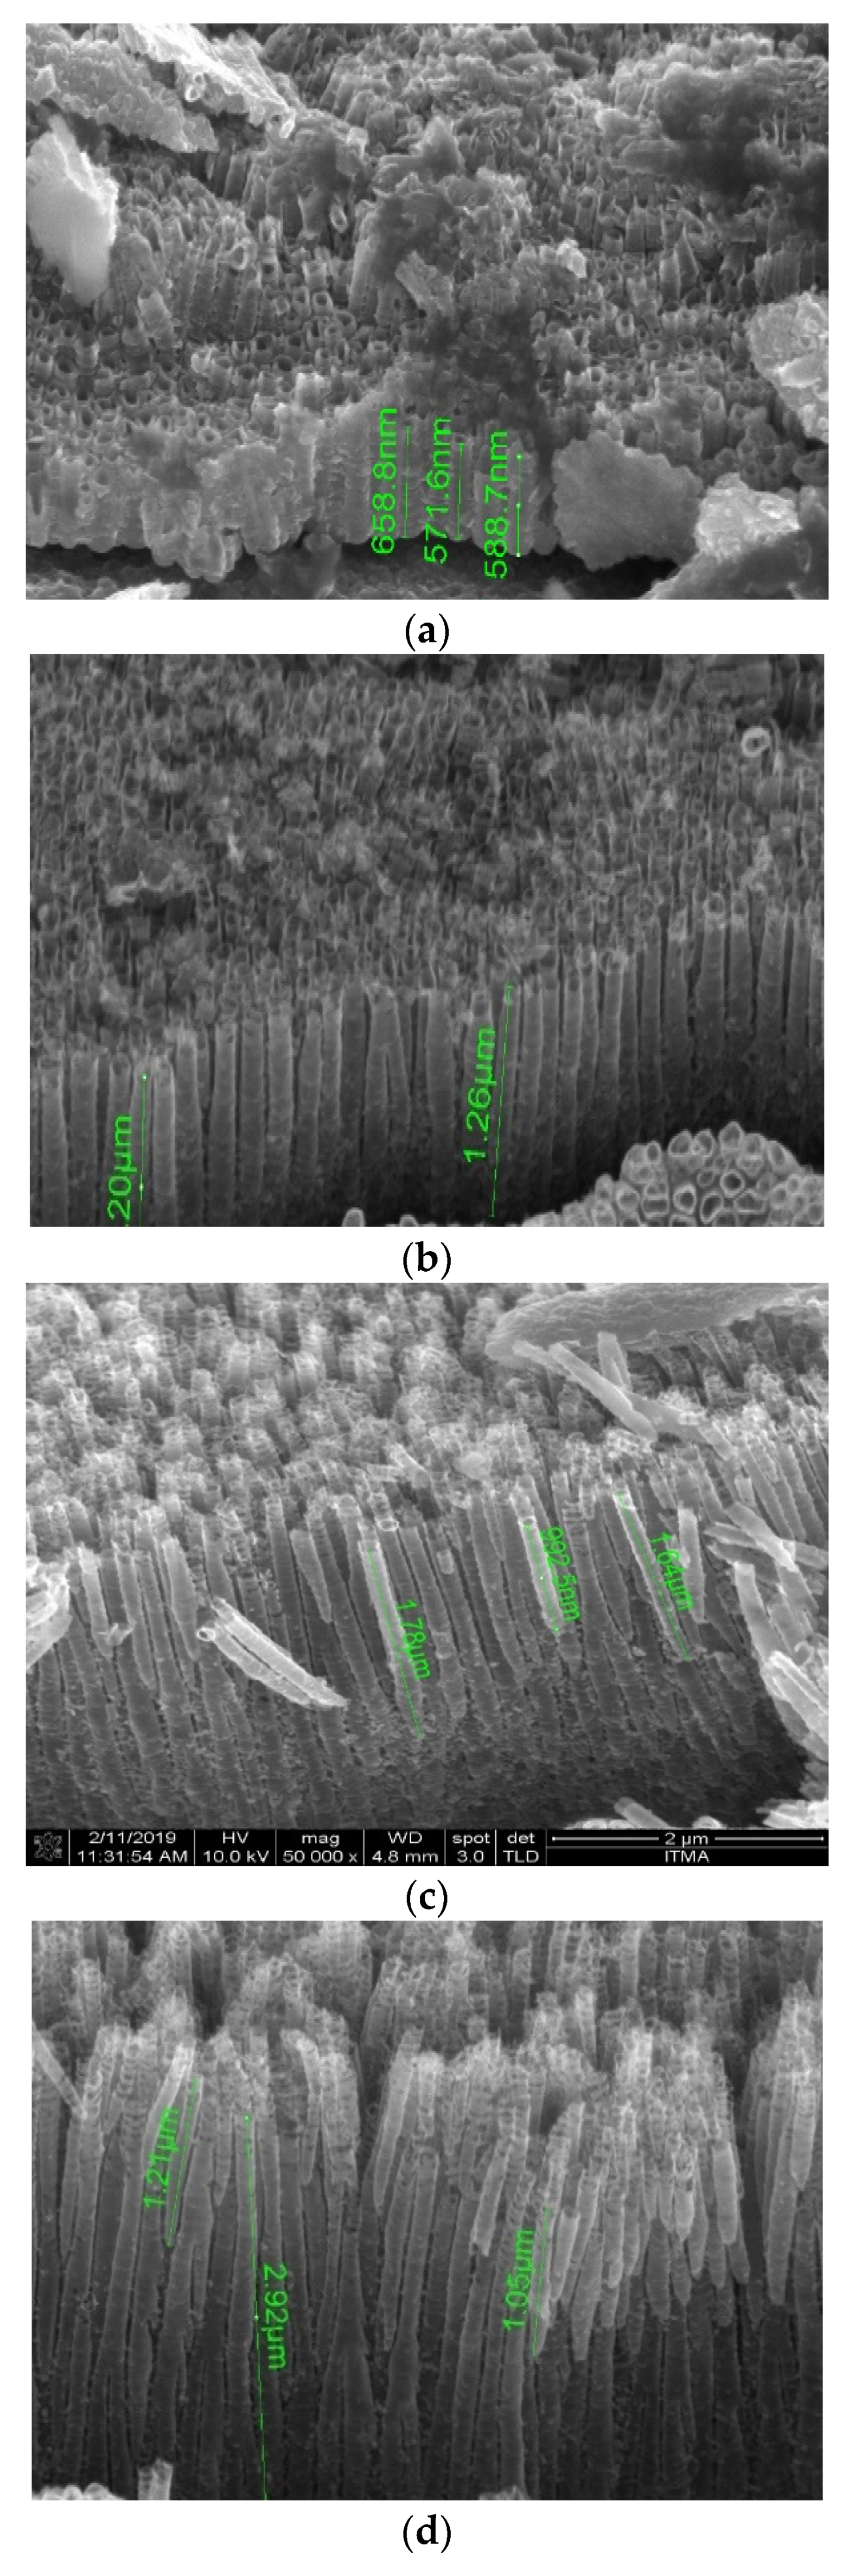
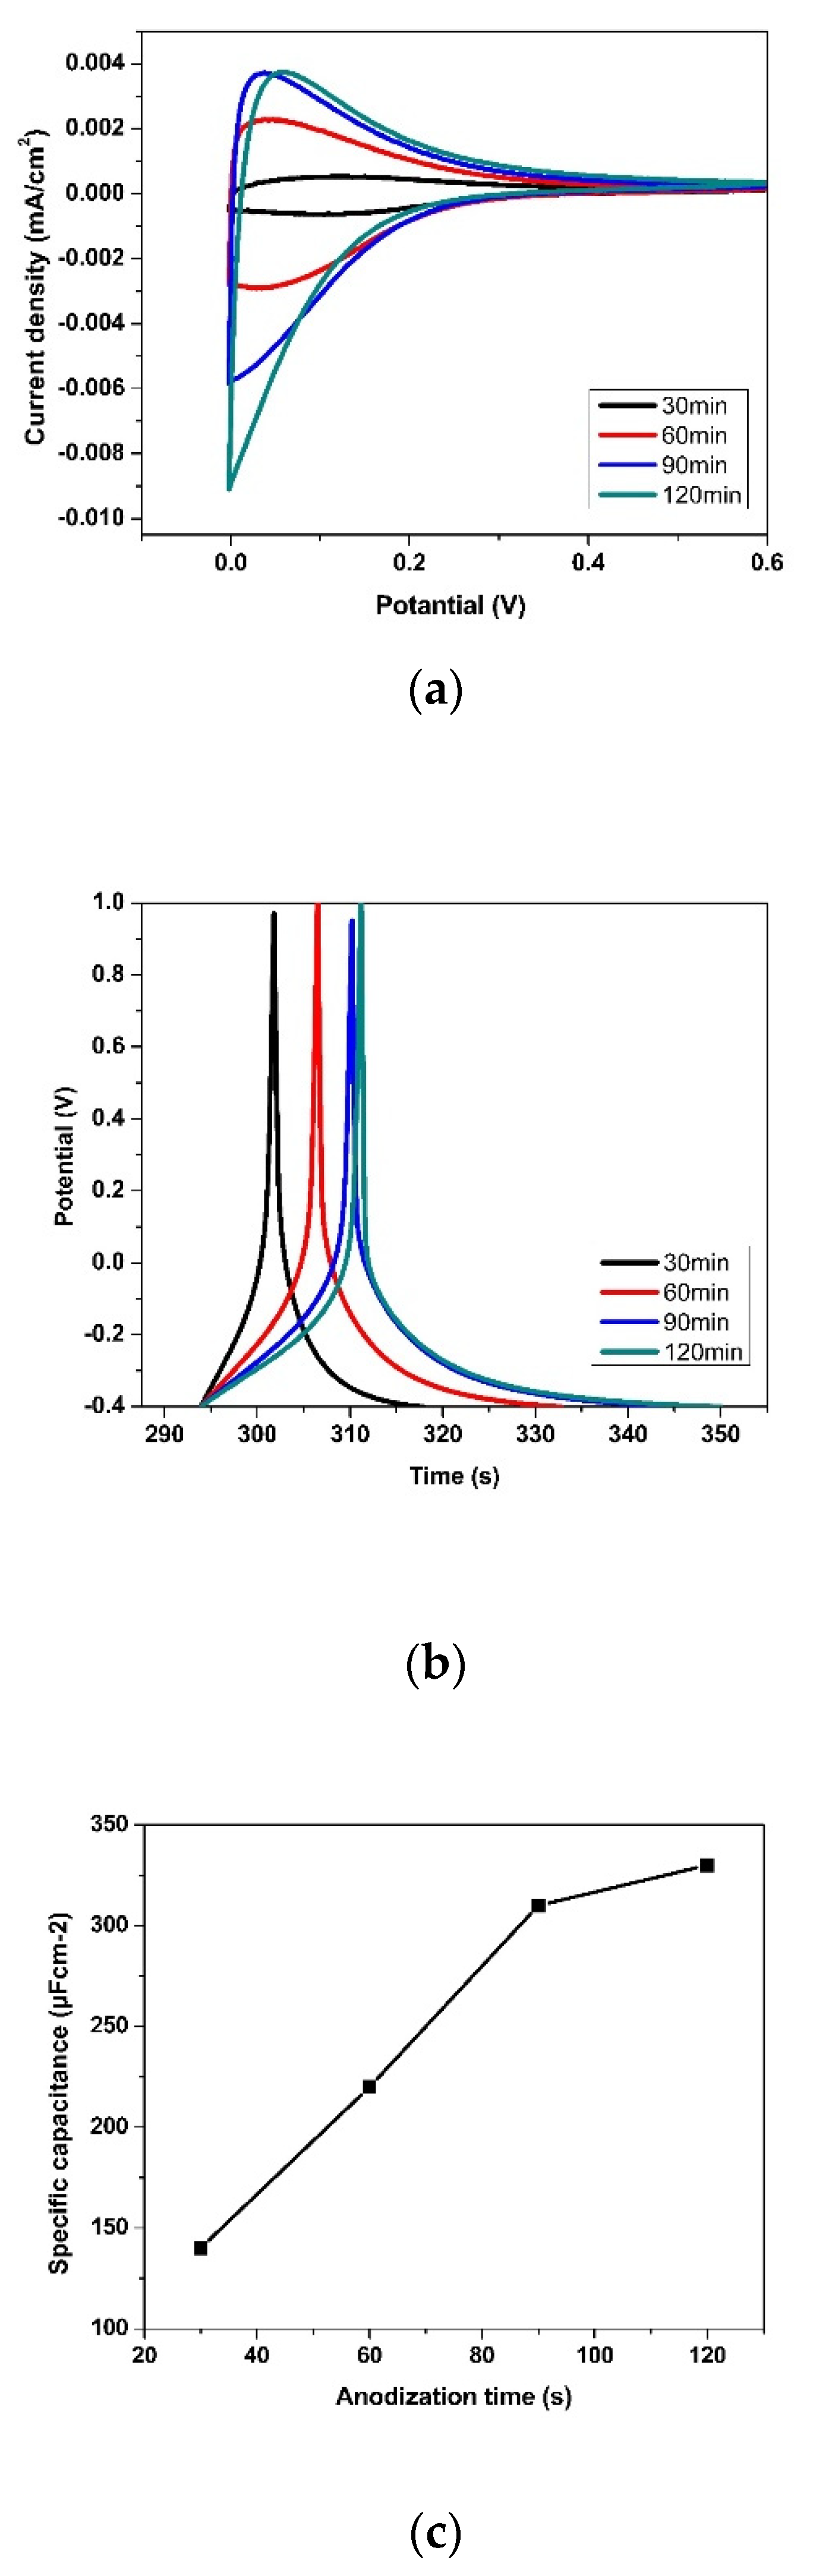
3.2. Effect of Anodization Voltage and Time
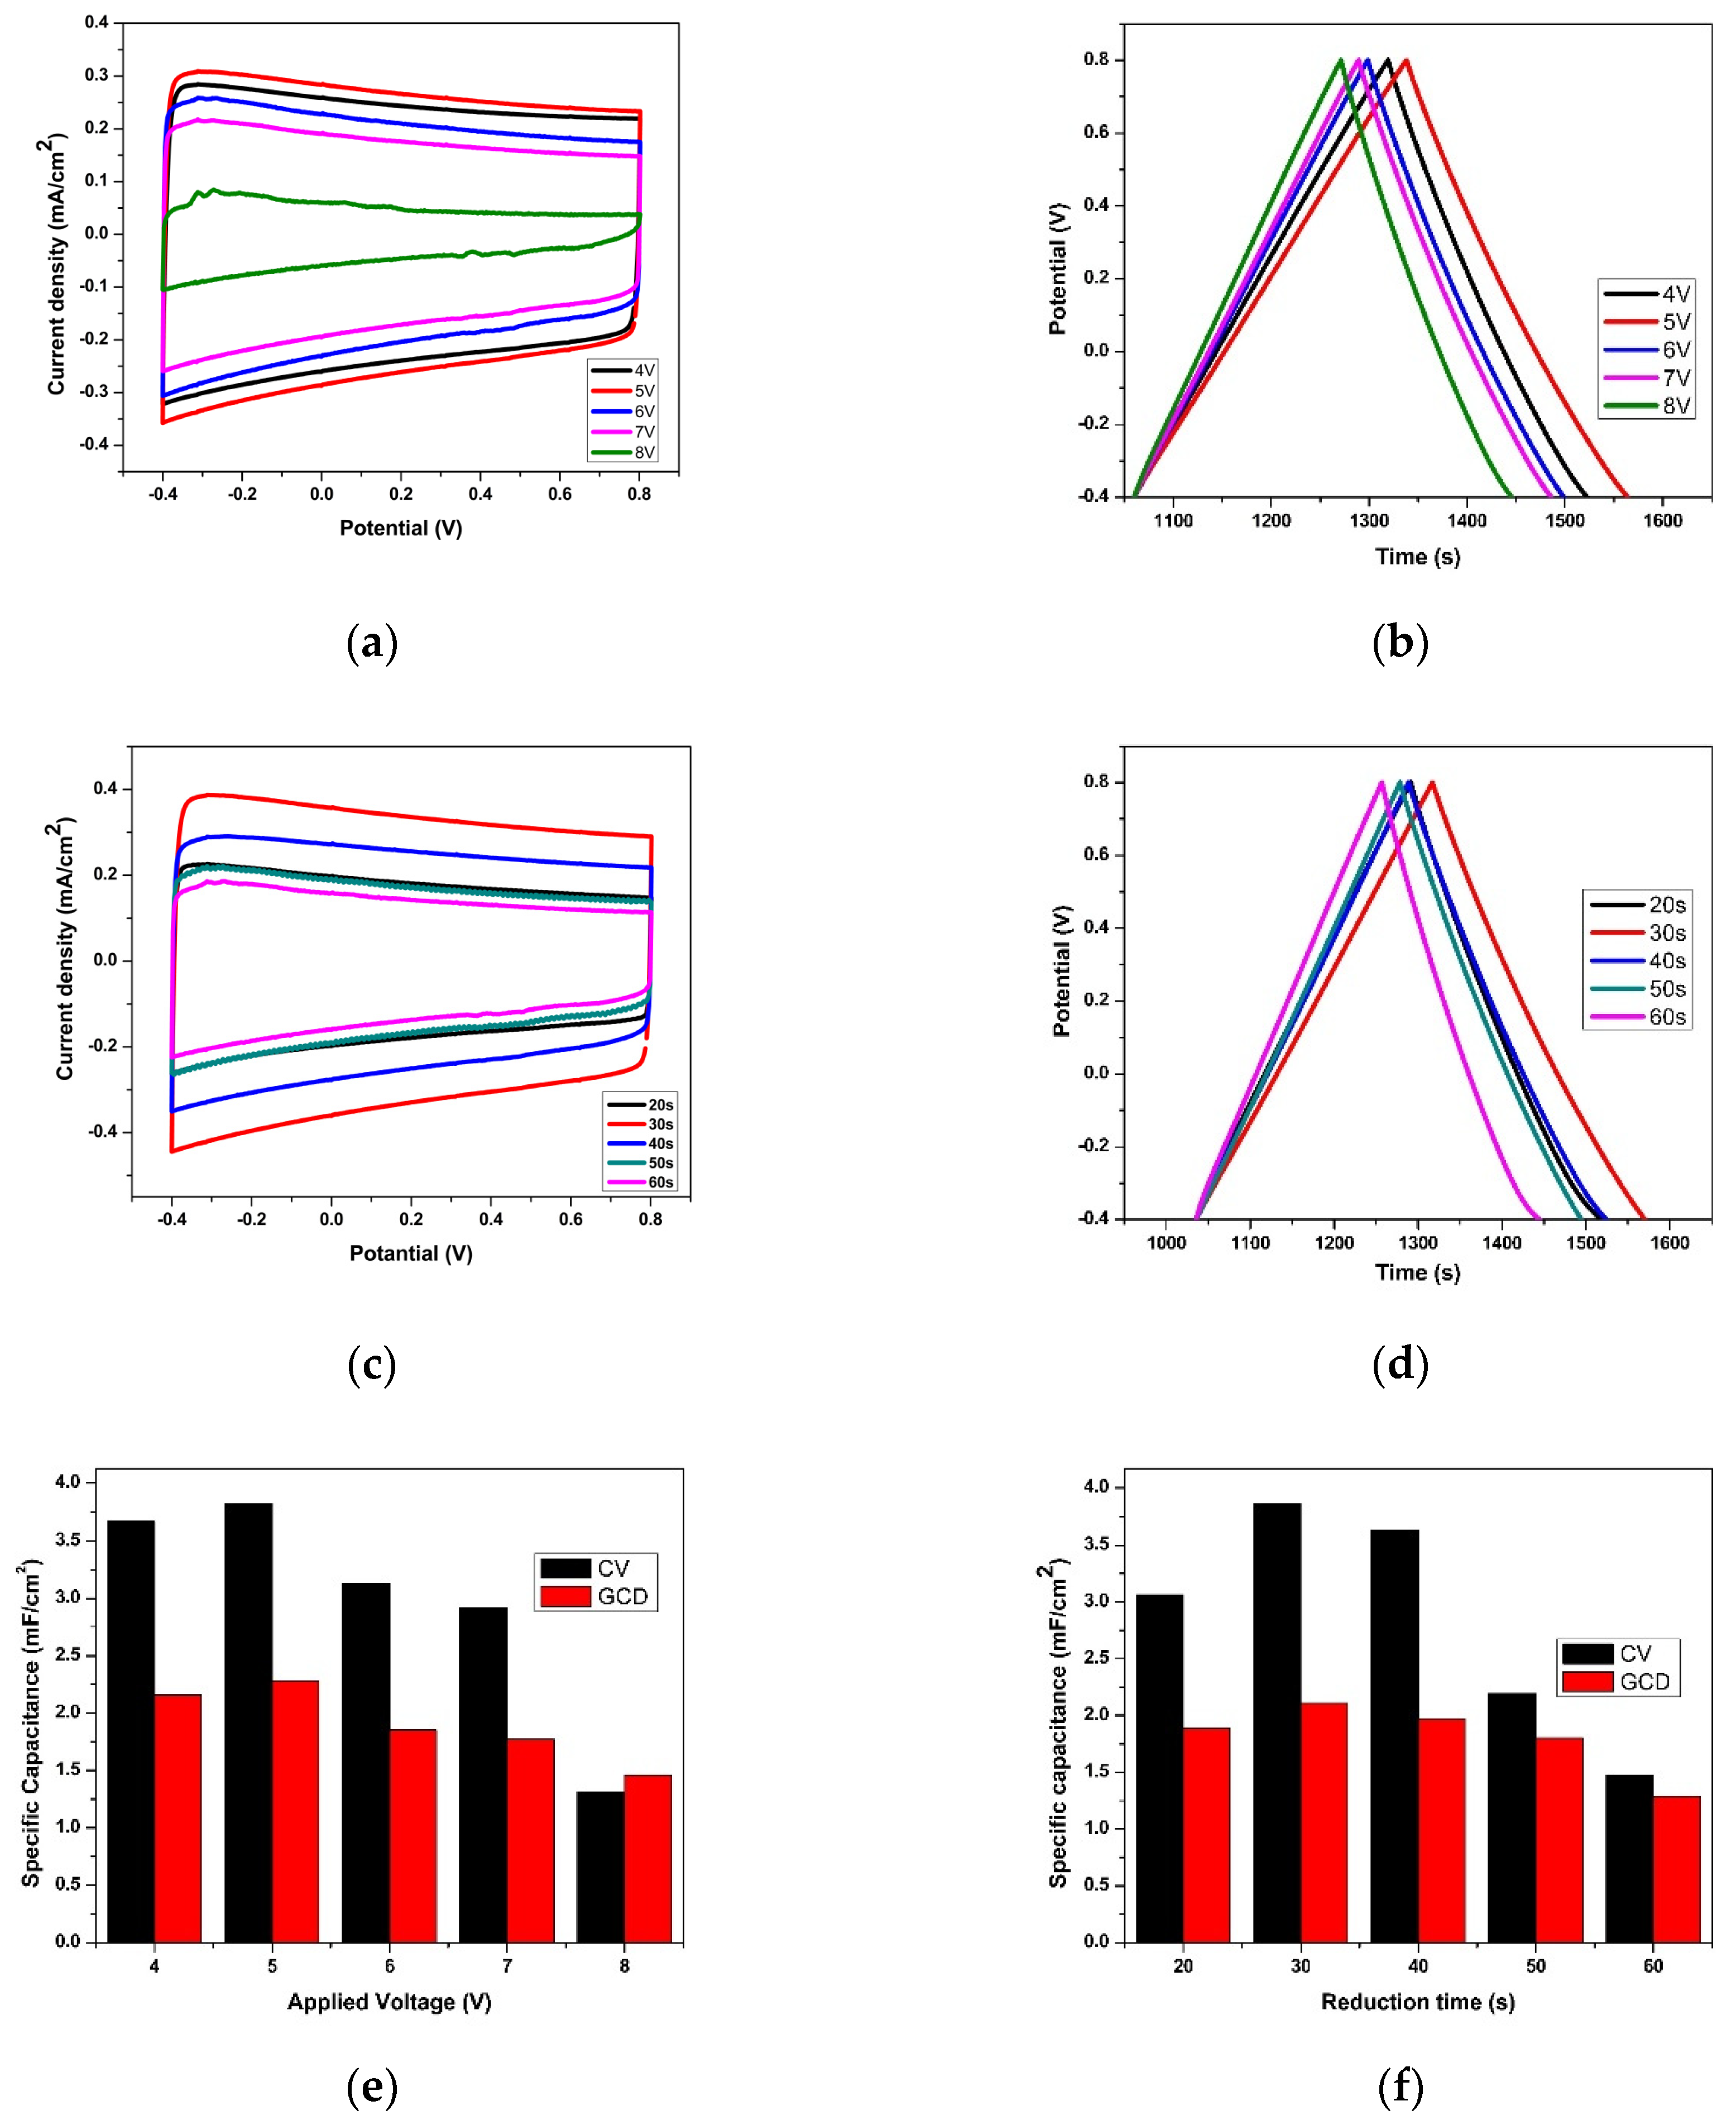
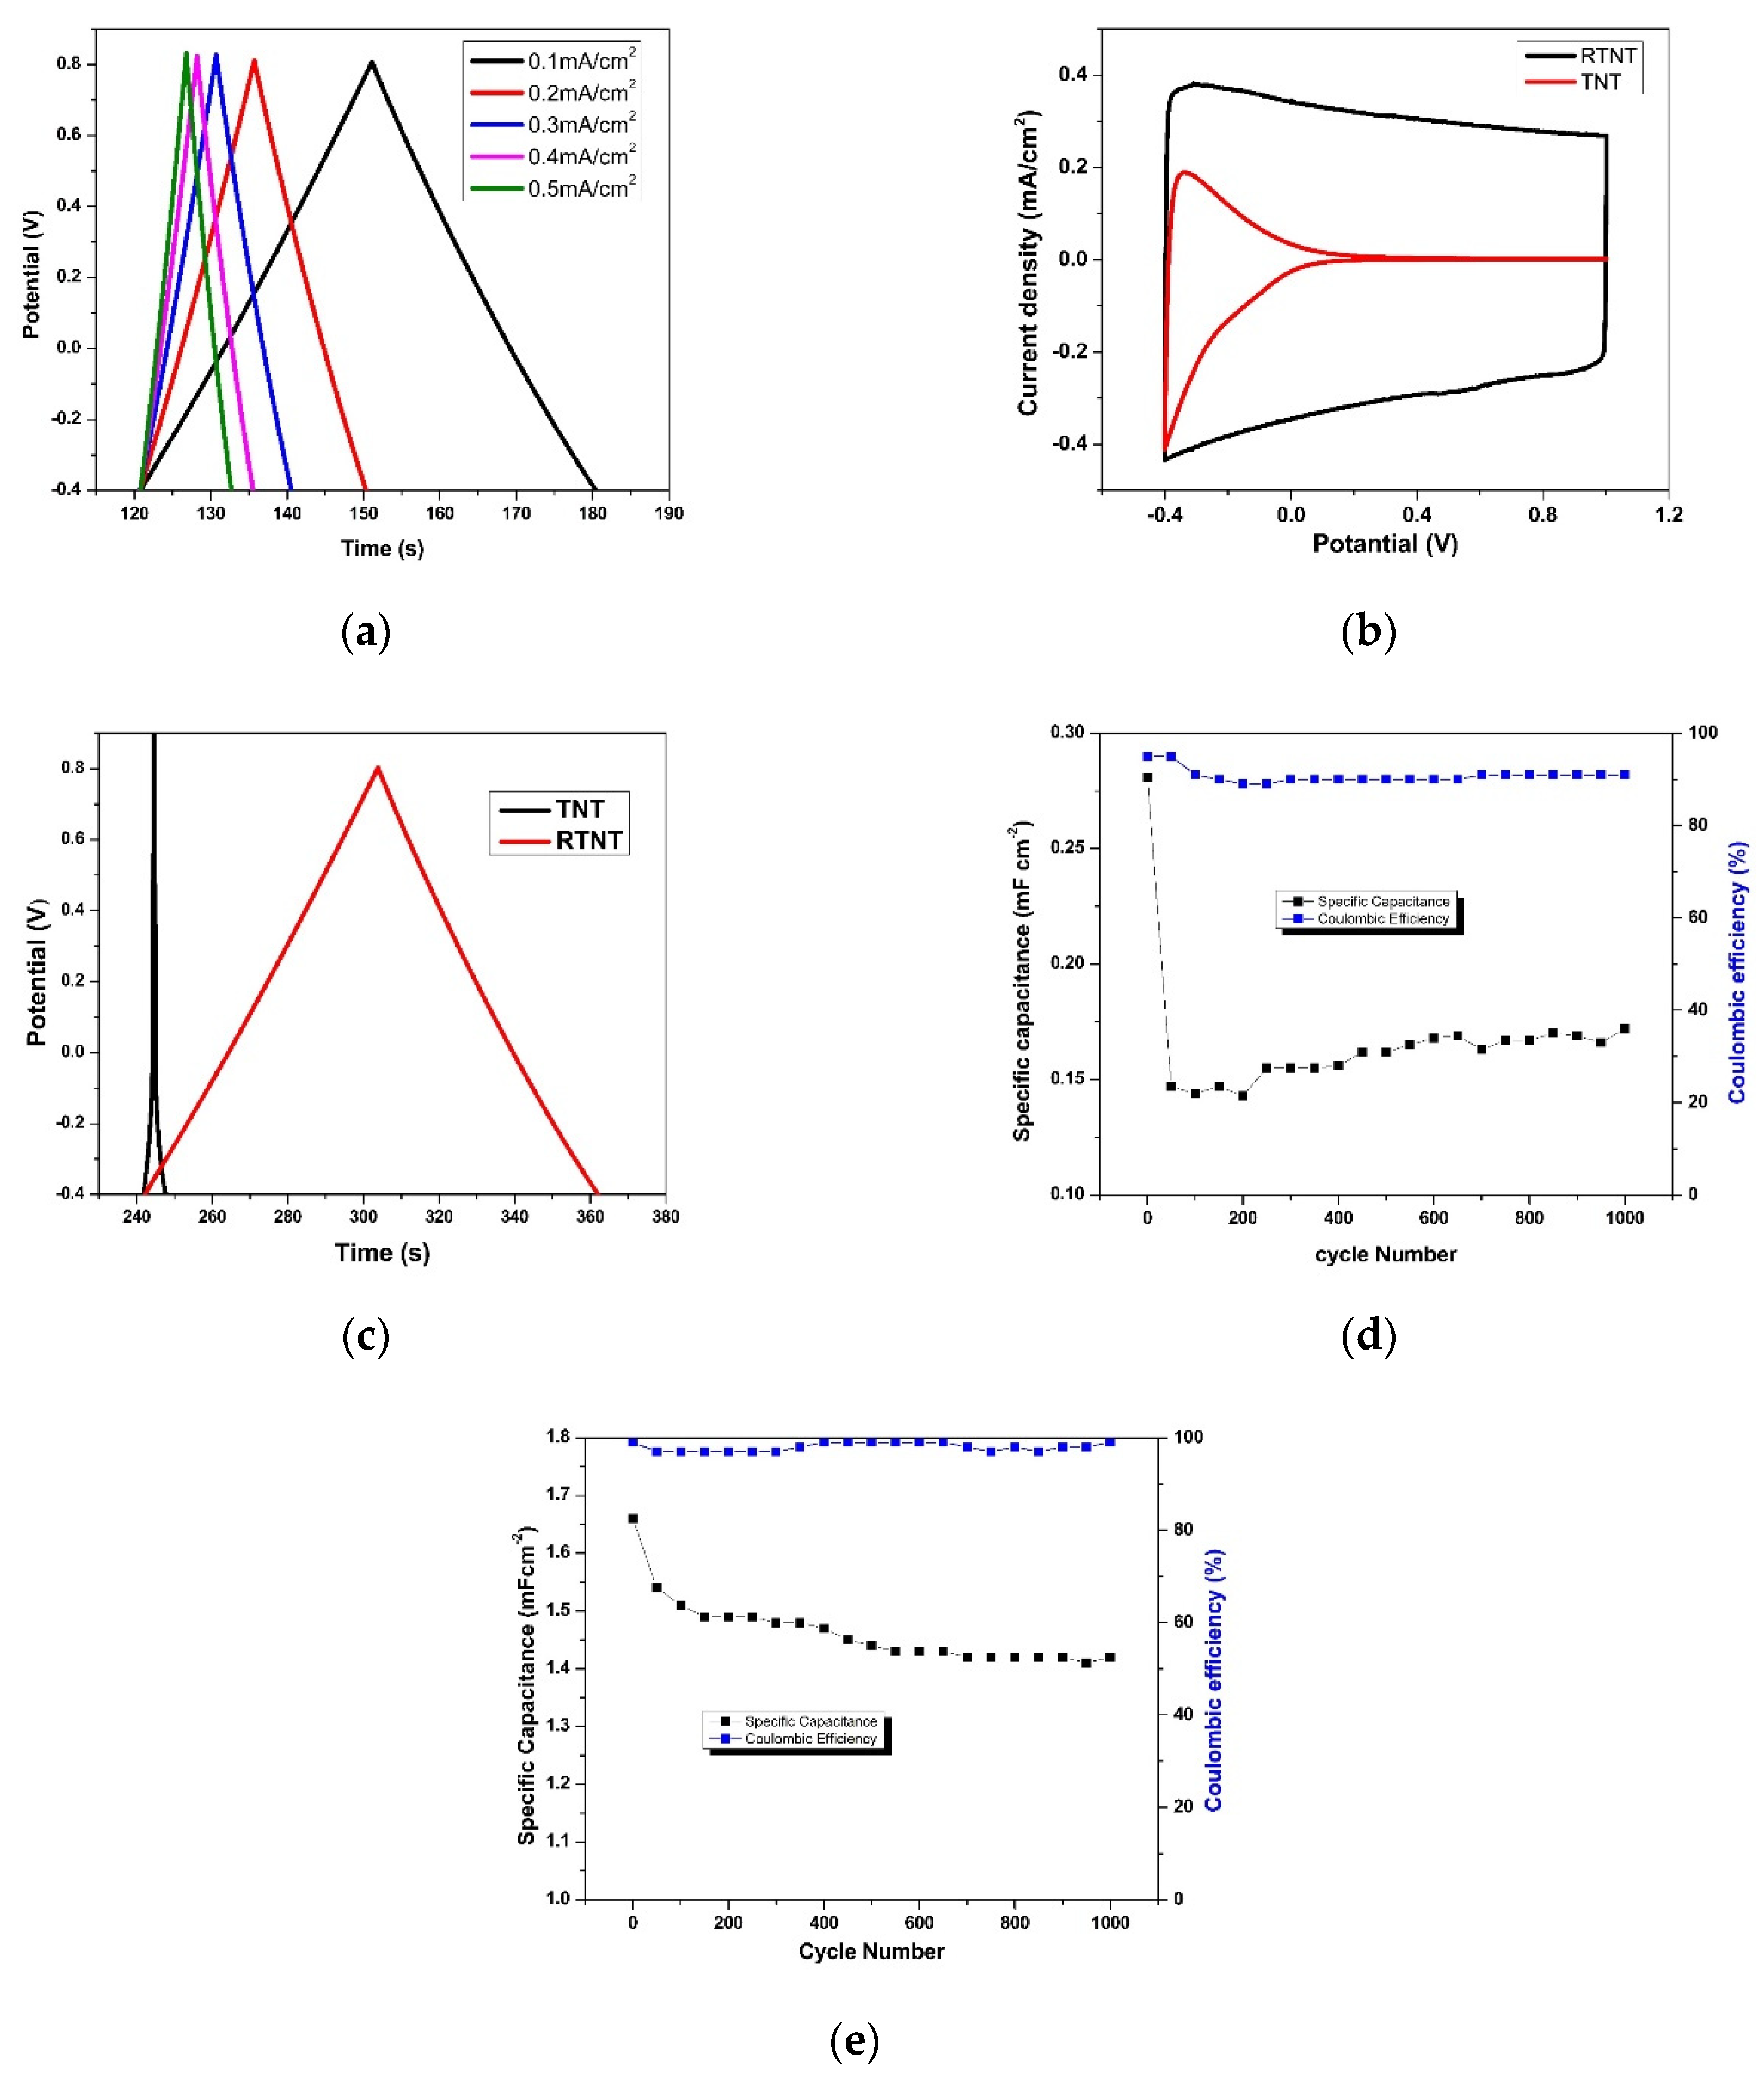
3.3. Effect of Reduction Voltage and Time
4. Conclusions
Supplementary Materials
Author Contributions
Funding
Acknowledgments
Conflicts of Interest
References
- Nasir, S.; Hussein, M.; Zainal, Z.; Yusof, N.; Mohd Zobir, S. Electrochemical Energy Storage Potentials of Waste Biomass: Oil Palm Leaf- and Palm Kernel Shell-Derived Activated Carbons. Energies 2018, 11, 3410. [Google Scholar] [CrossRef] [Green Version]
- Poonam; Sharma, K.; Arora, A.; Tripathi, S.K. Review of Supercapacitors: Materials and Devices. J. Energy Storage 2019, 21, 801–825. [Google Scholar] [CrossRef]
- Auer, A.; Kunze-Liebhäuser, J. Recent Progress in Understanding Ion Storage in Self-Organized Anodic TiO 2 Nanotubes. Small Methods 2018, 3, 1800385. [Google Scholar] [CrossRef] [Green Version]
- Zhou, H.; Zhang, Y. Enhanced Electrochemical Performance of Manganese Dioxide Spheres Deposited on a Titanium Dioxide Nanotube Arrays Substrate. J. Power Sources 2014, 272, 866–879. [Google Scholar] [CrossRef]
- Al-osta, A.; Jadhav, V.V.; Saad, N.A.; Mane, R.S.; Naushad, M. Diameter-Dependent Electrochemical Supercapacitive Properties of Anodized Titanium Oxide Nanotubes. Scr. Mater. 2015, 104, 60–63. [Google Scholar] [CrossRef]
- Momeni, M.M.; Ahadzadeh, I. Fabrication of Tungsten Decorated Titania Nanotube Arrays as Electrode Materials for Supercapacitor Applications. Int. J. Hydrog. Energy 2015, 40, 8769–8777. [Google Scholar] [CrossRef]
- Kulandaivalu, S.; Sulaiman, Y. Recent Advances in Layer-by-Layer Assembled Conducting Polymer Based Composites for Supercapacitors. Energies 2019, 12, 2107. [Google Scholar] [CrossRef] [Green Version]
- Huang, J.Y.; Zhang, K.Q.; Lai, Y.K. Fabrication, Modification, and Emerging Applications of TiO2 nanotube Arrays by Electrochemical Synthesis: A Review. Int. J. Photoenergy 2013, 2013, 761971. [Google Scholar] [CrossRef] [Green Version]
- Samsudin, N.A.; Zainal, Z.; Lim, H.N.; Sulaiman, Y.; Chang, S.K.; Lim, Y.C.; Mohd Amin, W.N. Enhancement of Capacitive Performance in Titania Nanotubes Modified by an Electrochemical Reduction Method. J. Nanomater. 2018, 2018, 9509126. [Google Scholar] [CrossRef]
- Kapusta-Kołodziej, J.; Syrek, K.; Pawlik, A.; Jarosz, M.; Tynkevych, O.; Sulka, G.D. Effects of Anodizing Potential and Temperature on the Growth of Anodic TiO2 and Its Photoelectrochemical Properties. Appl. Surf. Sci. 2017, 396, 1119–1129. [Google Scholar] [CrossRef]
- Valota, A.; LeClere, D.J.; Skeldon, P.; Curioni, M.; Hashimoto, T.; Berger, S.; Kunze, J.; Schmuki, P.; Thompson, G.E. Influence of Water Content on Nanotubular Anodic Titania Formed in Fluoride/Glycerol Electrolytes. Electrochim. Acta 2009, 54, 4321–4327. [Google Scholar] [CrossRef]
- Ying Chin, L.; Zainal, Z.; Khusaimi, Z.; Ismail, S.S. Electrochemical Synthesis of Ordered Titania Nanotubes in Mixture of Ethylene Glycol and Glycerol Electrolyte. Malays. J. Anal. Sci. 2016, 20, 373–381. [Google Scholar] [CrossRef]
- Sreekantan, S.; Saharudin, K.A.; Lockman, Z.; Tzu, T.W. Fast-Rate Formation of TiO2 Nanotube Arrays in an Organic Bath and Their Applications in Photocatalysis. Nanotechnology 2010, 21, 36. [Google Scholar] [CrossRef] [PubMed] [Green Version]
- Pan, D.; Huang, H.; Wang, X.; Wang, L.; Liao, H.; Li, Z.; Wu, M. C-Axis Preferentially Oriented and Fully Activated TiO2 Nanotube Arrays for Lithium Ion Batteries and Supercapacitors. J. Mater. Chem. A 2014, 2, 11454–11464. [Google Scholar] [CrossRef]
- Yoriya, S.; Paulose, M.; Varghese, O.K.; Mor, G.K.; Grimes, C.A. Fabrication of Vertically Oriented TiO2 Nanotube Arrays Using Dimethyl Sulfoxide Electrolytes. J. Phys. Chem. C 2007, 111, 13770–13776. [Google Scholar] [CrossRef]
- Salari, M.; Aboutalebi, S.H.; Chidembo, A.T.; Innis, P.C.; Konstantinov, K.; Liu, H.K.; Schmuki, P. Design of Self-Assembled TiO2 Architectures: Towards Hybrid Nanotubular Interfaces. Phys. Status Solidi Appl. Mater. Sci. 2014, 211, 938–945. [Google Scholar] [CrossRef]
- Mehedi, I.M.; Hossain, M.F.; Takahashi, T.; Islam, M.S. Nano-Structural Variation of Highly Aligned Anodic Titania Nanotube Arrays for Gas Phase Photocatalytic Application. J. Photochem. Photobiol. A Chem. 2017, 335, 200–210. [Google Scholar] [CrossRef]
- Regonini, D.; Clemens, F.J. Anodized TiO2 Nanotubes: Effect of Anodizing Time on Film Length, Morphology and Photoelectrochemical Properties. Mater. Lett. 2015, 142, 97–101. [Google Scholar] [CrossRef]
- Endut, Z.; Hamdi, M.; Basirun, W.J. An Investigation on Formation and Electrochemical Capacitance of Anodized Titania Nanotubes. Appl. Surf. Sci. 2013, 280, 962–966. [Google Scholar] [CrossRef]
- Kapusta-Kołodziej, J.; Tynkevych, O.; Pawlik, A.; Jarosz, M.; Mech, J.; Sulka, G.D. Electrochemical Growth of Porous Titanium Dioxide in a Glycerol-Based Electrolyte at Different Temperatures. Electrochim. Acta 2014, 144, 127–135. [Google Scholar] [CrossRef]
- Chua, C.W.; Zainal, Z.; Lim, H.N.; Chang, S.K. Effect of Electrolytes on the Electrochemical Performance of Nickel Cobaltite–Titania Nanotubes Composites as Supercapacitive Materials. J. Mater. Sci. Mater. Electron. 2018, 29, 14445–14454. [Google Scholar] [CrossRef]
- Lu, X.; Wang, G.; Zhai, T.; Yu, M.; Gan, J.; Tong, Y.; Li, Y. Hydrogenated TiO2 Nanotube Arrays for Supercapacitors. Nano Lett. 2012, 12, 1690–1696. [Google Scholar] [CrossRef]
- Salari, M.; Konstantinov, K.; Liu, H.K. Enhancement of the Capacitance in TiO2 Nanotubes through Controlled Introduction of Oxygen Vacancies. J. Mater. Chem. 2011, 21, 5128–5133. [Google Scholar] [CrossRef] [Green Version]
- Li, Z.; Ding, Y.; Kang, W.; Li, C.; Lin, D.; Wang, X.; Chen, Z.; Wu, M.; Pan, D. Reduction Mechanism and Capacitive Properties of Highly Electrochemically Reduced TiO2 Nanotube Arrays. Electrochim. Acta 2015, 161, 40–47. [Google Scholar] [CrossRef]
- Wu, H.; Li, D.; Zhu, X.; Yang, C.; Liu, D.; Chen, X.; Song, Y.; Lu, L. High-Performance and Renewable Supercapacitors Based on TiO2 Nanotube Array Electrodes Treated by an Electrochemical Doping Approach. Electrochim. Acta 2014, 116, 129–136. [Google Scholar] [CrossRef]
- Zhou, H.; Zhang, Y. Enhancing the Capacitance of TiO2 Nanotube Arrays by a Facile Cathodic Reduction Process. J. Power Sources 2013, 239, 128–131. [Google Scholar] [CrossRef]
- Samsudin, N.A.; Zainal, Z.; Lim, H.N.; Sulaiman, Y.; Chang, S.K.; Lim, Y.C.; Ayal, A.K.; Mohd Amin, W.N. Capacitive Performance of Vertically Aligned Reduced Titania Nanotubes Coated with Mn2O3 by Reverse Pulse Electrodeposition. RSC Adv. 2018, 8, 23040–23047. [Google Scholar] [CrossRef] [Green Version]
- Liu, J.; Li, J.; Dai, M.; Hu, Y.; Cui, J.; Wang, Y.; Tan, H.H.; Wu, Y. Photo-Assisted Synthesis of Coaxial-Structured Polypyrrole/Electrochemically Hydrogenated TiO2 Nanotube Arrays as a High Performance Supercapacitor Electrode. RSC Adv. 2018, 8, 13393–13400. [Google Scholar] [CrossRef] [Green Version]
- Indira, K.; Mudali, U.K.; Nishimura, T.; Rajendran, N. A Review on TiO2 Nanotubes: Influence of Anodization Parameters, Formation Mechanism, Properties, Corrosion Behavior, and Biomedical Applications. J. Bio- Tribo-Corrosion 2015, 1, 1–22. [Google Scholar] [CrossRef] [Green Version]
- Khudhair, D.; Bhatti, A.; Li, Y.; Hamedani, H.A.; Garmestani, H.; Hodgson, P.; Nahavandi, S. Anodization Parameters Influencing the Morphology and Electrical Properties of TiO2 Nanotubes for Living Cell Interfacing and Investigations. Mater. Sci. Eng. C 2016, 59, 1125–1142. [Google Scholar] [CrossRef]
- Roy, P.; Berger, S.; Schmuki, P. TiO 2 Nanotubes: Synthesis and Applications. Angew. Chem. Int. Ed. 2011, 50, 2904–2939. [Google Scholar] [CrossRef]
- Fu, Y.; Mo, A. A Review on the Electrochemically Self- Organized Titania Nanotube Arrays: Synthesis, Modifications, and Biomedical Applications. Nanoscale Res. Lett. 2018, 13, 187. [Google Scholar] [CrossRef]
- Regonini, D.; Bowen, C.R.; Jaroenworaluck, A.; Stevens, R. A Review of Growth Mechanism, Structure and Crystallinity of Anodized TiO2 Nanotubes. Mater. Sci. Eng. R Rep. 2013, 74, 377–406. [Google Scholar] [CrossRef] [Green Version]
- Wu, Z.; Li, L.; Yan, J.M.; Zhang, X.B. Materials Design and System Construction for Conventional and New-Concept Supercapacitors. Adv. Sci. 2017, 4, 1600382. [Google Scholar] [CrossRef]


| Voltage (V) | 10 | 20 | 30 | 40 |
| Tube diameter (nm) | 20 | 60 | 86 | 129 |
| Wall thickness (nm) | - | 19 | 21 | 37 |
| Anodization time (min) | 30 | 60 | 90 | 120 |
| Tube length (µm) | 0.6 | 1.1 | 1.6 | 1.7 |
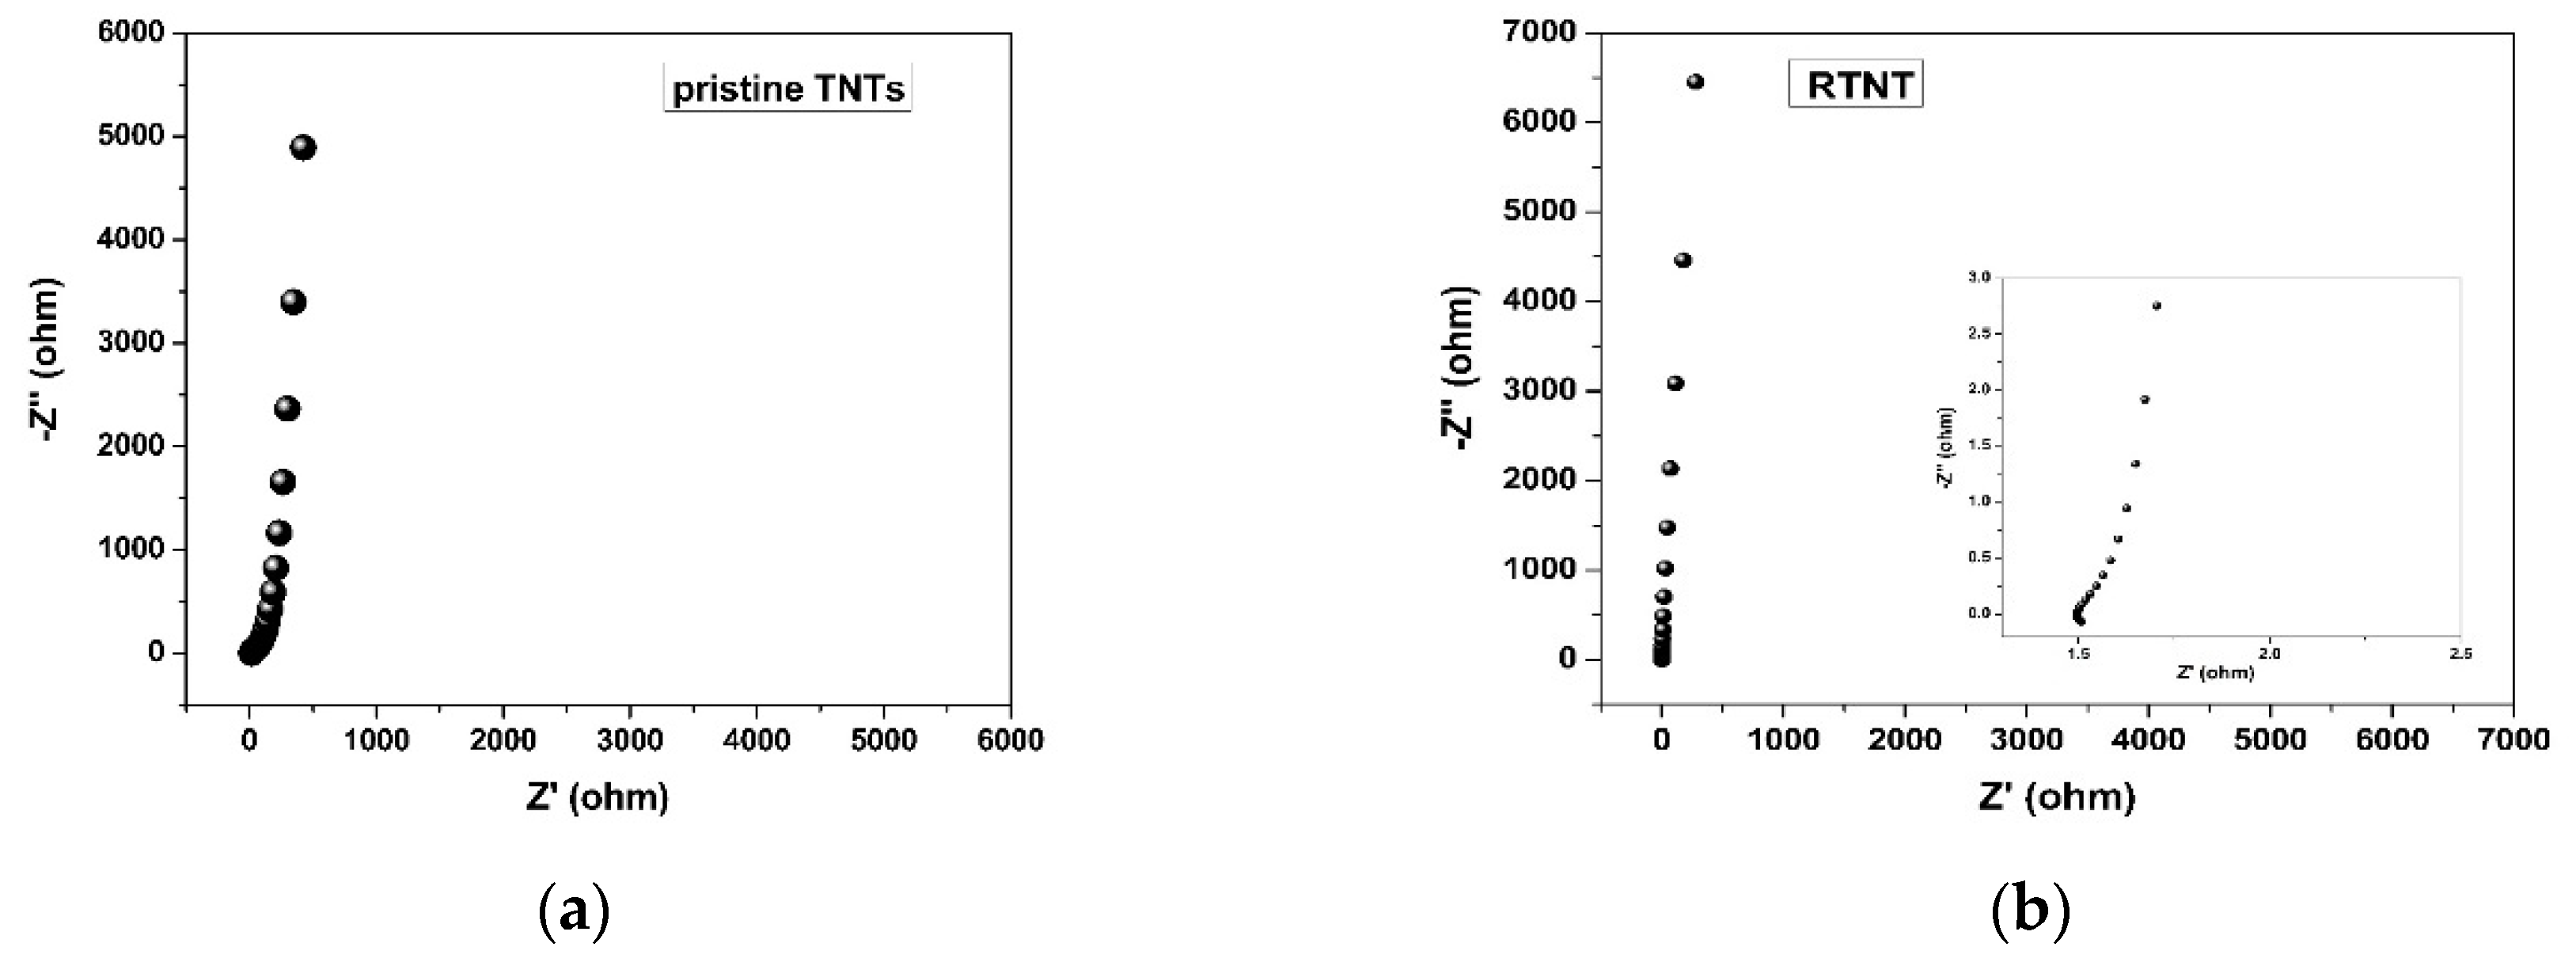
| Samples | Rs (Ω) | Rct (Ω) |
|---|---|---|
| Pristine TNTs | 15.2 | 6.2 |
| R-TNTs | 1.49 | 0.55 |
© 2020 by the authors. Licensee MDPI, Basel, Switzerland. This article is an open access article distributed under the terms and conditions of the Creative Commons Attribution (CC BY) license (http://creativecommons.org/licenses/by/4.0/).
Share and Cite
Muzakir, M.M.; Zainal, Z.; Lim, H.N.; Abdullah, A.H.; Bahrudin, N.N.; Sarif@Mohd Ali, M. Electrochemically Reduced Titania Nanotube Synthesized from Glycerol-Based Electrolyte as Supercapacitor Electrode. Energies 2020, 13, 2767. https://doi.org/10.3390/en13112767
Muzakir MM, Zainal Z, Lim HN, Abdullah AH, Bahrudin NN, Sarif@Mohd Ali M. Electrochemically Reduced Titania Nanotube Synthesized from Glycerol-Based Electrolyte as Supercapacitor Electrode. Energies. 2020; 13(11):2767. https://doi.org/10.3390/en13112767
Chicago/Turabian StyleMuzakir, Muhammad Muhammad, Zulkarnain Zainal, Hong Ngee Lim, Abdul Halim Abdullah, Noor Nazihah Bahrudin, and Mahanim Sarif@Mohd Ali. 2020. "Electrochemically Reduced Titania Nanotube Synthesized from Glycerol-Based Electrolyte as Supercapacitor Electrode" Energies 13, no. 11: 2767. https://doi.org/10.3390/en13112767