3.2. Optimization Studies
The pyrolysis process was subsequently optimized and validated. Measurements were performed at least in duplicate and the average yields are provided. Good reproducibility (standard deviation ≤ 1 wt.%) and mass balance closures (≥85%,
Table S1) were achieved in all the runs. Fifteen pyrolysis experiments were performed following the RSM method to determine the effects of temperature, particle size of pigeon pea wood and N
2 flow rate on the yield of bio-oil. The product yields are summarized in
Table 2 (and
Table S1 in the Supplementary Information). The best model (a reduced quadratic model) is given in Equation (3), with the coded values of A (temperature), B (particle size) and C (N
2 flow rate).
Relevant statistical data in the form of an analysis of variance (ANOVA) are given in
Table 3. From this table it is evident that the
F-value of the model is high (27.28), implying that the model is significant and adequate to represent the actual relationship between the response and the variables. Moreover, the
P-value of the model is less than 0.05 (0.0004), implying that the model is statistically significant.
Figure 3 presents a parity plot of the experimental bio-oil yields versus the model predictions. It clearly reveals that the model yields are in good agreement with the experimental ones. The R
2 value (0.9646), in combination with high values for the predicted and the adjusted R
2, suggest that the model represent the dataset well. According to the model, the bio-oil yield is affected by all independent variables in a complex manner. The highest value of
F (80.31) and a significant and lowest
P-value (0.0001) imply that the biomass particle size (
B) has a major impact on bio-oil yield.
The effects of temperature, particle size of pigeon pea wood and N
2 flow rate on the yield of bio-oil according to model predictions are presented in three-dimensional response surface plots.
Figure 4 shows the interactive effects of particle size and N
2 flow rates on bio-oil yield at two temperatures (400 °C, left and 466 °C, right). The following observations can be drawn: (1) bio-oil yields are considerably reduced at intermediate N
2 flow rates, whereas the effect of temperature is less pronounced within the temperature window explored, and (2) bio-oil yields are surprisingly highest when using larger particle sizes. The latter observation is not expected considering that small biomass particle sizes are generally preferred in pyrolysis due to their faster and uniform heating. However, the positive effect of the use of large particles on oil yields was also reported by Abnisa et al. They showed that increasing the particle size from 0.5 mm to 2.5 mm at a constant temperature of 600 °C resulted in an increase in bio-oil yield (up to 43.5 wt.%) when using palm shells as feedstock [
40]. Onay et al., on the other hand, found an optimum particle size between 0.6 and 1.8 mm to obtain maximum liquid yields (67 wt.%–68 wt.%) in the fast pyrolysis of rapeseed at either 500 °C or 550 °C in a fixed-bed reactor [
41]. Akhtar and Amin propose that the unexpected higher yield of liquids when larger biomass particles are used is related to the chemical composition of the biomass feed [
42]. The latter is supported by the work of Guedes et al., though they proved that the optimum particle size does depend not only on the composition of the biomass feed, but also on the operating parameters [
43], making it difficult to generalize the effects of particle size. As such, the design and specification of the pyrolysis reactor system (i.e., relatively low heating rates than conventional fast pyrolysis) most likely also contributed to the observed higher yields of bio-oil when using larger pigeon pea wood particles.
As stated above, the data in
Figure 4 also reveal that intermediate N
2 flow rates have a negative effect on yields and actually flow rates at either the high or low end are best. As such, it appears that two opposite variables are operative, one favoring high bio-oil yields at low N
2 flow rate and one at high N
2 flow rate. High gas flow rates are typically used in pyrolysis processes to decrease the residence time of vapors within the reactor, avoiding secondary cracking reactions leading to solids formation [
44,
45]. Hence, far, we do not have a clear explanation for the positive effects of low N
2 flow rates on bio-oil yields in the current setup.
3.4. Properties and Molecular Composition of the Bio-Oils
The physicochemical properties and composition of the bio-oil (i.e., water content, ash content, high heating value, total acid number, volatile matter, fixed carbon, etc.) from pigeon pea wood pyrolysis at optimum conditions were determined and the results are summarized in
Table 4. The water content of the bio-oil (Karl–Fischer titration) was 20 wt.%. Low water contents in biomass and pyrolysis oils are preferred as water has a negative effect on the energy density [
46,
47].
The ash content of the bio-oil based on TGA measurements was 0.16%, which is relatively low compared to bio-oils from other woody biomass sources such as pinewood (e.g., ash contents reported in the literature ranged from 0.03% to 3.0%) [
48]. Low ash contents are preferred as ash has a negative effect on the storage stability and combustion characteristics [
48]. The acidity of the bio-oil in terms of TAN value was 85 mg KOH g
−1, which is comparable to literature values for woody biomass such as pinewood (20–99 mg KOH g
−1 sample) [
38,
49]. The acidity of bio-oils is mainly derived from the presence of small organic acids (e.g., acetic acid, propionic acid), which are primarily formed from the decomposition of hemicellulose components of biomass [
38,
49]. Other compounds in bio-oils known to add to the acidity include phenolics, fatty and resin acids and hydroxy acids [
38,
49].
The high heating value (HHV) of the bio-oil was calculated from the elemental composition using Boie Equation (Equation (2)) and found to be 28.8 MJ kg
−1, which is higher than the HHVs of bio-oils produced from pyrolysis of typical woods (17 MJ kg
−1) [
50,
51,
52] and by far lower than the HHVs for crude oil based fuels (42 MJ kg
−1) [
53]. This value is also much higher than the starting pigeon pea wood (15.6 MJ kg
−1). As such, considerable energy intensification has occurred during pyrolysis, combined with a reduction of ash contents.
The bio-oil contains 55% of carbon, 11% of hydrogen and 34% of oxygen and low levels of sulfur and nitrogen (<0.11%) (
Table 4). To compare the elemental composition of the bio-oil from pigeon pea wood pyrolysis with that the starting biomass, a van Krevelen plot was constructed (
Figure 5). In this figure, the values for wood and bio-oils from wood are given, as well as the value for crude oil for comparison [
54,
55]. When considering the biomass feeds, it is evident that the O/C and H/C values for pigeon pea wood are higher than those for “average” wood. This is due to the relatively low content of lignin in the feed (
vide supra). After pyrolysis, the H/C value increases and the O/C value is reduced. A similar trend is observed for the pyrolysis of wood. Of interest is the higher H/C ratio of the bio-oil derived from pigeon pea wood than for other wood sources. It is even at the high end when compared to the H/C ratio of crude oils. Though further processing to a crude oil type of feed will be required (e.g., by catalytic hydrotreatment), this is an interesting observation as it implies that the hydrogen consumption for hydroprocessing, a key variable cost contributor for the process, will be lower compared to other woody bio-oils.
The chemical composition of the product oil was investigated by GC–MS.
Table 5 summarizes the compounds identified, together with their amounts based on peak area. Phenolic compounds and their derivatives are abundant in the bio-oil (total 40.7% GC–MS peak area), namely, 2-methoxyphenol (guaiacol), 2,3-dimethylphenol (xylenol), 2,6-dimethoxyphenol (syringol), etc. The presence of phenolics in bio-oil is thought to be due to thermal decomposition of the lignin fraction in the feed [
56,
57,
58,
59]. The presence of high amounts of phenolics is surprising, as the feed contains relatively small amounts of lignin (
vide supra). Speculatively, it is possible that the lignin in the pigeon wood has a relatively low molecular weight and is less condensed than in typical lignocellulosic biomass sources. As a consequence, thermal pyrolysis may lead to higher than anticipated amounts of phenolics. Renewable phenolic compounds are of interest considering their industrial applications such as the use as precursors for bio-based aromatics and products thereof (e.g., resins) [
20,
21,
22]. In addition, low- molecular weight carboxylic acids, ketones, aldehydes and esters (e.g., C10–C12) were present, which are formed from the thermal depolymerization of the cellulose and hemicellulose fraction in the pigeon pea wood sample [
56,
57,
58,
59].
The GPC chromatogram for the bio-oil obtained from pigeon pea wood pyrolysis at optimized conditions is presented in
Figure 6. It shows a number of sharp strong peaks in the low molecular weight region (i.e., between ~100 and 200 g mol
−1), an indication for the presence of considerable quantities of low molecular weight products, in line with the GC-data. Higher molecular weight compounds (i.e., dimers, trimers and oligomeric products from depolymerization of the individual biopolymers in the feed) between ~300 to 500 g mol
−1 are also present. Notably, some tailing is observed, suggesting the presence of higher molecular weight fragments in the bio-oil. The molecular weight (
Mw) of bio-oil was 440 and the number averaged molecular weights (
Mn) was 230 g mol
−1. Hassan et al. and Ingram et al. determined the molecular weights of pyrolysis oils derived from pinewood and oak wood at 450 °C and found a similar weight average molecular range from 390 to 460 g mol
−1 [
60,
61].
Further insights into the chemical composition of the pigeon pea wood bio-oil were obtained by NMR measurements (
13C- and 2D HSQC-NMR). The advantage of NMR over GC is that information on the chemical composition of the complete sample is obtained and not only of the GC detectable fraction.
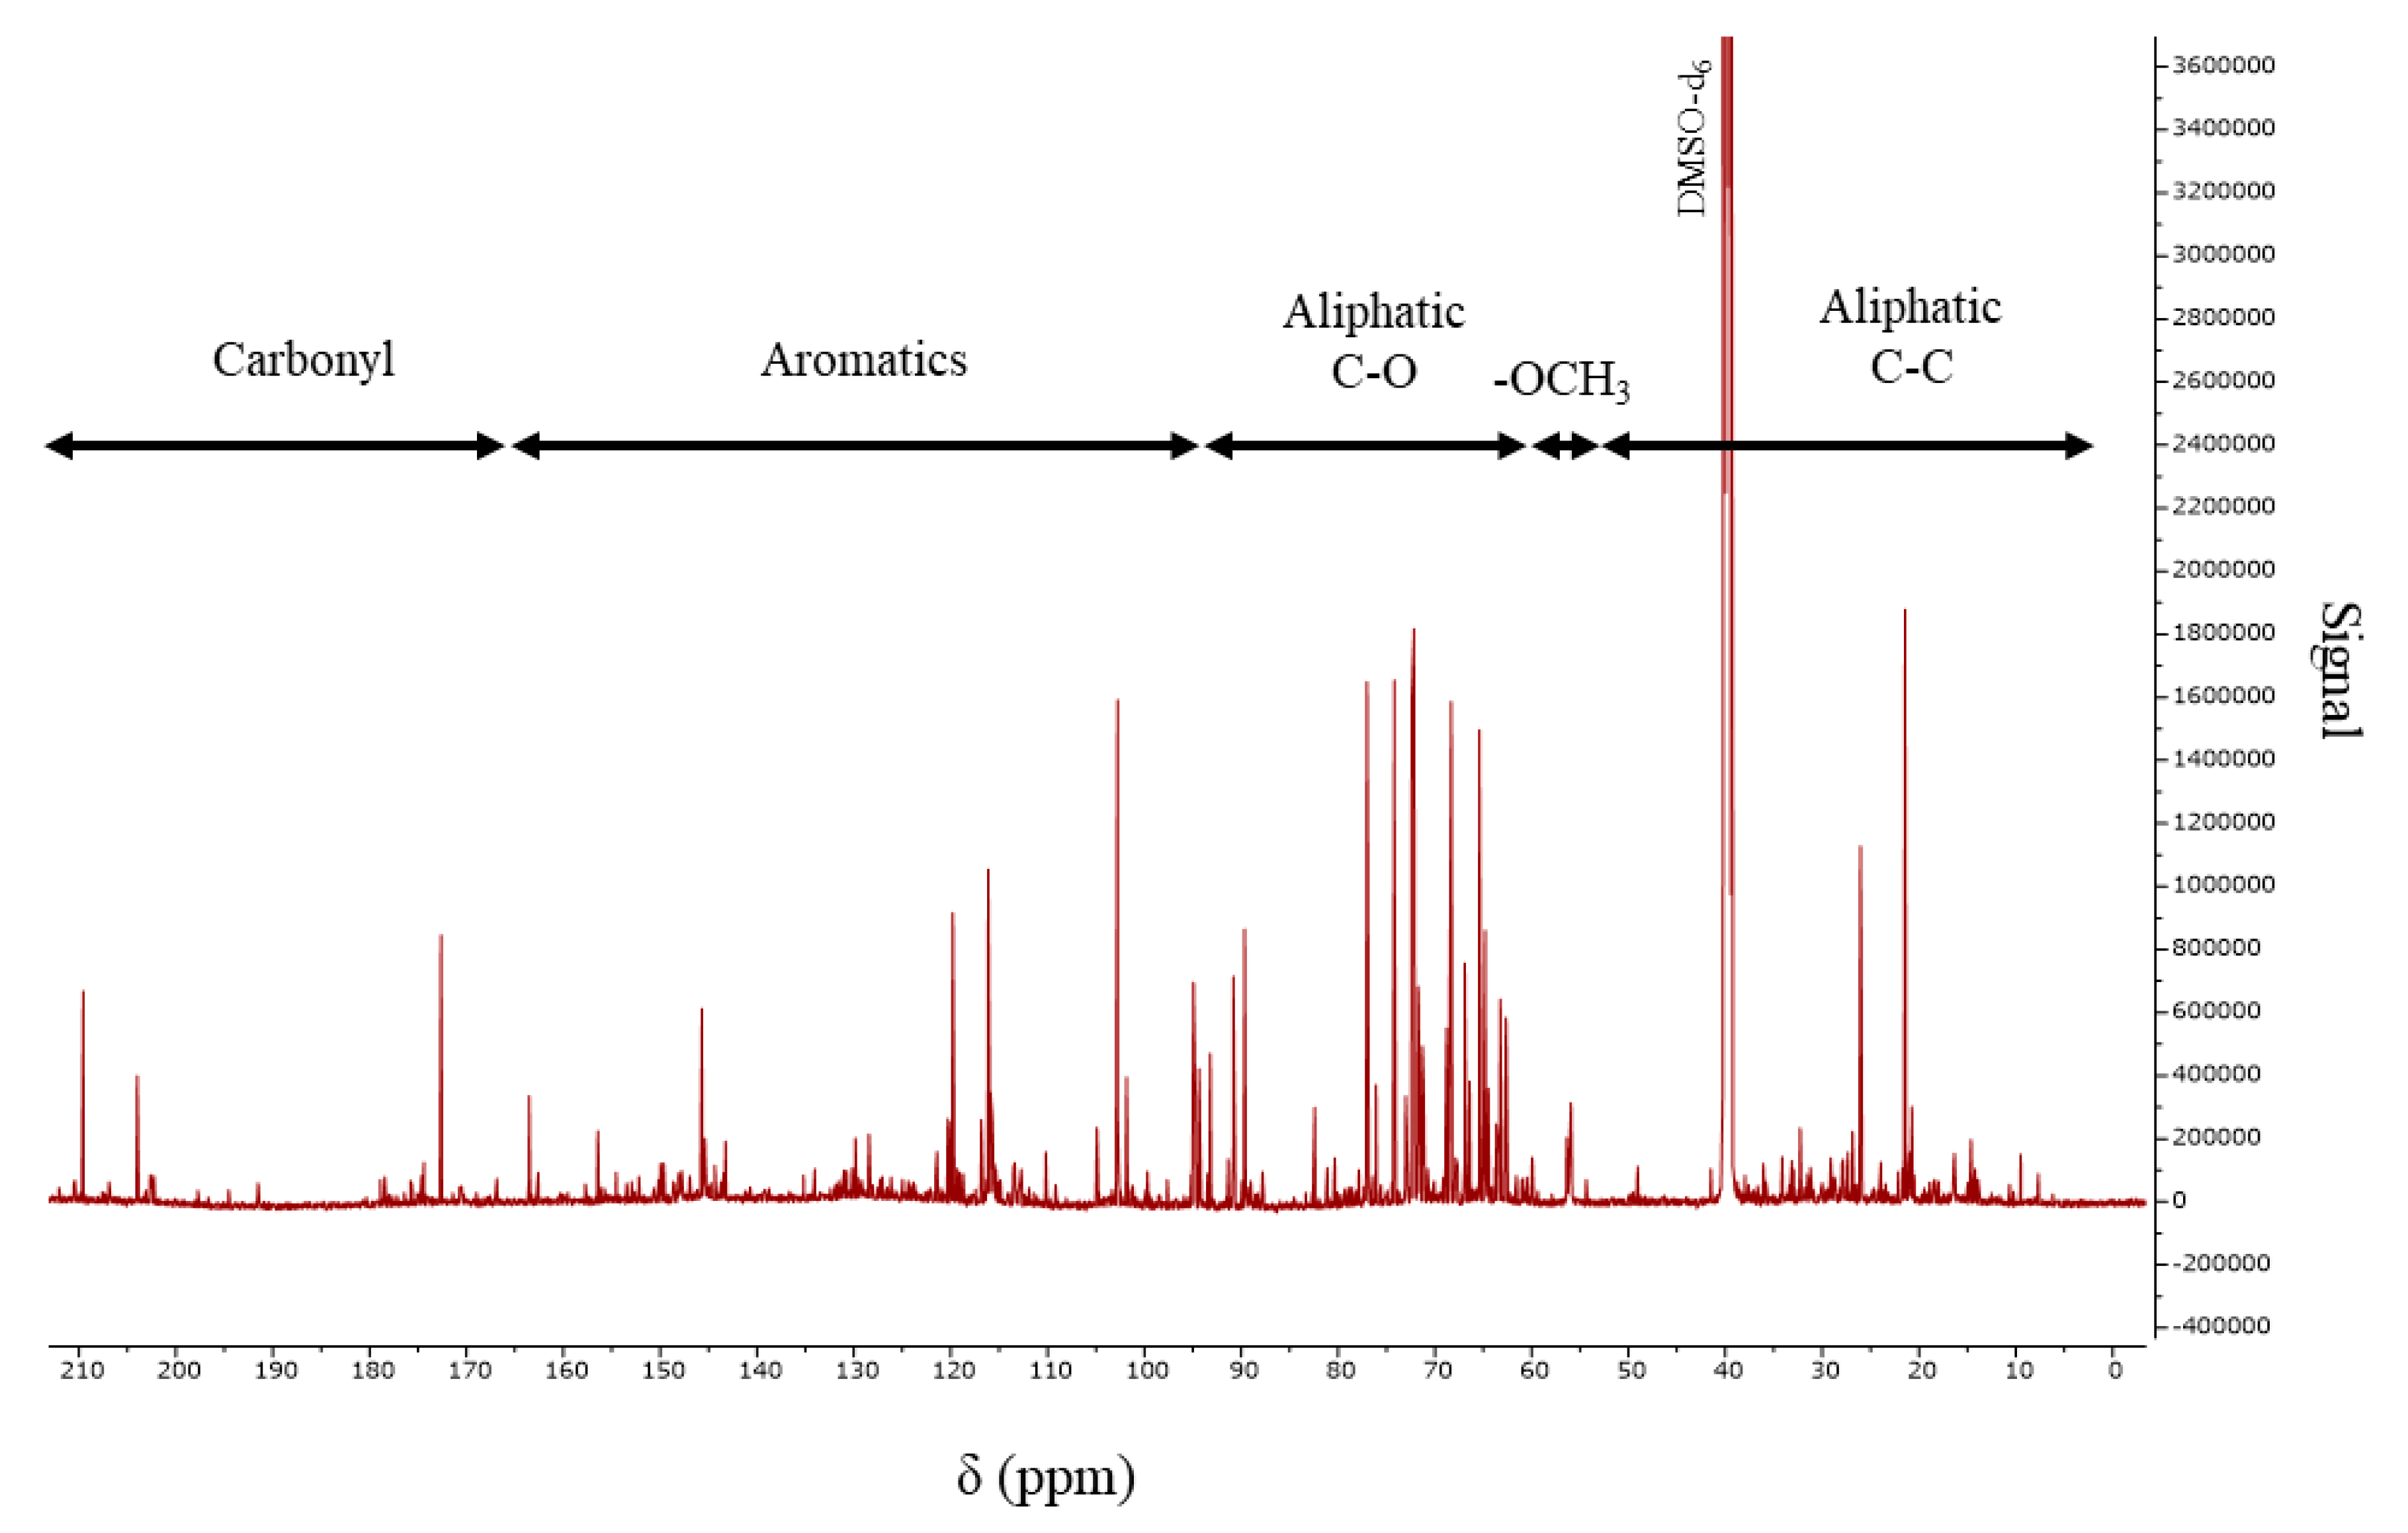
Figure 7 shows the
13C-NMR spectrum of the pigeon pea wood bio-oil, showing numerous peaks of different functional groups.
Table 6 summarizes the
13C-NMR chemical shift ranges and their assignments for various types of carbon present in the bio-oil [
58,
62,
63,
64]. By integration of the spectrum, a rough estimate of the contents of various functional groups in the bio-oil sample can be obtained (
Table 6). Carbonyl groups are clearly present and arise from the presence of aldehydes, ketones and carboxylic acids, as confirmed by GC–MS. The aromatic carbons are associated with the presence of phenolic compounds like guaiacol and syringol (
Table 5, supported by the presence of—OMe groups in the spectrum). The clear peaks in the range
δ 60–80 ppm are associated with the presence of C–O groups, e.g., from sugar monomers and products thereof, as well as oligomeric sugars from the (hemi)cellulose fraction.
Finally, further insights in the chemical composition of pigeon pea wood bio-oil were obtained by 2D HSQC-NMR measurements. 2D-NMR analysis of bio-oil has two main advantages over the traditional 1-D
1H- and
13C-NMR: (1) the overlapping peaks, occurring to a large extent when several components are present in the sample, are reduced due to spreading of the signals into two dimensions, and (2) a higher sensitivity and shorter relaxation times are achieved.
1H-
13C-HSQC NMR provides a 2-D plot, with on one axis the
1H-NMR shift and the
13C-NMR shift on the other axis. Every peak is associated with a particular C-H unit in a certain chemical environment. Ben and Ragauskas used this NMR method to characterize pyrolysis oils derived from the slow pyrolysis of lignin, cellulose and pinewood [
63].
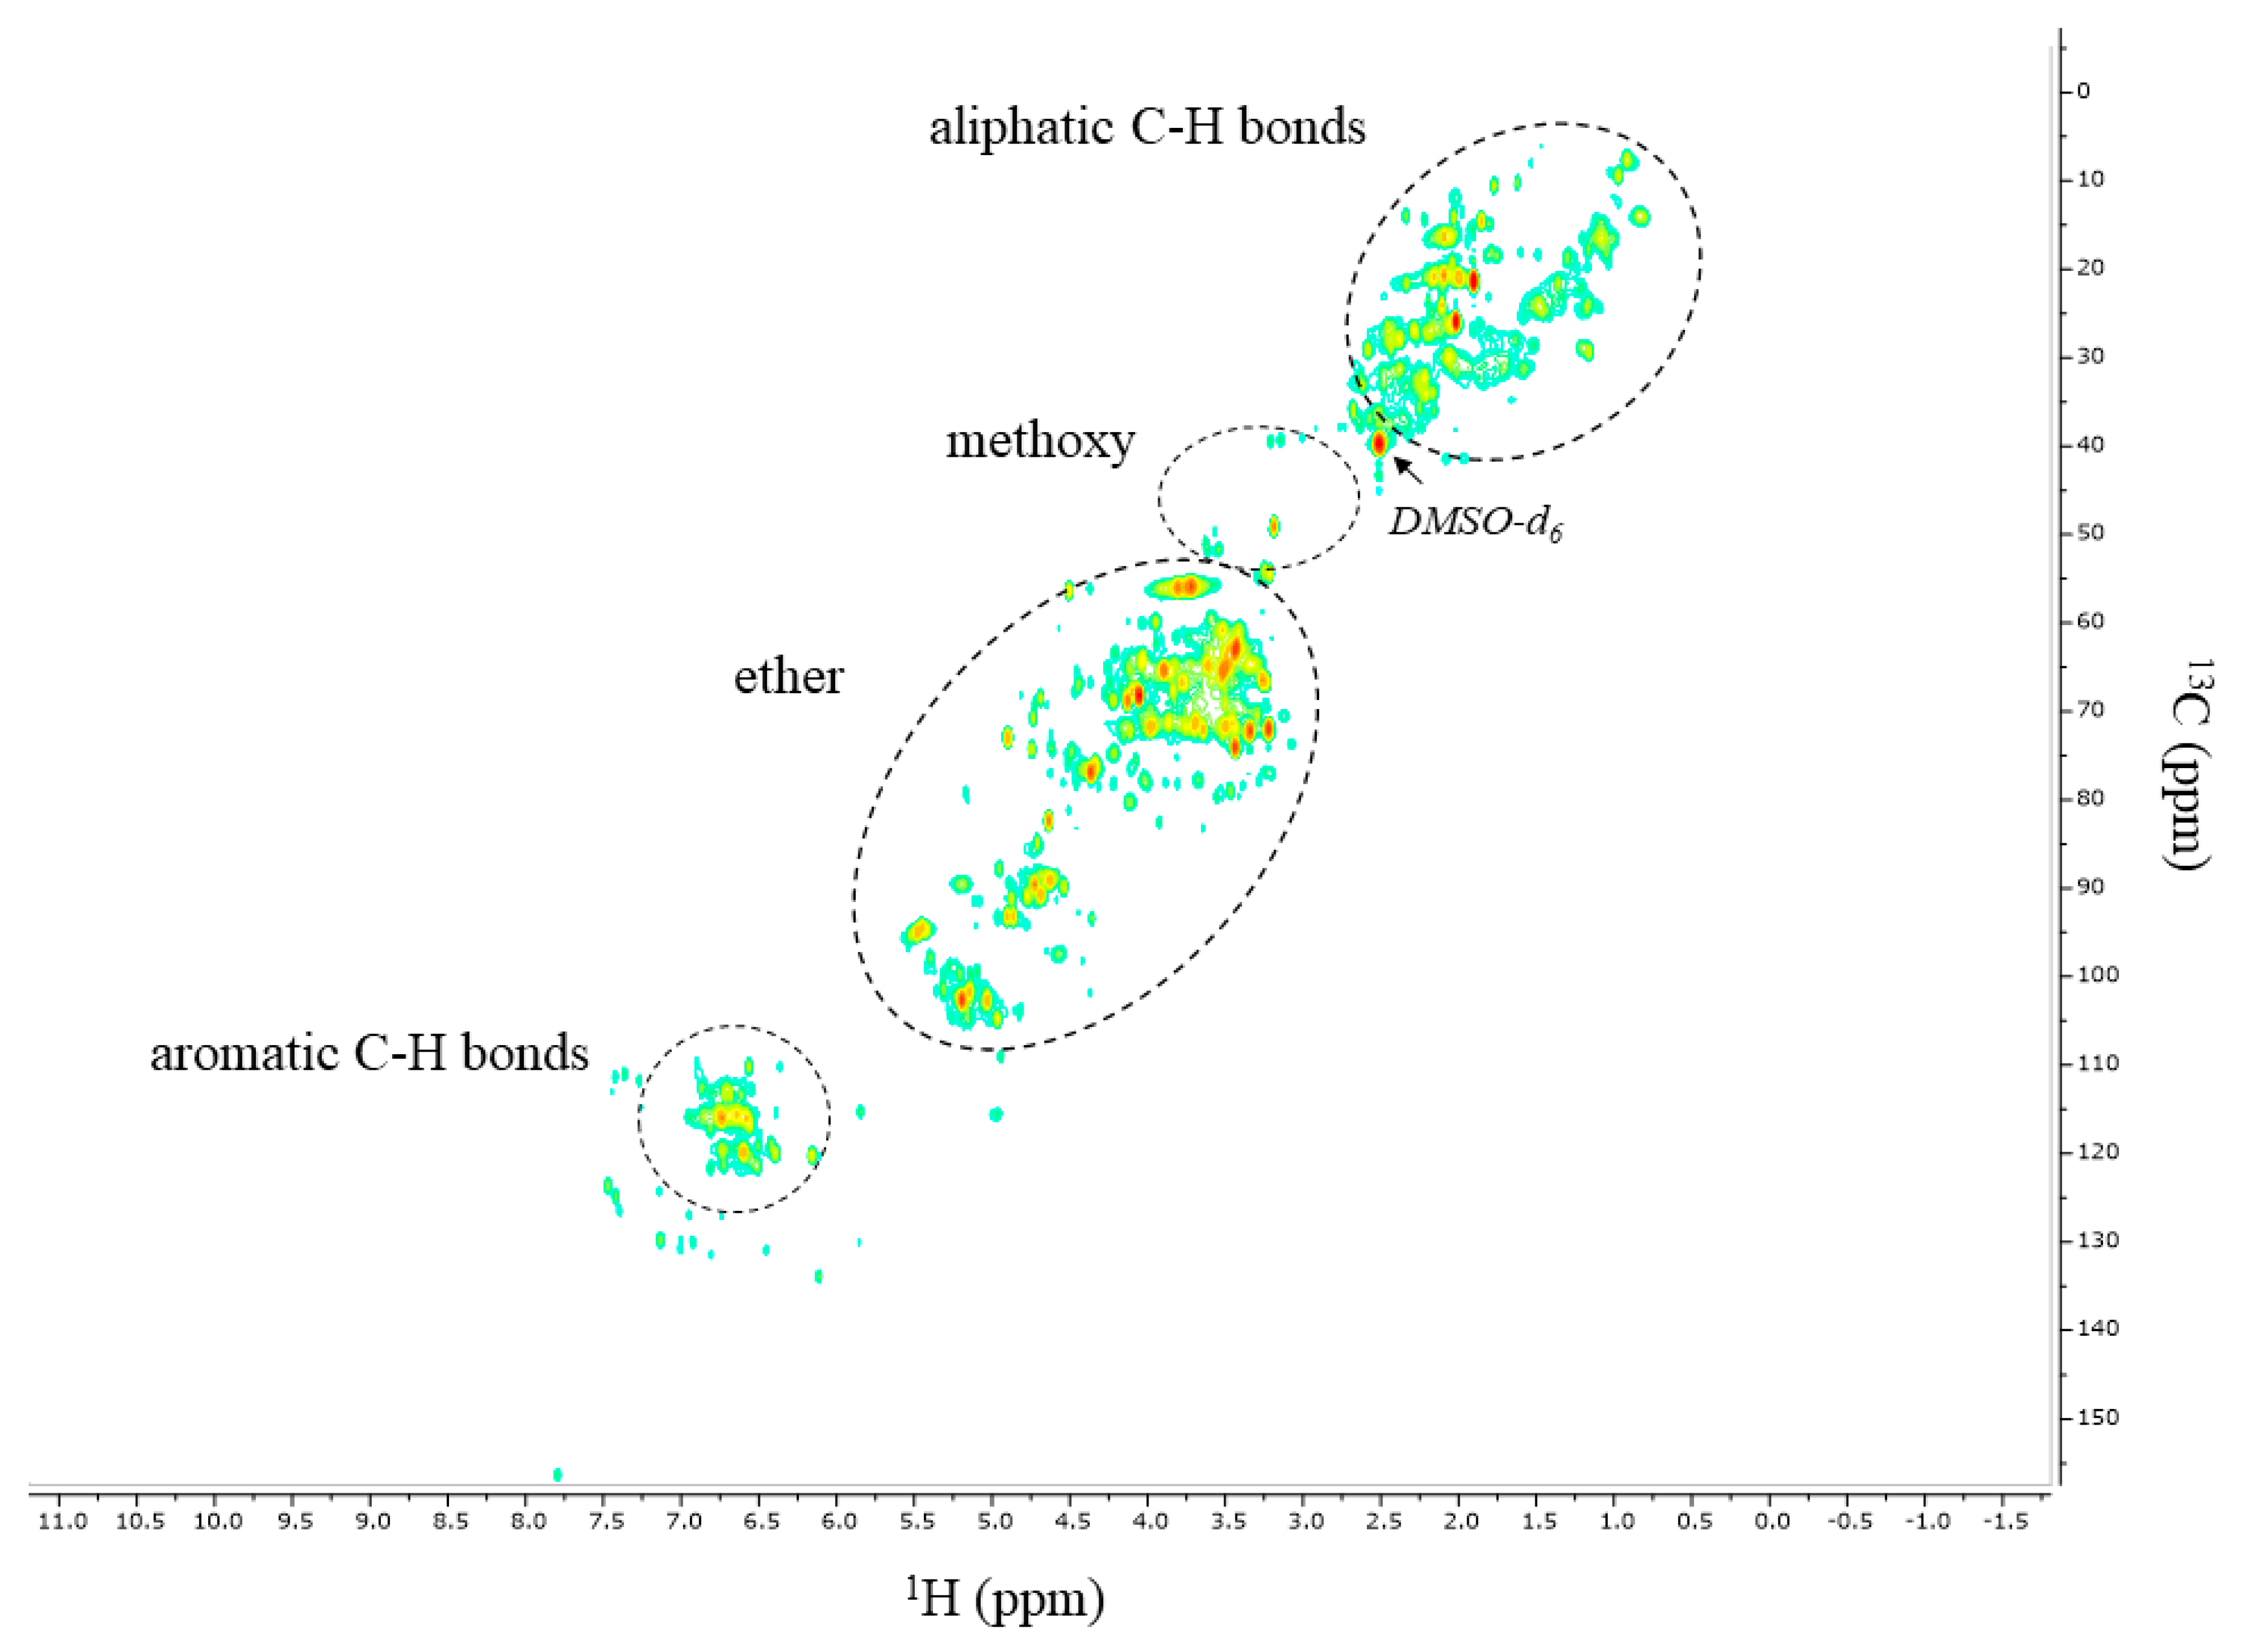
Figure 8 shows the 2D HSQC-NMR spectrum recorded for the pigeon pea wood bio-oil. A number of relevant regions were assigned belonging to different C-H bonds: (1) aromatic C-H bonds belonging to, among others, substituted phenolics (
δ 105–140 ppm in the
13C-NMR dimension and
δ 5.5–7.5 in the
1H-NMR dimension), (2) ether groups (
δ 58–104 ppm in the
13C-NMR dimension and
δ 4.0–5.4 in the
1H-NMR dimension, (3) methoxy groups (
δ 54–57 ppm in the
13C-NMR dimension and
δ 3.7–3.9 ppm in the
1H-NMR dimension) and (4) aliphatic C-H bonds (
δ 5–40 ppm in the
13C-NMR dimension and
δ 0.7–2.8 ppm in the
1H-NMR domain). The spectrum confirms the 1D
13C-NMR data and reveals the presence of a large proportion of compounds with aliphatic C-H bonds and C–O bonds.


