How to Reduce the Carbon Footprint of an Irrigation Community in the South-East of Spain by Use of Solar Energy
Abstract
1. Introduction
- A reduction of greenhouse gas emissions of at least 40% (relative to 1990 levels).
- An increase of at least 27% of the share of renewable energy.
- An improvement of energy efficiency by at least 27%.
2. Material and Methods
2.1. Precedents
2.2. Climatology, Thermal Regime, Agroclimatic Traits, and Precipitation Regime
- Climate: The climatic analysis of the irrigation zone is conditioned by the following factors:
- ◦
- Latitudinal position, which determines the intensity of solar radiation. The area is between the 37°57′ and 37°01′ parallel, being responsible for the high temperatures in summer.
- ◦
- Altitude position, which determines the intensity of the precipitations and the prevailing winds of the area.
- ◦
- Specific conditions of the irrigation area regarding plant roughness and sufficient water supply capacity during the driest months.
- ◦
- General atmospheric circulation that crosses the region. The presentation of the anticyclone will condition the atmospheric circulation, although it will be tempered by the existing relief structure, which in turn conditions the distribution of precipitation throughout the year.
- The atmospheric conditions of the study area are determinants of the region’s typical climate, characterized by a decrease in the moisture content of the air masses that, together with the Béticas mountain system, produce the RainShadow effect and result in dry, temperate and clear weather types, both in winter and in summer.
- Thermal regime and agroclimatic traits:
- ◦
- The average monthly temperature is colder between 8 and 11 °C; the average minimal temperature is between 4 and 7 °C. The risk of frost is, therefore, low.
- ◦
- The average warmest temperatures are between 26 and 28 °C, with maximum averages between 32 and 34 °C.
- ◦
- The average annual rainfall is 200–300 mm. The dry period lasts between 7–11 months, according to the seasons.
- ◦
- The thermal conditions enable the cultivation of cereals and cotton.
- ◦
- The climate of the Mediterranean subtropical area is warm or semi-warm.
- ◦
- The vegetation of the area, due to its aridity, hygrocontinentality and physiognomic formation is transitional between Durilignosa and Siccideserta.
- Precipitation regime: In the precipitation analysis, we have already anticipated that, due to its arid thermo-Mediterranean thermal regime indicated in the previous section, and other climatic factors, very weak rainfall records are obtained, which, only in years of flooding rarely exceed 350 mm throughout the region.
2.3. Water Needs and Available Resources
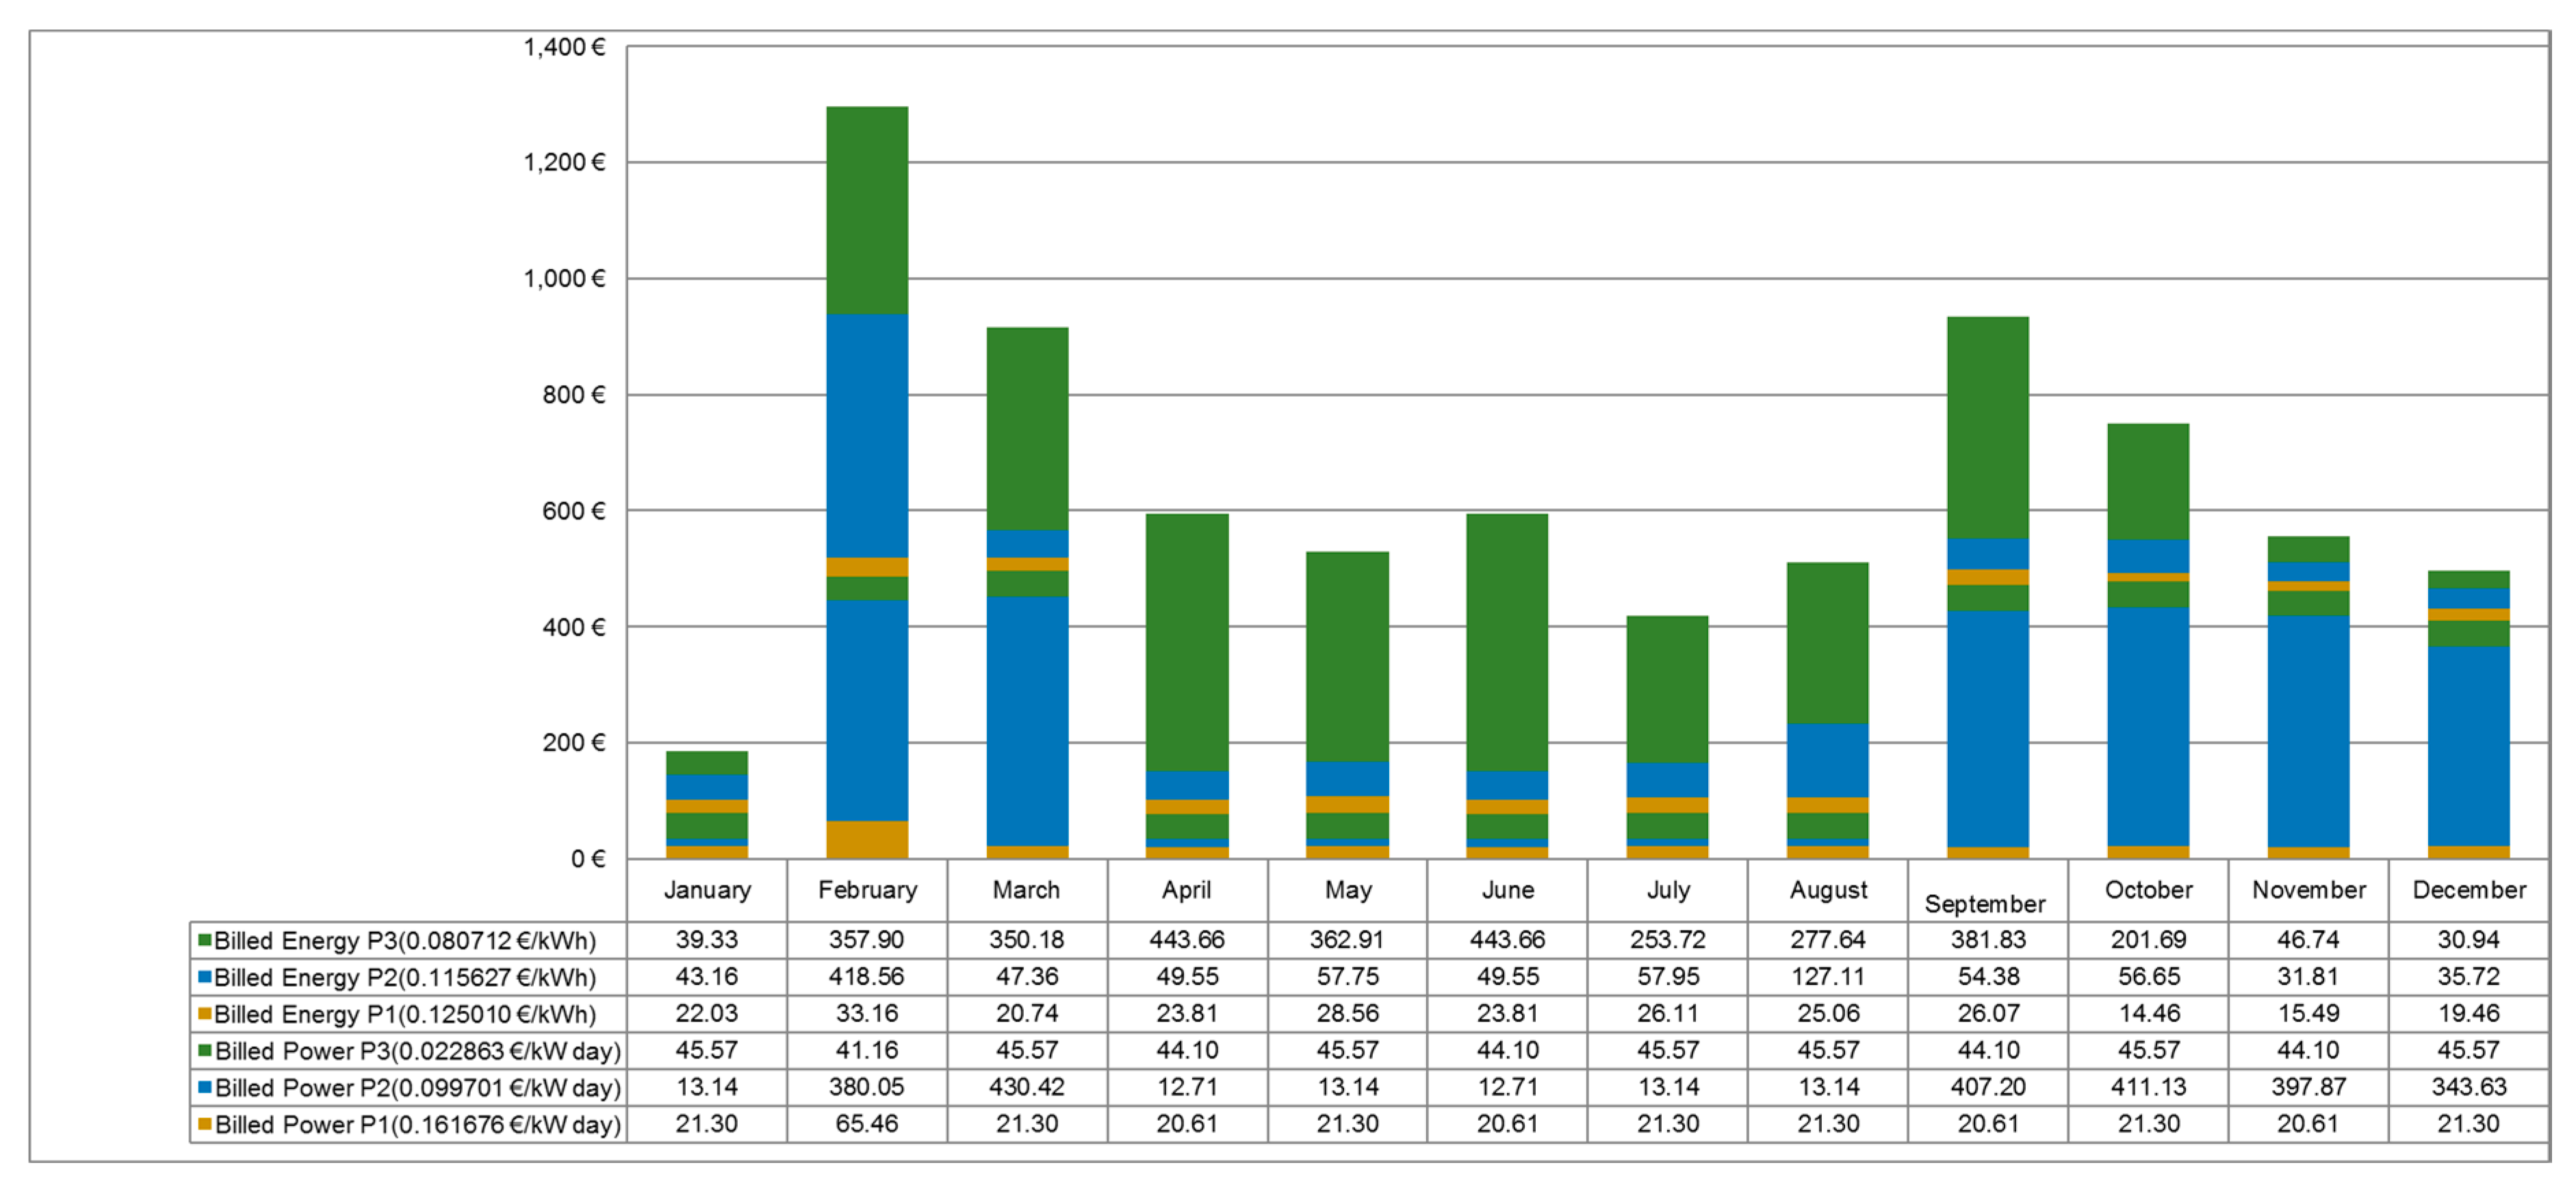
2.4. Financial Expenses of the Electric Consumption by Different Sources
2.5. Financial Expense of Extraction by Means of the Well
2.6. Financial Expense of Extraction by Means Tajo-Segura Transfer (TST)
2.7. Extracting the Financial Expense of Water from the Wastewater Treatment Plant (WWTP)
3. Adopted Measures for Reduction of the Carbon Footprint
3.1. Minimization of the Energy
3.2. Analysis of the Available Technologies
- Wind energy: only two turbines could be considered considering the wind map published by CENER (National Renewable Energy Centre) [12] two generators with an estimated generation power of 6 kW could be considered with which a generated power of about 20 kWh/day and 6761 kWh/Year versus 2,032,471 kWh could be obtained is negligible production with considerable investment with considerable investment. It would be necessary to complement this with another alternative and safe energy source in order to avoid periods without energy.
- Water energy: the irrigation network design enables the possibility to take advantage of the existing overpressures in several points of the system in order to generate electric energy. After a technical study, the incorporation of this technology was evaluated. The solution was the incorporation of two micro turbines linked to the existing pressure-reducing valves.
3.3. Legislative Alternatives of Photovoltaic Installations
- Alternative 1. Electricity supply with self-consumption.
- To obtain the supply of electricity by means of self-consumption, type 2 is included, according to Spanish regulations (art. 5 of RD 244/2019), this standard includes the administrative, technical and economic conditions of the modes of supply of electricity with self-consumption and production with self-consumption. This is due to the fact that the hired power is more than 100 kW at this point. In the self-consumption mode, the electricity system is required to be registered as a consumer and producer (art. 4.1.b RD 244/2019). This electrical system must be registered in the RIPRE register (Registration of Electrical Energy Production Facilities in Special Regime), in the Ministry of Industry, Energy and Tourism of Spain. This mode enables the possibility of selling the overproduction, however, it is necessary to consider the expenses and taxes that must be applied for this option:
- —Generation toll (0.50 o/MWh)
- —Generation tax for electrical producers (7% of turnover).
- In the case of the sale of the overproduction, some tax expenses for the system owner must be declared in the generation of tolls and taxes. In conclusion, this alternative does not fully improve the reduction of the carbon footprint as it is powered by the conventional production network.
- Alternative 2. Supply of electrical energy by means of an isolated photovoltaic generation system.
- This alternative eliminates the complexity of system legalization because RD 244/2019 does not apply. As a curriculum, the main objectives to meet due to the improvement of the energy efficiency of the WUA irrigation system are:
- 1. Suppression of electricity power generation costs.
- 2. Electrical energy is produced by conventional sources of renewable energy. This allows for an environmental improvement by reducing CO2 emissions into the atmosphere. Based on the above reason, this alternative was selected for this project.
3.4. Solar Photovoltaic System
3.5. Calculation of the Photovoltaic Solar Installation for the Pumping of the Well
3.6. Summary of Calculation of Photovoltaic Solar Installations
4. Results and Discussion
4.1. Results
4.2. Discussion
5. Conclusions
- Determine the type of crop, as well as its associated area to obtain its water demands.
- Identify the water resources and balance the needs of water resources.
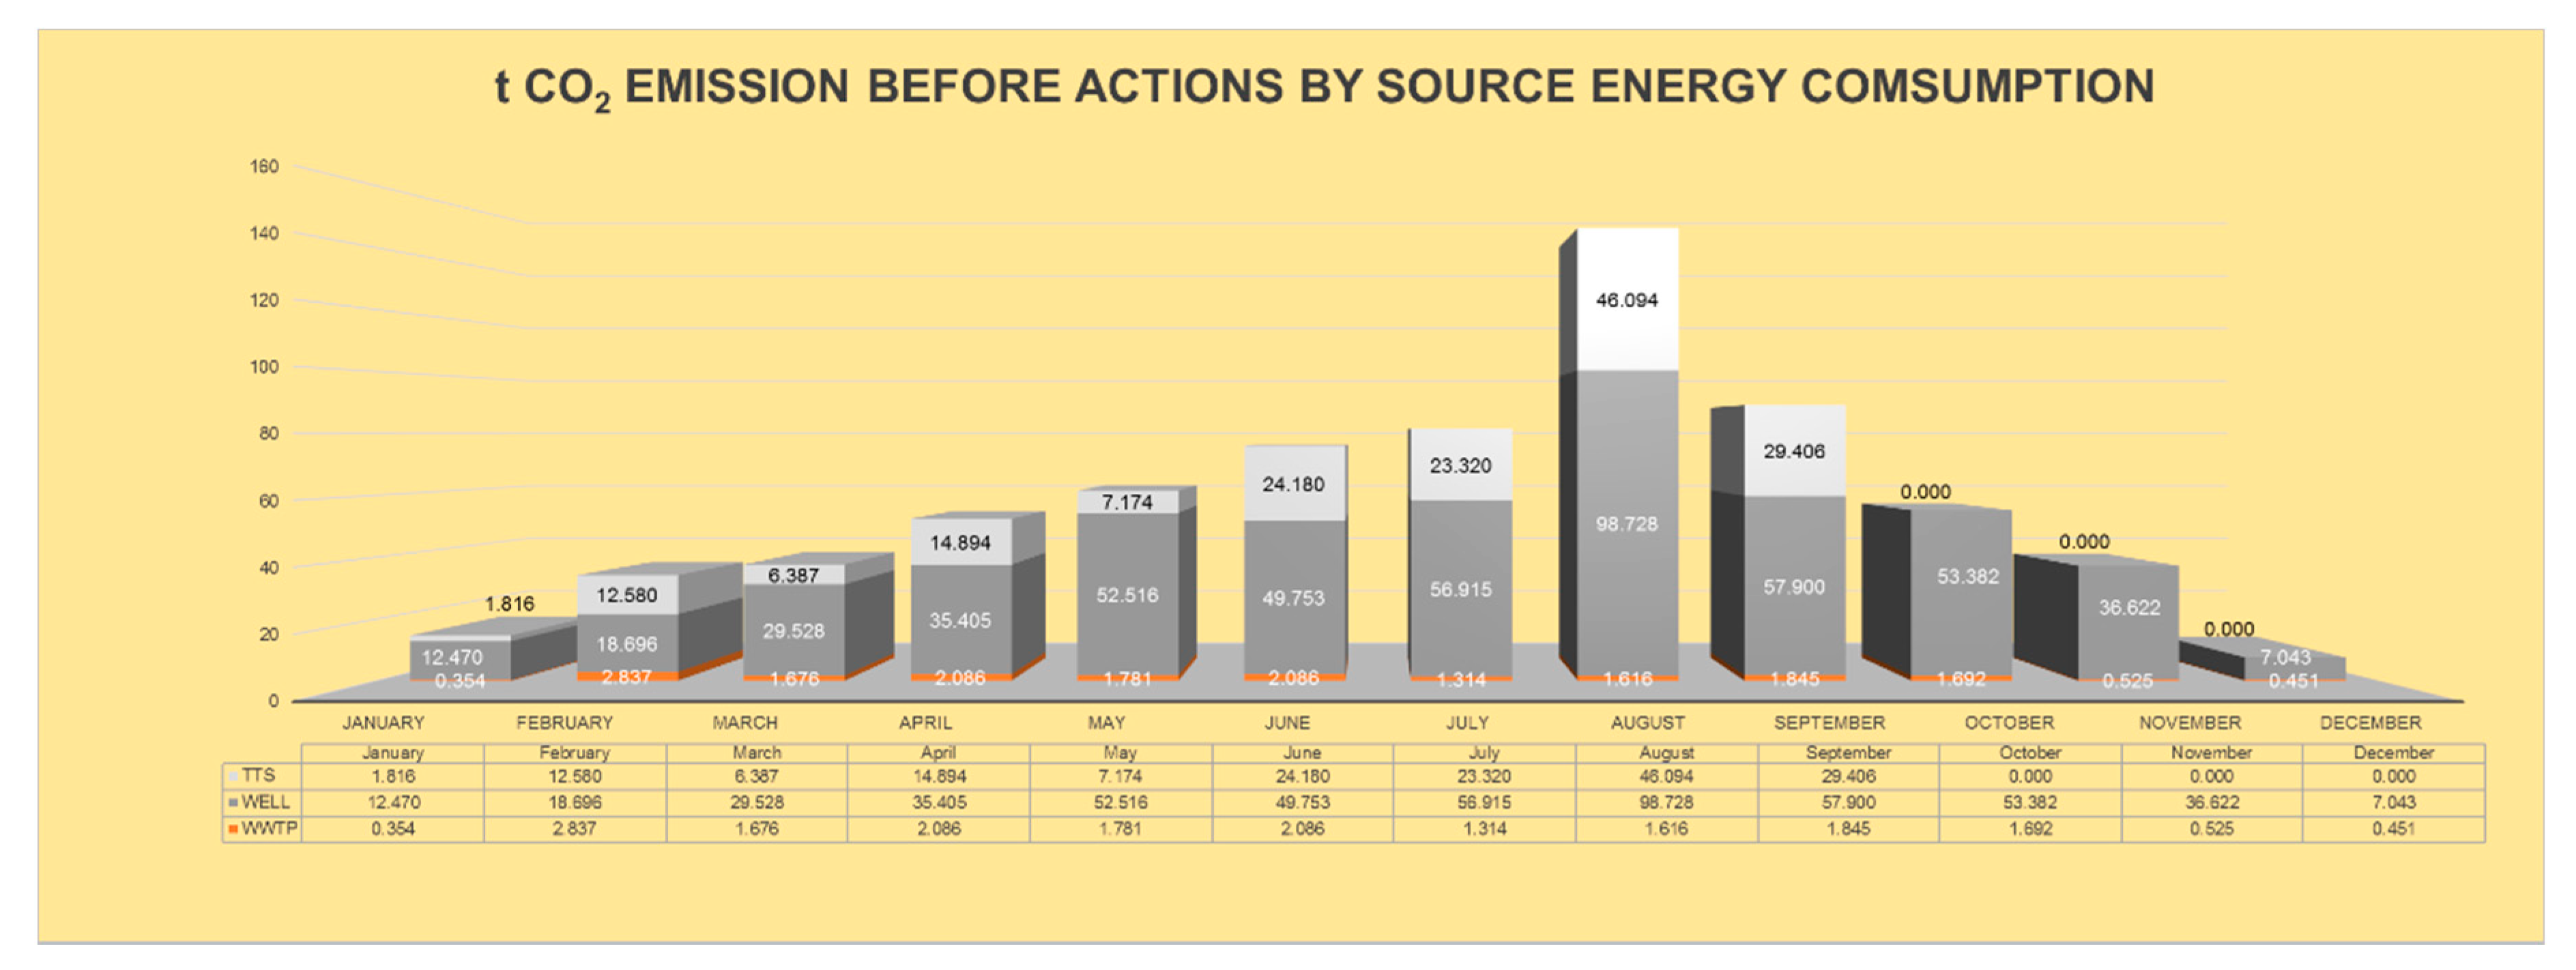
- Determine the energy needs, at critical points (calculating the CO2 emitted).
- Select the points of greatest energy demand and calculate the area necessary to implement the solar field.
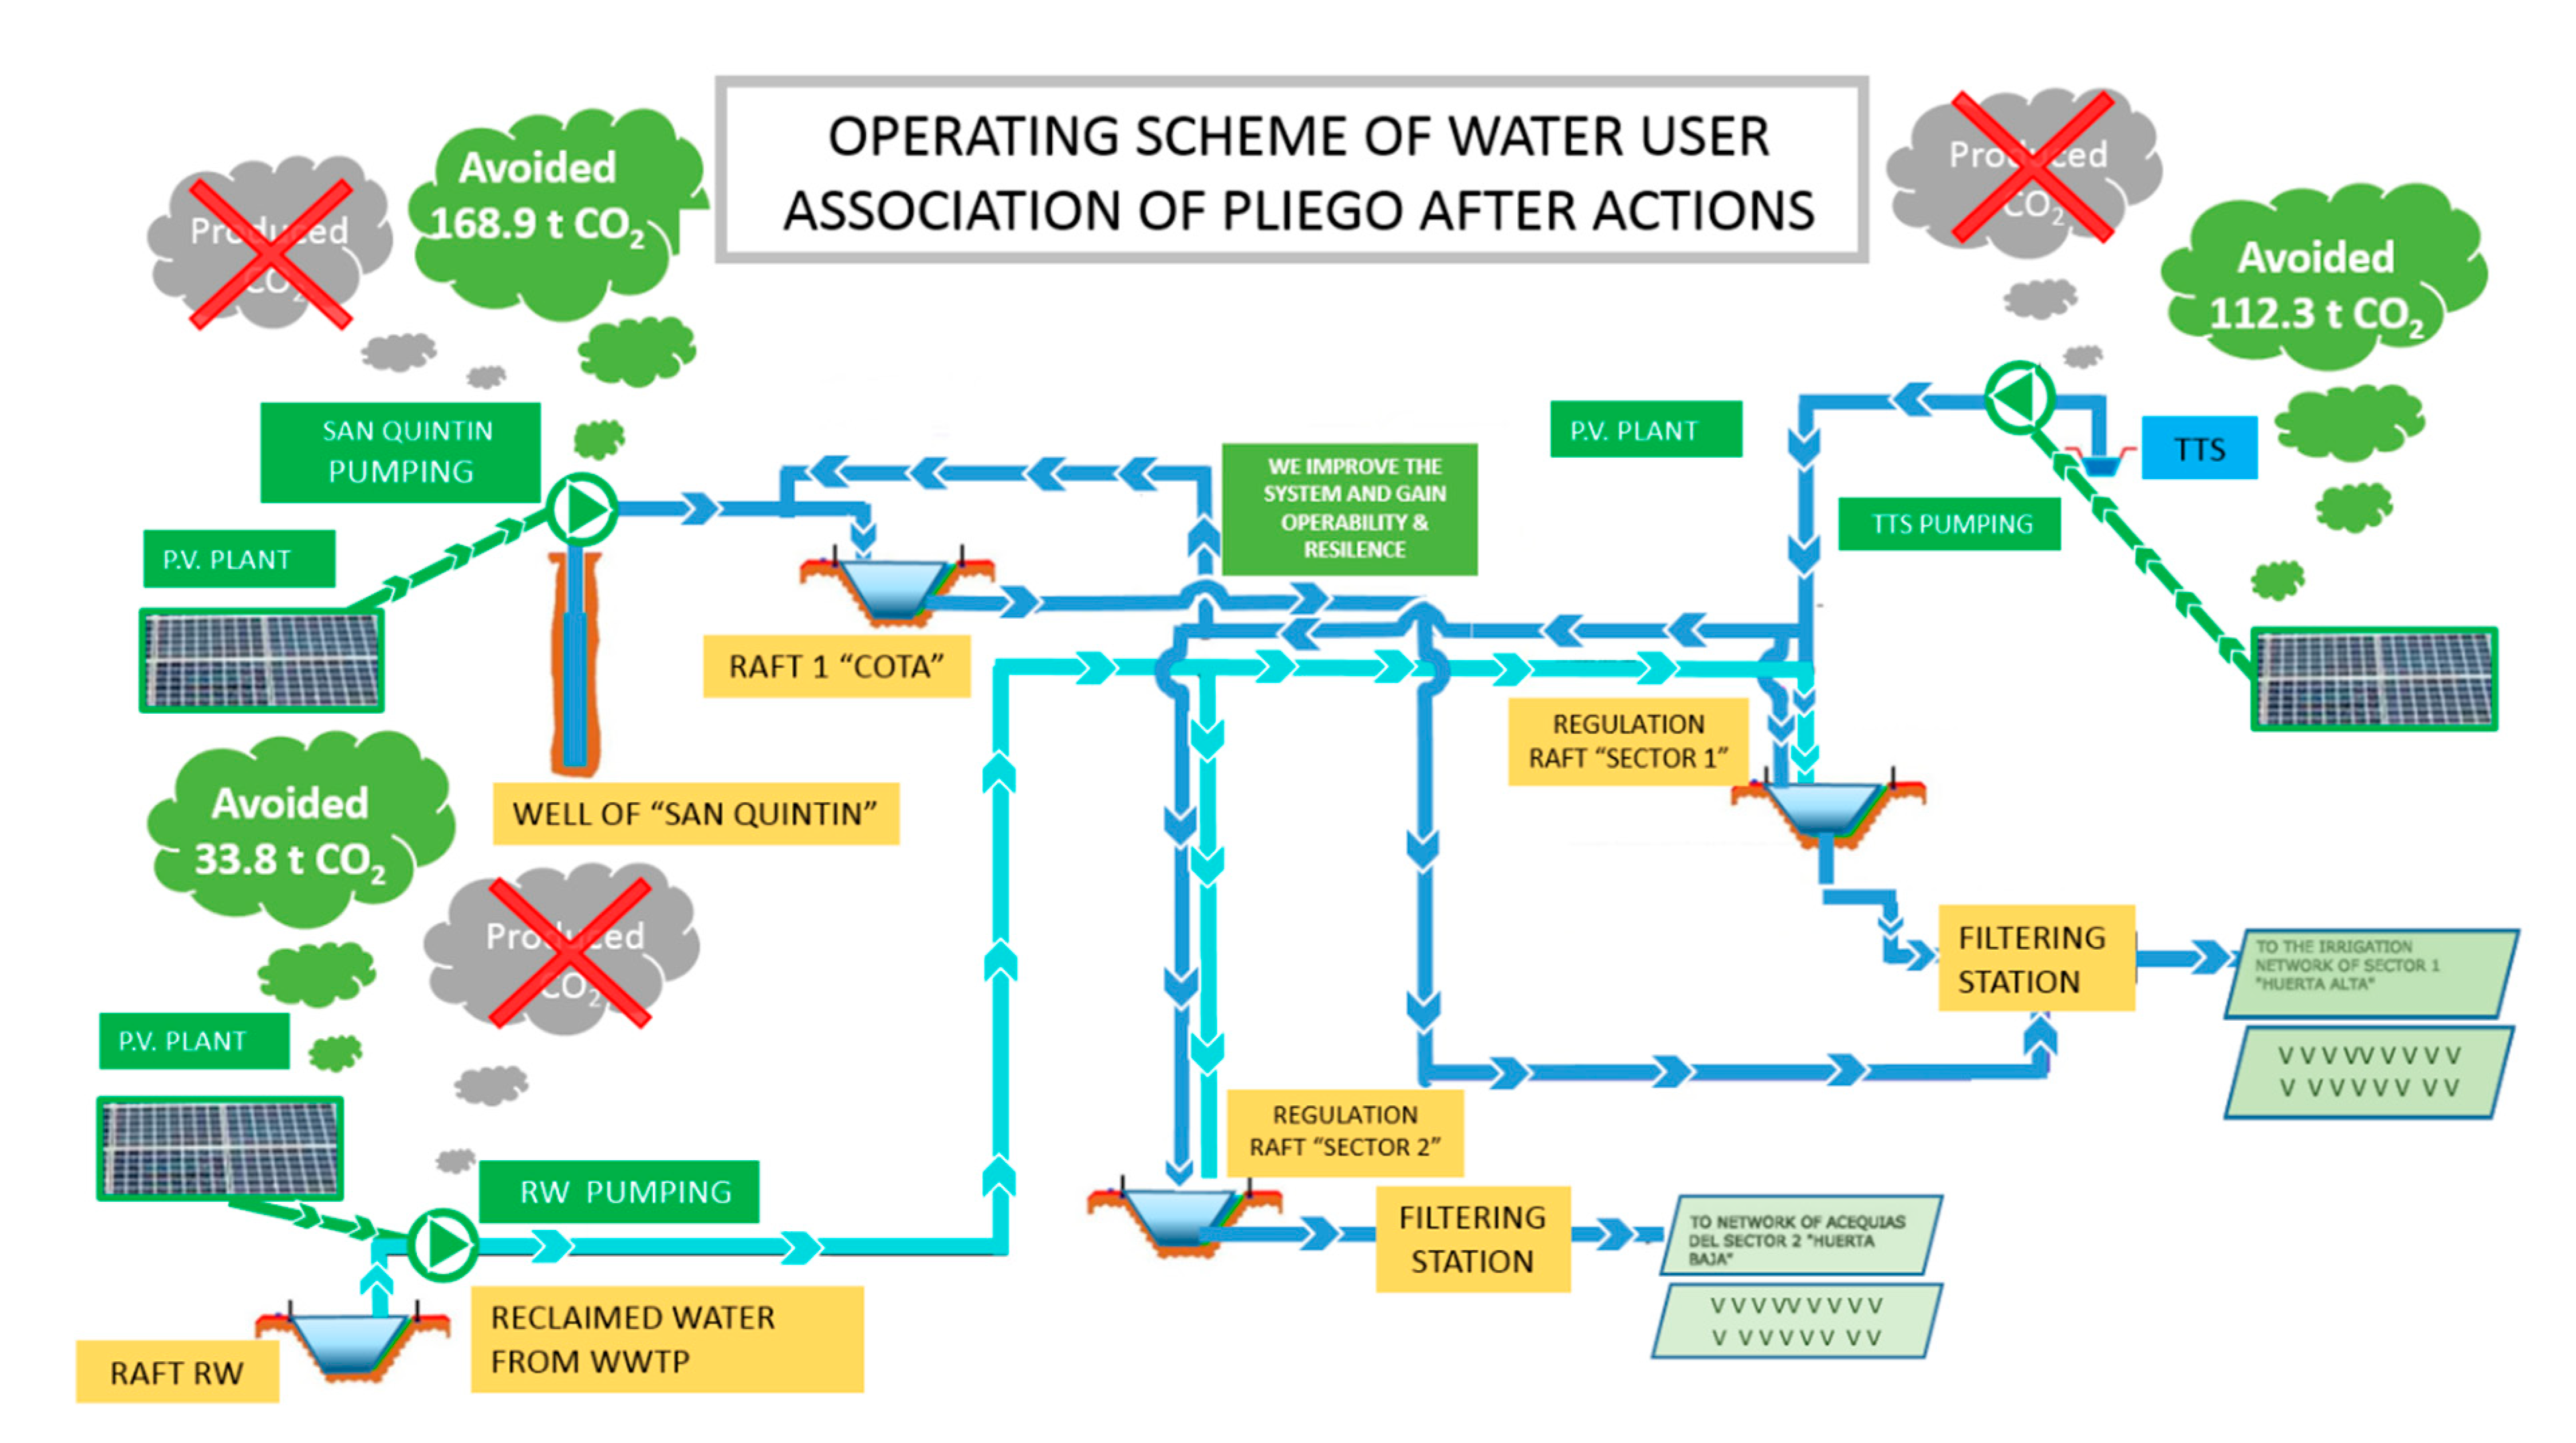
- Determine the graph for its implementation and calculate the avoided CO2.
- Implementation of an irrigation management system in the plots to adapt the production of photovoltaic energy to its consumption.
- In extreme cases, some farmland must be conditioned, leaving land fallow, in order to achieve a sustainable energy system.
Author Contributions
Funding
Acknowledgments
Conflicts of Interest
Abbreviations
| WUA | Water user’s association |
| WWTP | Wastewater treatment plant |
| TST | Tajo-Segura transfer |
| Ed | Average daily electricity production from the given system (kWh) |
| Em | Average monthly electricity production from the given system (kWh) |
| SDGs | Sustainable Development Goals |
| LCA | Life-cycle assessment |
| GHG | Greenhouse gas emissions |
| Hm | Average sum of global irradiation per square meter received by the modules of the given system (kWh/m2) |
| PVGIS | Photovoltaic Geographical Information System |
| CM SAF | Satellite Application Facility on Climate Monitoring |
| IRR | Internal rate of return |
References
- Jiménez-Bello, M.A.; Martínez Alzamora, F.; Bou Soler, V.; Bartolí Ayala, H. Methodology for grouping intakes of pressurised irrigation networks into sectors to minimise energy consumption. Biosyst. Eng. 2010, 105, 429–438. [Google Scholar] [CrossRef]
- Rodríguez Díaz, J.; Pérez Urrestarazu, L.; Camacho Poyato, E.C.; Montesinos Barrios, M.P. The paradox of irrigation scheme modernization: More efficient water use linked to higher energy demand. Span. J. Agric. Res. 2011, 9, 1000–1008. [Google Scholar] [CrossRef]
- Tarjuelo, J.M.; Rodriguez-Diaz, J.A.; Abadía, R.; Camacho, E.; Rocamora, C.; Moreno, M.A. Efficient water and energy use in irrigation modernization: Lessons from spanish case studies. J Agric. Water Manag. 2015, 162, 67–77. [Google Scholar] [CrossRef]
- United Nations World Water Assessment Programme (WWAP). The United Nations World Water Development Report 2014: Water and Energy; United Nations World Water Assessment Programme (WWAP): Paris, France, 2014. [Google Scholar]
- Amanatidis, G. European Policies on Climate and Energy Towards 2020, 2030 and 2050; Policy Department for Economic, Scientific and Quality of Life Policies. European Parliament: Brussels, Belgium, 2019. [Google Scholar]
- Balafoutis, A.; Beck, B.; Fountas, S.; Vangeyte, J.; Wal, T.V.d.; Soto, I.; Gómez-Barbero, M.; Barnes, A.; Eory, V. Precision agriculture technologies positively contributing to ghg emissions mitigation, farm productivity and economics. Sustainability 2017, 9, 1339. [Google Scholar] [CrossRef]
- Woodbury, P.B. Agriculture can mitigate climate change at low cost to help meet paris climate agreement goals. BioScience 2018, 68, 485–486. [Google Scholar] [CrossRef]
- Hillerbrand, R. Why affordable clean energy is not enough. A capability perspective on the sustainable development goals. Sustainability 2018, 10, 2485. [Google Scholar] [CrossRef]
- Mérida García, A.; Fernández García, I.; Camacho Poyato, E.; Montesinos Barrios, P.; Rodríguez Díaz, J. Coupling irrigation scheduling with solar energy production in a smart irrigation management system. J. Clean. Prod. 2018, 175, 670–682. [Google Scholar] [CrossRef]
- Da Silva, I.; Ronoh, G.; Maranga, I.; Odhiambo, M.; Kiyegga, R. Implementing the sdg 2, 6 and 7 nexus in kenya—A case study of solar powered water pumping for human consumption and irrigation. In International Business, Trade and Institutional Sustainability; Springer: Berlin/Heidelberg, Germany, 2020; pp. 933–942. [Google Scholar]
- Pijoan, J.; Fornells, N.P. Reutilización del agua depurada para usos agrícolas en diferentes estaciones depuradoras de aguas residuales de cataluña. Tecnol. Del Agua 2008, 28, 76–81. [Google Scholar]
- Globalwind (Herramienta de Análisis del Potencial Eólico). Centro Nacional de Energías Renovables (Spain). Available online: http://www.globalwindmap.com/VisorCENER/mapviewer.jsf?width=1293&height=709 (accessed on 10 May 2020).
- Real Decreto 244/2019, de 5 de Abril, por el que se Regulan las Condiciones Administrativas, Técnicas y Económicas del Autoconsumo de Energía Eléctrica. (BOE nº 83, de 6 de Abril de 2019) Ministerio de la Presidencia, Relaciones con las Cortes y Memoria Democrática; Government of Spain: Madrid, Spain, 2019; pp. 35674–35719.
- Šúri, M.; Huld, T.A.; Dunlop, E.D.; Ossenbrink, H.A. Potential of solar electricity generation in the european union member states and candidate countries. Sol. Energy 2007, 81, 1295–1305. [Google Scholar] [CrossRef]
- Marion, B.; Anderberg, M.; Gray-Hamm, P. Recent Upgrades and Revisions to Pvwatts; NREL: Golden, CO, USA, 2006.
- Moro, A.; Lonza, L. Electricity carbon intensity in european member states: Impacts on ghg emissions of electric vehicles. Transp. Res. Part D Transp. Environ. 2018, 64, 5–14. [Google Scholar] [CrossRef] [PubMed]
- Huld, T.; Müller, R.; Gambardella, A. A new solar radiation database for estimating pv performance in europe and africa. Sol. Energy 2012, 86, 1803–1815. [Google Scholar] [CrossRef]
- Fernández García, I.; Creaco, E.; Rodríguez Díaz, J.; Montesinos, P.; Camacho Poyato, E.; Savic, D. Rehabilitating pressurized irrigation networks for an increased energy efficiency. Agric. Water Manag. 2016, 164 Pt 2, 212–222. [Google Scholar] [CrossRef]
- Molden, D.; Oweis, T.; Steduto, P.; Bindraban, P.; Hanjra, M.A.; Kijne, J. Improving agricultural water productivity: Between optimism and caution. Agric. Water Manag. 2010, 97, 528–535. [Google Scholar] [CrossRef]
- Reich, N.; Alsema, E.; Van Sark, W.; Turkenburg, W.; Sinke, W. Greenhouse gas emissions associated with photovoltaic electricity from crystalline silicon modules under various energy supply options. Prog. Photovolt. Res. Appl. 2011, 19, 603–613. [Google Scholar] [CrossRef]
- Nugent, D.; Sovacool, B.K. Assessing the lifecycle greenhouse gas emissions from solar pv and wind energy: A critical meta-survey. Energy Policy 2014, 65, 229–244. [Google Scholar] [CrossRef]
- Murcia y el agua: Historia de una pasión. Asamblea Regional de Murcia (spain). Available online: https://www.asambleamurcia.es/divulgacion/murcia-y-el-agua-historia-de-una-pasion (accessed on 11 May 2020).
- Agricultura, Silvicultura, Ganadería y Pesca (Anuario Estadístico de España 2019). Instituto Nacional de Estadística (ine). Spain. Available online: https://www.ine.es/prodyser/pubweb/anuario19/anu19_12agric.pdf (accessed on 10 May 2020).
- Rodríguez Juan, J.E.; Romero Díaz, A. Evolution of land abandonment in the eastern region of murcia. Boletín De La Asoc. De Geógrafos Españoles 2016, 71, 9–29. [Google Scholar]
- Urbanik, M.; Tchórzewska-Cieślak, B.; Pietrucha-Urbanik, K. Analysis of the safety of functioning gas pipelines in terms of the occurrence of failures. Energies 2019, 12, 3228. [Google Scholar] [CrossRef]
- Martini, A.; Troncossi, M.; Rivola, A. Automatic leak detection in buried plastic pipes of water supply networks by means of vibration measurements. Shock Vib. 2015, 2015, 165304. [Google Scholar] [CrossRef]
- Natural Resource Management. Encyclopædia Britannica. Available online: https://www.britannica.com/topic/natural-resource-management (accessed on 12 May 2020).
- Brock, P.M.; Tan, D.K.Y. A second-take on the role of science: The case for applying public administration theory to natural resource management. Sustain. Earth 2020, 3, 1. [Google Scholar] [CrossRef]





| Explotation | Capital Flows | Annual Appropriation (m3) | Regulating Rafts (m3) | |
|---|---|---|---|---|
| Daily Flow (L/s) | Flow (m3/h) | |||
| Well | 95 | 342 | 2,326,158 | 45,000 |
| Tajo-Segura Transfer | 300 | 1080 | 1,140,000 | 230,000 |
| Wastewater treatment plant | 40 | 144 | 163,203 | 39,464 |
| TOTAL | 3,629,361 | |||
| Manometric Eight (m.c.a) | Q (L/s) | Current Pump | Future Pump | |||
|---|---|---|---|---|---|---|
| Power (kW) | Performance (%) | Power (kW) | Performance (%) | |||
| WWTP | 115 | 40 | 74 | 56 | 63.64 | 70 |
| TST | 105 | 126.7 | 315 | 56 | 237.28 | 70 |
| Well | 250 | 90 | 295 | 48.47 | 232.9 | 70.52 |
| Fixed System (Optimized): Inclination = 34°, Orientation = 0° | ||||
|---|---|---|---|---|
| Month | Ed | Em | Hd | Hm |
| January | 1170.00 | 36,300 | 4.27 | 132 |
| February | 1360.00 | 38,200 | 5.01 | 140 |
| March | 1610.00 | 50,000 | 6.10 | 189 |
| April | 1590.00 | 47,600 | 6.10 | 183 |
| May | 1660.00 | 51,500 | 6.49 | 201 |
| June | 1770.00 | 53,000 | 7.00 | 210 |
| July | 1810.00 | 56,100 | 7.28 | 226 |
| August | 1720.00 | 53,300 | 6.91 | 214 |
| September | 1520.00 | 45,500 | 5.96 | 179 |
| October | 1380.00 | 42,700 | 5.31 | 165 |
| November | 1200.00 | 36,000 | 4.45 | 133 |
| December | 1060.00 | 33,000 | 3.89 | 120 |
| Yearly average | 1490 | 45,300 | 5.74 | 174 |
| Total for year | 543,000 | 2090 | ||
| Solar Radiation Database Used: PVGIS - CM SAF | |
|---|---|
| Location | 38°2′22″ North, 1°29′31″ West |
| Elevation | 310 m a.s.l. |
| Peak power of the photovoltaic (PV) system | 350 kWp |
| Estimated losses due to temperature and low irradiance | 11.2% (using local ambient temperature) |
| Estimated loss due to angular reflectance effects | 2.6% |
| Other losses (cables, inverter, etc.) | 14.0% |
| Combined PV system losses | 25.6% |
| Budget | 630,000 € |
| Well Photovoltaic Solar Economic Framework | ||||||||||
|---|---|---|---|---|---|---|---|---|---|---|
| Year | Electrical Consumption without Photovoltaic Energy (Kwh) | Production with Photovoltaic Energy (Kwh) | Cumulated Photovoltaic Production (Kwh) | Spending on Electricity in Pumping Well without Photovoltaic Installation without VAT (€) | Expenditure Fuel Oil (Generator) with Photovoltaic Installation without VAT (€) | Cost of Accumulated Kwh without Photovoltaic (€/Kwh) | Maintenance Expenses (€) | Total Expenses (€) | Accumulated Total Expenses (€) | Cost of Accumulated Kwh with Photovoltaic (€/Kwh) |
| 1 | 522,200.00 | 543,200.00 | 543,200.00 | 31,793.46 | 0.00 | 0.061 | 600.0 | 630.600,0 | 630,600.00 | 1.161 |
| 2 | 522,200.00 | 538,854.40 | 1,082,054.40 | 34,019.00 | 0.00 | 0.065 | 630.0 | 630.0 | 631,230.00 | 0.583 |
| 3 | 522,200.00 | 534,543.56 | 1,616,597.96 | 36,400.33 | 0.00 | 0.070 | 661.5 | 661.5 | 631,891.50 | 0.391 |
| 4 | 522,200.00 | 530,267.21 | 2,146,865.17 | 38,948.35 | 0.00 | 0.075 | 694.6 | 694.6 | 632,586.10 | 0.295 |
| 5 | 522,200.00 | 526,025.07 | 2,672,890.24 | 41,674.73 | 0.00 | 0.080 | 729.3 | 729.3 | 633,315.40 | 0.237 |
| 6 | 522,200.00 | 521,816.87 | 3,194,707.11 | 44,591.96 | 0.00 | 0.085 | 765.8 | 765.8 | 634,081.20 | 0.198 |
| 7 | 522,200.00 | 517,642.34 | 3,712,349.45 | 47,713.40 | 0.00 | 0.091 | 804.1 | 804.1 | 634,885.30 | 0.171 |
| 8 | 522,200.00 | 513,501.20 | 4,225,850.65 | 51,053.34 | 0.00 | 0.098 | 844.3 | 844.3 | 635,729.60 | 0.150 |
| 9 | 522,200.00 | 509,393.19 | 4,735,243.84 | 54,627.07 | 0.00 | 0.105 | 8886.5 | 8886.5 | 644,616.10 | 0.136 |
| 10 | 522,200.00 | 505,318.04 | 5,240,561.88 | 58,450.96 | 0.00 | 0.112 | 1330.8 | 1330.8 | 645,946.90 | 0.123 |
| 11 | 522,200.00 | 501,275.50 | 5,741,837.38 | 62,542.53 | 0.00 | 0.120 | 1397.3 | 1397.3 | 647,344.20 | 0.113 |
| 12 | 522,200.00 | 497,265.30 | 6,239,102.68 | 66,920.51 | 0.00 | 0.128 | 1467.2 | 1467.2 | 648,811.40 | 0.104 |
| 13 | 522,200.00 | 493,287.18 | 6,732,389.86 | 71,604.95 | 0.00 | 0.137 | 1540.6 | 1540.6 | 650,352.00 | 0.097 |
| 14 | 522,200.00 | 489,340.88 | 7,221,730.74 | 76,617.30 | 0.00 | 0.147 | 1617.6 | 1617.6 | 651,969.60 | 0.090 |
| 15 | 522,200.00 | 485,426.15 | 7,707,156.89 | 81,980.51 | 0.00 | 0.157 | 1698.5 | 1698.5 | 653,668.10 | 0.085 |
| 16 | 522,200.00 | 481,542.74 | 8,188,699.63 | 87,719.15 | 0.00 | 0.168 | 1783.4 | 1783.4 | 655,451.50 | 0.080 |
| 17 | 522,200.00 | 477,690.40 | 8,666,390.03 | 93,859.49 | 0.00 | 0.180 | 1872.6 | 1872.6 | 657,324.10 | 0.076 |
| 18 | 522,200.00 | 473,868.88 | 9,140,258.91 | 100,429.65 | 0.00 | 0.192 | 1966.2 | 1966.2 | 659,290.30 | 0.072 |
| 19 | 522,200.00 | 470,077.93 | 9,610,336.84 | 107,459.73 | 0.00 | 0.206 | 2064.5 | 2064.5 | 661,354.80 | 0.069 |
| 20 | 522,200.00 | 466,317.31 | 10,076,654.15 | 114,981.91 | 0.00 | 0,220 | 2167.7 | 2167.7 | 663,522.50 | 0.066 |
| 21 | 522,200.00 | 462,586.77 | 10,539,240.92 | 123,030.64 | 0.00 | 0.236 | 2276.1 | 2276.1 | 665,798.60 | 0.063 |
| 22 | 522,200.00 | 458,886.08 | 10,998,127.00 | 131,642.78 | 0.00 | 0.252 | 2389.9 | 2389.9 | 668,188.50 | 0.061 |
| 23 | 522,200.00 | 455,214.99 | 11,453,341.99 | 140,857.77 | 0.00 | 0.270 | 2509.4 | 2509.4 | 670,697.90 | 0.059 |
| 24 | 522,200.00 | 451,573.27 | 11,904,915.26 | 150,717.81 | 0.00 | 0.289 | 2634.9 | 2634.9 | 673,332.80 | 0.057 |
| 25 | 522,200.00 | 447,960.68 | 12,352,875.94 | 161,268.06 | 0.00 | 0.309 | 2766.6 | 2766.6 | 676,099.40 | 0.055 |
| 26 | 522,200.00 | 444,376.99 | 12,797,252.93 | 172,556.82 | 0.00 | 0.330 | 2904.9 | 2904.9 | 679,004.30 | 0.053 |
| 27 | 522,200.00 | 440,821.97 | 13,238,074.90 | 184,635.80 | 0.00 | 0.354 | 3050.1 | 3050.1 | 682,054.40 | 0.052 |
| 28 | 522,200.00 | 437,295.39 | 13,675,370.29 | 197,560.31 | 0.00 | 0.378 | 3202.6 | 3202.6 | 685,257.00 | 0.050 |
| 29 | 522,200.00 | 433,797.03 | 14,109,167.32 | 211,389.53 | 0.00 | 0.405 | 3362.7 | 3362.7 | 688,619.70 | 0.049 |
| 30 | 522,200.00 | 430,326.65 | 14,539,493.97 | 226,186.80 | 0.00 | 0.433 | 3530.8 | 3530.8 | 692,150.50 | 0.048 |
| 31 | 522,200.00 | 426,884.04 | 14,966,378.01 | 242,019.88 | 0.00 | 0.463 | 3707.3 | 3707.3 | 695,857.80 | 0.046 |
| 16,188,200.00 | 14,966,37.01 | 3,245,254.53 | 0.00 | 65,857.80 | 695,857.80 | |||||
| IRR (to 31 years) | 10.34% | |||||||||
| Pumping Well—Photovoltaic Installation | |
|---|---|
| Projected power | 232.9 kW |
| Annual generated energy | 543,200 kWh |
| Budget | 630,000 € |
| Total number of p 1.400 unities of 250 Wp, c/u | |
| Regulators-Inverters | 350 kW |
| IRR (31 years) | 10.34% |
| Nº of years for profitability | 11 |
| Pumping TST—Photovoltaic Installation | |
|---|---|
| Projected power | 237.3 kW |
| Annual generated energy | 360,971 kWh |
| Budget | 630,000 € |
| Total number of p 1.400 unities of 250 Wp, c/u | |
| Regulators-Inverters | 350 kW |
| IRR (31 years) | 8.31% |
| Nº of years for profitability | 10 |
| Pumping WWTP—Photovoltaic Installation | |
|---|---|
| Projected power | 63.64 kW |
| Annual generated energy | 108,640 kWh |
| Budget | 126,000 € |
| Total number of p 280 unities of 250 Wp, c/u | |
| Regulators-Inverters | 60 kW |
| IRR (31 years) | 11.99% |
| Nº of years for profitability | 7 |
| Avoided Carbon Footprint by Solar Actions (t CO2) | |||
|---|---|---|---|
| PV kWh/year | g CO2/kWh | t CO2 | |
| Photovoltaic installation pumping WWTP | 108,640 | 311 | 33.79 |
| Photovoltaic installation pumping Well | 543,200 | 311 | 168.94 |
| Photovoltaic installation pumping TST | 360,971 | 311 | 112.26 |
| 314.99 t CO2/year | |||
© 2020 by the authors. Licensee MDPI, Basel, Switzerland. This article is an open access article distributed under the terms and conditions of the Creative Commons Attribution (CC BY) license (http://creativecommons.org/licenses/by/4.0/).
Share and Cite
Chazarra-Zapata, J.; Molina-Martínez, J.M.; Cruz, F.-J.P.d.l.; Parras-Burgos, D.; Ruíz Canales, A. How to Reduce the Carbon Footprint of an Irrigation Community in the South-East of Spain by Use of Solar Energy. Energies 2020, 13, 2848. https://doi.org/10.3390/en13112848
Chazarra-Zapata J, Molina-Martínez JM, Cruz F-JPdl, Parras-Burgos D, Ruíz Canales A. How to Reduce the Carbon Footprint of an Irrigation Community in the South-East of Spain by Use of Solar Energy. Energies. 2020; 13(11):2848. https://doi.org/10.3390/en13112848
Chicago/Turabian StyleChazarra-Zapata, Jesús, José Miguel Molina-Martínez, Francisco-Javier Pérez de la Cruz, Dolores Parras-Burgos, and Antonio Ruíz Canales. 2020. "How to Reduce the Carbon Footprint of an Irrigation Community in the South-East of Spain by Use of Solar Energy" Energies 13, no. 11: 2848. https://doi.org/10.3390/en13112848
APA StyleChazarra-Zapata, J., Molina-Martínez, J. M., Cruz, F.-J. P. d. l., Parras-Burgos, D., & Ruíz Canales, A. (2020). How to Reduce the Carbon Footprint of an Irrigation Community in the South-East of Spain by Use of Solar Energy. Energies, 13(11), 2848. https://doi.org/10.3390/en13112848


