Article

How to Reduce the Carbon Footprint of an Irrigation Community in the South-East of Spain by Use of Solar Energy

by
Jesús Chazarra-Zapata
1,
José Miguel Molina-Martínez
2,
Francisco-Javier Pérez de la Cruz
3,
Dolores Parras-Burgos
4,* and
Antonio Ruíz Canales
1
1
Engineering Department, Miguel Hernández University of Elche, 03312 Orihuela, Spain
2
Agromotic Engineering and the Sea R+D+i Research Group, Universidad Politécnica de Cartagena, C/Ángel s/n, Ed. ELDI E1.06, 30203 Cartagena, Murcia, Spain
3
Mining and Civil Engineering Department, Universidad Politécnica de Cartagena, 30203 Cartagena, Spain
4
Structures, Construction and Graphical Expression Department, Universidad Politécnica de Cartagena, 30202 Cartagena, Spain
*
Author to whom correspondence should be addressed.
Energies 2020, 13(11), 2848; https://doi.org/10.3390/en13112848
Submission received: 17 April 2020 / Revised: 22 May 2020 / Accepted: 27 May 2020 / Published: 3 June 2020

Abstract

:
The climate change that plagues the world is causing extended periods of water shortage. This situation is forcing farmers in the region of Murcia in Spain to modernize their irrigation systems to optimize use of the scarce water they have and seek a circular water economy using the recovered water. Moreover, an associated problem is the need for energy that these facilities require in order to pressurize the required water. The use of photovoltaic generation contributes to the reduction of greenhouse gas (GHG) emissions. Food produced in this region tends to have guaranteed markets in Europe and, geographically, due to the high quality of phytosanitary controls and traceability during their marketing, their optimal cultivation, and selection and labelling is verified, specifying valuable information such as: collection date, origin, the use of organic fertilizers among others. To maintain market access, it is important to continue implementing other environmental improvements, i.e., reductions in either hydro or carbon footprints. Previous studies have failed to include the prospect of environmental use of isolated facilities to replace existing consumption, seeking the monetarization of the facility as well as prioritizing the reduction of GHG. Previous studies have failed to include the perspective of environmental use of isolated photovoltaic installations, based on existing consumption, thus, going beyond the monetarization of the facility, to prioritize the reduction of GHG applied in practice by environmentally sensitized farmers. This study was conducted in an existing facility with great technical complexity and three different sources of water supply, over 1500 plots and an altitude range in plots and reservoirs of more than 400 m.

1. Introduction

The new irrigation modernization projects in the Spanish Levante are characterized by replacing traditional irrigation systems (in which free-sheet pipes are used), (25% citric trees, 71% fruit trees, 4% vegetables) with new pressurized irrigation systems [1]. The main requirement of these systems is to employ sustainable energy sources [2], to obtain a minimal working pressure that enables their use with irrigation located in their different modalities, producing improved water efficiency and performance [3]. Currently, these energy sources come from the network mainly originating in fossil fuel and generating a carbon footprint that we must strive to reduce [4]. This study is an effort to meet the three objectives of European policy within the Framework on Climate and Energy by 2030 [5]:
  • A reduction of greenhouse gas emissions of at least 40% (relative to 1990 levels).
  • An increase of at least 27% of the share of renewable energy.
  • An improvement of energy efficiency by at least 27%.
Concurrently, we aim to contribute to meeting the SDGs number 7 (affordable and clean energy), and 13 (climate action). This study focuses on a water user’s association (WUA) with three different sources of water supply: water transferred between basins, water obtained from wells and water recovered from a wastewater treatment plant, with tertiary treatment. In the latter case, pumping is required to supply the highest-level tanks, which guarantee sufficient pressure to irrigate the plots [6]. To this end, the energy consumption of each of the pumping stations has been studied, according to their origin, as well as their associated emissions and after analyzing the different possible solutions using clean energies [7]. Subsequently, the amount of emissions avoided by the use of dimensioned photovoltaic plants has been determined and the reduction of greenhouse gases (SDG) has been quantified [8].

2. Material and Methods
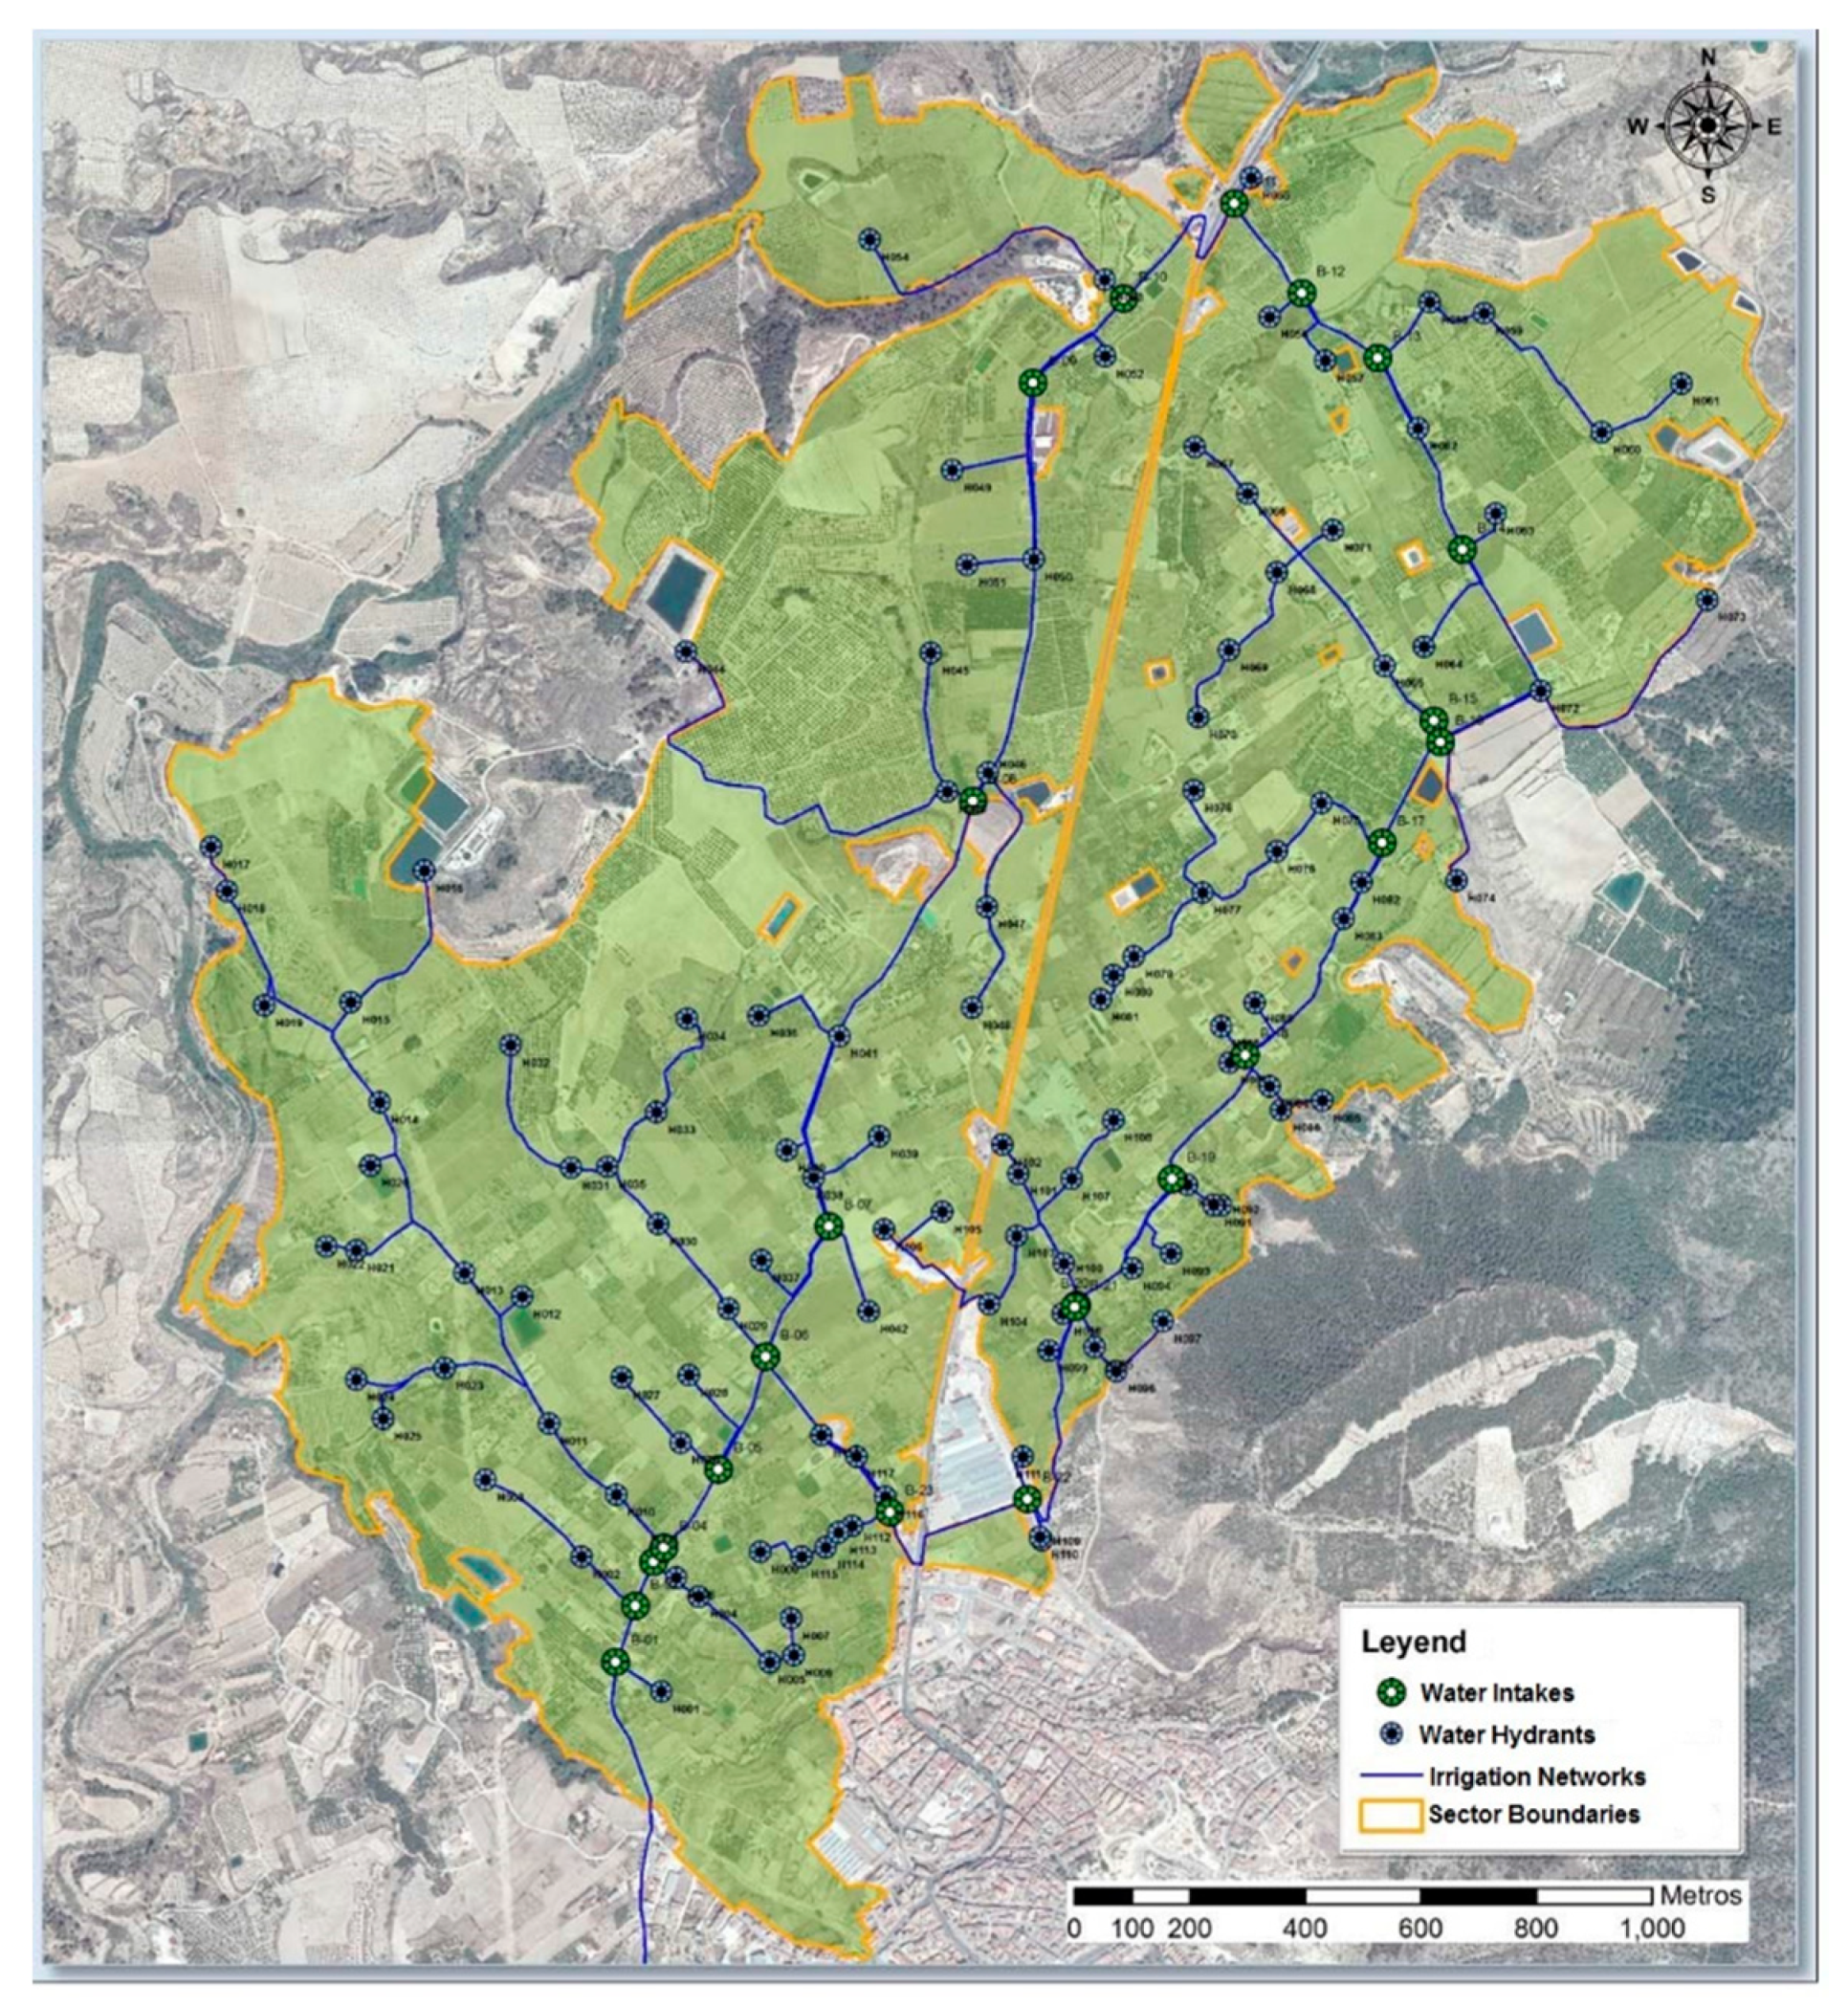
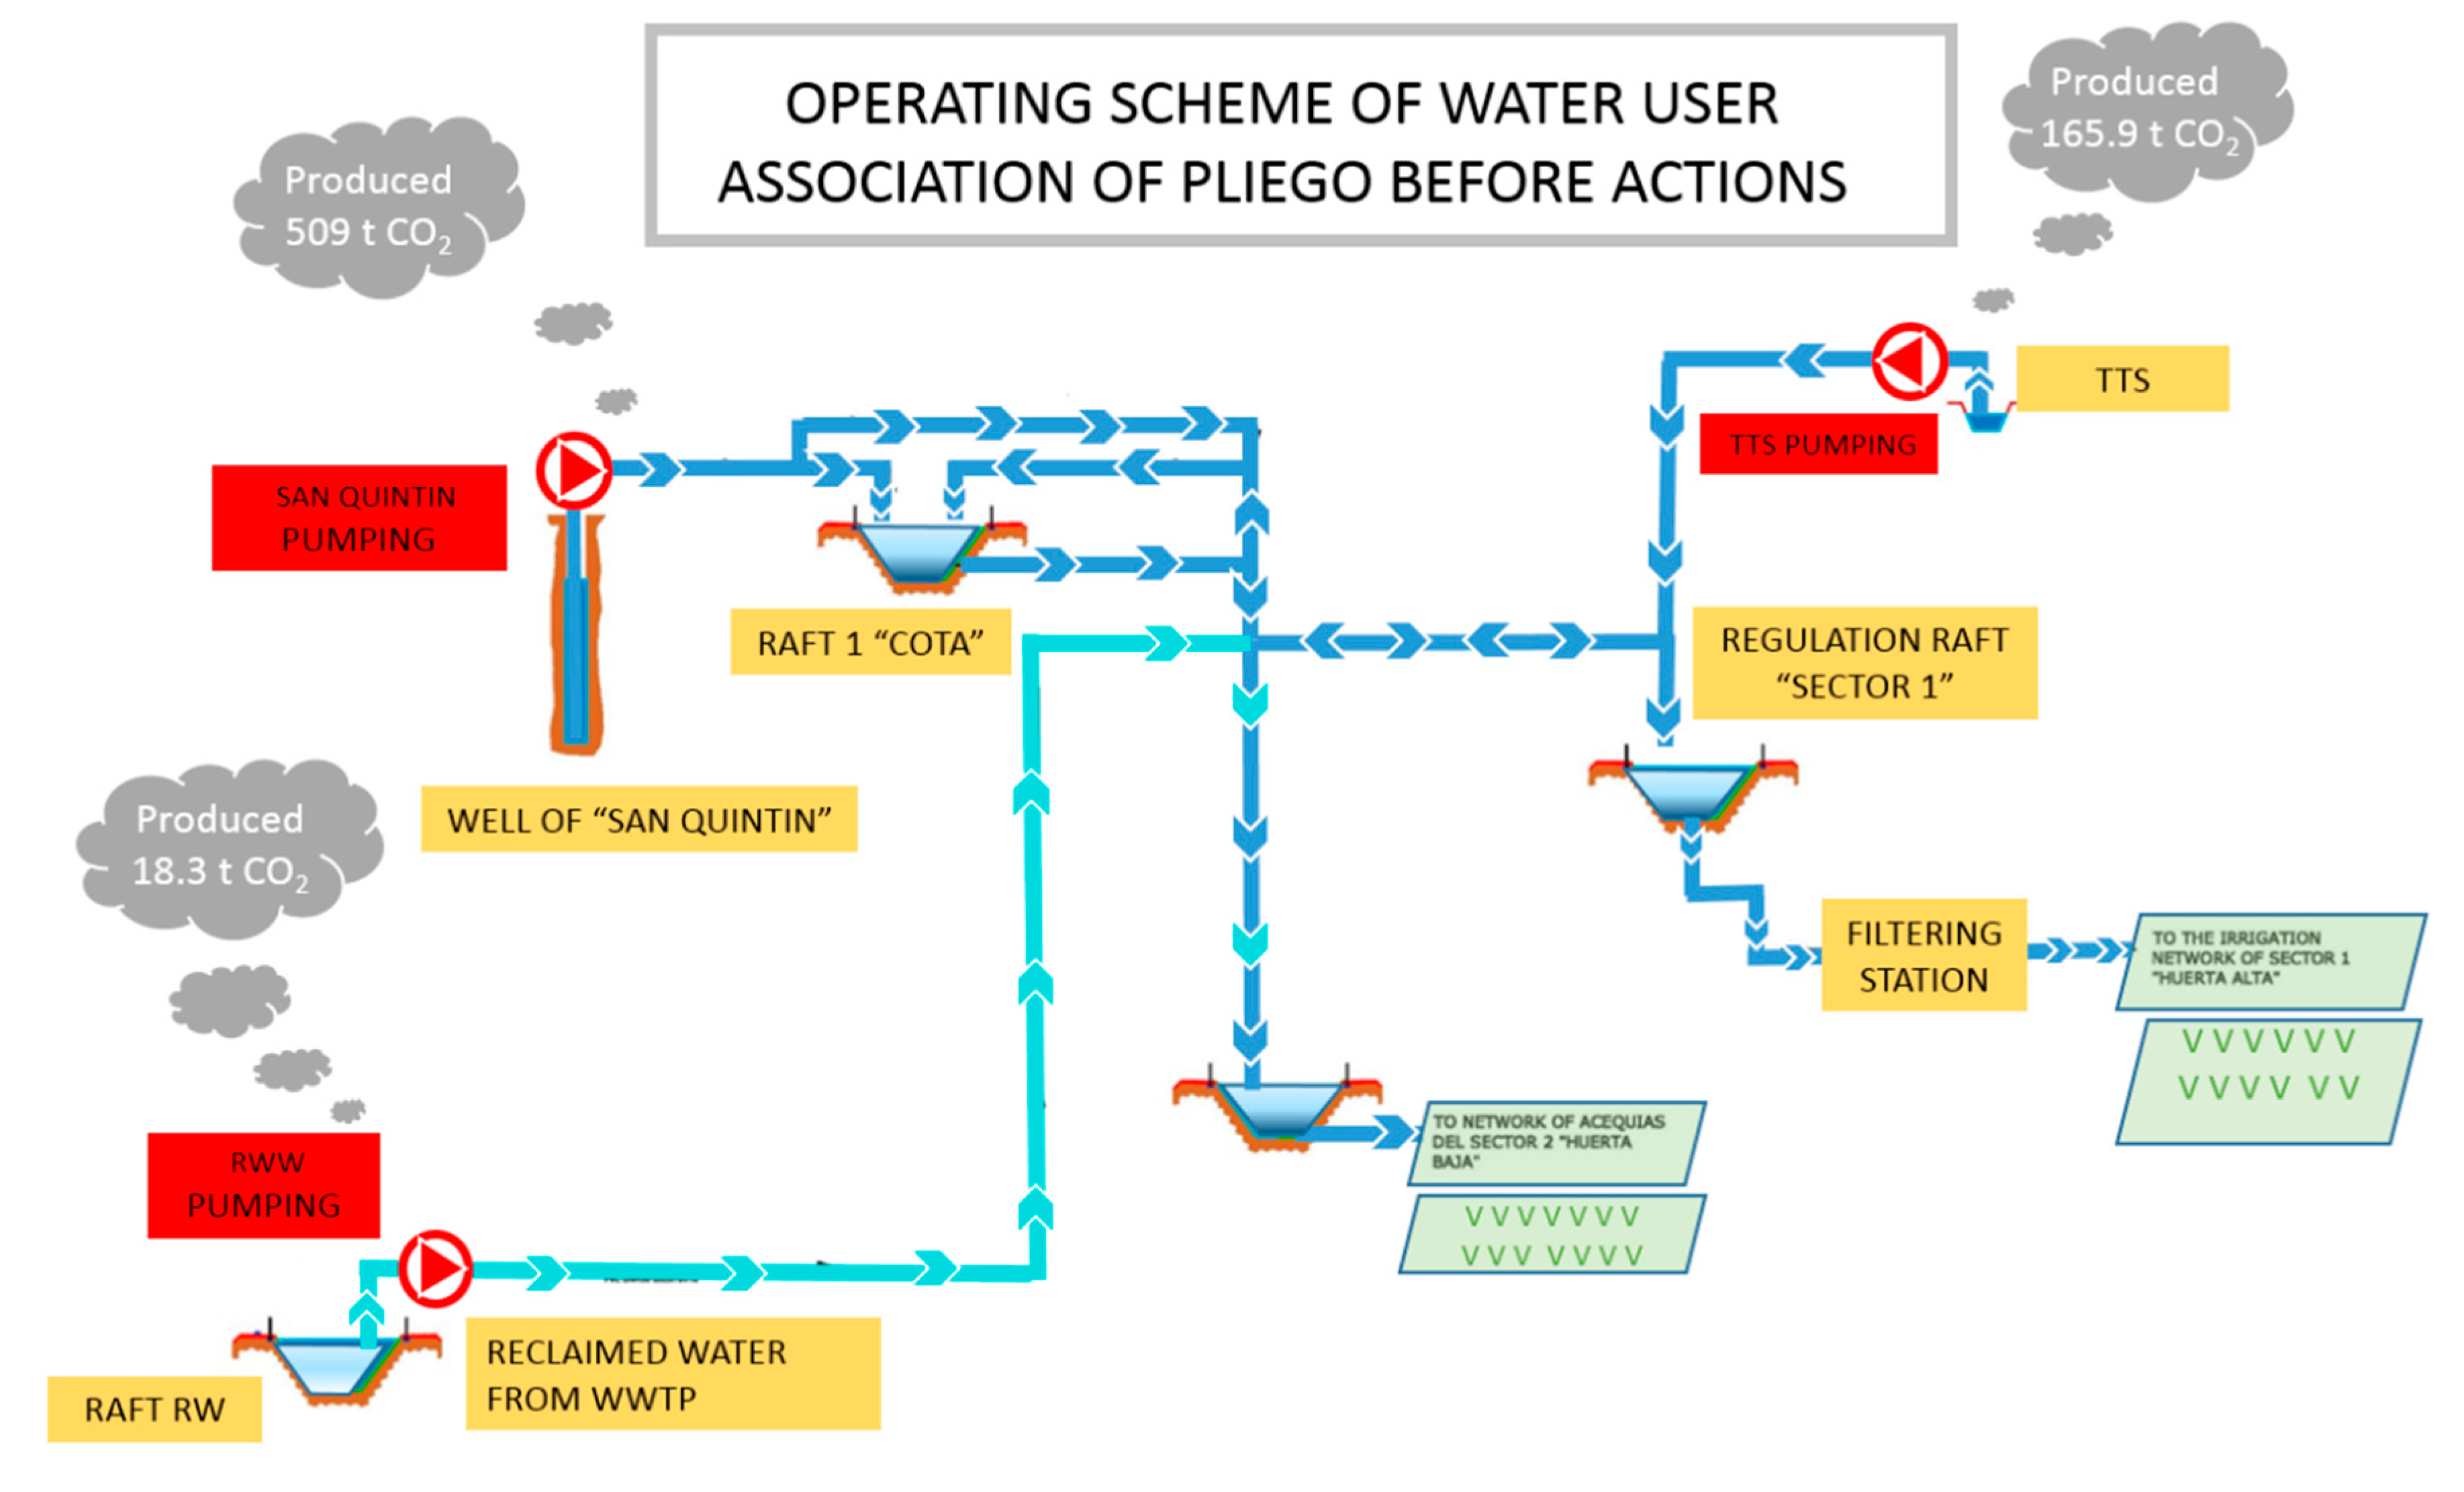
For a comprehensive analysis of the situation, the agroclimatic characteristics and the needs of the crops were studied, which in turn are adapted to the endowments granted by the basin organization (Riber Basin). Data were collected from the different electrical invoices of each consumption point, selecting large consumption (main pumps). This data was processed by separating the different costs from the invoice until the actual pumping consumption was isolated. Once these actual consumptions were calculated, this provided us with information regarding the starting point of the maximum monthly energy needs and the corresponding CO2 emissions, generated over one year, month to month. Several “clean” solutions were considered, such as the generation of energy by turbine-transported water taking advantage of section changes in pipes [9] or wind at points with air current records. However, the use of these methods does not guarantee a sufficient supply of energy for the different monthly demands. Only photovoltaic energy is able to guarantee the necessary energy during any time of the year. The possibility of implementing other energies in a complementary manner was, therefore, ruled out. Moreover, the high cost of the installation was considered, in addition to the loss of energy during transport to the point of use. Furthermore, the lack of a guarantee of continuous wind existence, able to provide sufficient energy for the proper functioning of the pressurized irrigation system and the insufficient production of energy by turbine, considering the low points of possible production, were insufficient in terms of the consumption, and the energy losses due to transportation did not make it viable. Once the days of maximum required energy were known, the photovoltaic plant was sized and potentially avoided emissions were obtained. The adoption of these measures will help to achieve the Sustainable Development Goals [10] and encourage other user communities to employ this energy source.

2.1. Precedents

The WUA of the zone of the study is located in the Region of Murcia (Spain). The irrigable area is 373.59 ha (Figure 1). This WUA has been constituted from the union of different groups and irrigation associations.
This WUA includes two natural exploitations: a well and the Tajo-Segura transfer (TST). Additionally, a third exploitation comes from the wastewater treatment plant (WWTP) in the village of the case study [11].

2.2. Climatology, Thermal Regime, Agroclimatic Traits, and Precipitation Regime

The following will detail the climatic and thermal factors of the study area:
  • Climate: The climatic analysis of the irrigation zone is conditioned by the following factors:
    Latitudinal position, which determines the intensity of solar radiation. The area is between the 37°57′ and 37°01′ parallel, being responsible for the high temperatures in summer.
    Altitude position, which determines the intensity of the precipitations and the prevailing winds of the area.
    Specific conditions of the irrigation area regarding plant roughness and sufficient water supply capacity during the driest months.
    General atmospheric circulation that crosses the region. The presentation of the anticyclone will condition the atmospheric circulation, although it will be tempered by the existing relief structure, which in turn conditions the distribution of precipitation throughout the year.
  • The atmospheric conditions of the study area are determinants of the region’s typical climate, characterized by a decrease in the moisture content of the air masses that, together with the Béticas mountain system, produce the RainShadow effect and result in dry, temperate and clear weather types, both in winter and in summer.
  • Thermal regime and agroclimatic traits:
    The average monthly temperature is colder between 8 and 11 °C; the average minimal temperature is between 4 and 7 °C. The risk of frost is, therefore, low.
    The average warmest temperatures are between 26 and 28 °C, with maximum averages between 32 and 34 °C.
    The average annual rainfall is 200–300 mm. The dry period lasts between 7–11 months, according to the seasons.
    The thermal conditions enable the cultivation of cereals and cotton.
    The climate of the Mediterranean subtropical area is warm or semi-warm.
    The vegetation of the area, due to its aridity, hygrocontinentality and physiognomic formation is transitional between Durilignosa and Siccideserta.
  • Precipitation regime: In the precipitation analysis, we have already anticipated that, due to its arid thermo-Mediterranean thermal regime indicated in the previous section, and other climatic factors, very weak rainfall records are obtained, which, only in years of flooding rarely exceed 350 mm throughout the region.

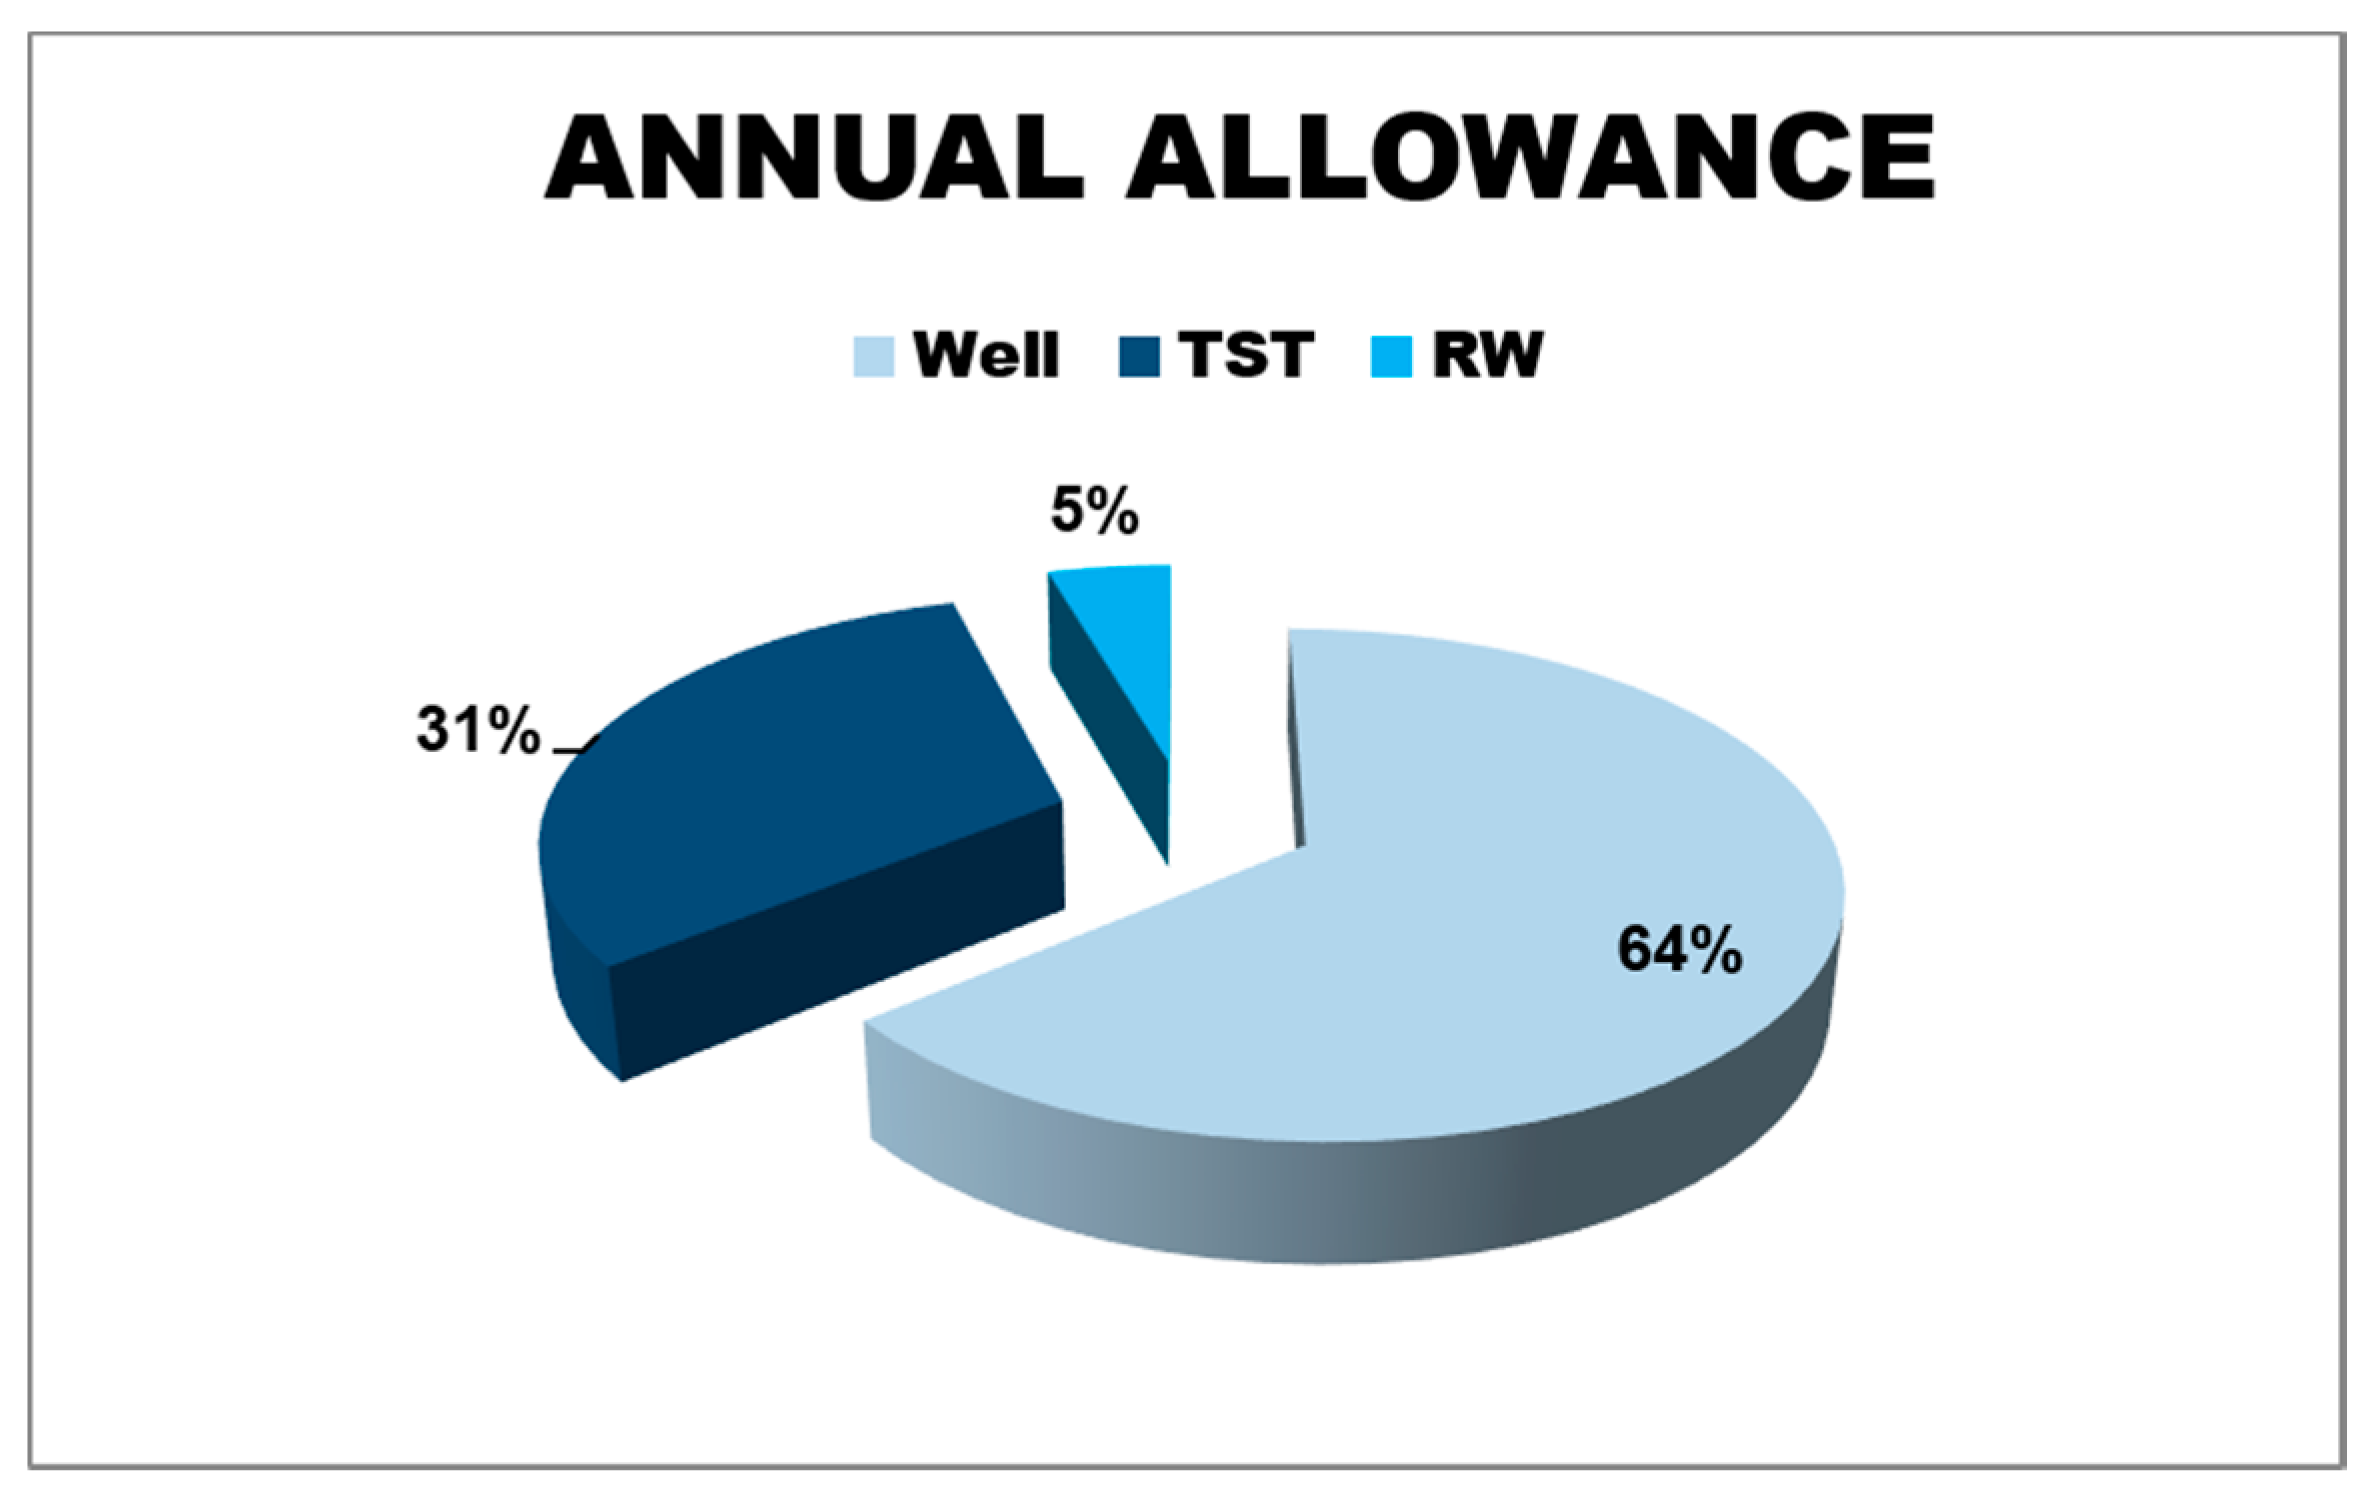
2.3. Water Needs and Available Resources

Currently, with a provision for 10 years, the WUA has three uses with an annual allocation of 3,629,361 m3 (Table 1).
The manner in which irrigation waters are used consist of pumping from the different sources to their own regulation ponds (Table 1), which are owned by the WUA. From there, through conduits, the water is channelled to the points of consumption according to the crop water needs. The extraction by means of pumping takes place in the most economical periods of the hired electricity tariff. Figure 2 displays the water needs which must been covered:

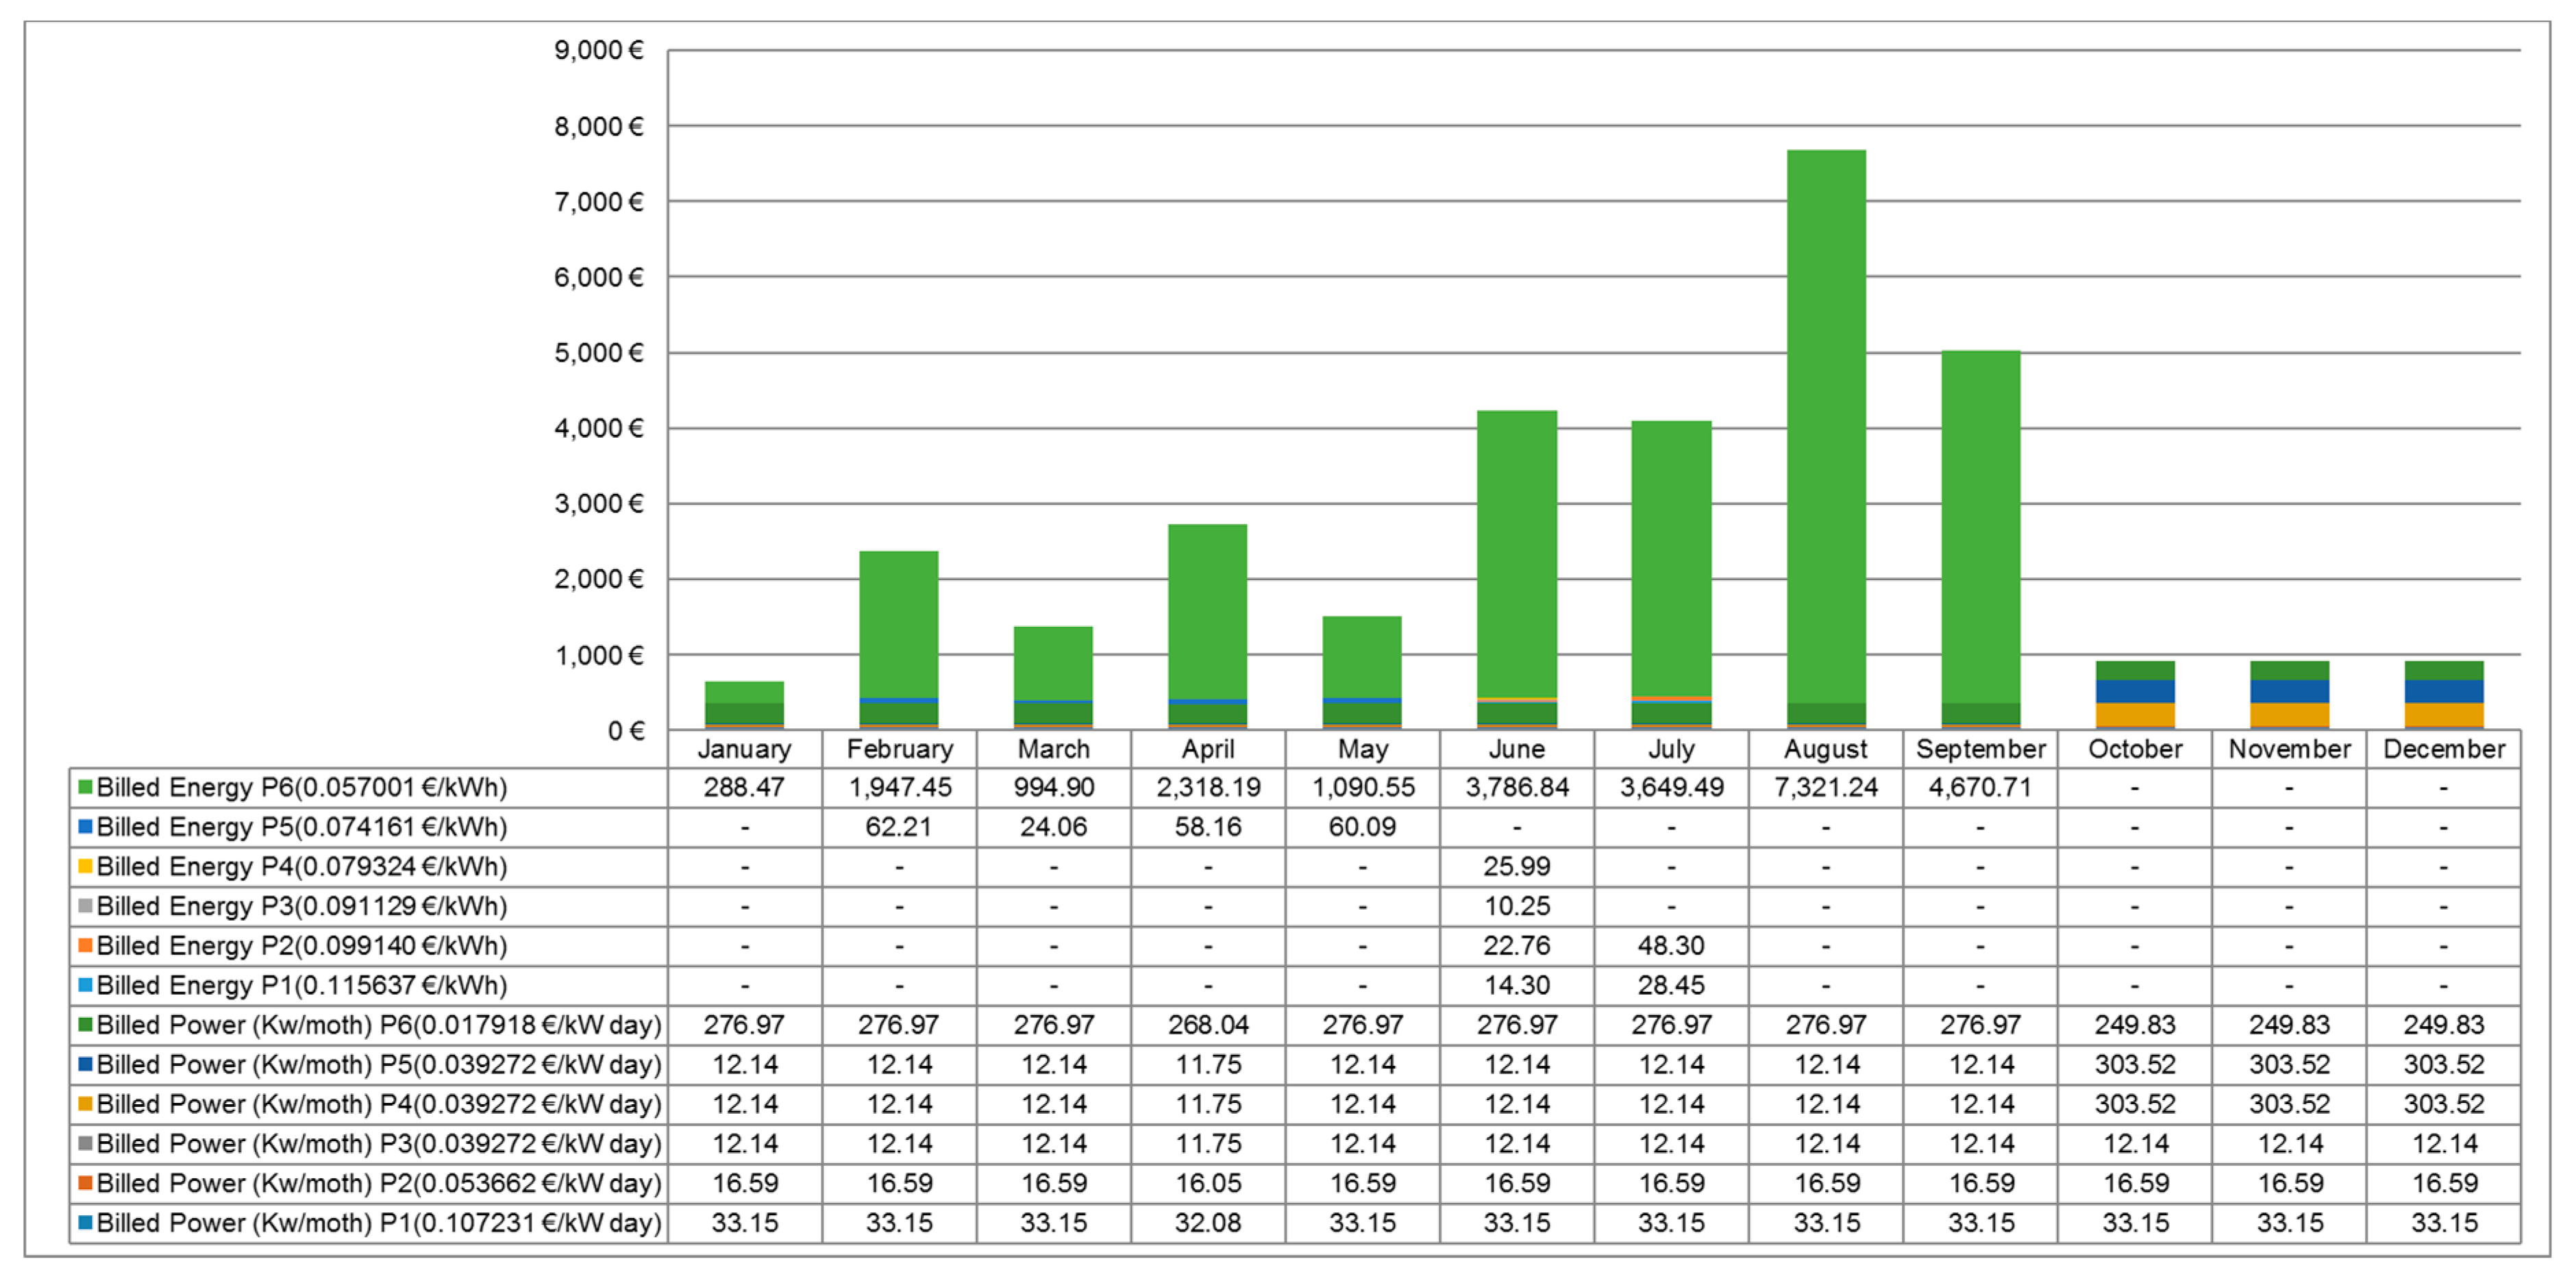
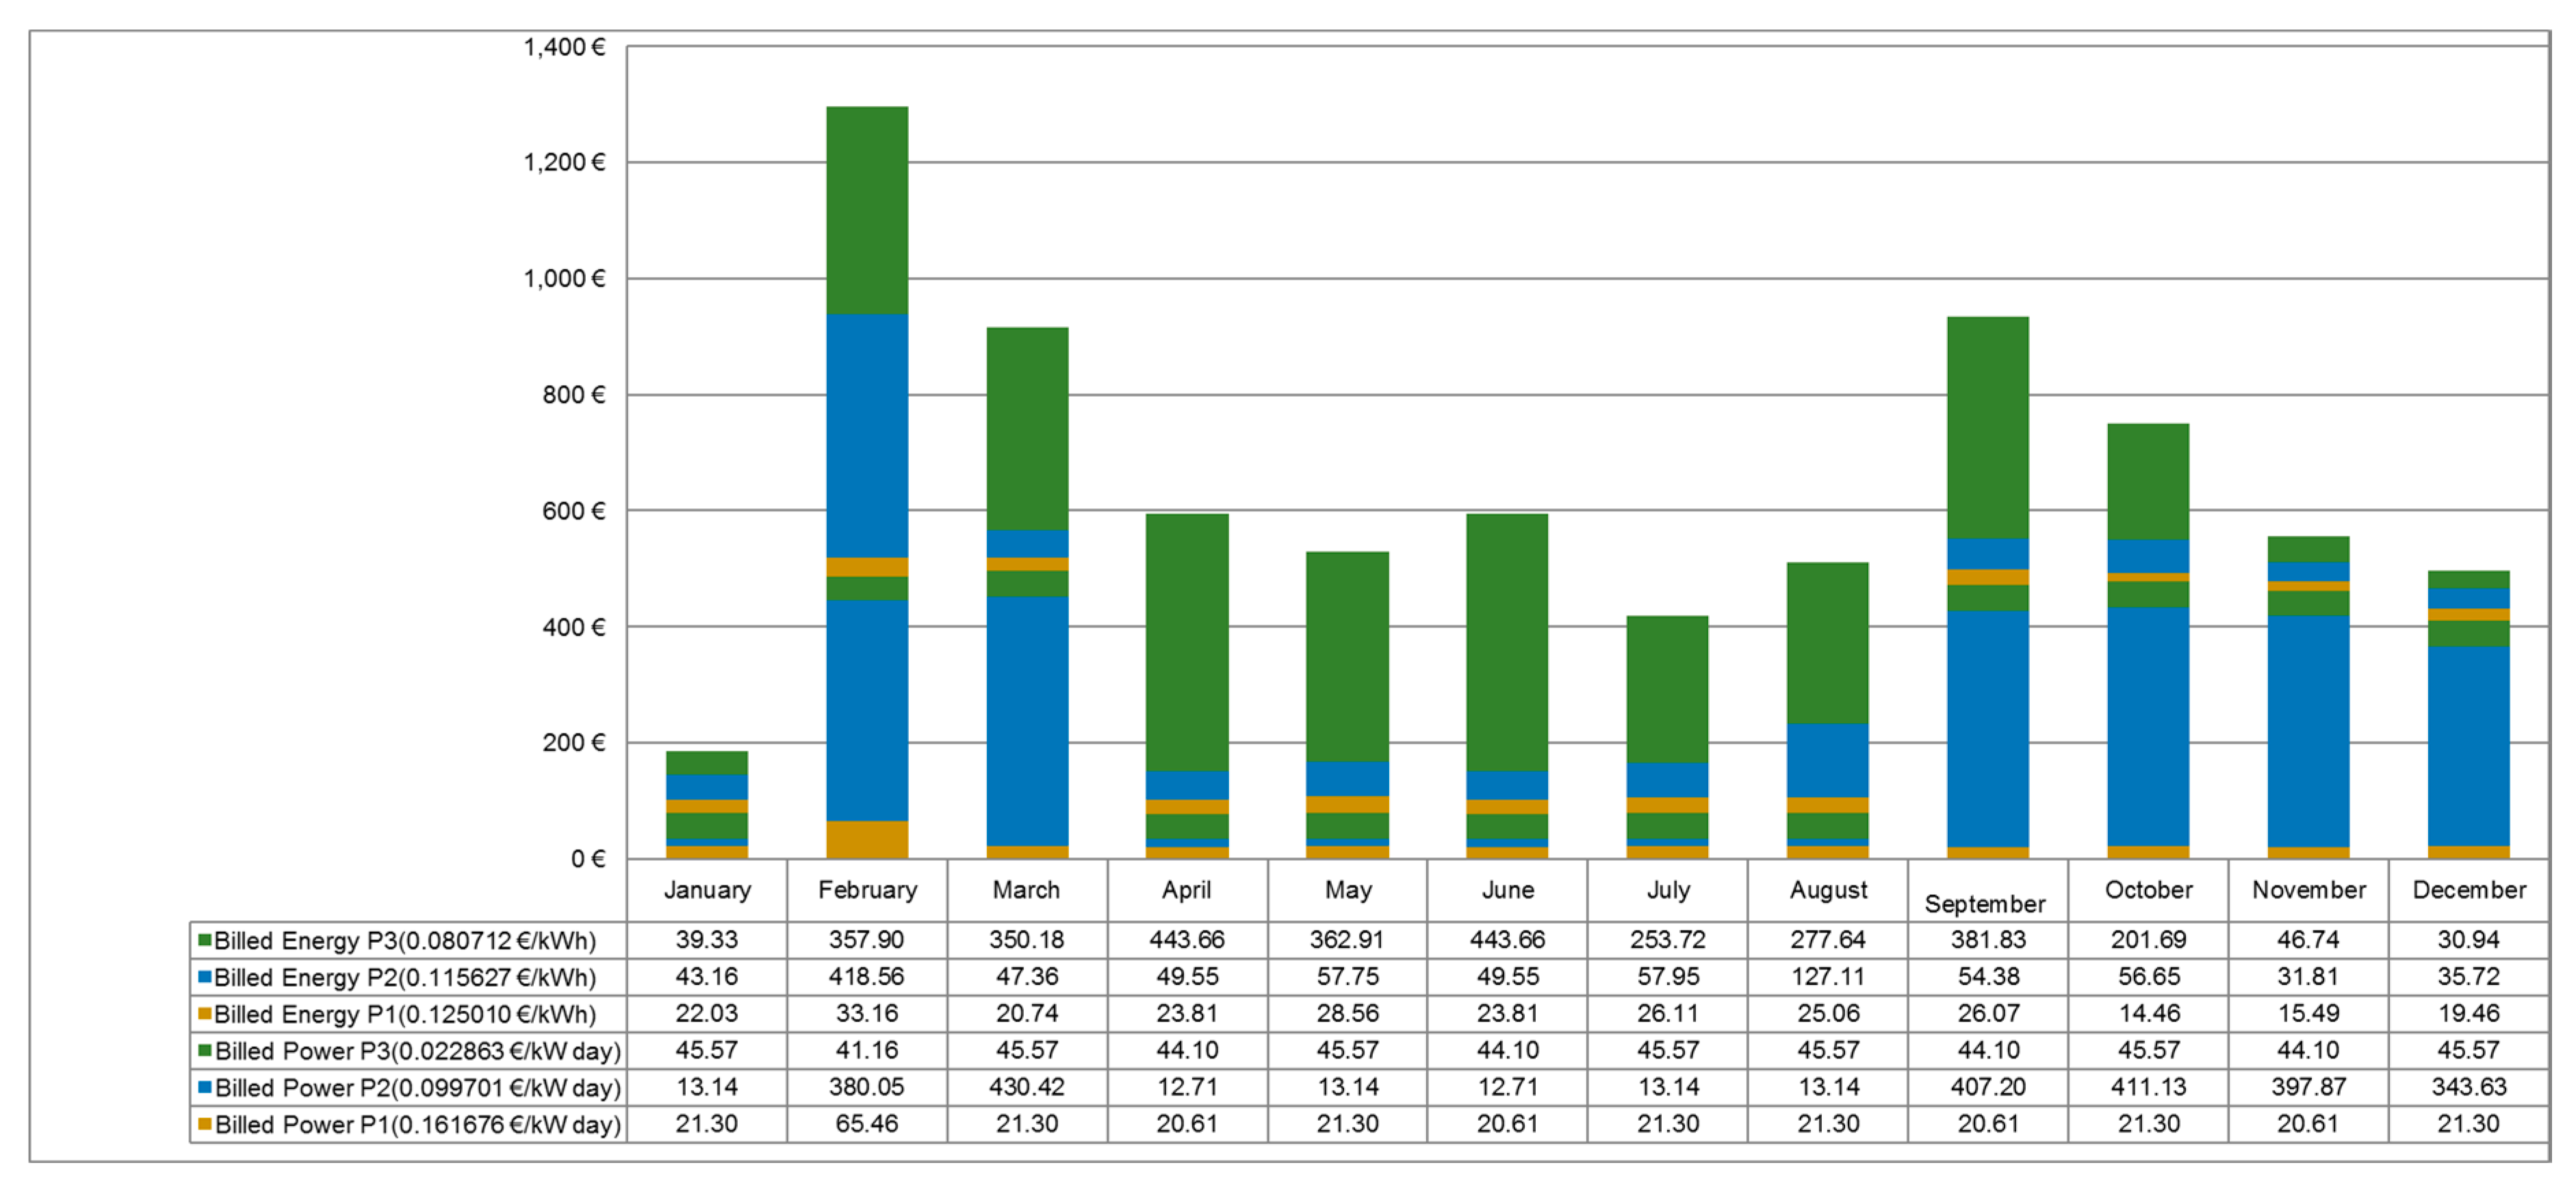
2.4. Financial Expenses of the Electric Consumption by Different Sources

The electric consumptions during 2016 depend on the source of extraction of the irrigation water. The financial expenses will be analysed, according to the billed power and consumed energy. See current operating scheme (Figure 3).

2.5. Financial Expense of Extraction by Means of the Well

For the extraction by means of subsurface water pumping from the well of the system the commercial tariff T6.1 (Spanish normative) was used. This tariff includes high voltage and a power over 15 kW in three periods: P1 = 10 kW; P2 = 10 kW; P3 = 10 kW; P4 = 10 kW; P5 = 10 kW; P6 = 451 kW. The monthly expense is shown in Figure 4. It is clear that the WUA is mainly using the well pump during the less expensive hourly period, based on the P6 tariff.

2.6. Financial Expense of Extraction by Means Tajo-Segura Transfer (TST)

For the water pumping extraction from TST water, the commercial T6.1 tariff was hired. This tariff is detailed in Section 2.1. The monthly expense is displayed in Figure 5.

2.7. Extracting the Financial Expense of Water from the Wastewater Treatment Plant (WWTP)

For the water pumping extraction of water from the WWTP the commercial T3.1 tariff (Spanish normative) was hired. This consists of high voltage and the power over 15 kW in three periods: P1 = 5 kW; P2 = 5 kW; P3 = 75.636 kW. The monthly expense can be observed in Figure 6.
In the case of the WWTP, the WUA is mainly using the extracting pump in the less-expensive periods. This is in line with tariffs P1 and P2. The WUA is using this water source in order to satisfy the water needs of the crop according to the type of hectare, during February and March and from the end of the summer to the end of the year.
The WUA of the studied area faced a bill of 81,949.1 € (taxes included) in 2016, as shown in Figure 7. As previously cited, because of the location of the WUA in a semi-arid zone, the maximal financial expenses occur during the period of maximal water demand, over the summer months.

3. Adopted Measures for Reduction of the Carbon Footprint

3.1. Minimization of the Energy

The entire energy consumed by the WUA is for water elevation. For this reason, a study of the working state of the pumps compared with the optimal equipment requirements for real conditions was developed.
Subsequently, the energy consumption was minimized by replacing all the pumps (Table 2). The European Commission (reference) includes a decalogue of energy efficiency which indicates that, firstly, it is necessary to save the maximum of the possible energy. After this consumption, the conventional energy must be substituted by renewal energy. This depends on the degree of efficiency of its implementation in the system.
The new elevation pumps include a greater efficiency with less power. Consequently, this equals less consumption. The efficiency of the old pumps was 50%.

3.2. Analysis of the Available Technologies

After a detailed analysis of the different technologies available, the photovoltaic generation was chosen as the optimal option. This is because of the maturity of the technology, the availability of areas, the elevated irradiation in the zone and the proximity between generation and consumption zones. Other options considered and rejected were as follows:
  • Wind energy: only two turbines could be considered considering the wind map published by CENER (National Renewable Energy Centre) [12] two generators with an estimated generation power of 6 kW could be considered with which a generated power of about 20 kWh/day and 6761 kWh/Year versus 2,032,471 kWh could be obtained is negligible production with considerable investment with considerable investment. It would be necessary to complement this with another alternative and safe energy source in order to avoid periods without energy.
  • Water energy: the irrigation network design enables the possibility to take advantage of the existing overpressures in several points of the system in order to generate electric energy. After a technical study, the incorporation of this technology was evaluated. The solution was the incorporation of two micro turbines linked to the existing pressure-reducing valves.
Moreover, the installed powers were 10 and 7.5 kW. This option was discarded because of the low power available. Additionally, the excessive distance between the generation and the nearest consumption (nearly 3 km to the filtering system) can generate great losses during the energy transportation.

3.3. Legislative Alternatives of Photovoltaic Installations

During the execution of the project, the Spanish regulations RD 244/2019 of April 2019 [13] were in force, which is why the solution to the problem was resolved in compliance with the regulations presented in this paper.
  • Alternative 1. Electricity supply with self-consumption.
  • To obtain the supply of electricity by means of self-consumption, type 2 is included, according to Spanish regulations (art. 5 of RD 244/2019), this standard includes the administrative, technical and economic conditions of the modes of supply of electricity with self-consumption and production with self-consumption. This is due to the fact that the hired power is more than 100 kW at this point. In the self-consumption mode, the electricity system is required to be registered as a consumer and producer (art. 4.1.b RD 244/2019). This electrical system must be registered in the RIPRE register (Registration of Electrical Energy Production Facilities in Special Regime), in the Ministry of Industry, Energy and Tourism of Spain. This mode enables the possibility of selling the overproduction, however, it is necessary to consider the expenses and taxes that must be applied for this option:
  • —Generation toll (0.50 o/MWh)
  • —Generation tax for electrical producers (7% of turnover).
  • In the case of the sale of the overproduction, some tax expenses for the system owner must be declared in the generation of tolls and taxes. In conclusion, this alternative does not fully improve the reduction of the carbon footprint as it is powered by the conventional production network.
  • Alternative 2. Supply of electrical energy by means of an isolated photovoltaic generation system.
  • This alternative eliminates the complexity of system legalization because RD 244/2019 does not apply. As a curriculum, the main objectives to meet due to the improvement of the energy efficiency of the WUA irrigation system are:
  • 1. Suppression of electricity power generation costs.
  • 2. Electrical energy is produced by conventional sources of renewable energy. This allows for an environmental improvement by reducing CO2 emissions into the atmosphere. Based on the above reason, this alternative was selected for this project.
Currently, the legal conditions for the installation of photovoltaic plants have been improved even if further fed into the grid and generating excess energy [11]. However, all the plants described here are perfectly valid.

3.4. Solar Photovoltaic System

In order to calculate the generated energy in each of the photovoltaic systems, the PVGIS (Photovoltaic Geographical Information System) [14] and PVWATTS [15] tools provide web-based solar radiation databases for the calculation of PV potential in several countries and with the Satellite Application Facility on Climate Monitoring (CM SAF) database belonging to the European Organization for the Exploitation of Meteorological Satellites. This software was created by the Joint Research Center of the European Commission. This software uses all the climate (irradiation, temperature, among others) and geographical values of the area. The generated energy in a photovoltaic system with a determined inclination, and orientation is then obtained.
For the design of the system the recommendations of the Spanish Energy Diversification and Saving Institute (IDEA in Spanish) were taken into account, particularly for the calculation of the separation between rows and modules and the optimal inclination of the panels depending on the latitude.
If necessary, plans have been made to provide a generator owned by the community of irrigators, although the photovoltaic infrastructures are sized in order to avoid their start-up, given the high cost per kWh generated in a group (above 20 euro cts./kWh).
Another important aspect is that since we have accumulation rafts and we do not depend on an instant demand, we will not install batteries of accumulators, with the consequent economic saving. Consequently, the inverter will be programmed so that depending on the levels in existing rafts and the level of production that exists, the pumping will be fed from the photovoltaic field.

3.5. Calculation of the Photovoltaic Solar Installation for the Pumping of the Well

We chose to develop a procedure to calculate the photovoltaic pumping installation of the well, as an example of the calculation since it is the main source of water supply for irrigation. As already mentioned, PVGIS software is used by the CM SAF database to obtain, among other values, the daily average electricity production of the given system (kWh) as well as the average global irradiation per square meter received by the modules of the given system (kWh/m2) (Table 3).
With this data, the maximum power of the photovoltaic system is obtained as well as the total budget of the installation and its components (Table 4).
From the data obtained we can calculate the energy generated by the photovoltaic field of 350 kWp monthly (Figure 8).
As displayed in the figure above, the energy needs are fully covered by our proposed photovoltaic system. Below, we analyze the profitability of the new system by calculating the internal rate of return (IRR), to 31 years as the useful life of our facility, used as an indicator of the viability of any project (Table 5).
We obtained an IRR (31 years) of 10.34%, a more than acceptable percentage that indicates the viability of our project. The graph below displays the cumulative price curve for grid electricity and the accumulated price of electricity generated by photovoltaic panels (Figure 9).
If we observe the cutoff point between both curves, this indicates the year when the unit price of the electric energy consumed starts to be greater than the unit price of the self-consumed energy (including the cost of the installation, maintenance, and the estimated annual decrease in the performance of solar panels).

3.6. Summary of Calculation of Photovoltaic Solar Installations

Following the calculations in the previous section, the data of the photovoltaic installations of the three sources of water supply for irrigation are obtained (Table 6, Table 7 and Table 8).

4. Results and Discussion

4.1. Results

This study examined each of the pumping stations, obtaining the 31-year IRR of a network disconnected from the photovoltaic system (supplied in time by a portable generator); interesting values have been obtained from the point of view of profitability, equaling 8.31% for TST pumping, 10.34% for the pumping well and 11.99% for the pumping WWTP. The equivalent quantity in kg for the CO2 emissions released into the atmosphere were calculated (considering that the 1 kWh ratio corresponds to 0.341 kg of CO2) [16], thus the total amount of CO2 produced was 693.07 t (Figure 10).
It is important to note that the pumping operating periods for the different months should be adapted to the monthly generation curve of a photovoltaic facility [17], redistributing this consumption into adjacent months by leveraging energy storage through water elevation to reservoirs at high altitudes, rather than batteries, which equals significant savings in the cost of water. Likewise, this represents significant savings in the cost of installations (Figure 11).
In the graph included, it is important to note the example provided for the calculation of the photovoltaic installation for pumping wells, the meeting point between the two curves (cumulative price curve of the grid electricity and the accumulated electricity price generated by photovoltaic panels); this cut-off point indicates the year after which the unit price of the electricity consumed begins to be higher than the unit price of self-consumed energy (including installation cost, maintenance, estimated annual performance of solar panels). This moment is before year 10 for TST pumping, before year 11 for the pumping well, and before year 7 for WWTP pumping. Moreover, we must not only weigh economic studies [18,19] when carrying out such actions. It is necessary to understand the reality of our global framework and to be aware that we must reduce CO2 emissions. This study has evaluated the total CO2 emissions avoided by the production of our photovoltaic plant, considering that the government is currently developing regulations to allow the grid to pour the surplus of energy produced, which is not used in the plant. Thus, the monthly amount of CO2 emissions avoided is shown in the graph below (Figure 12), in which the values are the result of applying the grams of CO2/kWh avoided by the generation of photovoltaic power (341 g CO2/kWh) [20], less CO2 generated for the implementation of the photovoltaic plant (30 g CO2/kWh) [21]. This value has been adopted for the use of polycrystalline modules and supported by simple concrete supports on the draining ground as shown in the photo (Figure 13).

4.2. Discussion

This research is part of an International European Project on the Effects of Climate Change, Sustainable Energy and Wastewater and Regenerated Management, within the European ALICE project (AcceLerate Innovation in urban wastewater management for Climate changE, https://www.alice-wastewater-project.eu/). In relation to the objectives established in the project, this study highlights the experience provided by the Region of Murcia, located in the southeast region of Spain, where more than 20 assault tanks and over 90 wastewater treatment plants have been built to reuse 97% of wastewater for agricultural use, avoiding an effect on valuable water bodies and sensitive areas of the coast with an exceptional quality of recovered water, which can be used for agricultural use without any health risks, in addition to reusing digested and treated sludge for use as nutrients for fertilization and improving productive capacities in crops. This project highlights the need for an interaction between the different developed countries that produce CO2, as well as examining the consequences this has for them and third parties. To this end, there is a need to reduce energy consumption and exchange these for ecological sources capable of reducing the carbon footprint, as is the case of the Region of Murcia, a pioneer in alternative energy uses. Similarly, knowledge and experiences are exchanged on the uses of new technologies, such as the application of solar energy for disinfection, detection and remote control of emerging contaminants for disposal, the use of nanomaterials for wastewater treatment and others. All this training and information is being applied in the modernization of purification systems to continue the safe use of regenerated water in agriculture, combining it with the use of renewable energies that contribute to reducing the carbon footprint and improving the water footprint. The novelty is the implementation of solar energy to manage the energy demands of a community of irrigators of more than 600 years [22] which is characterized by having micro plots in a very abrupt environment, where the existing geographical and climatic conditions, make it necessary to manage scarce available water resources by pressurizing irrigation networks to improve water efficiency. To this end, on the basis of the available water sources, including the regenerated WWTP of the population of Pliego (Murcia), the demand for water has been estimated, as well as the production capacity for solar energy that will enable the management of agricultural spaces seeking sustainable production and the reduction of CO2 emissions, thus preserving the environment. Herbaceous and forage cereals are produced in central and northern Spain, along with large expanses of vineyards, while the Mediterranean regions stand out for their production of vegetables, as well as for the cultivation of oil and cotton thanks to their geomorphological and climatic characteristics, among which the elevated hours of sunshine stand out, producing products of the highest quality [23]. The problem of these coastal regions is the low rain intensity, therefore, they must make the most of the small amount of water available. This is only possible by pressurizing irrigation networks, with the consequent energy expenditure making it economically and environmentally unviable. Were it not for the use of renewable energy that, in addition to reducing CO2 emissions, contributes to generating a sustainable system that will keep plants en masse, the progress of desertification [24] that threatens southern Europe would be increasing.

5. Conclusions

The result of these actions produces an improvement in the avoidance of emissions thanks to the implementation of photovoltaic plants. However, these measures must also be accompanied by management improvements regarding the schedules of irrigation shifts, and starter systems [18] for pumping via the use of inverters, together with the implementation of new pumps with better performance and lower consumption.
In our case, the system vulnerabilities have been studied based on critical infrastructure risk analysis methods, which have been developed, and have been shown to be effective for pipes, as well as for achieving greater safety and reliability [25]. After evaluating the initial hydraulic system, we detected that during daytime pumping-taking advantage of photovoltaic energy, there was a conflict or threat to the irrigation of crop areas located at low dimensions, as shown in Figure 14 from the raft dimension. The single reversible conduit, which pumped water from the raft of regenerated water to the rafts at a higher height, while lowering it and making changes in the direction of water, mobilizing large flows by using important section pipes, caused numerous problems in valves, and special parts, causing a greater likelihood of breakage [26]. Consequently, this entailed damage, by having to empty the pipes, considering the cost of repairing the conduits, in addition to the water wasted during the discharge and filling the conduits in order to carry out the repairs. Furthermore, this comes with a risk, according to the importance of the breakage, of a lack of supply capacity which, in turn, in certain horticultural crops can entail a loss of production.
To this end, we decided to duplicate the main conflictive conduits to render the system more robust, and to guarantee the maximal use of the photovoltaic energy generated, as shown in Figure 15, obtaining a new operating scheme.
In addition, considering the initial carbon emissions shown on the grid, these can be higher than those that are actually avoided and this is not only due to the improvement of sustainable energy sources, but also to the addition of other actions related to selecting the best system, or water governance and the use of ITCs (Information and Communications Technologies) that also cause reduced emissions. Finally, it should be noted that the implementation of these three photovoltaic installations have led to savings in annual CO2 emissions, amounting to 314.99 t CO2 (Table 9).
Consequently, these three actions significantly improve the energy capacity of the irrigator community, and not only reduce annual maintenance costs, once the installation is amortized, but are not affected by the electricity tariff factor. It should be noted that in semi-arid areas of the Mediterranean we must not only think of fruit/agricultural plantations as the main means of production, but also as an ecological method of protection against climate change, to combat desertification. Based on these findings, a number of recommendations can be made to future installations with photovoltaic energies regarding the necessary steps that should be made in an attempt to implement these improvements:
  • Determine the type of crop, as well as its associated area to obtain its water demands.
  • Identify the water resources and balance the needs of water resources.
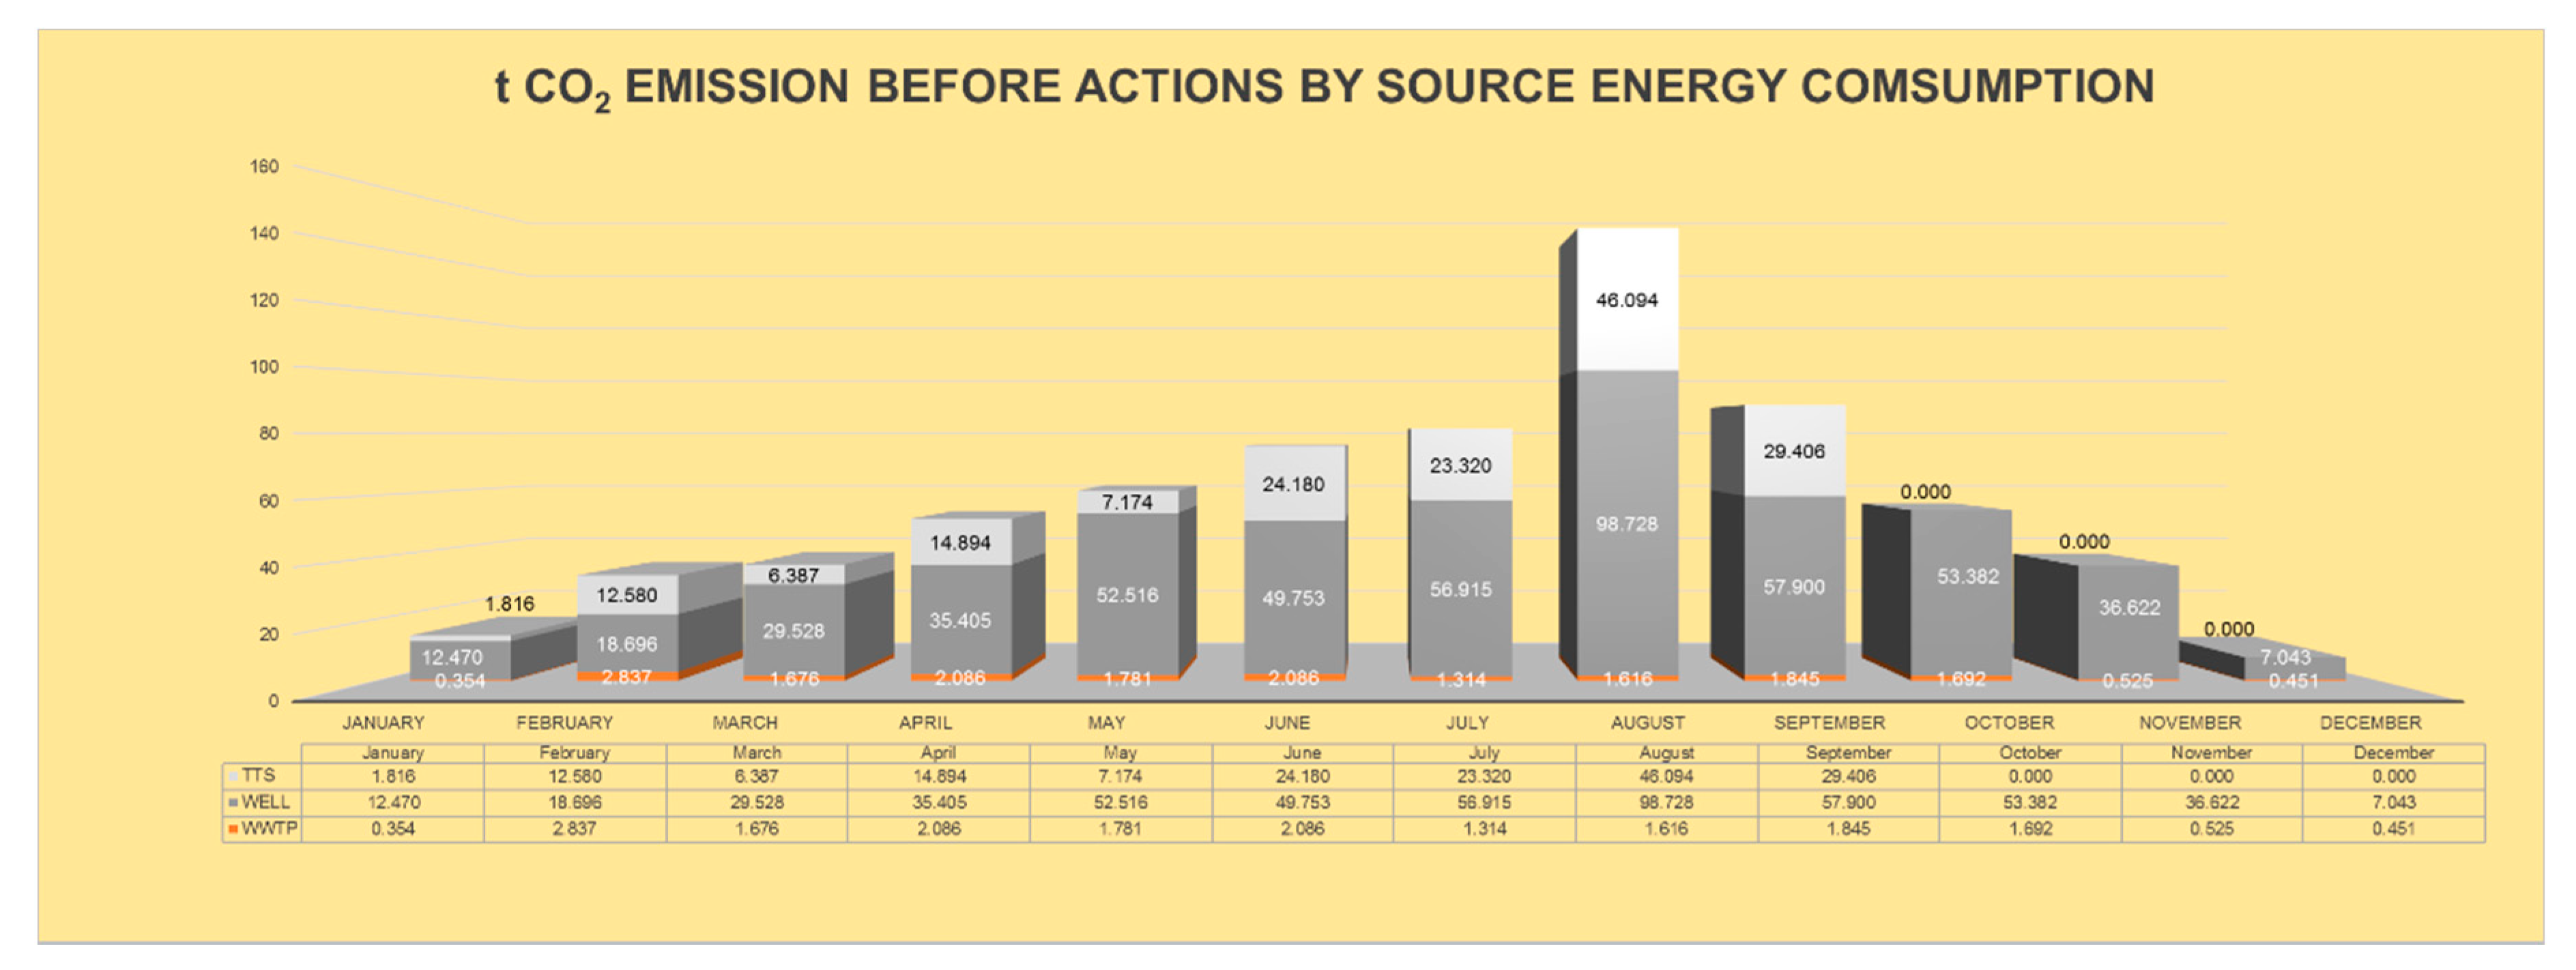
  • Determine the energy needs, at critical points (calculating the CO2 emitted).
  • Select the points of greatest energy demand and calculate the area necessary to implement the solar field.
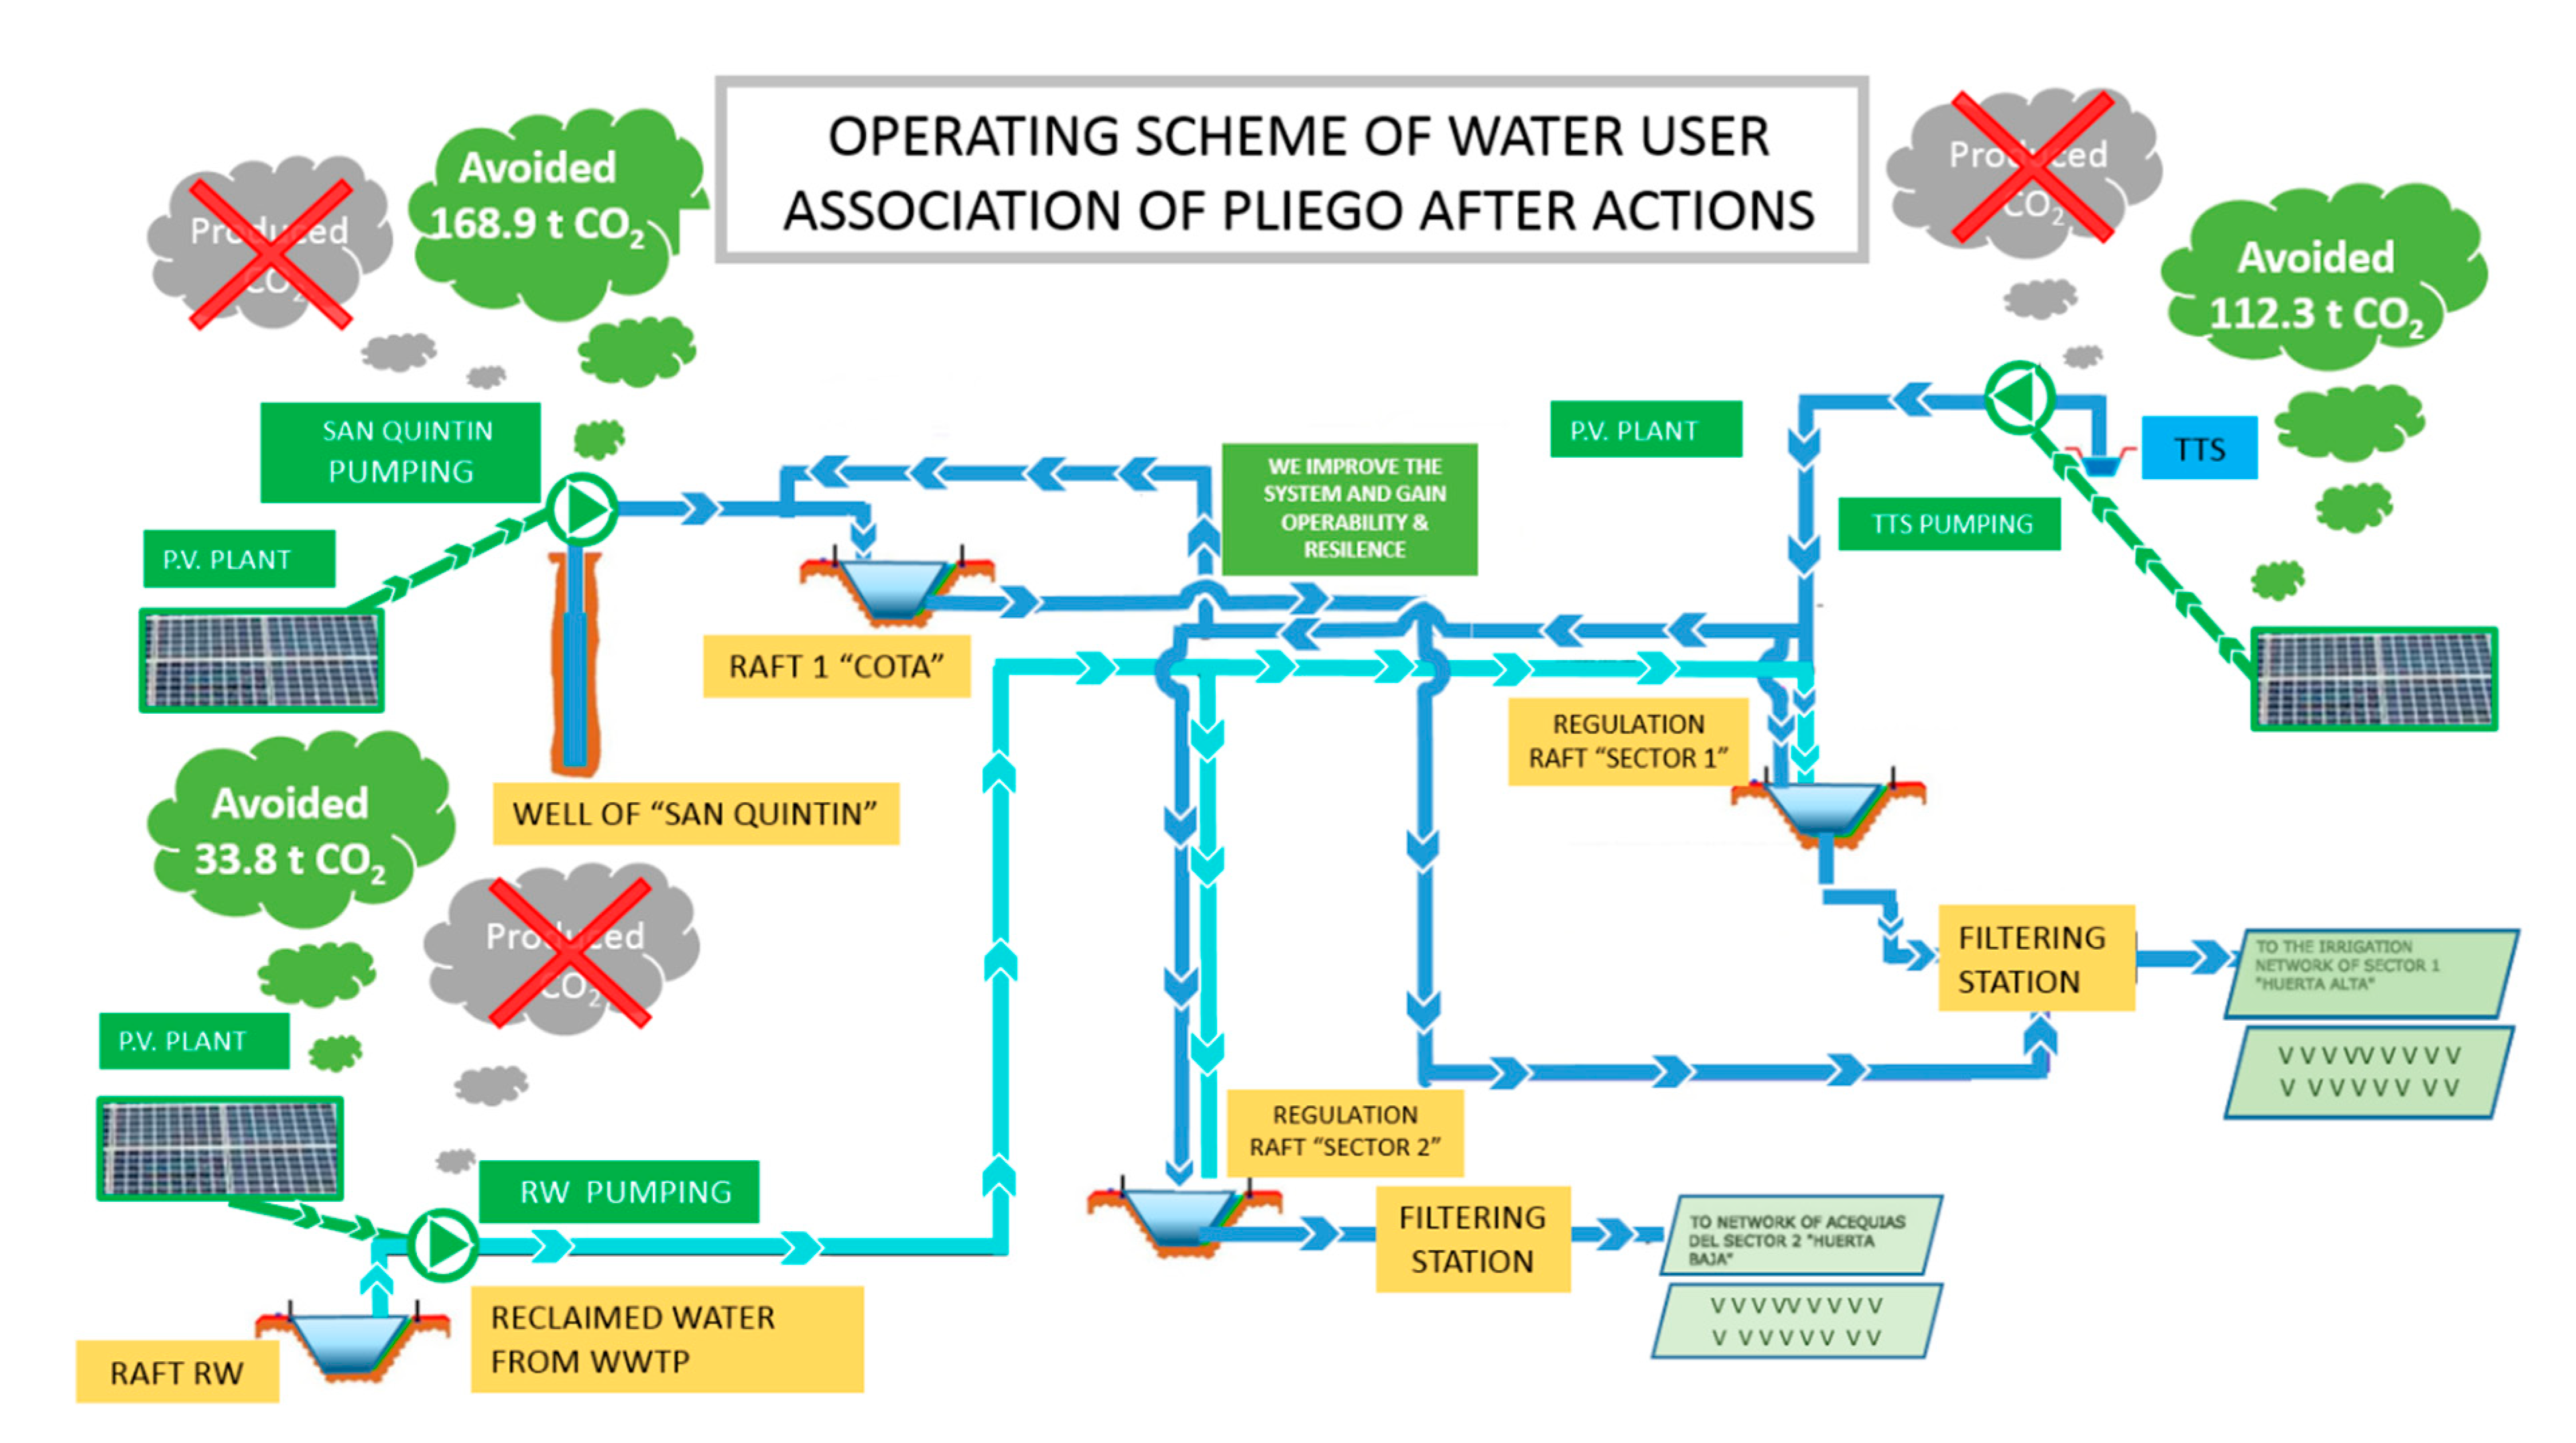
  • Determine the graph for its implementation and calculate the avoided CO2.
  • Implementation of an irrigation management system in the plots to adapt the production of photovoltaic energy to its consumption.
  • In extreme cases, some farmland must be conditioned, leaving land fallow, in order to achieve a sustainable energy system.
This process can be applied to any association of farmers or users from any country in the Mediterranean area, in regions with climatic characteristics similar to the study area, with a shortage of rains and great heatstroke. Thus, primary production methods, such as agriculture, must be integrated into technological development, serving as an example of development for other semi-arid regions that require accessible solutions. Furthermore, this may reduce the need to import energy from other countries, providing new opportunities for sustainable growth through the use of renewable energies such as photovoltaic energy (total reduction of 371.67 t CO2 avoided, once the entire photovoltaic energy produced has been harnessed).
This is one of the many steps taken by this community of irrigators in the region of Murcia, Southeast of Spain, in order to manage the natural resources available [27]. Thus, by evaluating the supply chain from its origins considering this as a fundamental aspect of the life-cycle assessment (LCA), aided by Smart-Agri technologies applied, along with the sensorization and inclusion of these databases generated with telemeasures and uploaded to the cloud, this information can be integrated into the Ecoinvent LCA database [28], helping to support farmers applying for environmental certificates for their products.

Author Contributions

Conceptualization, J.C.-Z. and F.-J.P.d.l.C.; methodology, D.P.-B.; software, J.C.-Z.; validation, D.P.-B., A.R.C. and J.M.M.-M.; formal analysis, J.C.-Z.; investigation, J.C.-Z.; resources, J.C.-Z. and D.P.-B.; writing-original draft preparation, J.C.-Z.; writing-review and editing, D.P.-B. and J.M.M.-M.; visualization, D.P.-B.; supervision, J.M.M.-M.; project administration, J.M.M.-M., A.R.-C.; funding acquisition, J.C.-Z. All authors have read and agree to the published version of the manuscript.

Funding

ALICE Project “Accelerate lnnovation in urban wastewater management for Climate changE”-Proposal Number: 734560, financed by European Commission, Grant of Horizon2020 under the specific programme Marie Sklodowska Curie Actions -RISE-.

Acknowledgments

Our gratitude the Region of Murcia, the participating Water User’s Association of Pliego, and especially to Miguel Angel del Amor Saavedra, and Antonio Rabadán Mínguez.

Conflicts of Interest

The authors declare no conflict of interest.

Abbreviations

WUAWater user’s association
WWTPWastewater treatment plant
TSTTajo-Segura transfer
EdAverage daily electricity production from the given system (kWh)
EmAverage monthly electricity production from the given system (kWh)
SDGsSustainable Development Goals
LCALife-cycle assessment
GHGGreenhouse gas emissions
HmAverage sum of global irradiation per square meter received by the modules of the given system (kWh/m2)
PVGISPhotovoltaic Geographical Information System
CM SAF Satellite Application Facility on Climate Monitoring
IRRInternal rate of return

References

  1. Jiménez-Bello, M.A.; Martínez Alzamora, F.; Bou Soler, V.; Bartolí Ayala, H. Methodology for grouping intakes of pressurised irrigation networks into sectors to minimise energy consumption. Biosyst. Eng. 2010, 105, 429–438. [Google Scholar] [CrossRef]
  2. Rodríguez Díaz, J.; Pérez Urrestarazu, L.; Camacho Poyato, E.C.; Montesinos Barrios, M.P. The paradox of irrigation scheme modernization: More efficient water use linked to higher energy demand. Span. J. Agric. Res. 2011, 9, 1000–1008. [Google Scholar] [CrossRef] [Green Version]
  3. Tarjuelo, J.M.; Rodriguez-Diaz, J.A.; Abadía, R.; Camacho, E.; Rocamora, C.; Moreno, M.A. Efficient water and energy use in irrigation modernization: Lessons from spanish case studies. J Agric. Water Manag. 2015, 162, 67–77. [Google Scholar] [CrossRef]
  4. United Nations World Water Assessment Programme (WWAP). The United Nations World Water Development Report 2014: Water and Energy; United Nations World Water Assessment Programme (WWAP): Paris, France, 2014. [Google Scholar]
  5. Amanatidis, G. European Policies on Climate and Energy Towards 2020, 2030 and 2050; Policy Department for Economic, Scientific and Quality of Life Policies. European Parliament: Brussels, Belgium, 2019. [Google Scholar]
  6. Balafoutis, A.; Beck, B.; Fountas, S.; Vangeyte, J.; Wal, T.V.d.; Soto, I.; Gómez-Barbero, M.; Barnes, A.; Eory, V. Precision agriculture technologies positively contributing to ghg emissions mitigation, farm productivity and economics. Sustainability 2017, 9, 1339. [Google Scholar] [CrossRef] [Green Version]
  7. Woodbury, P.B. Agriculture can mitigate climate change at low cost to help meet paris climate agreement goals. BioScience 2018, 68, 485–486. [Google Scholar] [CrossRef]
  8. Hillerbrand, R. Why affordable clean energy is not enough. A capability perspective on the sustainable development goals. Sustainability 2018, 10, 2485. [Google Scholar] [CrossRef] [Green Version]
  9. Mérida García, A.; Fernández García, I.; Camacho Poyato, E.; Montesinos Barrios, P.; Rodríguez Díaz, J. Coupling irrigation scheduling with solar energy production in a smart irrigation management system. J. Clean. Prod. 2018, 175, 670–682. [Google Scholar] [CrossRef]
  10. Da Silva, I.; Ronoh, G.; Maranga, I.; Odhiambo, M.; Kiyegga, R. Implementing the sdg 2, 6 and 7 nexus in kenya—A case study of solar powered water pumping for human consumption and irrigation. In International Business, Trade and Institutional Sustainability; Springer: Berlin/Heidelberg, Germany, 2020; pp. 933–942. [Google Scholar]
  11. Pijoan, J.; Fornells, N.P. Reutilización del agua depurada para usos agrícolas en diferentes estaciones depuradoras de aguas residuales de cataluña. Tecnol. Del Agua 2008, 28, 76–81. [Google Scholar]
  12. Globalwind (Herramienta de Análisis del Potencial Eólico). Centro Nacional de Energías Renovables (Spain). Available online: http://www.globalwindmap.com/VisorCENER/mapviewer.jsf?width=1293&height=709 (accessed on 10 May 2020).
  13. Real Decreto 244/2019, de 5 de Abril, por el que se Regulan las Condiciones Administrativas, Técnicas y Económicas del Autoconsumo de Energía Eléctrica. (BOE nº 83, de 6 de Abril de 2019) Ministerio de la Presidencia, Relaciones con las Cortes y Memoria Democrática; Government of Spain: Madrid, Spain, 2019; pp. 35674–35719.
  14. Šúri, M.; Huld, T.A.; Dunlop, E.D.; Ossenbrink, H.A. Potential of solar electricity generation in the european union member states and candidate countries. Sol. Energy 2007, 81, 1295–1305. [Google Scholar] [CrossRef]
  15. Marion, B.; Anderberg, M.; Gray-Hamm, P. Recent Upgrades and Revisions to Pvwatts; NREL: Golden, CO, USA, 2006.
  16. Moro, A.; Lonza, L. Electricity carbon intensity in european member states: Impacts on ghg emissions of electric vehicles. Transp. Res. Part D Transp. Environ. 2018, 64, 5–14. [Google Scholar] [CrossRef] [PubMed]
  17. Huld, T.; Müller, R.; Gambardella, A. A new solar radiation database for estimating pv performance in europe and africa. Sol. Energy 2012, 86, 1803–1815. [Google Scholar] [CrossRef]
  18. Fernández García, I.; Creaco, E.; Rodríguez Díaz, J.; Montesinos, P.; Camacho Poyato, E.; Savic, D. Rehabilitating pressurized irrigation networks for an increased energy efficiency. Agric. Water Manag. 2016, 164 Pt 2, 212–222. [Google Scholar] [CrossRef]
  19. Molden, D.; Oweis, T.; Steduto, P.; Bindraban, P.; Hanjra, M.A.; Kijne, J. Improving agricultural water productivity: Between optimism and caution. Agric. Water Manag. 2010, 97, 528–535. [Google Scholar] [CrossRef]
  20. Reich, N.; Alsema, E.; Van Sark, W.; Turkenburg, W.; Sinke, W. Greenhouse gas emissions associated with photovoltaic electricity from crystalline silicon modules under various energy supply options. Prog. Photovolt. Res. Appl. 2011, 19, 603–613. [Google Scholar] [CrossRef]
  21. Nugent, D.; Sovacool, B.K. Assessing the lifecycle greenhouse gas emissions from solar pv and wind energy: A critical meta-survey. Energy Policy 2014, 65, 229–244. [Google Scholar] [CrossRef]
  22. Murcia y el agua: Historia de una pasión. Asamblea Regional de Murcia (spain). Available online: https://www.asambleamurcia.es/divulgacion/murcia-y-el-agua-historia-de-una-pasion (accessed on 11 May 2020).
  23. Agricultura, Silvicultura, Ganadería y Pesca (Anuario Estadístico de España 2019). Instituto Nacional de Estadística (ine). Spain. Available online: https://www.ine.es/prodyser/pubweb/anuario19/anu19_12agric.pdf (accessed on 10 May 2020).
  24. Rodríguez Juan, J.E.; Romero Díaz, A. Evolution of land abandonment in the eastern region of murcia. Boletín De La Asoc. De Geógrafos Españoles 2016, 71, 9–29. [Google Scholar]
  25. Urbanik, M.; Tchórzewska-Cieślak, B.; Pietrucha-Urbanik, K. Analysis of the safety of functioning gas pipelines in terms of the occurrence of failures. Energies 2019, 12, 3228. [Google Scholar] [CrossRef] [Green Version]
  26. Martini, A.; Troncossi, M.; Rivola, A. Automatic leak detection in buried plastic pipes of water supply networks by means of vibration measurements. Shock Vib. 2015, 2015, 165304. [Google Scholar] [CrossRef] [Green Version]
  27. Natural Resource Management. Encyclopædia Britannica. Available online: https://www.britannica.com/topic/natural-resource-management (accessed on 12 May 2020).
  28. Brock, P.M.; Tan, D.K.Y. A second-take on the role of science: The case for applying public administration theory to natural resource management. Sustain. Earth 2020, 3, 1. [Google Scholar] [CrossRef] [Green Version]
Figure 1. Irrigated area of the study zone of the water user’s association (WUA). (Source: Segura’s Hydrographic Confederation).
Energies 13 02848 g001
Figure 2. Percentage of water volume needed to cover the demand, according to the water supply source.
Energies 13 02848 g002
Figure 3. Current operating scheme of WUA.
Energies 13 02848 g003
Figure 4. Financial expenses of the well. 2016.
Energies 13 02848 g004
Figure 5. TST Financial expense. 2016.
Energies 13 02848 g005
Figure 6. WWTP financial expense. 2016.
Energies 13 02848 g006
Figure 7. Total financial expense. 2016.
Energies 13 02848 g007
Figure 8. Energy consumed by the conventional electrical system and energy produced by the new photovoltaic system (water well).
Energies 13 02848 g008
Figure 9. Comparative kWh cost of network versus cost of kWh generated by photovoltaic solar installation. Water well.
Energies 13 02848 g009
Figure 10. CO2 emissions released into the atmosphere. 2016.
Energies 13 02848 g010
Figure 11. New WUA operating scheme.
Energies 13 02848 g011
Figure 12. CO2 emission in tons avoided by the production of photovoltaic energy.
Energies 13 02848 g012
Figure 13. Photovoltaic installation.
Energies 13 02848 g013
Figure 14. Operative scheme of WUA of Pliego before actions.
Energies 13 02848 g014
Figure 15. New operational scheme of WUA of Pliego.
Energies 13 02848 g015
Table 1. Total volume supply of the available resources.
ExplotationCapital FlowsAnnual Appropriation (m3)Regulating Rafts
(m3)
Daily Flow (L/s)Flow (m3/h)
Well953422,326,15845,000
Tajo-Segura Transfer30010801,140,000230,000
Wastewater treatment plant40144163,20339,464
TOTAL 3,629,361
Table 2. Details of the elevation pumps and adopted improvements.
Manometric Eight (m.c.a)Q (L/s)Current PumpFuture Pump
Power (kW)Performance (%)Power (kW)Performance (%)
WWTP11540745663.6470
TST105126.731556237.2870
Well2509029548.47232.970.52
Table 3. Optimization details of the solar panels according to their position, inclination and orientation.
Fixed System (Optimized): Inclination = 34°, Orientation = 0°
MonthEdEmHdHm
January1170.0036,3004.27132
February1360.0038,2005.01140
March1610.0050,0006.10189
April1590.0047,6006.10183
May1660.0051,5006.49201
June1770.0053,0007.00210
July1810.0056,1007.28226
August1720.0053,3006.91214
September1520.0045,5005.96179
October1380.0042,7005.31165
November1200.0036,0004.45133
December1060.0033,0003.89120
Yearly average149045,3005.74174
Total for year543,0002090
Ed: Average daily electricity production from the given system (kWh); Em: Average monthly electricity production from the given system (kWh); Hd: Average daily sum of global irradiation per square meter received by the modules of the given system (kWh/m2); Hm: Average sum of global irradiation per square meter received by the modules of the given system (kWh/m2).
Table 4. Summary of the main data of the photovoltaic installation for the well.
Solar Radiation Database Used: PVGIS - CM SAF
Location38°2′22″ North, 1°29′31″ West
Elevation310 m a.s.l.
Peak power of the photovoltaic (PV) system350 kWp
Estimated losses due to temperature and low irradiance11.2% (using local ambient temperature)
Estimated loss due to angular reflectance effects2.6%
Other losses (cables, inverter, etc.)14.0%
Combined PV system losses25.6%
Budget630,000 €
PVGIS (Photovoltaic Geographical Information System), CM SAF (Satellite Application Facility on Climate Monitoring).
Table 5. Summary procedure for calculating the 31-year internal rate of return (IRR).
Well Photovoltaic Solar Economic Framework
YearElectrical Consumption without Photovoltaic Energy (Kwh)Production with Photovoltaic Energy (Kwh)Cumulated Photovoltaic Production (Kwh)Spending on Electricity in Pumping Well without Photovoltaic Installation without VAT (€)Expenditure Fuel Oil (Generator) with Photovoltaic Installation without VAT (€)Cost of Accumulated Kwh without Photovoltaic (€/Kwh)Maintenance Expenses (€)Total Expenses (€)Accumulated Total Expenses (€)Cost of Accumulated Kwh with Photovoltaic (€/Kwh)
1522,200.00543,200.00543,200.0031,793.460.000.061600.0630.600,0630,600.001.161
2522,200.00538,854.401,082,054.4034,019.000.000.065630.0630.0631,230.000.583
3522,200.00534,543.561,616,597.9636,400.330.000.070661.5661.5631,891.500.391
4522,200.00530,267.212,146,865.1738,948.350.000.075694.6694.6632,586.100.295
5522,200.00526,025.072,672,890.2441,674.730.000.080729.3729.3633,315.400.237
6522,200.00521,816.873,194,707.1144,591.960.000.085765.8765.8634,081.200.198
7522,200.00517,642.343,712,349.4547,713.400.000.091804.1804.1634,885.300.171
8522,200.00513,501.204,225,850.6551,053.340.000.098844.3844.3635,729.600.150
9522,200.00509,393.194,735,243.8454,627.070.000.1058886.58886.5644,616.100.136
10522,200.00505,318.045,240,561.8858,450.960.000.1121330.81330.8645,946.900.123
11522,200.00501,275.505,741,837.3862,542.530.000.1201397.31397.3647,344.200.113
12522,200.00497,265.306,239,102.6866,920.510.000.1281467.21467.2648,811.400.104
13522,200.00493,287.186,732,389.8671,604.950.000.1371540.61540.6650,352.000.097
14522,200.00489,340.887,221,730.7476,617.300.000.1471617.61617.6651,969.600.090
15522,200.00485,426.157,707,156.8981,980.510.000.1571698.51698.5653,668.100.085
16522,200.00481,542.748,188,699.6387,719.150.000.1681783.41783.4655,451.500.080
17522,200.00477,690.408,666,390.0393,859.490.000.1801872.61872.6657,324.100.076
18522,200.00473,868.889,140,258.91100,429.650.000.1921966.21966.2659,290.300.072
19522,200.00470,077.939,610,336.84107,459.730.000.2062064.52064.5661,354.800.069
20522,200.00466,317.3110,076,654.15114,981.910.000,2202167.72167.7663,522.500.066
21522,200.00462,586.7710,539,240.92123,030.640.000.2362276.12276.1665,798.600.063
22522,200.00458,886.0810,998,127.00131,642.780.000.2522389.92389.9668,188.500.061
23522,200.00455,214.9911,453,341.99140,857.770.000.2702509.42509.4670,697.900.059
24522,200.00451,573.2711,904,915.26150,717.810.000.2892634.92634.9673,332.800.057
25522,200.00447,960.6812,352,875.94161,268.060.000.3092766.62766.6676,099.400.055
26522,200.00444,376.9912,797,252.93172,556.820.000.3302904.92904.9679,004.300.053
27522,200.00440,821.9713,238,074.90184,635.800.000.3543050.13050.1682,054.400.052
28522,200.00437,295.3913,675,370.29197,560.310.000.3783202.63202.6685,257.000.050
29522,200.00433,797.0314,109,167.32211,389.530.000.4053362.73362.7688,619.700.049
30522,200.00430,326.6514,539,493.97226,186.800.000.4333530.83530.8692,150.500.048
31522,200.00426,884.0414,966,378.01242,019.880.000.4633707.33707.3695,857.800.046
16,188,200.0014,966,37.01 3,245,254.530.00 65,857.80695,857.80
IRR (to 31 years)10.34%
Table 6. Summary of the photovoltaic solar installation of the pumping in the well.
Pumping Well—Photovoltaic Installation
Projected power232.9 kW
Annual generated energy543,200 kWh
Budget630,000 €
Total number of p 1.400 unities of 250 Wp, c/u
Regulators-Inverters350 kW
IRR (31 years)10.34%
Nº of years for profitability11
Table 7. Summary of the photovoltaic solar installation of the Tajo-Segura transfer pumping.
Pumping TST—Photovoltaic Installation
Projected power237.3 kW
Annual generated energy360,971 kWh
Budget630,000 €
Total number of p 1.400 unities of 250 Wp, c/u
Regulators-Inverters350 kW
IRR (31 years)8.31%
Nº of years for profitability10
Table 8. Summary of the photovoltaic solar installation of the pumping at wastewater treatment plant.
Pumping WWTP—Photovoltaic Installation
Projected power63.64 kW
Annual generated energy108,640 kWh
Budget126,000 €
Total number of p 280 unities of 250 Wp, c/u
Regulators-Inverters60 kW
IRR (31 years)11.99%
Nº of years for profitability7
Table 9. Summary of avoided carbon footprint by solar actions (t CO2).
Avoided Carbon Footprint by Solar Actions (t CO2)
PV kWh/yearg CO2/kWh t CO2
Photovoltaic installation pumping WWTP108,64031133.79
Photovoltaic installation pumping Well543,200311168.94
Photovoltaic installation pumping TST360,971311112.26
314.99 t CO2/year

