Article

Water-Energy Management for Demand Charges and Energy Cost Optimization of a Pumping Stations System under a Renewable Virtual Power Plant Model

Department of Electrical Engineering, University of Zaragoza, C/Maria de Luna 3, 50018 Zaragoza, Spain
*
Author to whom correspondence should be addressed.
Energies 2020, 13(11), 2900; https://doi.org/10.3390/en13112900
Submission received: 11 May 2020 / Revised: 27 May 2020 / Accepted: 4 June 2020 / Published: 5 June 2020
(This article belongs to the Special Issue Optimal Dispatch of Smart Grids)

Abstract

:
The effects of climate change seriously affect agriculture at different latitudes of the planet because periods of drought are intensifying and the availability of water for agricultural irrigation is reducing. In addition, the energy cost associated with pumping water has increased notably in recent years due to, among other reasons, the maximum demand charges that are applied annually according to the contracted demand in each facility. Therefore, very efficient management of both water resources and energy resources is required. This article proposes the integration of water-energy management in a virtual power plant (VPP) model for the optimization of energy costs and maximum demand charges. For the development of the model, a problem related to the optimal operation of electricity generation and demand resources arises, which is formulated as a nonlinear mixed-integer programming model (MINLP). The objective is to maximize the annual operating profit of the VPP. It is worth mentioning that the model is applied to a large irrigation system using real data on consumption and power generation, exclusively renewable. In addition, different scenarios are analyzed to evaluate the variability of the operating profit of the VPP with and without intraday demand management as well as the influence of the wholesale electricity market price on the model. In view of the results obtained, the model that integrates the management of the water-energy binomial increases the self-consumption of renewable energy and saves electricity supply costs.

1. Introduction

Since 1998, the Spanish electricity market has been liberalized, which means that both the generation of electricity and the purchase of energy by consumers are open to competition. Liberalization seeks to achieve greater efficiency in investments and operation of electrical systems and thus reduce costs and increase the quality and reliability of electricity supply. In this current legal framework of the electricity sector, all consumers, in addition to paying for the purchase of energy in the hourly production market, are obliged to pay some charges (network access fees) for the use of transportation and distribution, regulated by the Spanish government. This scheme of liberalization of the electricity sector is the same as that followed in all developed countries.
The access charges collect revenue to cover the costs of the regulated activities of transport and distribution of electricity and revenue for other regulated costs of the electricity system. The access tariffs are divided into two terms: an annual charge for the contracted demand (€/kW) and an hourly charge for the energy consumed (€/kWh).
In the agricultural irrigation sector, energy costs are a serious problem for the economic sustainability of farms that require electricity to propel water to the fields. In addition, in some regions, the electricity consumption of the irrigation communities has a very seasonal profile, since irrigation occurs mainly during five months of the year, around the summer. However, the legislation requires that the contracting of electric power be maintained for a period of twelve months, without the option of reducing it in the months of lower consumption, which causes a considerable increase in this fixed cost until reaching 40% of the final price of electricity.
In recent years, irrigation communities have developed strategies to minimize energy costs, among others, by investing in electricity production facilities with renewable sources, thus contributing to the reduction of the environmental impact of the energy consumed. On the other hand, the availability of water supply is not always guaranteed as it depends on changing climatic factors. Rainfall is irregularly distributed over the years, so the water reserves available in the reservoirs do not always satisfy all needs. Therefore, efficient management of water and energy resources is essential to achieve sustainable irrigated agriculture. In this context, where it is necessary to supply electricity for the water pumping stations but also have their own power generation facilities, the virtual power plant model is a good tool for the optimal integrated management of all available resources.
According to Reference [1], the concept of a virtual power plant (VPP) combines different small-sized distributed generation units that operate as a single conventional power plant in the electricity market, responding in the same way to the competencies of the individual operation. For the active control of VPPs, the massive introduction of ICT technologies, with smart meters, wireless connections, and control centers, among others, is fundamental [2]. The VPP allows the joint management and optimization of energy consumption and generation, in addition to reducing possible network interruptions and improving operational decision-making. There are two categories of VPPs: technical virtual power plants (TVPPs) and commercial virtual power plants (CVPPs). On the one hand, TVPP provides support services to the management of the transmission system to ensure both the voltage and frequency levels of the system and the quality of the electricity supply. On the other hand, CVPP optimizes the generation of distributed energy and the consumption of demand response sources. In addition, it has the ability to participate in the wholesale electricity markets of purchase and sale of energy in real time [3]. The CVPP model primarily seeks to maximize VPP income and minimize its operating cost. Thus, this type of VPP determines the optimal hourly energy generation and the optimal bidding strategy in different electricity markets. It is important to point out that the influence of the power distribution network is not taken into account for CVPP modeling [4,5].
The integration of renewable energy sources into the distribution network is a great challenge for the operation of the electrical system. Nowadays, countries are focused on achieving energy independence and security of electricity supply, as well as competitiveness and technological development. References [6,7] study the types of VPPs, communication technologies, and reliability in solving the optimal VPP management problem. In Reference [8], the main benefits and challenges of the implementation of smart grid technology are analyzed from the point of view of demand management, distributed generation, or measurement and communication systems. Similarly, in Reference [9], the challenges of the implementation of VPP technology in the electrical system are described, as well as the projects that have been carried out of VPPs. From a technical point of view, the widespread applicability of VPPs presents challenges in the management and communication among the components, since it is required for the development of ICT infrastructures and real-time monitoring systems for the optimal control of distributed energy resources. On the other hand, from an economic point of view, market mechanisms should be promoted to facilitate flexibility and the introduction of distributed energy resources to electricity markets, which may favor the implementation of VPPs in the most immediate future [10,11]. References [12,13] evaluate the impact of different sources of distributed generation on the price of various electricity markets in Europe.
As a result of the intermittency of renewable energy, some articles [14,15] include pumped storage in the VPP model to obtain more flexible operation and maximize its operating profit. Thereby, the incorporation of storage systems into a VPP allows optimal management of energy resources and demand in addition to guaranteeing the security and reliability of the electrical system.
Many studies in the literature have as their main objective the maximization of the operating profit of VPPs through the use of various optimization methods. Within the mathematical optimization methods, mixed-integer linear programming stands out [16,17,18,19,20,21], nonlinear programming [22,23,24,25], point estimate method (PEM) [26], or quadratic programming [27]. In contrast, other authors propose heuristic methods to obtain the optimal management of VPP resources [28,29]. However, these methods increase the resolution time, in addition to sometimes obtaining local solutions instead of a globally optimal solution. On the other hand, several researchers consider at the same time the impact that electricity market prices may have on VPP for the resolution of this type of problem. In Reference [30], a probabilistic model for the management of electrical and thermal energy of a VPP that participates in the daily market and electricity reserve is presented, while work [31] uses a combination of stochastic and robust optimization to model the uncertainties. Other articles include long-term bilateral contracts for selling energy [32,33]. Reference [18] studies two risk management approaches to address the variability of profit due to electricity market price uncertainties, Conditional Value at Risk (CVaR), and Second-Order Stochastic Dominance Constraints (SSD), while the authors of Reference [26] use the Point Estimate Method. The studies [17,32] use the concept of CVaR to model and optimize risk in the wholesale market, describing the advantages of this method over others, such as its convexity, which facilitates the implementation of optimization algorithms. It is worth mentioning that other studies, such as References [19,34,35], include demand response programs that provide greater flexibility to the system in addition to more efficient use of resources.
From the point of view of the direct participation of the VPP in different electricity markets to maximize its profit, several works propose different methodologies to decide the optimal bidding strategy of the VPP and reduce prediction errors and, thus, avoid the costs of deviations. References [36,37,38], among others, use stochastic optimization methods, while studies such as Reference [39] use robust programming models. The authors in References [40,41] propose the combination of robust and stochastic optimization for the resolution of this type of VPP problem.
On the other hand, from the perspective of the applicability of VPP models to real cases, articles [42,43] propose economic studies of VPPs in the German electricity market through an analysis based on scenarios and models. Recently, the authors of Reference [21] developed an optimal technical-economic dispatch model for a VPP that participates in the wholesale electricity market. The model is applied to a large irrigation system in Aragon (Spain) with electricity generation and demand of 200 GWh per year.
In conclusion, previous studies do not include demand costs in the formulation of the VPP model. In addition, no real cases of VPP have been found that analyze the management of water and energy resources together. Our study focuses mainly on these gaps in the literature.
As a consequence of the increase in energy costs and problems of water availability, the main objective of this article is the integration of the management of the water-energy binomial under the approach of a virtual power plant model by optimizing the costs of power and energy. This approach belongs to the CVPP type of virtual power plant. The proposed model is a mixed-integer nonlinear programming model (MINLP) that aims us to maximize the annual operating profit of a VPP that participates in the wholesale electricity market through optimal planning of the annual contracted electricity demand and hourly power generation resources. Additionally, as a result, the optimal hourly schedule for the operation of the pumping stations will be obtained.
The rest of the article is divided as follows: Section 2 describes the problem and next, Section 3 presents the proposed mathematical model. Section 4 analyzes the results obtained, and subsequently, Section 5 evaluates the influence of the electricity market price on the model. Finally, Section 6 summarizes the main conclusions drawn from this research.

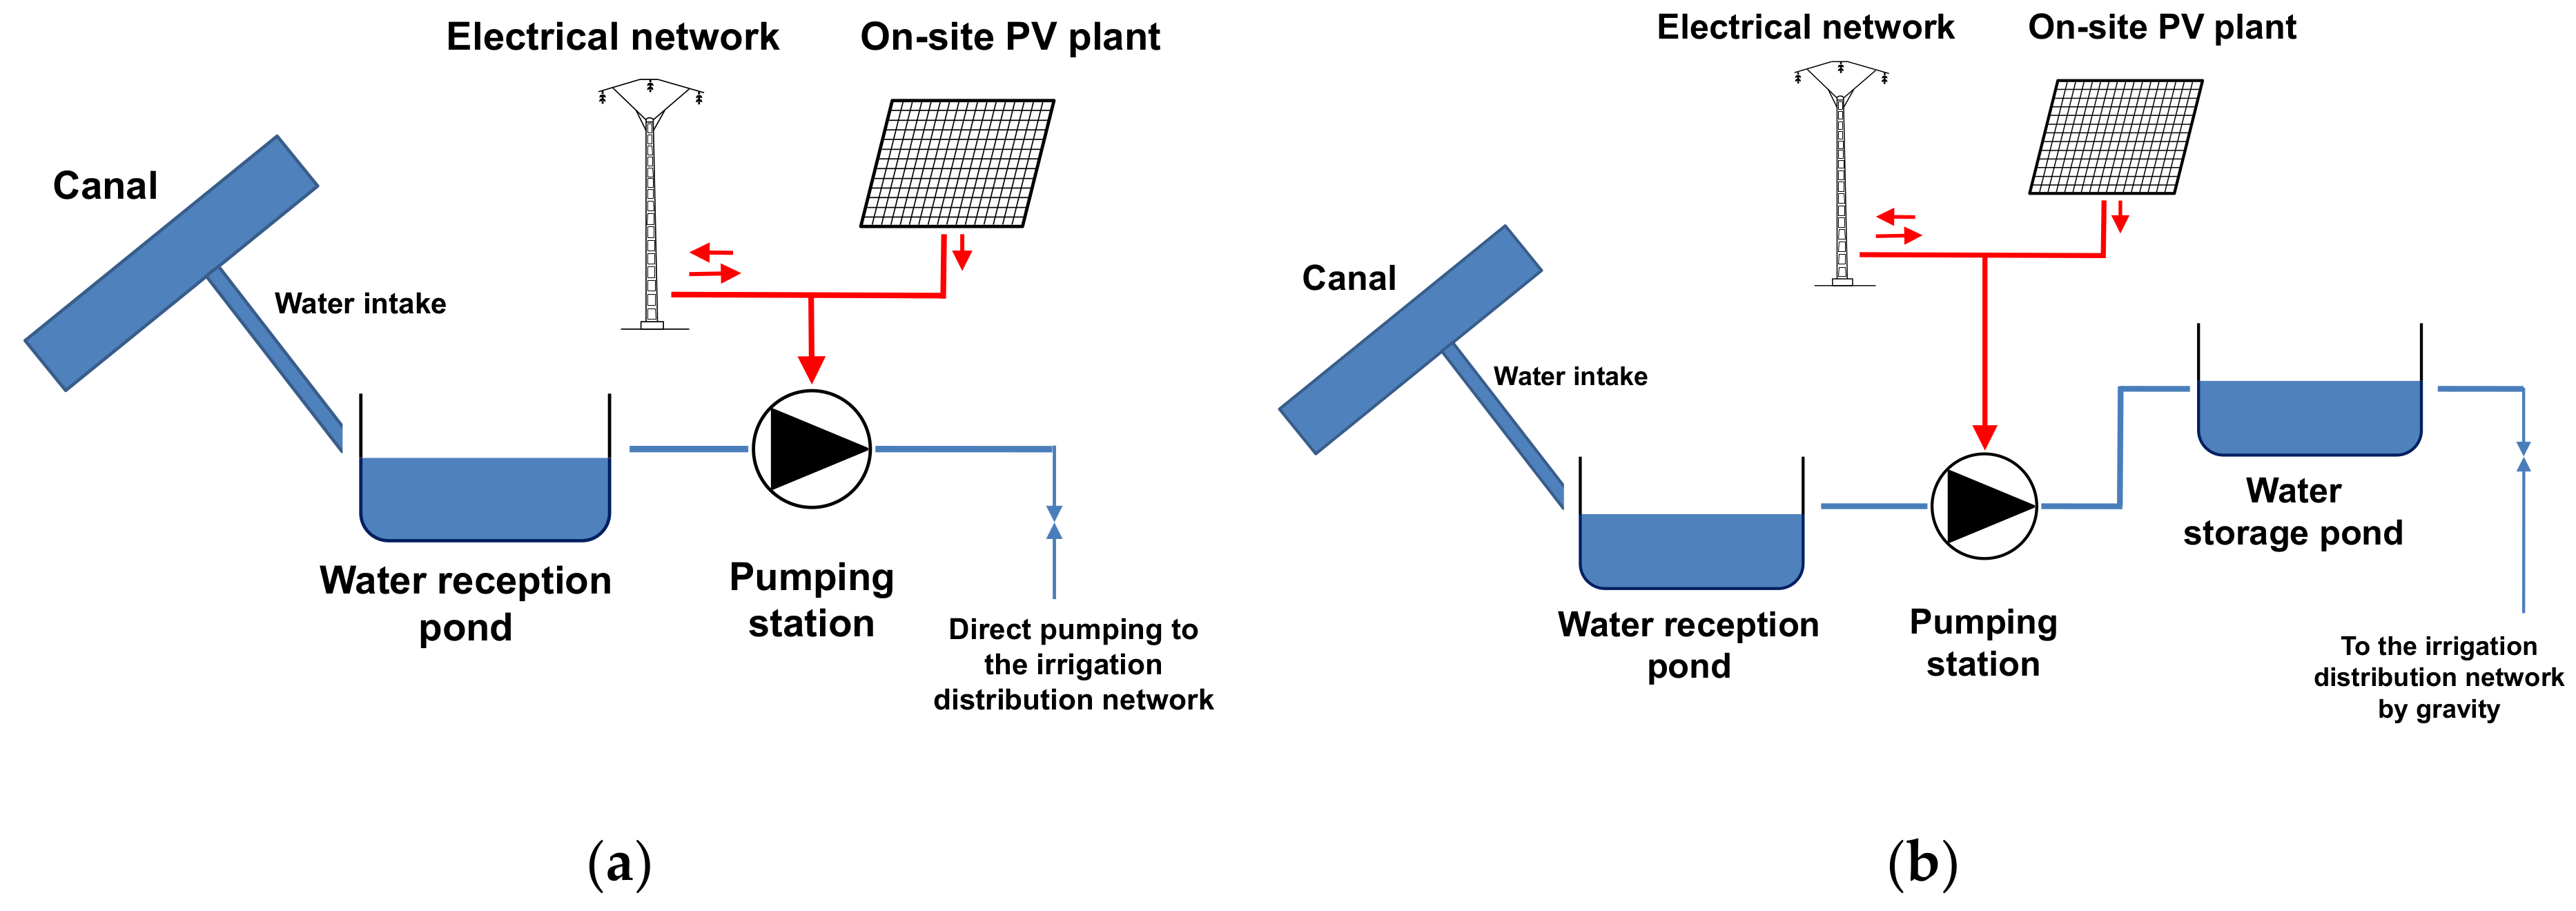
2. Problem Statement

The high energy cost together with the uncertainty about the availability of water resources to meet the demand creates a risk to the economic viability of the water supply and distribution facilities for irrigation since energy has become the main cost factor of m3 of water for farmers in many regions. In this context, the efficient joint management of energy and water in agricultural operations is essential to minimize energy costs.
In relation to water management, during the irrigation campaign, the irrigation communities request the necessary flow for each day. The existence of internal regulation ponds is essential to adapt to the availability of the resource and the water demand over time.
Irrigation communities follow different pumping strategies. On the one hand, there are pumping stations that collect water from canals at one or more points, temporarily storing it in reception ponds for gravity irrigation or by direct pumping. Other communities, however, have a water storage pond, which allows for temporarily storing a quantity of water that satisfies the irrigation in the following days. In this case, the water is taken from the regulation canals to a water reception pond, and from there, the water is raised by means of a pumping station to the water storage pond. From the water storage pond, the water is distributed by gravity to the different irrigated areas (see Figure 1).
The real study system consists of 27 pumping stations connected to the electricity distribution network, with a high-voltage access tariff of six periods. The hourly demand for electricity is manageable in 10 of the pumping stations, since they have storage for the efficient management of water in a water storage pond, while for the rest of the pumping stations the hourly demand for electricity is known (direct pumping). We refer to the first 10 pumping stations as manageable, since they are able to schedule the water pumping during the hours of a day while satisfying the daily irrigation needs (see Figure 1b), whereas the other 17 pumping stations are considered unmanageable as they must meet the required water demand for irrigation each hour (see Figure 1a). It should be noted that the 27 pumping stations act as a single entity that participates in the OMIE electricity market, allowing the contracting of a single maximum power in each pricing period.
On the other hand, from the point of view of power generation, the study system consists of a wind farm and six hydroelectric plants that evacuate their production to the region’s electricity grids and 27 self-consumption photovoltaic plants located next to the pumping stations. First, these self-consumption photovoltaic plants should meet the local demand of each pumping station. Subsequently, in the case of excess generation, PV plants will export the rest of the energy produced to the distribution network. Figure 2 shows the energy flow of the proposed VPP model. Each subsystem (B) consists of a pumping station connected both to the grid and to a self-consumption PV plant. On the other hand, the global system (A) receives the energy flow from the wind farm and hydroelectric plants, and also from the subsystems. The actual data of the study system are shown in Appendix A.
As introduced in Section 1, this work aims to develop a mathematical model to maximize the operating profit of a VPP for a whole year by optimizing the annual contracted demand of the hourly management of water consumption and electricity from the pumping stations and from the electricity production resources. The VPP participates in the OMIE wholesale electricity market for the purchase and sale of electricity in real time.

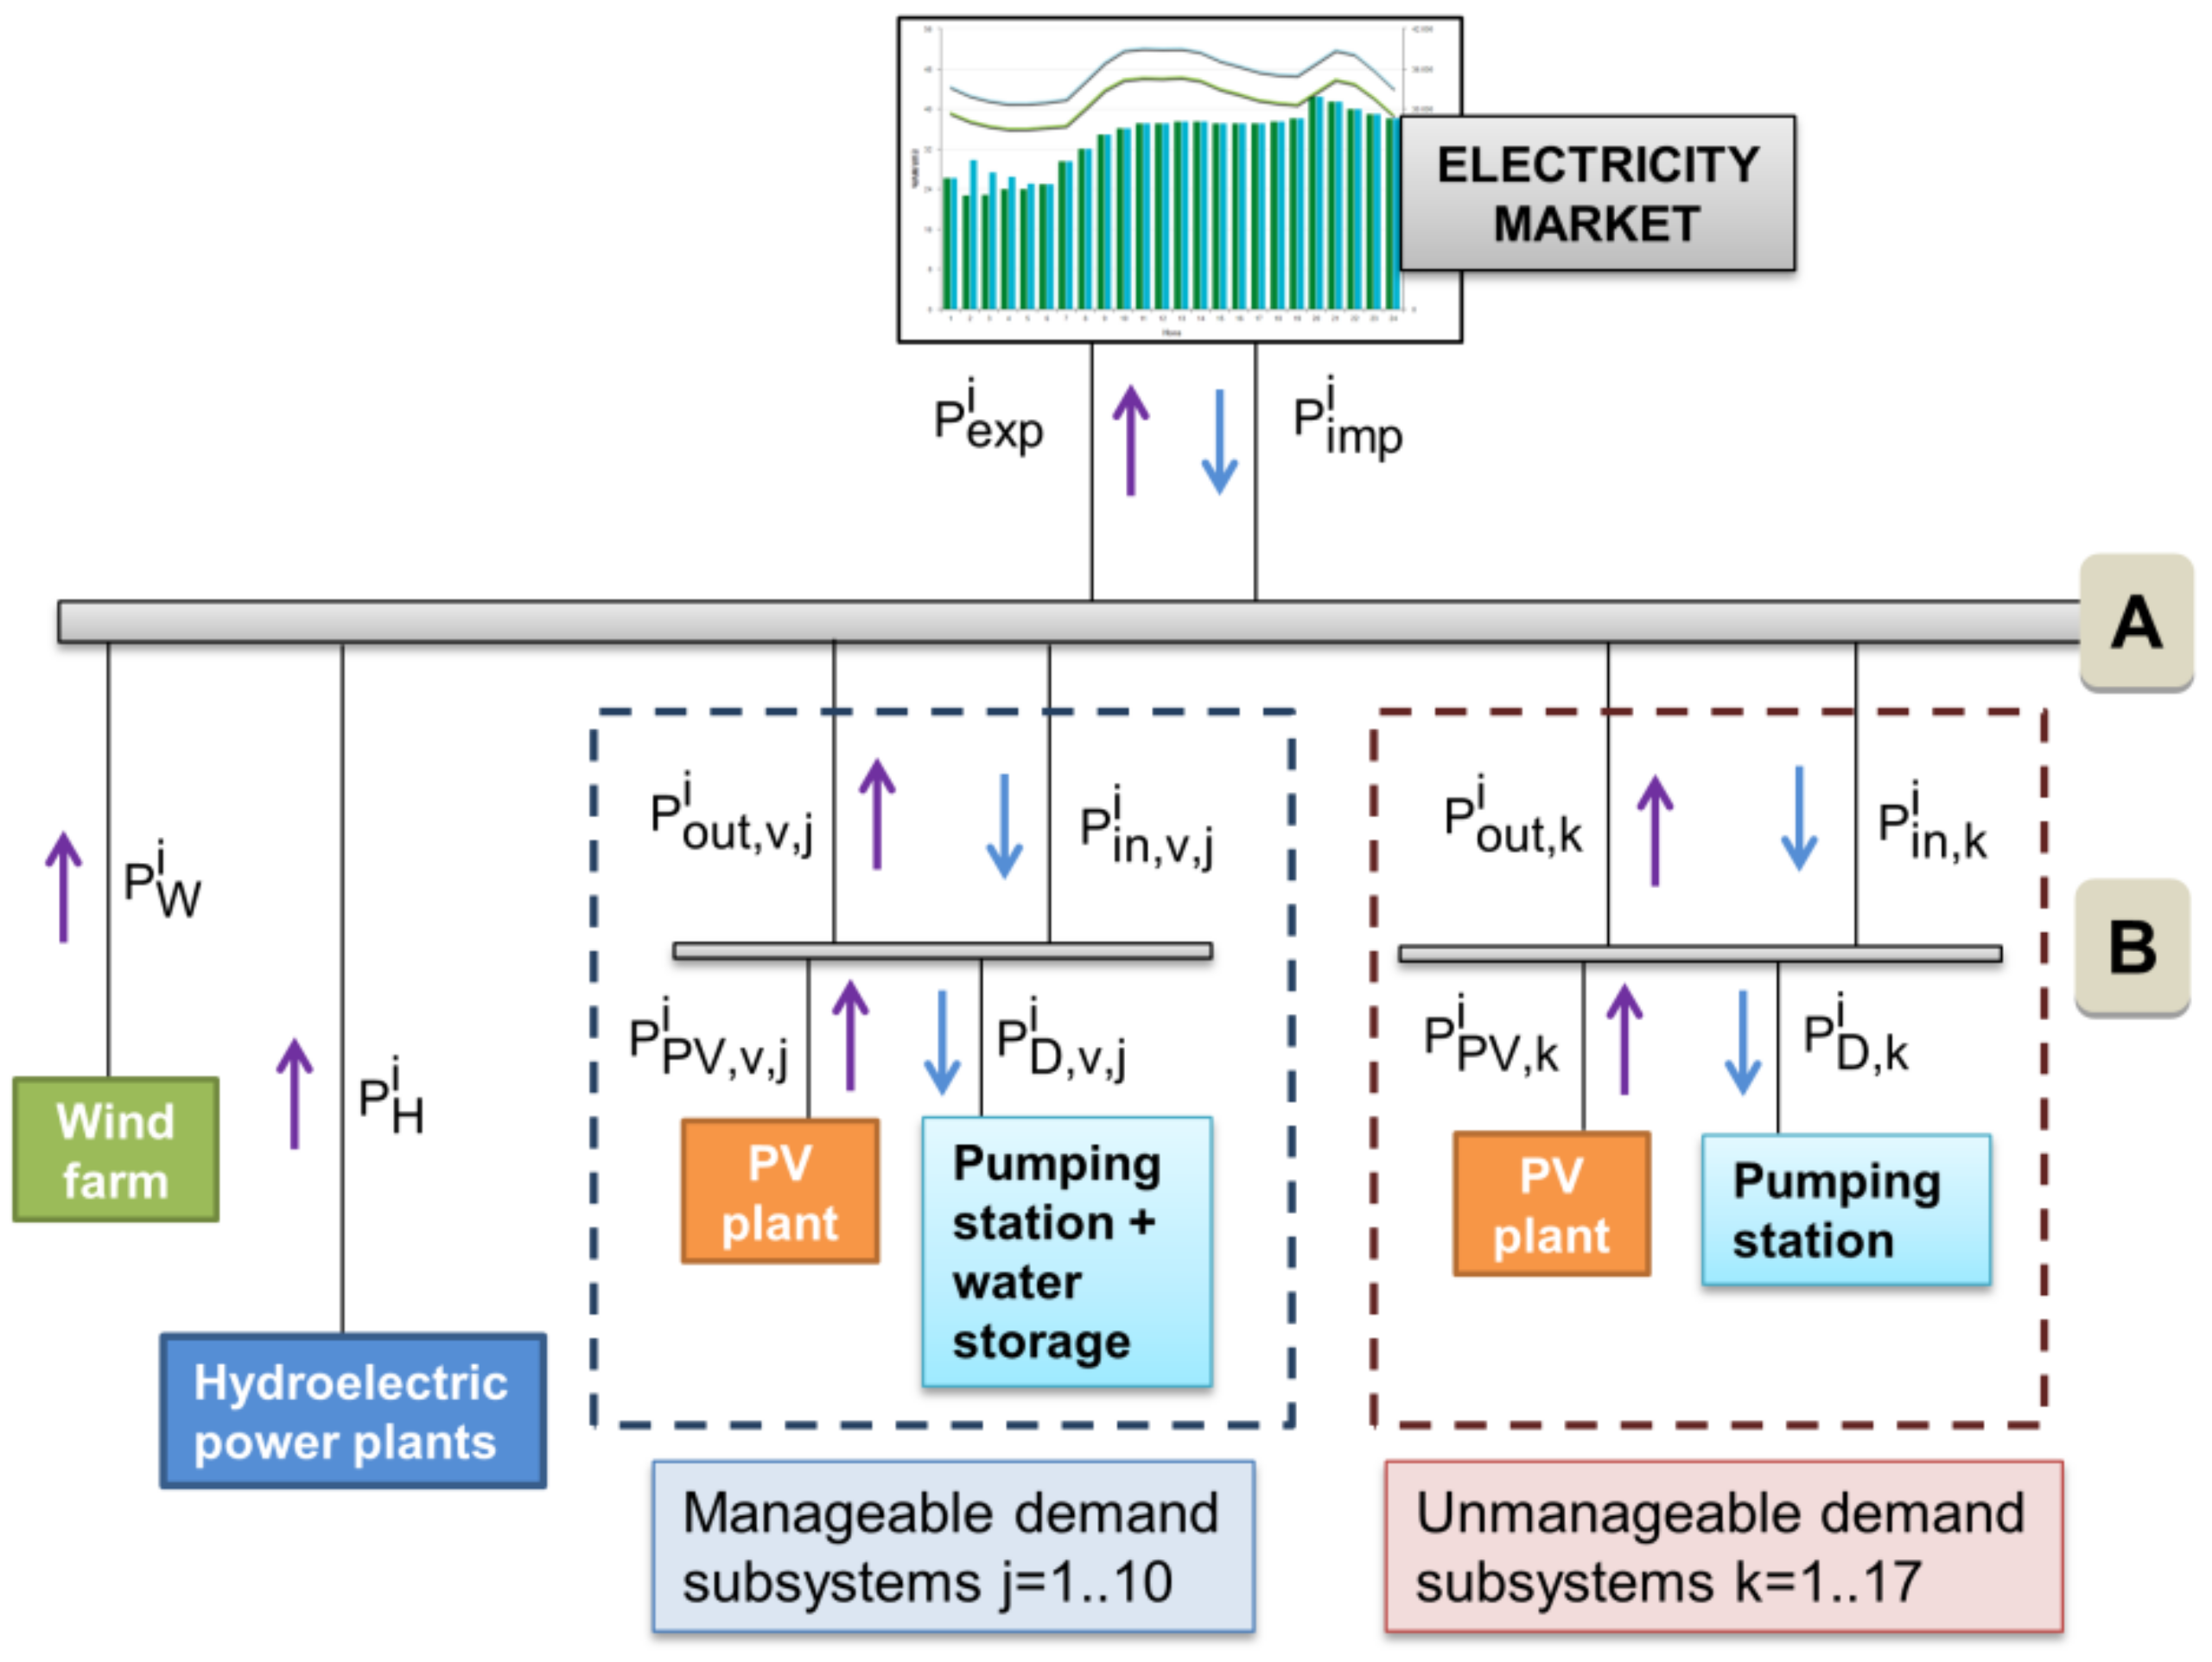
3. Mathematical Model

The optimization model is a problem with 80 continuous variables and 63 integers in each hour. The optimization model returns, in each hour, the optimal values of the binary integer variables for decision making in the problem:
  • import/export of energy from the global system ( I imp i / I exp i )
  • import/export of energy from each pumping station with self-consumption ( I in , k i , I in , v , j i / I out , k i , I out , v , j i )
  • excess power ( I exc i )
    The model also returns, in each hour, the optimal hourly values of:
  • production of electricity from its own sources with renewable energy: hydroelectric, wind, photovoltaic ( P W i ,   P H i ,   P PV , k i ,   P PV , v , j i )
  • energy imported/exported from the global system ( P imp i / P exp i ) and subsystems ( P in , k i , P in , v , j i / P out , k i , P out , v , j i )
  • hourly electricity demand in each pumping station with water storage ( P D , v , j i )
In addition, the annual optimal values of the contracted demand are obtained in each pricing period ( P c , p ).
As highlighted in Section 1, an important novelty of this work is the integration of water management with energy, as well as the optimization of the annual contracted demand to minimize energy costs. In this way, a more complete and realistic exploitation model is offered for the study system.
Next, the terms that make up the objective function and the constraints that the variables of the problem must meet are presented.
  • Objective function
The calculation of the optimization of the operating profit of the VPP is performed by formulating an objective function composed of the difference between income and costs of the study system (Equation (6)).
On the one hand, the objective function expresses the costs of producing electricity from renewable sources:
f W · P W , z i f H · P H , z i f PV · k = 1 17 P out , k , z i f PV · j = 1 10 P out , v , j , z i
In addition, the acquisition of energy is also allowed ( P imp , z i ) at the hourly price of the wholesale electricity market ( ρ imp , z i ) when there is no energy available in the system to meet the demand or if it is more economically profitable:
ρ imp , z i · P imp , z i .
On the other hand, the objective function also includes the costs of contracted demand in each pricing period, which are obtained as a product of the price of the power term of the access tariff f power , p (Table 1) by the annual contracted demand in each period ( P c , p ).
f power , p · P c , p
Finally, the charges for excess demand are added, as indicated in Spanish legislation [44].
p = 1 6 K p · K ex · i = 1 n 4 · exc r , p i 2
The imputed cost using the formula of Equation (4) occurs only when the net power demand at the evacuation point of the pumping stations ( P in , total i ) exceeds the contracted demand in any hourly period. The excess power is calculated monthly and every quarter of an hour. In this case, it has been assumed that the same value is obtained for each quarter of an hour. K p is a dimensionless constant whose value depends on the pricing period, while Kex is a constant whose value is 1.4064 €/kW. Table 1 shows the prices of the annual power term for the high-voltage access tariff of six periods ( f power , p ) , as well as the values of the coefficient Kp for the calculation of excess demand charges.
On the other hand, the income of the system comes only from selling surplus energy to the electricity market ( P exp , z i ) at the hourly market price, resulting in daily auctions organized by the Spanish wholesale market operator OMIE ( ρ exp , z i ).
ρ exp , z i · P exp , z i
In this way, the mathematical optimization problem, whose objective function is formulated in Equation (6), calculates both the optimal hourly dispatch of the virtual power plant over 365 days of the year and the optimal annual contracted demands.
max z = 1 365 i = 1 24 ρ exp , z i · P exp , z i ρ imp , z i · P imp , z i f W · P W , z i f H · P H , z i f PV · k = 1 17 P out , k , z i f PV · j = 1 10 P out , v , j , z i p = 1 6 f power , p · P c , p m = jan dec p = 1 6 K p · K ex · i = 1 n 4 · exc r , p i 2 m ( i = 1 24 ,   z = 1 365 ,   j = 1 10 ,   k = 1 .. 17 ,   p = 1 6 )
  • Constraints
Equations (7)–(9) show the energy balances of the global system (A) and of each subsystem (B) (see Figure 2). As regards demand management, Equation (10) indicates the fulfillment of daily demand, while Equation (11) limits the hourly demand in each of the pumping stations with water storage.
P imp i P exp i + P W i + P H i = j = 1 10 P out , v , j i k = 1 17 P out , k i + j = 1 10 P in , v , j i + k = 1 17 P in , k i
P out , v , j i P in , v , j i = P PV , v , j i P D , v , j i   ( j = 1 10 )
P out , k i P in , k i = P PV , k i P D , k i   ( k = 1 17 )
P D , total , j z = i = 1 24 P D , v , j i
0     P D , v , j i     P D , lim , j i .
The variables of wind and hydroelectric generation can vary between 0 and a maximum value defined according to the availability of renewable resources, as shown by Equations (12) and (13).
0     P W i     P W ,   max i
0     P H i     P H ,   max i .
The model supports both the purchase and sale of energy to the electricity market according to the optimal economic situation in each hourly period, but both operations can never occur at the same time (Equation (14)). Equations (15)–(18) establish the variation range of the energy import and export variables to the distribution network.
I imp i + I exp i     1
0     P imp i     I imp i ·   P imp , max i
P imp , max i = k = 1 17 P D , k i + j = 1 10 P D , lim , j i
0     P exp i     I exp i ·   P exp , max i
P exp , max i = P W i + P H i + k = 1 17 P PV , k i + j = 1 10 P PV , v , j i
Regarding the pumping stations with photovoltaic self-consumption, Equations (19)–(22) show the range of variation of the incoming/outgoing energy in each of them. Equations (23)–(24) prevent the export and acquisition of energy from the pumping stations from occurring simultaneously.
0     P in , k i     P D , k i · I in , k i
0     P out , k i     P PV , k i · I out , k i
0     P in , v , j i     P D , lim , j i · I in , v , j i
0     P out , v , j i     P PV , v , j i · I out , v , j i
I in , v , j i + I out , v , j i     1
I in , k i + I out , k i     1 .
In regard to the optimization of demand charges, Equation (25) limits the maximum demand contracted in each pricing period. In high voltage charges, legislation requires that the demand contracted in a pricing period ( P c , ( p + 1 ) ) must always be greater than or equal to the demand contracted in the previous pricing period ( P c , p ) [44]. Equations (26)–(29) set the restrictions for the billing of excess power. A variable is defined ( exc r , p i ) that will only consider the excess power when the power demanded in the system ( P in , total i ) in each hour of the period p exceeds the demand contracted in that period. In order to make this decision, a binary variable ( I exc i ) will take a value equal to 1 when excess power occurs; otherwise, it will take a value equal to 0. The parameter M represents the positive upper bound of the excess power restriction, exc p i , while parameter m is its negative lower bound.
P c , p     P c , p + 1   ( p = 1 .. 6 )
exc p i = ( P in , total i P c , p )
m · ( 1 I exc i )     exc p i     M · I exc i
exc r , p i = exc p i · I exc i
P in , total i = k = 1 17 P in , k i + j = 1 10 P in , v , j i
According to the characteristics of the optimization problem described above, it is of type mixed-integer nonlinear because integer variables and nonlinear constraints are defined in the model.
For the resolution of the proposed problem, LINGO was used, a calculation software suitable for modeling and solving nonlinear mathematical optimization problems efficiently [46]. This software uses the branch-and-bound method [47] to favor obtaining a global optimal solution and, thus, avoid local optimal solutions. This technique allows us to implicitly enumerate all possible combinations of integer variables. Upper and lower bounds of the value of the objective function are generated, which are approximated to each other. This process fundamentally consists of dividing the total set of feasible solutions into smaller subsets of solutions to facilitate the search for a global optimum. The execution of the model ends when it is not possible to make further divisions of the problem, or the difference between the lower and upper bound of the target value is less than a pre-established tolerance. This method allows the optimal selection of the next subset so that valid solutions are found more efficiently.
It is worth mentioning that LINGO allows us to develop a model in a similar way to the standard mathematical notation. In addition, this software can integrate a large amount of data into the model from external spreadsheets to facilitate data management. According to the formulation of the problem, LINGO invokes the appropriate internal solver to search for the optimal solution to the proposed model. Once it determines the optimal solution (if any), it provides a solution report with general information about the model and the values for all variables. For our problem, LINGO returned a globally optimal solution. As expected, being a nonlinear model with a large number of variables, this optimization procedure required a long computation time. The calculation time of each case was 630 min, using a computer with an Intel® Core i7 processor, 3.00 GHz CPU and 16 GB of RAM.

4. Case Study

4.1. Data

The model proposed in Section 3 was applied to a real case study, consisting of different energy infrastructures, with both consumption and electricity generation assets. The system consisted of 27 water pumping stations for agricultural irrigation, located in a dispersed manner in a geographical area of 135,000 hectares in Spain, which consumed annual electricity of 39 GWh, according to real data recorded in 2017 (see Figure 3).
The system integrated different renewable electricity generation units, both hydroelectric and wind and photovoltaic, with a total installed capacity of 60.2 MW. Table 2 shows the total data of the demand and the generation facilities, as well as the production costs that have been considered in the model. See Appendix A for a more detailed description of the data used here.
In the case study, the hourly prices of the Spanish wholesale electricity market in 2017 were published by the market operator OMIE [48].

4.2. Results and Discussion

The mathematical problem of nonlinear mixed-integer programming allows us to optimize the cost of the system and to calculate as a result the optimal hourly value of 143 variables of the model during each hour of a year. It should be noted that six variables were of the integer type, associated with the optimal annual contracted demand in each pricing period, and 57 variables are of binary integer type, taking a value of 0 or 1, associated with the decisions to import or export electricity in the different subsystems and in the joint system. These variables allow the decision to obtain the optimal economic exploitation of the system, minimizing the cost in each hourly period. Figure 4 presents the results of the optimal dispatch for a day in June. As can be seen, the VPP purchases the necessary energy in the electricity market when it cannot deliver the requested demand with its own sources of renewable generation.
The main parameters for the analysis of the results obtained are the electricity values, such as generation, import and export of the system, and the hourly distribution of the manageable demand of the pumping stations. In addition, the costs of the energy consumed and the demand recorded will be analyzed according to the optimal contracted demand in each pricing period. Pricing periods are distributed across the year as they are established by the regulation of network access tariffs (see Table 3).
In order to evaluate the results obtained from the proposed model, the problem was initially solved considering the data of the electrical demand to be satisfied at each hour in each pumping station, without considering the possible intraday management of the demand of some pumping stations. In other words, in this first case study (case 1), the demand is known every hour, and therefore, it is not a variable to be optimized. Table 4 shows the distribution of demand according to the month and pricing period without taking into account the demand management in the model.
On the other hand, Table 5 shows the results in the case of the system with manageable intraday demand proposed in this article. Comparing both tables and analyzing the results in the months of greatest demand (mainly June and July), it is observed that, in the case of the system with intraday demand management (see Table 5), there is a large increase in consumption in period 1, and lighter, in periods 3 and 4, corresponding to the hours with the highest solar radiation. This is caused by the greater self-consumption of photovoltaic power by the system. By favoring self-consumption, there is more efficient management of demand throughout the hourly periods of access tariffs, decreasing consumption in period 6, which has a lower cost but corresponds mainly to night hours where all available production resources cannot be taken advantage of.
Figure 5 represents the values reflected in the previous tables from a more graphic point of view for the annual demand according to the pricing periods, observing for the case with manageable demand an increase of 65.62% in the demand of period 1 and a decrease of the demand of period 6. Conversely, in the months of lower demand, consumption slightly increases in the cheaper periods, thus minimizing energy costs. In short, intraday demand management adapts the consumption curve of pumping stations to the generation curve of renewable energy sources, since the most efficient VPP is that in which self-consumption is closest to 100%. In this case, it is possible to cover 99.64% of the annual demand through the self-consumption of the electricity generation itself (Table 6). The remaining 0.36% of annual demand corresponds to hours where the cost of generation is less competitive than the cost of acquiring electricity in the electricity market.
Regarding the production results, it is verified that a higher percentage of energy produced is self-consumed thanks to intraday management. As shown in Table 6, the demand is covered with the same production as in the case without manageable demand, but reducing the imported power (Pimp) considerably and slightly reducing the exported power (Pexp). Therefore, it is shown that it is more efficient to self-consume than to export, whenever possible, achieving in this situation that the VPP is able to cover 99.64% of its demand with its own generation compared to 94.60% without intraday management.
From the analysis of the results obtained associated with the optimal contracted demand in each pricing period (see Table 3 and Table 7), it is observed that with the proposed demand management model, it is possible to reduce the peaks of maximum demand and flatten the curve of daily demand. In this way, the maximum contracted demand annually in the most expensive hourly periods is reduced, as well as the excess power, and, consequently, the operating profit of the VPP is increased (see Table 8). It is worth remembering that the contracted demand values in each of the six pricing periods must be maintained by law for one year.
The maximum demand contracted in period 6 is much higher than the rest of the contracted powers since the irrigation communities of the analyzed system concentrate on average 80% of their consumption in this period. Period 6 includes 5048 annual hours, which include, among others, those corresponding to the entire month of August (Table 3). In this month, there is a high demand for energy along with the lower cost of acquiring electricity. For this reason, the intraday demand management strategy allows us to reduce the contracted demand in the most expensive periods while increasing in period 6. In this way, the contracted demand is better adjusted to the demand of the facilities and, as a consequence, excess power is reduced.
Table 8 compares the results of the income and costs of the case studies. According to the demand charges, in both cases, the costs for excesses in the contracted demand are higher than the costs per fixed power term. This is because the power needs have a seasonal variation in the farms since a high power is needed to pump the water in the months of the irrigation season (May to September) and a minimum power the rest of the year. However, the obligation to contract electric power throughout the year and the high cost of the fixed term of annual power make it profitable to contract a lower electric power than the maximum demanded annually even at the cost of assuming a cost of the penalty for excess power.
In view of the results of the integration of intraday demand management in the model, there is a reduction in the production cost ( 4.72%), the fixed cost of contracted demand ( 8.39%) and the cost of power excesses ( 2.73%). Income also decreases, but to a much lesser extent ( 0.87%), and as a consequence, the operating profit of VPP increases (3.20%). This trend can be seen in a more graphic way in Figure 6. In addition, as seen in Table 6, less energy is exported to the grid ( 1.37%), although income is not reduced in the same proportion ( 0.87%), which means that a better economic performance is obtained from selling exported power.

5. Analysis of the Influence of the Electricity Market Price

In addition to solving the models with and without intraday demand management, other scenarios were studied to evaluate the influence of the Spanish wholesale electricity market OMIE on the proposed model. As a reference, the prices of the wholesale electricity market of 2017 have been taken, while in order to determine the variations that are applied to these prices, a historical study of the evolution of the average price of electricity in the last ten years was carried out. For this analysis, the most extreme cases were considered, obtaining a percentage difference of +10% and 30% with respect to the average price of the year 2017.
Regarding the results of power generation, export and import (see Table 9), for case studies 1.3 and 2.3 with a lower price in the electricity market, the production of available power decreases, since it is more profitable to stop producing to export, to continue generating to sell energy at a price lower than the cost of generation. The opposite occurs when the price of the electricity market increases. The main differences are observed in the amount of power imported from the grid since for cases of unmanageable demand (cases 1.1, 1.2, 1.3), it remains constant in the face of possible changes in the price of the electricity market. Generation costs remain more competitive than the energy purchase price set by the electricity market even when the market price is reduced by 30%. In addition, in these cases, energy balances must be satisfied, and demand must be met at all times.
However, for the cases with intraday demand management (cases 2.1, 2.2, 2.3), it is observed that, for the situation of a low market price (case 2.3), the system tends to self-consume as much as possible and avoid exporting power to the distribution network. It should be remembered that the model always seeks to maximize the percentage of self-consumed power and import the least amount of power possible from the grid, so for a reduction of 30% of the market price, the power imported from the grid decreases by 12.85%. Flexibility in demand allows for more efficient management of renewable resources and reduces energy dependence. Despite the intraday demand management, in all the cases studied, the VPP is not able to completely cover its demand with renewable energy sources, since in some hours of analysis, the energy balance cannot be met by any technology generation due to technical production constraints, or it is more economical to purchase power from the electricity market.
On the other hand, Table 10 shows the results of the optimal contracted demand in the face of variations in the electricity market price. As expected, when the demand is known (cases 1.1, 1.2, 1.3), the values do not vary, since it must be remembered that in this case, the demand is a condition to be satisfied in each hour and, therefore, is not a variable to be optimized. However, intraday demand management (cases 2.1, 2.2, 2.3) optimizes contracting for each market situation. As shown in Table 9, at a lower OMIE market price (case 2.3), demand and available production resources are managed more efficiently, increasing self-consumption as much as possible, which causes period 6 to be slightly reduced, and as a consequence, the maximum demand contracted in this period is also reduced. As will be seen later in the economic results shown in Table 11, this situation causes a decrease of 0.72% in the costs of the power term, although an increase of 2.31% in the power excesses. However, due to the seasonality of demand in irrigation and high power costs, it is necessary to find the economic balance between both terms, and it is generally more profitable to minimize the contracted demands and incur costs due to excess power.
Regarding the income of the system, it is observed that by increasing the price of the OMIE electricity market, the general trend is to increase the income of the system due to the increase in energy production for its subsequent export to the grid at a higher selling price, see Table 11 and Figure 7. On the other hand, regarding the costs of the system, the influence of intraday demand management is fundamentally appreciated in the production costs with a variation of 0.18%, 0.99% with respect to the cases +10% OMIE and 30% OMIE, respectively, percentages lower than those obtained for cases of unmanageable demand (0.38%, 1.45%, respectively), since the model always tends to seek the optimal value of energy self-consumed, by virtue of which it manages the demand and consequently the optimal profit.

6. Conclusions

Improving the competitiveness of farms requires the development of new innovative strategies for water and energy management. The availability of natural resources to produce sustainable electricity is being used in irrigation communities to promote new investments that make the supply of electricity to water pumping stations more economically and environmentally sustainable. The model proposed in this study of the virtual power plant (VPP), with the integration of the joint management of water and energy, covers up to 99.64% of the electricity demand with its own renewable energy sources.
The analysis of the results shows that it is more economically efficient to self-consume as much electricity as possible and avoid exporting energy to the grid. As a consequence, the consumption curve of the pumping stations adapts to the curve of electricity generation with renewables, provided that the generation costs are more competitive against the purchase price of energy in the electricity market. In addition, it is possible to increase the use of electricity production with renewable energy and reduce the peaks of maximum demand, thus increasing the operating profit of the VPP by reducing the maximum demand contracted annually in the hourly periods with higher energy costs.
This approach may be useful not only for the case presented in this research, but also for other cases of distributed power generation sources, which are not necessarily connected on-site to the load but belong to the same owner or a joint venture that would benefit from working together as a single operator in the electricity market. In particular, the proposed model could be applied to a group of industrial companies where electricity and other supplies (water, heat) must be managed together with their own power generation resources, even if those electricity production facilities are spread over a large geographical area. Further research should also address the new paradigms of demand response aggregation and energy communities that can be modeled under a virtual power plant scheme.

Author Contributions

Conceptualization, N.N. and J.M.Y.; methodology, N.N. and J.M.Y.; investigation, N.N. and J.M.Y.; writing—original draft preparation, N.N. and J.M.Y.; writing—review and editing, N.N. and J.M.Y. All authors have read and agreed to the published version of the manuscript.

Funding

This research received no external funding.

Conflicts of Interest

The authors declare no conflict of interest

Nomenclature

Indexes
iindex for number of hours
pindex for pricing periods
nindex for number of hours exceeding the maximum contracted demand
mindex for number of months
zindex for number of days
jindex for pumping stations with manageable demand
kindex for pumping stations with unmanageable demand
Data
ρ exp i hourly price for selling energy MWh
ρ imp i hourly price for purchasing energy MWh
f W wind technology operation and maintenance cost MWh
f H hydroelectric technology operation and maintenance cost MWh
f PV photovoltaic technology operation and maintenance cost MWh
f power , p price of the annual power term according to pricing period p kW - year
P D , k i hourly demand of each pumping station k ( MW )
P D , total , j z daily demand of each pumping station j ( MW )
P D , lim , j i maximum hourly demand of each pumping station j ( MW )
P PV i / P PV , v i hourly power from photovoltaic generation ( MW )
P W ,   max i maximum available hourly power from wind generation ( MW )
P H ,   max i maximum available hourly power from hydroelectric generation ( MW )
P exp , max i maximum hourly power exported from the global system ( MWh )
P imp , max i maximum hourly power imported from the global system ( MWh )
K p constant of excess power according to pricing period p
Kexexcess power factor (€/kW)
Variables
P exp i hourly power exported from the global system ( MWh )
P imp i hourly power imported from the global system ( MWh )
P W i hourly power from wind generation ( MW )
P H i hourly power from hydroelectric generation ( MW )
P in , k i / P in , v , j i hourly power imported from subsystems k/j ( MWh )
P out , k i / P out , v , j i hourly power exported from subsystems k/j ( MWh )
P D , v , j i hourly demand in each pumping station with water storage j ( MW )
I exp i binary variable equal to 1 if power is exported from the global system; otherwise, it will be equal to 0
I imp i binary variable equal to 1 if power is imported to the global system and, otherwise, it will be equal to 0
I in , k i / I in , v , j i binary variable equal to 1 if power is imported to the pumping stations k/j and, otherwise, it will be equal to 0
I out , k i / I out , v , j i binary variable equal to 1 if power is exported from pumping stations k/j and, otherwise, it will be equal to 0
P c , p demand contracted in each pricing period p (p = 1.6) ( kW )
exc r , p i positive excess power in each pricing period p (p = 1.6) ( kW )
exc p i excess power in each pricing period p (p = 1.6) ( kW )
I exc i binary variable equal to 1 if excess power is produced; otherwise, it will be equal to 0
P in , total i total hourly incoming power from the general bus to pumping stations ( kWh )

Appendix A

Table A1 shows the electricity consumption during 2017 of the 27 pumping stations that make up the study system.
Table A1. Power consumed annually from each pumping station.
Pumping Station Electricity Consumption (MWh) Pumping Station Electricity Consumption
(MWh)
Pumping Station Electricity Consumption
(MWh)
17461028419656
2222311101120900
3965121282211615
44419131045221592
52112142361232688
6255515450242014
784316622251053
853017373226192
920361827827801
Total electricity consumption (GWh)39
Table A2 shows the installed power of the hydroelectric plants that make up the study system.
Table A2. Installed capacity of hydroelectric plants (MW).
Hydroelectric Power PlantInstalled Capacity
14.4
20.9
31.2
41.1
55.0
62.1
Total capacity14.7
Table A3 shows the power of the self-consumption photovoltaic installation in each of the pumping stations.
Table A3. Installed power of the self-consumption photovoltaic installations.
Pumping StationInstalled PV Capacity (kW)Pumping StationInstalled pv Capacity (kw)Pumping StationInstalled PV Capacity (kW)
13251022519255
27001140020350
33001242021750
49751323022750
59411460023715
611061557524815
73671623025445
830117100526877
910001823027585
Total installed capacity (MW)15.5
Table A4 shows the most detailed data of the renewable generation facilities according to the hourly periods of the contracted access charge.
Table A4. Annual generation data according to hourly periods (MWh).
PeriodHydropower Generation Wind Power GenerationPhotovoltaic Generation
P1320668063874
P2384110,6842473
P3241648792057
P4400792243099
P5623910,0145588
P629,22663,09610,553
Total generation48,934104,70327,645

References

  1. Saboori, H.; Mohammadi, N.A.; Taghe, R. Virtual Power Plant (VPP), Definition, Concept, Components and Types. In Proceedings of the 2011 Asia-Pacific Power and Energy Engineering Conference, Institute of Electrical and Electronics Engineers (IEEE), Wuhan, China, 25–28 March 2011; pp. 1–4. [Google Scholar]
  2. El Bakari, K.; Kling, W.L. Virtual power plants: An answer to increasing distributed generation. In Proceedings of the 2010 IEEE PES Innovative Smart Grid Technologies Conference Europe (ISGT Europe), Gothenberg, Sweden, 11–13 October 2010; pp. 1–6. [Google Scholar] [CrossRef] [Green Version]
  3. Ghavidel, S.; Li, L.; Aghaei, J.; Yu, T.; Zhu, J. A review on the virtual power plant: Components and operation systems. In Proceedings of the 2016 IEEE International Conference on Power System Technology (POWERCON), Institute of Electrical and Electronics Engineers (IEEE), Wollongong, NSW, Australia, 28 September–1 October 2016; pp. 1–6. [Google Scholar]
  4. Cheng, L.; Zhou, X.; Yun, Q.; Tian, L.; Wang, X.; Liu, Z. A Review on Virtual Power Plants Interactive Resource Characteristics and Scheduling Optimization. In Proceedings of the 2019 IEEE 3rd Conference on Energy Internet and Energy System Integration (EI2), Institute of Electrical and Electronics Engineers (IEEE), Changsha, China, 8–10 November 2019; pp. 514–519. [Google Scholar]
  5. Zhang, G.; Jiang, C.; Wang, X. Comprehensive review on structure and operation of virtual power plant in electrical system. IET Gener. Transm. Distrib. 2019, 13, 145–156. [Google Scholar] [CrossRef]
  6. Yavuz, L.; Onen, A.; Muyeen, S.; Kamwa, I.; Innocent, K. Transformation of microgrid to virtual power plant–a comprehensive review. IET Gener. Transm. Distrib. 2019, 13, 1994–2005. [Google Scholar] [CrossRef]
  7. Nosratabadi, S.M.; Hooshmand, R.-A.; Gholipour, E. A comprehensive review on microgrid and virtual power plant concepts employed for distributed energy resources scheduling in power systems. Renew. Sustain. Energy Rev. 2017, 67, 341–363. [Google Scholar] [CrossRef]
  8. Kakran, S.; Chanana, S. Smart operations of smart grids integrated with distributed generation: A review. Renew. Sustain. Energy Rev. 2018, 81, 524–535. [Google Scholar] [CrossRef]
  9. Wang, X.; Liu, Z.; Zhang, H.; Zhao, Y.; Shi, J.; Ding, H. A Review on Virtual Power Plant Concept, Application and Challenges. In Proceedings of the 2019 IEEE Innovative Smart Grid Technologies-Asia (ISGT Asia), Institute of Electrical and Electronics Engineers (IEEE), Chengdu, China, 21–24 May 2019; pp. 4328–4333. [Google Scholar]
  10. Plancke, G.; De Vos, K.; Belmans, R.; Delnooz, A.; Glenn, P. Virtual power plants: Definition, applications and barriers to the implementation in the distribution system. In Proceedings of the 2015 12th International Conference on the European Energy Market (EEM), Institute of Electrical and Electronics Engineers (IEEE), Lisbon, Portugal, 19–22 May 2015; pp. 1–5. [Google Scholar]
  11. Pudjianto, D.; Ramsay, C.; Strbac, G. Virtual Power Plant and System Integration of Distributed Energy Resources. IET Renew. Power Gener. 2007, 1, 10–16. [Google Scholar] [CrossRef]
  12. Moreno, B.; Díaz, G. The impact of virtual power plant technology composition on wholesale electricity prices: A comparative study of some European Union electricity markets. Renew. Sustain. Energy Rev. 2019, 99, 100–108. [Google Scholar] [CrossRef]
  13. Paraschiv, F.; Erni, D.; Pietsch, R. The impact of renewable energies on EEX day-ahead electricity prices. Energy Policy 2014, 73, 196–210. [Google Scholar] [CrossRef] [Green Version]
  14. Beguin, A.; Nicolet, C.; Kawkabani, B.; Avellan, F. Virtual power plant with pumped storage power plant for renewable energy integration. In Proceedings of the 2014 International Conference on Electrical Machines (ICEM), Institute of Electrical and Electronics Engineers (IEEE), Berlin, Germany, 2–5 September 2014; pp. 1736–1742. [Google Scholar]
  15. Vuc, G.; Borlea, I.; Jigoria-Oprea, D.; Teslovan, R. Virtual power plant strategy for renewable resources aggregation. Eurocon 2013, 737–743. [Google Scholar] [CrossRef]
  16. Pandzic, H.; Kuzle, I.; Capuder, T. Virtual power plant mid-term dispatch optimization. Appl. Energy 2013, 101, 134–141. [Google Scholar] [CrossRef]
  17. Tajeddini, M.A.; Rahimi-Kian, A.; Soroudi, A. Risk averse optimal operation of a virtual power plant using two stage stochastic programming. Energy 2014, 73, 958–967. [Google Scholar] [CrossRef] [Green Version]
  18. Shabanzadeh, M.; Eslami-Kalantari, M.; Haghifam, M.-R. An interactive cooperation model for neighboring virtual power plants. Appl. Energy 2017, 200, 273–289. [Google Scholar] [CrossRef]
  19. Liu, Z.; Zheng, W.; Qi, F.; Wang, L.; Zou, B.; Wen, F.; Xue, Y. Optimal Dispatch of a Virtual Power Plant Considering Demand Response and Carbon Trading. Energies 2018, 11, 1488. [Google Scholar] [CrossRef] [Green Version]
  20. Soares, J.; Ghazvini, M.A.F.; Borges, N.; Vale, Z. A stochastic model for energy resources management considering demand response in smart grids. Electr. Power Syst. Res. 2017, 143, 599–610. [Google Scholar] [CrossRef] [Green Version]
  21. Naval, N.; Sánchez, R.; Yusta, J.M. A virtual power plant optimal dispatch model with large and small-scale distributed renewable generation. Renew. Energy 2020, 151, 57–69. [Google Scholar] [CrossRef]
  22. Mohammadi, S.; Soleymani, S.; Mozafari, B. Scenario-based stochastic operation management of MicroGrid including Wind, Photovoltaic, Micro-Turbine, Fuel Cell and Energy Storage Devices. Int. J. Electr. Power Energy Syst. 2014, 54, 525–535. [Google Scholar] [CrossRef]
  23. Qiu, J.; Meng, K.; Zheng, Y.; Dong, Z.Y. Optimal scheduling of distributed energy resources as a virtual power plant in a transactive energy framework. IET Gener. Transm. Distrib. 2017, 11, 3417–3427. [Google Scholar] [CrossRef]
  24. Nosratabadi, S.M.; Hooshmand, R.-A.; Gholipour, M. Stochastic profit-based scheduling of industrial virtual power plant using the best demand response strategy. Appl. Energy 2016, 164, 590–606. [Google Scholar] [CrossRef]
  25. Hadayeghparast, S.; Farsangi, A.S.; Shayanfar, H. Day-ahead stochastic multi-objective economic/emission operational scheduling of a large scale virtual power plant. Energy 2019, 172, 630–646. [Google Scholar] [CrossRef]
  26. Zamani, A.G.; Zakariazadeh, A.; Jadid, S. Day-ahead resource scheduling of a renewable energy based virtual power plant. Appl. Energy 2016, 169, 324–340. [Google Scholar] [CrossRef]
  27. Huang, C.; Yue, N.; Xie, J.; Yu, H.; Wang, K. Economic dispatch of power systems with virtual power plant based interval optimization method. CSEE J. Power Energy Syst. 2016, 2, 74–80. [Google Scholar] [CrossRef]
  28. Bourbon, R.; Ngueveu, S.U.; Roboam, X.; Sareni, B.; Turpin, C.; Hernandez-Torres, D. Energy management optimization of a smart wind power plant comparing heuristic and linear programming methods. Math. Comput. Simul. 2019, 158, 418–431. [Google Scholar] [CrossRef] [Green Version]
  29. Karimyan, P.; Hosseinian, S.H.; Khatami, R.; Abedi, M. Stochastic approach to represent distributed energy resources in the form of a virtual power plant in energy and reserve markets. IET Gener. Transm. Distrib. 2016, 10, 1792–1804. [Google Scholar] [CrossRef]
  30. Zamani, A.G.; Zakariazadeh, A.; Jadid, S.; Kazemi, A. Stochastic operational scheduling of distributed energy resources in a large scale virtual power plant. Int. J. Electr. Power Energy Syst. 2016, 82, 608–620. [Google Scholar] [CrossRef]
  31. Baringo, A.; Baringo, L.; Arroyo, J.M. Day-Ahead Self-Scheduling of a Virtual Power Plant in Energy and Reserve Electricity Markets Under Uncertainty. IEEE Trans. Power Syst. 2018, 34, 1881–1894. [Google Scholar] [CrossRef]
  32. Jafari, M.; Foroud, A.A. A medium/long-term auction-based coalition-forming model for a virtual power plant based on stochastic programming. Int. J. Electr. Power Energy Syst. 2020, 118, 105784. [Google Scholar] [CrossRef]
  33. Shabanzadeh, M.; Eslami-Kalantari, M.; Haghifam, M.-R. A medium-term coalition-forming model of heterogeneous DERs for a commercial virtual power plant. Appl. Energy 2016, 169, 663–681. [Google Scholar] [CrossRef]
  34. Tan, Z.; Wang, G.; Ju, L.; Tan, Q.; Yang, W. Application of CVaR risk aversion approach in the dynamical scheduling optimization model for virtual power plant connected with wind-photovoltaic-energy storage system with uncertainties and demand response. Energy 2017, 124, 198–213. [Google Scholar] [CrossRef] [Green Version]
  35. Pazouki, S.; Haghifam, M.-R. Optimal planning and scheduling of energy hub in presence of wind, storage and demand response under uncertainty. Int. J. Electr. Power Energy Syst. 2016, 80, 219–239. [Google Scholar] [CrossRef]
  36. Kardakos, E.G.; Simoglou, C.K.; Bakirtzis, A. Optimal Offering Strategy of a Virtual Power Plant: A Stochastic Bi-Level Approach. IEEE Trans. Smart Grid 2015, 7, 1. [Google Scholar] [CrossRef]
  37. Wozabal, D.; Rameseder, G. Optimal bidding of a virtual power plant on the Spanish day-ahead and intraday market for electricity. Eur. J. Oper. Res. 2020, 280, 639–655. [Google Scholar] [CrossRef]
  38. Riveros, J.Z.; Bruninx, K.; Poncelet, K.; D’Haeseleer, W. Bidding strategies for virtual power plants considering CHPs and intermittent renewables. Energy Convers. Manag. 2015, 103, 408–418. [Google Scholar] [CrossRef]
  39. Rahimiyan, M.; Baringo, L. Strategic Bidding for a Virtual Power Plant in the Day-Ahead and Real-Time Markets: A Price-Taker Robust Optimization Approach. IEEE Trans. Power Syst. 2015, 31, 2676–2687. [Google Scholar] [CrossRef]
  40. Baringo, A.; Baringo, L. A Stochastic Adaptive Robust Optimization Approach for the Offering Strategy of a Virtual Power Plant. IEEE Trans. Power Syst. 2017, 32, 3492–3504. [Google Scholar] [CrossRef]
  41. Baringo, A.; Baringo, L.; Arroyo, J.M. Self Scheduling of a Virtual Power Plant in Energy and Reserve Electricity Markets: A Stochastic Adaptive Robust Optimization Approach. In Proceedings of the 2018 Power Systems Computation Conference (PSCC), Institute of Electrical and Electronics Engineers (IEEE), Dublin, Ireland, 11–15 June 2018. [Google Scholar]
  42. Loßner, M.; Böttger, D.; Bruckner, T. Economic assessment of virtual power plants in the German energy market—A scenario-based and model-supported analysis. Energy Econ. 2017, 62, 125–138. [Google Scholar] [CrossRef]
  43. Candra, D.I.; Hartmann, K.; Nelles, M. Economic Optimal Implementation of Virtual Power Plants in the German Power Market. Energies 2018, 11, 2365. [Google Scholar] [CrossRef]
  44. Royal Decree 1164/2001. Access Tariffs to Electricity Transmission and Distribution Networks. Available online: https://www.boe.es/buscar/doc.php?id=BOE-A-2001-20850 (accessed on 18 March 2020).
  45. Orden IET/107/2014. Review of Access Tolls for Electricity. Available online: https://www.boe.es/buscar/doc.php?id=BOE-A-2014-1052 (accessed on 18 March 2020).
  46. Lingo. Available online: https://www.lindo.com/index.php/products/lingo-and-optimization-modeling?catid=89&id=88:powerful-lingo-solvers (accessed on 10 January 2020).
  47. Hillier, F.S.; Lieberman, G.J. Advance Praise for Introduction to Operations Research, 7th ed.; McGraw-Hill: New York, NY, USA, 2000. [Google Scholar]
  48. Home|CNMC. Available online: https://www.cnmc.es/ (accessed on 20 January 2020).
Figure 1. Scheme of operation of pumping stations: (a)direct pumping; (b) with water storage pond.
Energies 13 02900 g001
Figure 2. Energy flow diagram of the proposed VPP.
Energies 13 02900 g002
Figure 3. Annual electricity demand.
Energies 13 02900 g003
Figure 4. Results of optimal dispatch for a day in June (24/06/2017).
Energies 13 02900 g004
Figure 5. Evolution of the annual demand of cases with and without intraday demand management.
Energies 13 02900 g005
Figure 6. Evolution of annual costs and income of the system with and without intraday demand management.
Energies 13 02900 g006
Figure 7. Evolution of annual costs and income of the case studies.
Energies 13 02900 g007
Table 1. Data on demand charges [44,45].
Period f power , p   ( / kW - year )   Kp
P139.1394271
P219.5866540.5
P314.3341780.37
P414.3341780.37
P514.3341780.37
P66.5401770.17
Table 2. Global data on demand, generation and production costs.
Total Installed Capacity (MW) Total Energy (MWh) Operating and Maintenance Cost (€/MWh)
Demand - 39,003 -
Hydropower generation 14.748,93416.19
Wind power generation 30104,70316.49
hotovoltaic generation 15.527,6457.40
Table 3. Number of hours of the regulated access tariff of six periods.
Jan Feb Mar Apr May Jun Jul Aug Sep Oct Nov Dec Total
P1132120 - - - 88168 - - - - 114622
P2220200 - - - 88168 - - - - 190866
P3 - - 138 - - 66 - - 120 - 120 - 444
P4 - - 230 - - 110 - - 200 - 200 - 740
P5 - - - 320368 - - - - 352 - - 1040
P63923523764003763684087444003924004405048
Total7446727447207447207447447207447207448760
Table 4. Distribution of the electrical demand of the system without management of the hourly demand (MWh).
JanFebMarAprMayJunJulAugSepOctNovDecTotal
P11310---316754----301124
P22318---6131724----542432
P3--57--129--197-23-405
P4--91--392--808-42-1334
P5---3781111----187--1676
P6
Total
88
125
74
102
452
601
1239
1617
2834
3945
4459
5910
7372
9849
10,647
10,647
3475
4480
941
1128
145
210
307
391
32,032
39,003
Table 5. Distribution of the electrical demand of the system with intraday management of the hourly demand (MWh).
JanFebMarAprMayJunJulAugSepOctNovDecTotal
P167---5331289----241858
P21213---6171669----472358
P3--50--183--313-15-562
P4--64--415--930-32-1442
P5---3921265----296--1952
P6
Total
107
125
82
102
486
601
1225
1617
2681
3945
4162
5910
6891
9849
10,647
10,647
3236
4480
832
1128
162
210
320
391
30,832
39,003
Table 6. Comparison of annual production, export and import results with and without demand management.
CASESPPV
(MWh)
PH
(MWh)
PW
(MWh)
Pexp
(MWh)
Pimp (MWh)PD
(MWh)
Demand coverage
Case 1 (unmanageable demand)27,64548,703103,634143,071209239,00394.60%
Case 2 (manageable demand)27,64548,699103,634141,11614039,00399.64%
Table 7. Comparison of optimal contracted demand in each pricing period with and without intraday demand management.
CASESP1
(kW)
P2
(kW)
P3
(kW)
P4
(kW)
P5
(kW)
P6
(kW)
Case 1 (unmanageable demand)859144714472178229922,075
Case 2 (manageable demand)548102210221575180724,852
Table 8. Comparison of annual results of costs and income with and without intraday demand management.
Case 1 (Unmanageable Demand)Case 2 (Manageable Demand)
Rexp (€)6,819,7636,760,377
Cprod (€)2,775,8542,644,919
Cpower (€)291,252266,812
Cexc (€)403,612392,589
Operating profit (€)3,349,0453,456,057
Rexp-0.87%
Cprod- 4.72%
Cpower- 8.39%
Cexc- 2.73%
Profit ∆-3.20%
Table 9. Annual results of power generation, export and import of all cases studied.
CASESPPV
(MWh)
PH
(MWh)
PW
(MWh)
Pexp
(MWh)
Pimp
(MWh)
PD
(MWh)
Demand coverage
Case 1 (unmanageable demand)Case 1.1 (OMIE ref)27,64548,703103,634143,071209239,00394.60%
Case 1.2 (OMIE +10%)27,64548,725103,774143,232209239,00394.60%
Case 1.3 (OMIE 30%)27,64548,521102,695141,949209239,00394.60%
Case 2 (manageable demand)Case 2.1 (OMIE ref)27,64548,699103,634141,11614039,00399.64%
Case 2.2 (OMIE +10%)27,64548,722103,774141,27914139,00399.64%
Case 2.3 (OMIE 30%)27,64548,516102,702139,98212239,00399.69%
Table 10. Optimal demand contracted in each pricing period of all case studies.
CASESP1
(kW)
P2
(kW)
P3
(kW)
P4
(kW)
P5
(kW)
P6
(kW)
Case 1 (unmanageable demand)Case 1.1
(OMIE ref)
859144714472178229922,075
Case 1.2
(OMIE +10%)
859144714472178229922,075
Case 1.3
(OMIE 30%)
859144714472178229922,075
Case 2 (manageable demand)Case 2.1
(OMIE ref)
548102210221575180724,852
Case 2.2
(OMIE +10%)
548100010001547181725,038
Case 2.3
(OMIE 30%)
548100810081627179024,510
Table 11. Annual results, income and costs of all case studies.
Case 1 (Unmanageable Demand)Case 2 (Manageable Demand)
Case
1.1
(OMIE
ref)
Case
1.2
(OMIE
+10%)
Case
1.3
(OMIE
−30%)
Case
2.1
(OMIE
ref)
Case
2.2
(OMIE
+10%)
Case
2.3
(OMIE −30%)
Rexp (€)6,819,7637,511,7254,735,7246,760,3777,447,7714,689,484
Cprod (€)2,775,8542,789,1132,725,6182,644,9192,649,6042,618,743
Cpower (€)291,252291,252291,252266,812267,303264,881
Cexc (€)403,612403,612403,612392,589400,093401,655
Operating profit (€)3,349,0454,027,7481,315,2423,456,0574,130,7711,404,205
Rexp-10.15% 30.56%-10.17% 30.63%
Cprod-0.38% 1.45%-0.18%-0.99%
Cpower----0.18%-0.72%
Cexc----1.91%2.31%
Profit ∆-20.27% 60.73%-19.52% 59.37%

