Abstract
This paper presents the investigation of a local heating system consisting of three heating mats incorporated within a sedentary workplace. Thermal comfort and individual power settings for the heating mats were studied in experiments with 41 human subjects. Experiments were performed in a climate chamber at two operative temperatures: 16 and 18 °C. Results showed that local heating systems improved occupants’ comfort and were able to create acceptable thermal conditions under both temperatures. The power settings identified were used to study the applicability of heating mats in an industrial hall. Multi-variant analysis of energy consumption for heating was carried out using an ESP-r (Environmental Systems Performance–Research) simulation program. The analysis results demonstrate that in some cases, the installation of local heating mats in industrial halls may reduce energy usage compared to having to heat the entire hall. However, the benefits depend on numerous parameters. Local heating is most advantageous when installed in halls with a small number of workstations, small internal heat gains, and low-efficiency central heating systems. In reality for the satisfactory implementation of local heating systems for a particular application, it is advised to perform analysis for the specific local conditions. In order to improve the effectiveness of local heating systems, an advanced heating control strategy should be considered.
1. Introduction
Half of the EU’s energy consumption is used for heating and cooling purposes in buildings and industry. For industrial buildings, 70.6% of energy consumption is used to heat space, and in industrial process heating, 26.7% for lighting and electrical processes, such as machine motors, and 2.7% for cooling [1]. The energy used for maintaining appropriate conditions for occupants’ indoors should therefore be used efficiently. One of the strategies for energy reduction is to lower the temperature set-point in the room in winter and allow the temperature to rise in summer using the recommended range of standards, and at the same time use local heating, ventilation and air conditioning (HVAC) systems to maintain comfortable conditions around workstations [2]. Most local heating systems provide occupants with the ability to control these systems individually, therefore allowing for individual differences between people and thus achieving the preferred conditions at each workstation.
The number of studies on the use of local heating systems is much smaller than that of other local systems, i.e., local ventilation and local cooling [3,4,5,6]. Research to date on local heating systems has mainly involved solutions, such as radiant heating panels, heated chairs, and local hand and foot warmers.
Heated seats have been used in cars and other means of transport for a long time. Research results indicate that it is an effective way to improve the thermal comfort of the driver and passengers, thanks to which it is possible to significantly accelerate the achievement of thermal comfort [7]. Studies conducted at operating temperatures of 10 and 20 °C have shown that just by using a heated seat and foot warmer [8,9], the temperature inside the car can be lowered by 6 °C, and when only the seat heating is turned on, it can be lowered a further 3 °C, maintaining neutral thermal sensations. Other studies indicate that at 5 °C, heated seats and backs equipped with an encapsulated carbonized fabric (ECF) material allow people to experience only “slight discomfort”, the second best result out of the four-degree scale: Comfort, slight discomfort, discomfort, very uncomfortable [10]. Zhang et al. [11] observed that the use of heated and cooled seats in the temperature range from 15.6 to 28 °C satisfies 90% of people. However, clinical studies suggest that prolonged use of heated seat cushions by men is not recommended for health reasons [12,13].
Air blown through the backrest of a chair with a temperature of up to 45 °C was tested in a room with a temperature of 20, 22, and 26 °C. The tests were conducted using people [14,15] and with a thermal manikin [14,15,16]. In addition, personalized ventilation and electric heating mats with a maximum temperature of 47 °C were mounted under the top of the desk and on the floor below the feet. The solutions applied significantly reduced the level of dissatisfaction with thermal conditions. Numerical analyzes of heating panels mounted behind the back and in front of the person sitting near a window were also carried out by Conceicao et al. [17]. The effect of heating panels was analyzed for a surface temperature of 45–55 °C in a room with a temperature ranging from 12 to 22 °C. The results of the measurements of the heating system built into the floor performed with a heated manikin [18] suggest that a surface of 1 m2 heated to 39 °C can provide comfort to users in a room with an air temperature of 18 °C.
Zhang et al. [19] analyzed the operation of foot and hand warmers in a wide range of temperatures, from 18 to 30 °C. The foot warming device consisted of a lamp with a maximum power of 125 W (adjustable) placed in a box with a front opening for the feet, while the hands were heated by a heated keyboard and wrist support. These devices along with two air vents directed towards the head and one on the hands constituted the system of shaping the local environment: TAC (task ambient conditioning). The authors observed that the subjects accepted the quality of the environment despite the fact that in some conditions, they felt slight thermal discomfort, but they were willing to accept greater discomfort with TAC conditions.
In a room with a temperature of 20 °C, an improvement in the thermal comfort perception was also achieved by blowing warmer air towards the head [20]. This improvement was at the expense of lowering the perceived quality of inhaled air and an increase in the intensity of some sick building syndrome symptoms, such as eye irritation. Comparisons of convective heating systems with radiant heating systems in tests with variable human activity and variable thermal insulation of clothing showed the advantage of the latter [21]. The research consisted of experiments and simulation (human response), using the Zhang model [22]. Four 1.2 × 1.2 m2 electric heating panels with a power of 400 W were mounted on the ceiling above the person. The state of general thermal comfort was reached faster using these systems. To achieve the same level of thermal comfort under transient activity, it was necessary to increase the power of the convection system by 14% compared to the power consumed under steady conditions. Other studies [23] have shown that local systems based on heat exchange by radiation were up to 56.7% more effective than convective ones.
Research carried out in ergonomics laboratories was focused on testing methods of protecting the human body against extreme cold conditions occurring in workplaces, e.g., in cold rooms or in vehicle cabins during the winter. Hunt and Wells [24] studied the effect of glove type on the temperature of forearms and hands and their efficiency (grip strength) at low temperatures (−20 °C). In addition to gloves, the subjects also tested electric cushions attached to the lower back. Electrically heated gloves and vests were also tested by Ducharme et al. [25]. They concluded that in an environment with a temperature of −25 °C, just heating the hands and nothing else was insufficient. To maintain proper blood flow through the hands and ensure dexterity of the fingers, it is also necessary to heat the torso. Studies [26] of three different local heating systems showed that the highest level of thermal comfort and skin temperature of selected body parts as well as the lowest energy consumption were obtained by a heated clothing system. The battery powered system consisted of 12 heating fabric pads incorporated in both trousers and a jacket.
Heating systems incorporated in workstations may be applied in offices and also in large industrial premises, where the demand for heating the whole area is high. However, research on the energy consumption of local heating systems was mainly carried out for the office environment [27,28]. There is little information on the applicability of these systems in industrial premises, especially for stationary workplaces. The application of these systems may allow the saving of energy for heating. In order to examine whether the adoption of local heaters is beneficial, the settings of the power consumed by these systems must be known. The power of the devices used in the experiments described in the presented literature review had a wide range from about 30 W [19] up to 400 W [21].
The aim of the research described in this article was to analyze the thermal sensation and also to identify the best power settings of the local heating system consisting of three heating mats under a reduced room temperature. Another goal was to determine, based on multi-variant simulations, the possible energy savings by installing this local heating system in an industrial building.
2. Human Subject Experiments
2.1. Experimental Facilities
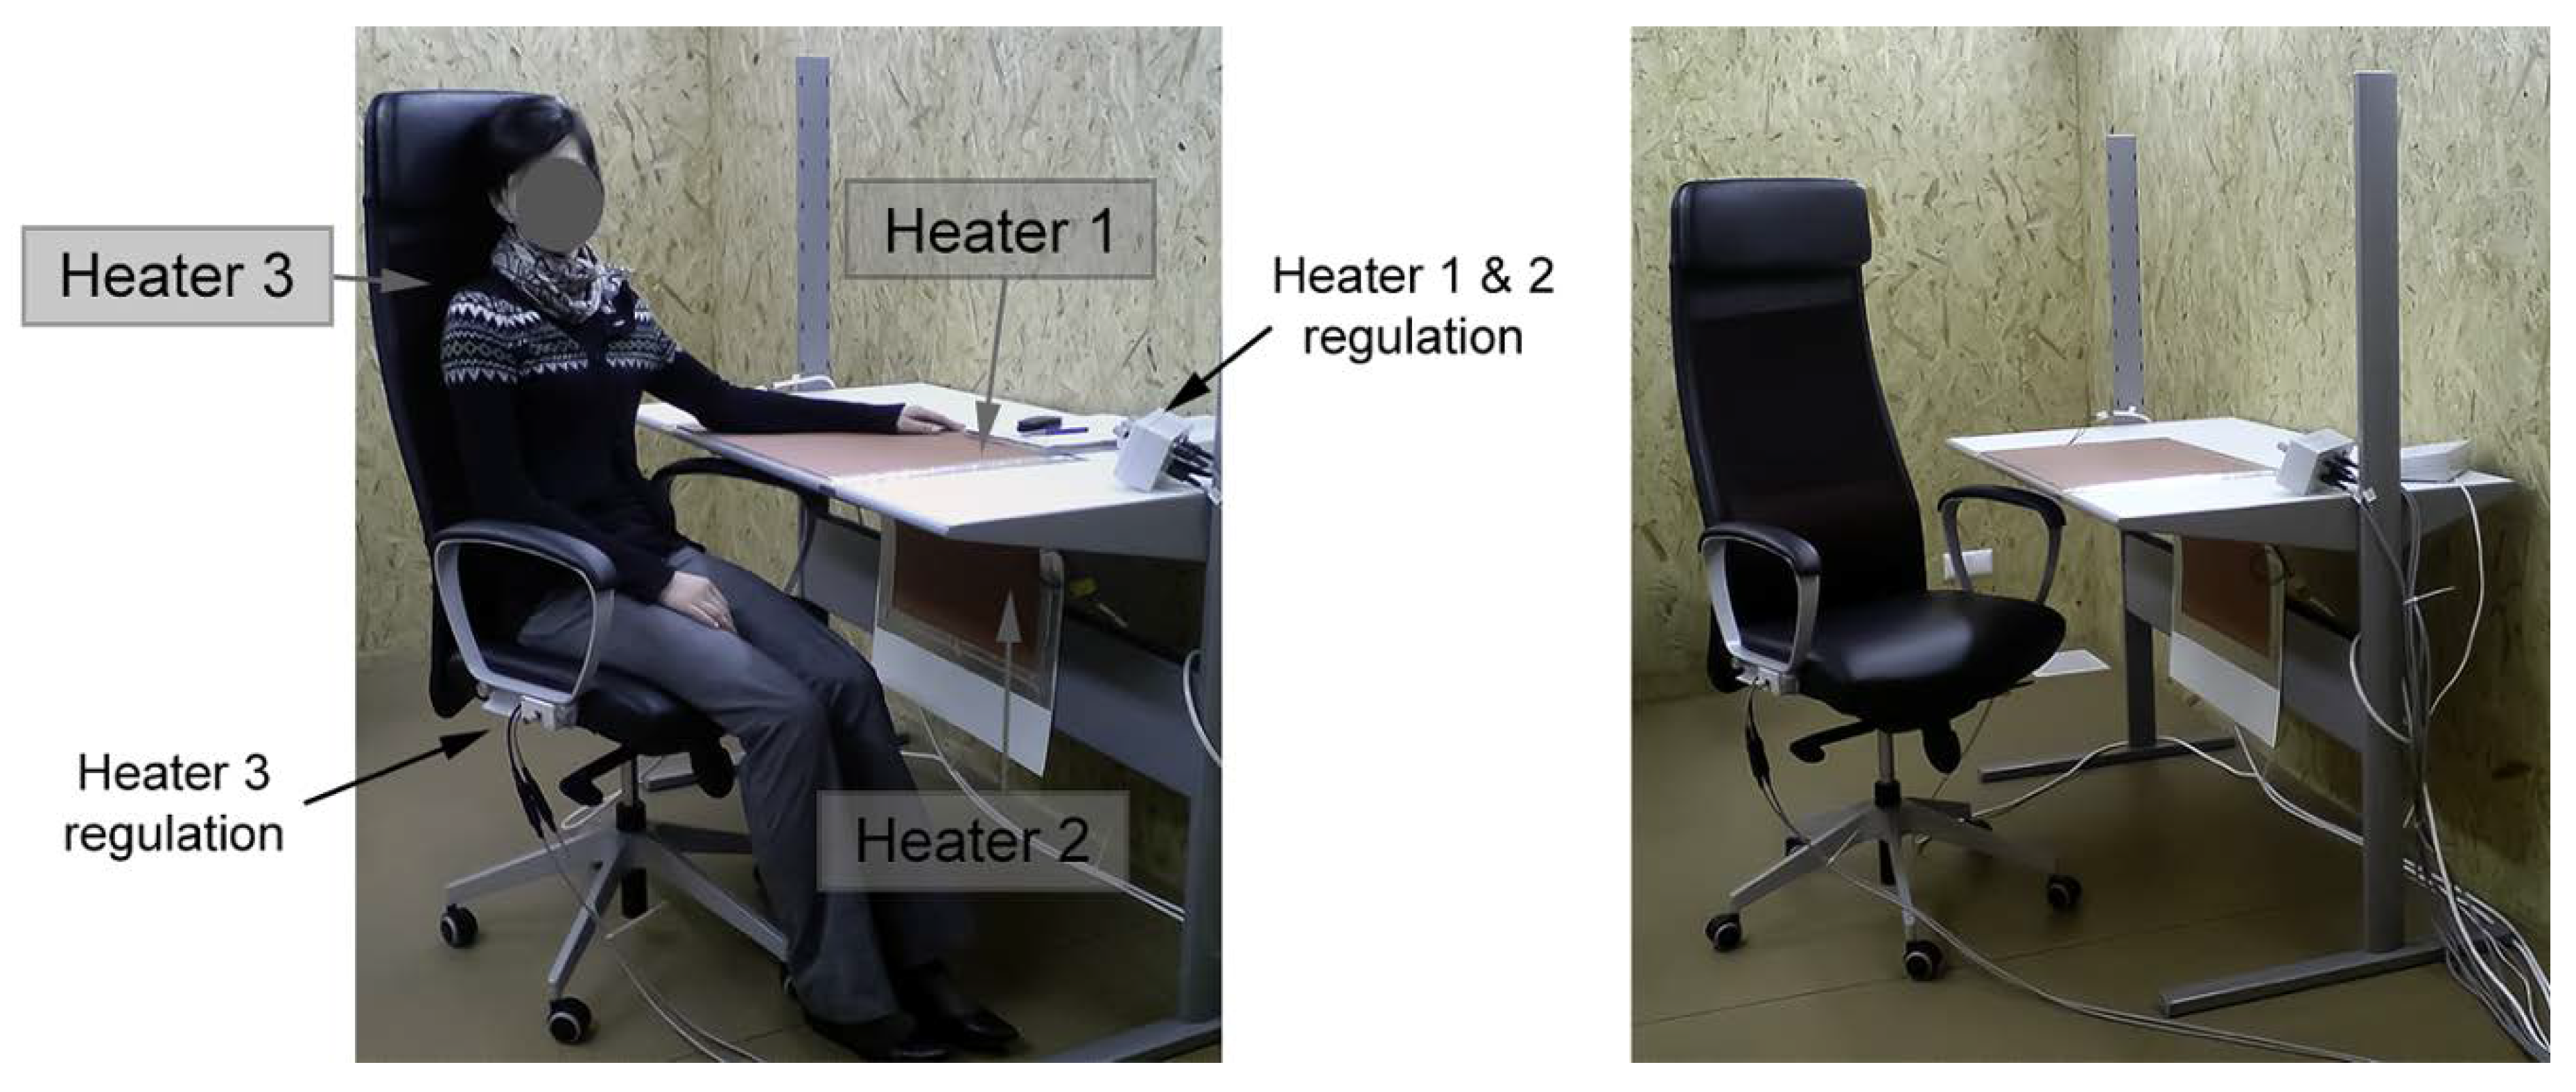
The experiments were conducted in a climate chamber. Due to a special chamber construction (inner chamber located in an outer chamber), it was possible to maintain the mean radiant temperature equal to the air temperature and to avoid radiant asymmetry. The air temperature in the outer and the inner chambers was maintained at the same level by the air conditioning systems. In this way, the floor, ceiling, and wall temperature was assured to be equal to the air temperature. Relative humidity was monitored but not controlled. Inside the inner chamber (dimensions 2.5 × 3.5 × 2.8 m3), one workstation equipped with three local heaters (electric heating mats) was built. The workstation consisted of a desk and a chair modified to incorporate the heating mats, as shown in Figure 1. Two 0.5 × 0.5 m2 heating mats (heaters 1 and 3) were used: One placed on the desktop and one incorporated in the backrest of the chair. The third mat (heater 2) 0.4 × 0.6 m2 was located below the table to heat the subject’s legs. The maximum power was 150, 340, and 140 W, respectively. for heaters 1 to 3. The maximum temperature of the heaters with direct contact to the body, heaters 1 and 3, did not exceed 40 and 60 °C for heater 2 placed at a distance from the body. Locating only one workstation in the chamber allows the interference that the operation of another workstation may have on their users to be avoided. Thus, the conditions that the occupant experiences are created by the local heating system being operated in a uniform background environment.
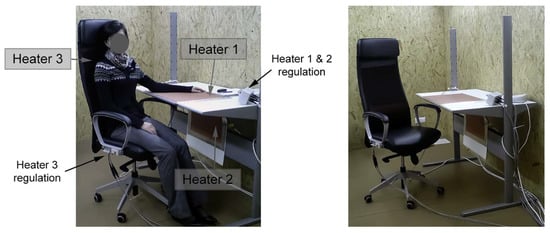
Figure 1.
Workstation incorporating three heating mats (heaters).
2.2. Experimental Conditions and Procedure
Experiments were performed at two levels of operative temperature: 16 and 18 °C. Each of the two experiments lasted 80 min and consisted of two stages during which subjects performed light sedentary work. In the first 30-min period, subjects became adapted to the thermal conditions and did not use any local heating system. For the remaining time, subjects sat by the workstation equipped with local heaters. The surface temperature of each heater was regulated separately by changing the position of a corresponding knob, as shown in Figure 1. At the beginning of this stage, the heaters were set at their maximum power, but the subjects were encouraged to adjust the power of the heater according to their preferences. Each heater’s settings were recorded continuously.
Throughout each experiment, subjects reported their overall and local thermal sensations as well as their acceptability of the sensation a total of four times. The thermal sensation ASHRAE (American Society of Heating, Refrigerating and Air Conditioning Engineers) 7-point scale (range from −3–cold to 3–hot) and the continuous acceptability scale (range from −1–clearly unacceptable to 1–clearly acceptable) were used. This paper only presents the response to the thermal environment.
2.3. Subjects
In total, 41 subjects, 22 females and 19 males, participated in the two experiments. The average age of the subjects was 24.2 ±1.9 years. The order of the two exposures (i.e., temperatures studied) that all subjects participated in was randomized. The thermal insulation in the clothing worn by the subjects was similar in both cases: 1.05 ± 0.15 clo at 16 °C and 0.99 ± 0.21 clo at 18 °C.
2.4. Results of Human Subject Experiments
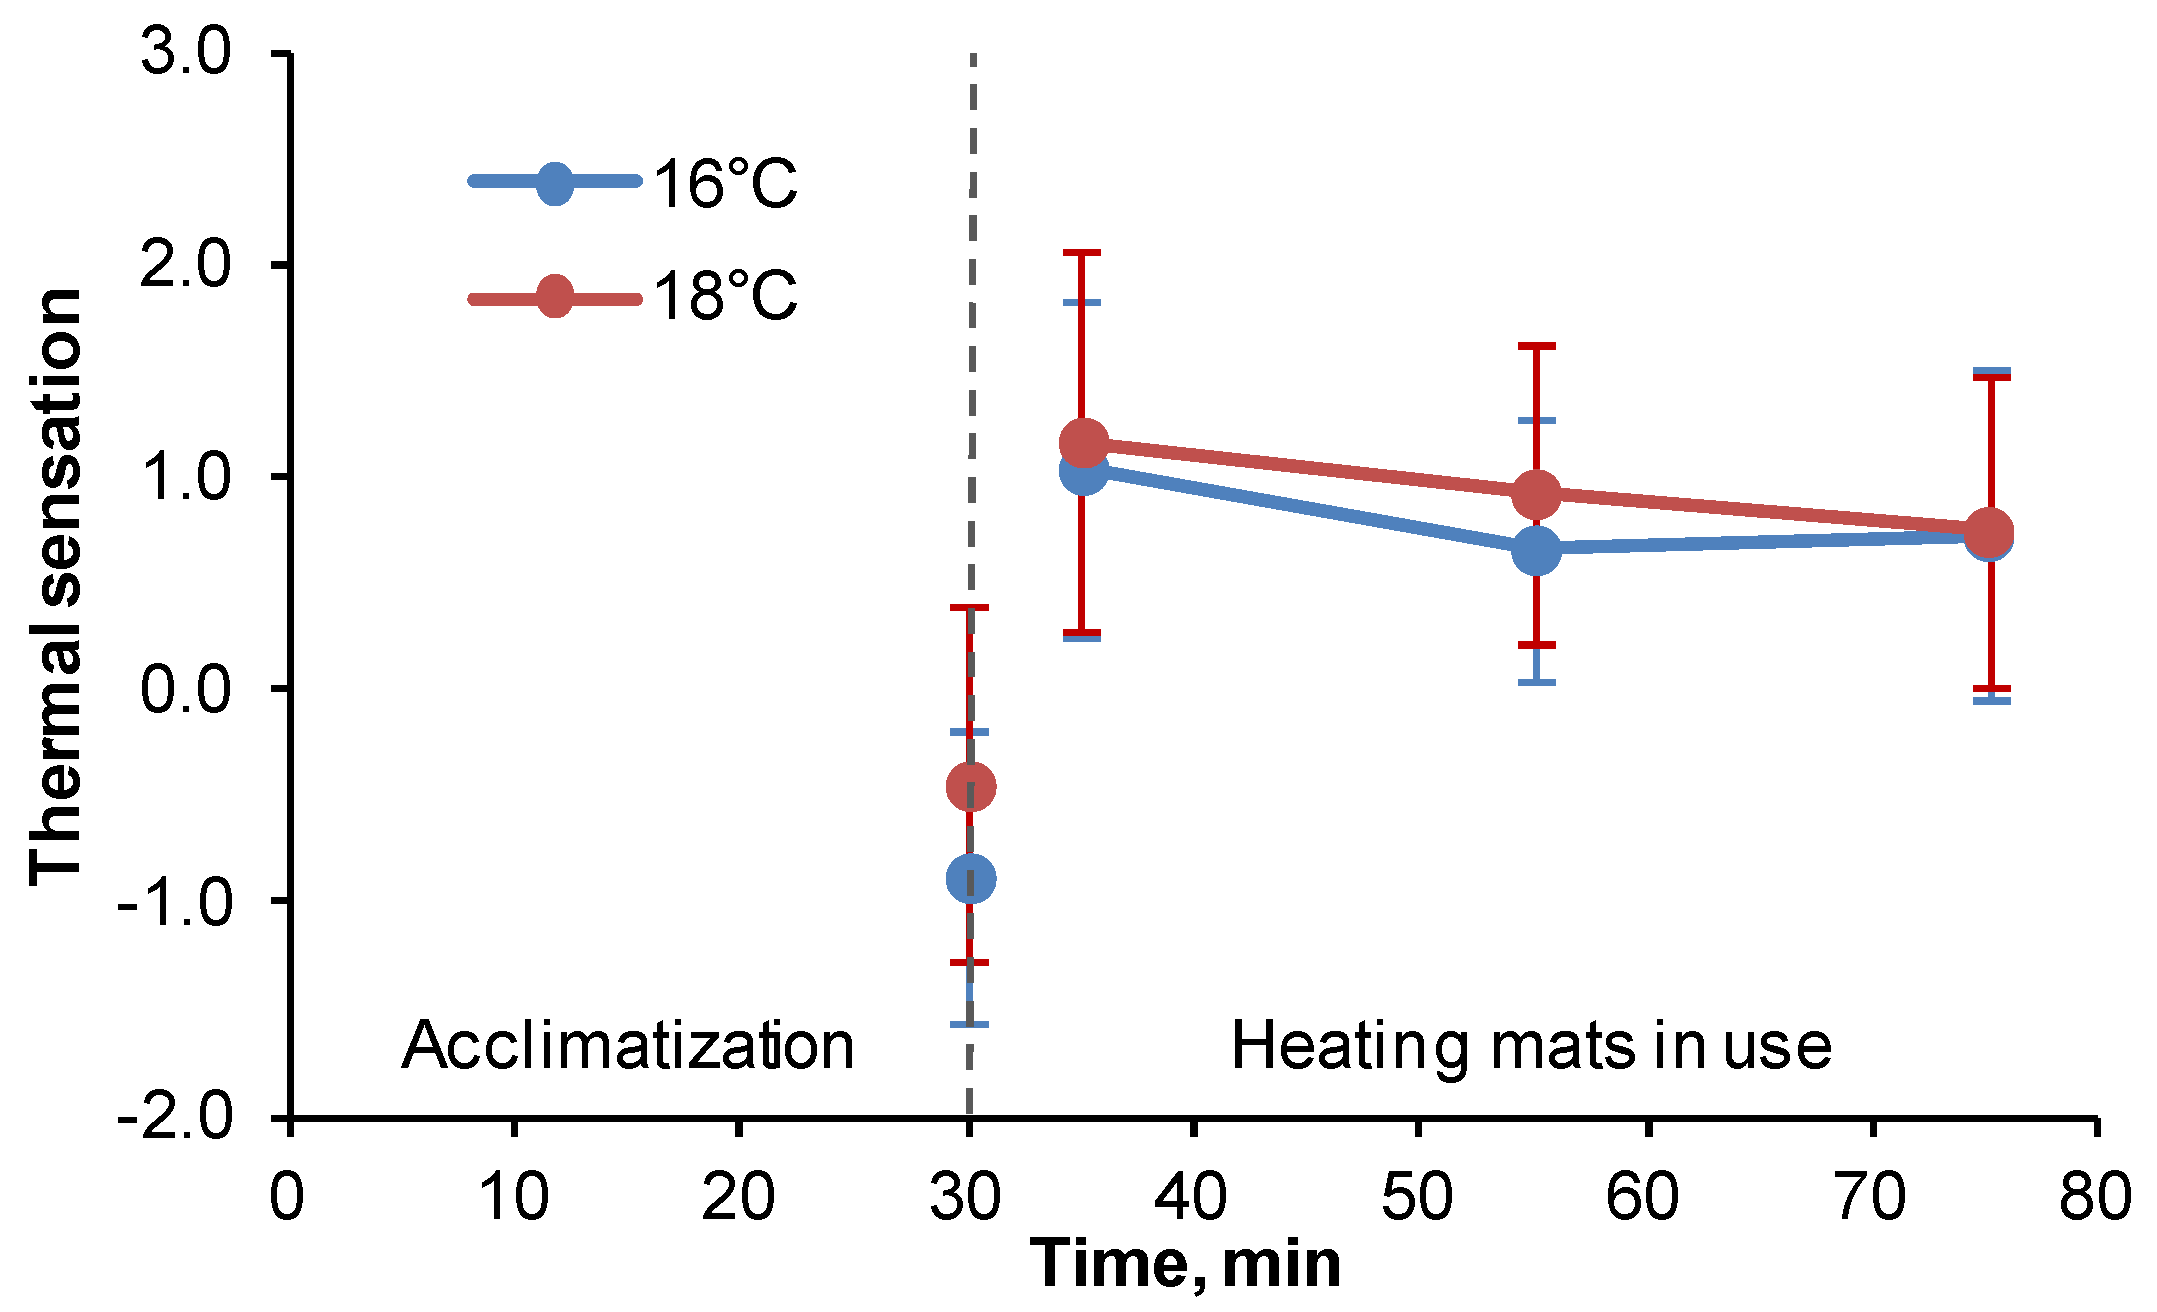
Subjective responses registered by questionnaires were coded and the data was analyzed using Statistica v.10. The average general thermal sensations reported during the experiments are presented in Figure 2. After an initial 30 min spent in the chamber without local heating, the average thermal sensation votes were below the recommended standard levels for category B according to [29] (category II [30]). At 16 °C, the average thermal sensation was −0.92, i.e., nearly “slightly cool”, while at 18 °C, the rating was only slightly below −0.5. The thermal sensation votes increased substantially (p = 0.02) during the second part of the experiment when local heaters were used. The highest sensation was observed immediately after taking place at the workstation with heaters. Later on, it decreased, reaching the same level of 0.7 at the end of both exposures.
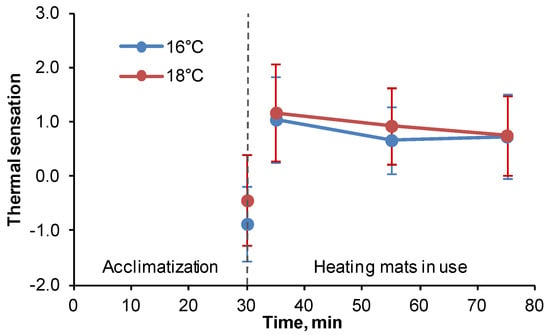
Figure 2.
Average general thermal sensation and standard deviation during exposures at 16 and 18 °C. Thermal sensation: −2—cool, −1—slightly cool, 0—neutral, 1—slightly warm, 2—warm, 3—hot.
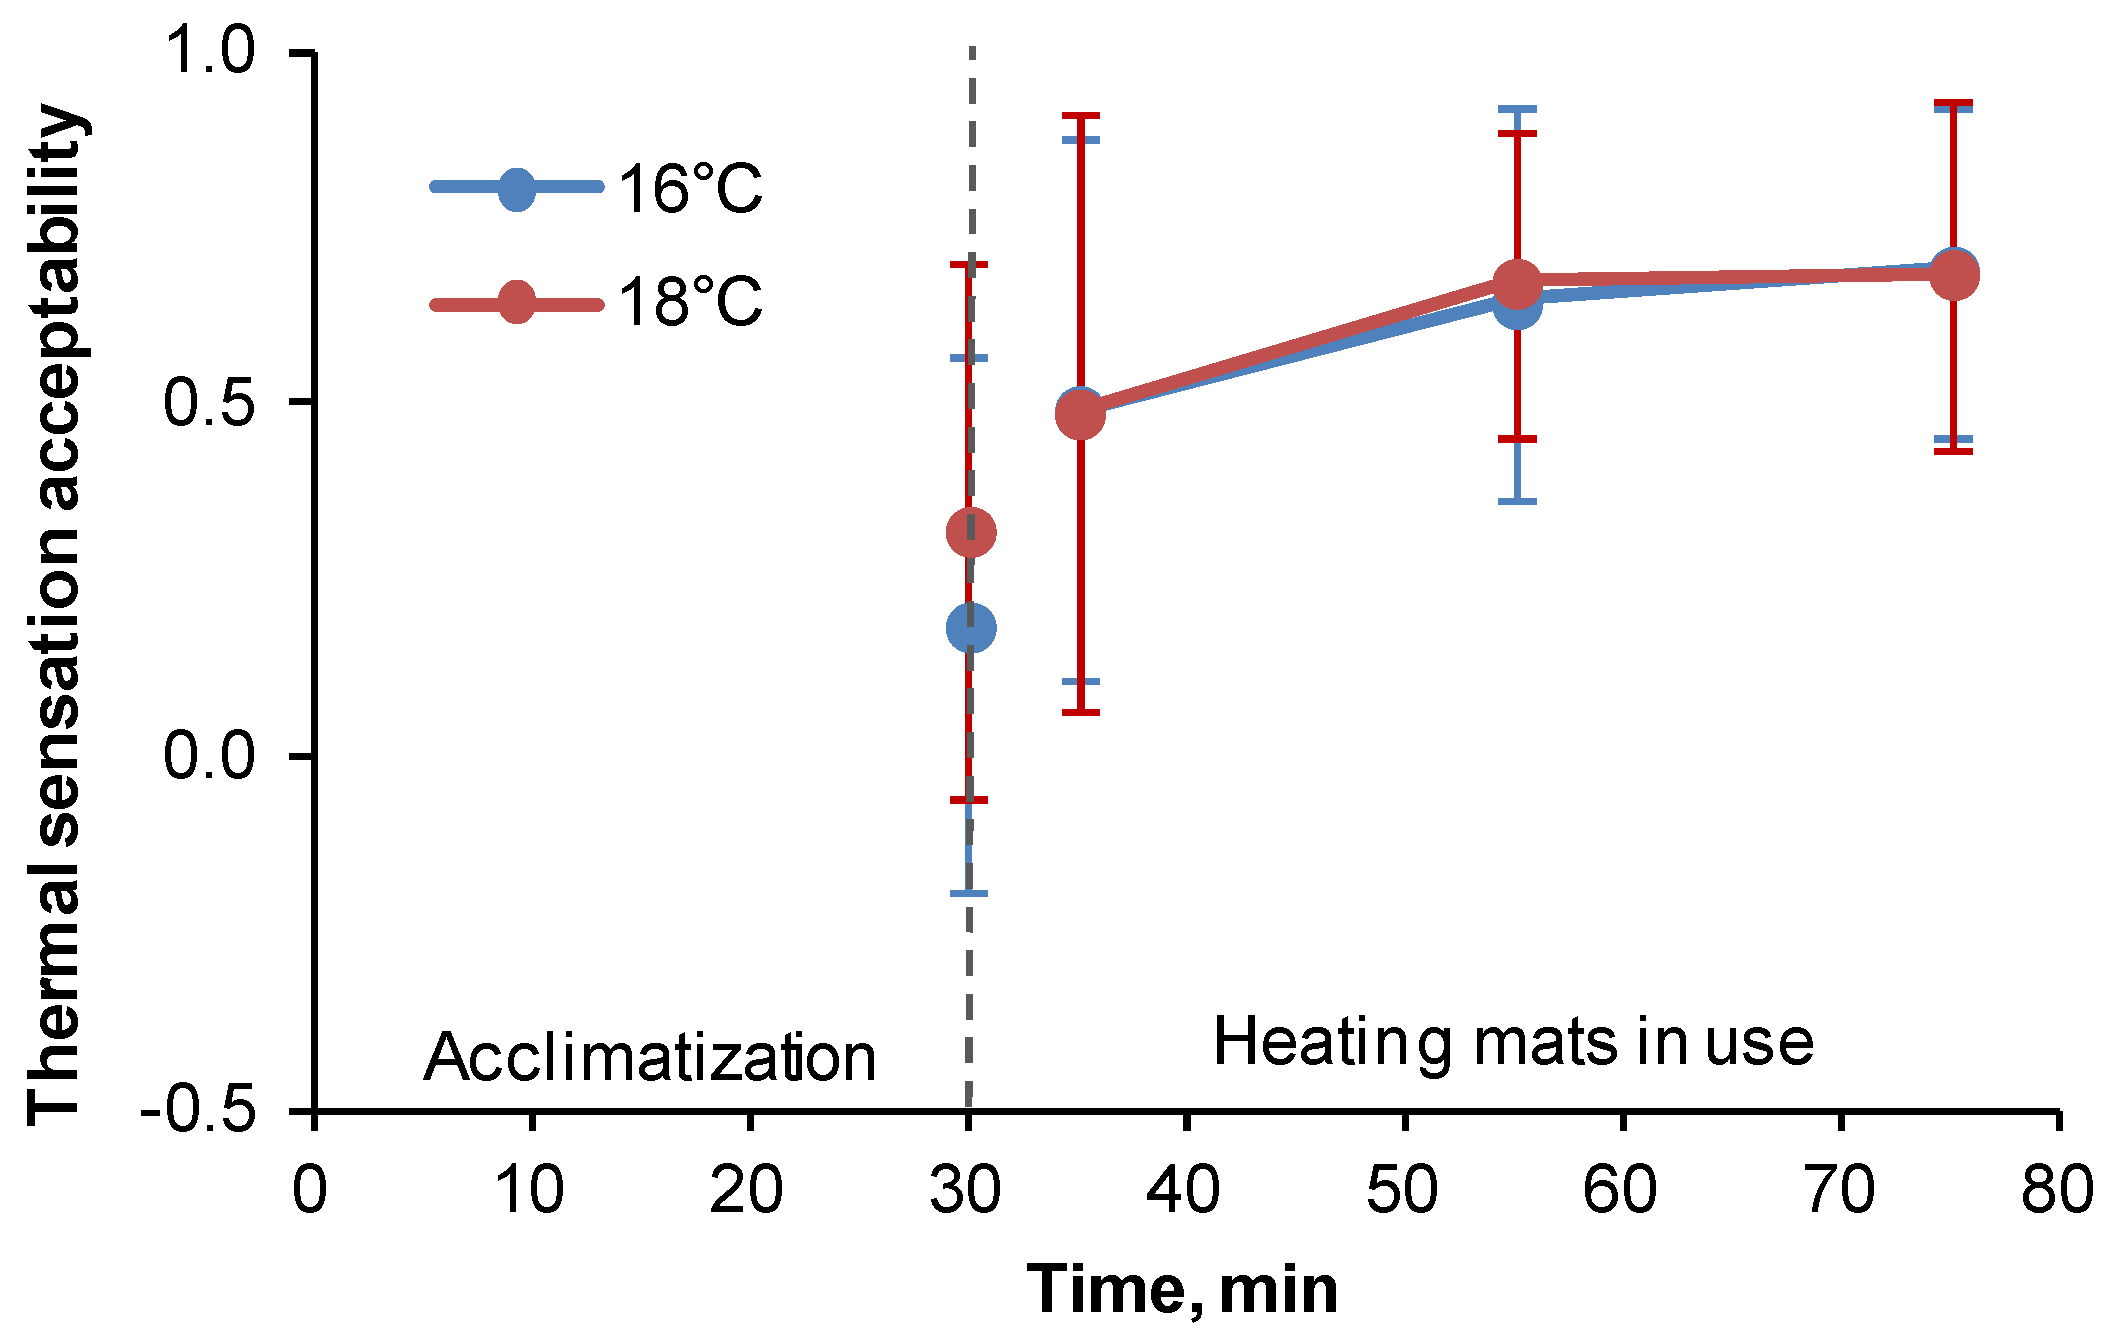
Significant improvement of the perception of the thermal environment was also confirmed by the acceptability votes, as presented in Figure 3.
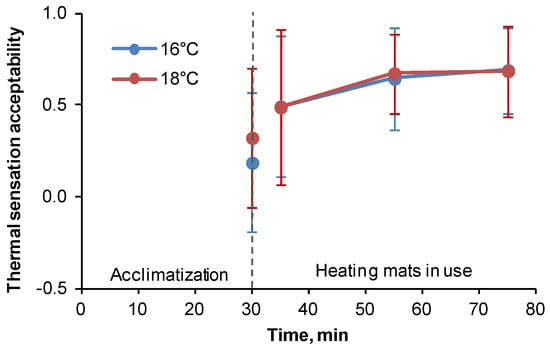
Figure 3.
Average acceptability and standard deviation of thermal sensation during exposures at 16 and 18 °C. Thermal sensation acceptability: −1—clearly unacceptable 0—just unacceptable/just acceptable, 1—clearly acceptable.
The acceptance of thermal sensation during the acclimatization period was much lower than in the later part of the study when heating mats were used. A particularly high improvement in the evaluated conditions was observed at the lower temperature of 16 °C. For this temperature, the assessment of thermal sensation acceptability increased by 0.3 on a scale of −1 (clearly unacceptable) to 1 (clearly acceptable), and for a temperature of 18 °C, slightly less, i.e., by 0.2. The acceptance of thermal sensation remained nearly constant during the remaining time spent in the chamber. For both temperatures, statistically significant differences were observed between the first and each subsequent acceptability assessment (p = 0.010; p = 0.001; p = 0.005), while the differences between the two temperatures were not statistically significant during the entire study.
Subjects regulated the power delivered to the mats throughout the whole duration of the experiment; however, the number of adjustments made decreased in time. This suggests that the subjects reached the preferred surface temperature of the mats. In general, the power settings were lower for the higher temperature, as shown in Table 1.

Table 1.
Average power settings.
After a 30-min acclimatization period in a cool environment, followed by a 5-min contact with the mats, few people decided to reduce the heating power, although more subjects at 16 °C than at 18 °C decided to do so. The heating power for all mats was set in the range of 93–98% of their maximum power. Under both conditions, most changes to the power were done until 55 min of the experiment. Later, subjects changed the settings only slightly. At the end of the exposure, the power reached 273 W at 16 °C and 410 W at 18 °C. The highest differences between the two conditions were observed for the mat located in the backrest of the chair and the smallest for mat 2 located under the table, where subjects had no direct contact.
3. Energy Simulations
The aim of this part of the research was to verify the potential energy savings for heating the industrial hall by lowering the temperature set-point in the entire hall and using electric heating mats at workplaces. Multi-variant analyses of the heat demand and energy consumption (in the heating season) for heating the workplaces up to the comfort conditions were carried out. The reference air temperature for comfort conditions was set at 20 °C, which is at the lower limit of the thermal comfort range [1,2] for light physical work. The power for central (overall) heating and additional local heating systems were compared.
3.1. Method
The energy analyzes were carried out for an industrial hall with a floor area of 96 × 34 m2 and height of 8 m (volume 25,900 m3) built using a light-frame construction technique. The hall may contain seating workplaces, such as machine operators, fitters, or seamstresses. The building selected had skylights in the roof (polycarbonate windows with a total area of 240 m2), thus reducing the impact of the building location relative to the sun with regard to internal solar gains. The external walls and roof were made of steel sheets with a solid polyurethane core (walls 8 cm, roof 10 cm). Heat transfer coefficients were set to: U = 0.21 W/(m2·K) for the roof, U = 0.26 W/(m2·K) for the walls, and U = 3.0 W/(m2·K) for the skylight. The solar heat gain coefficient for the skylight was set at 0.71. The external walls of the hall meet the insulation requirements for heated industrial buildings erected in Poland since 2008 [31]. Older non-retrofitted buildings may be characterized by poorer thermal performance, but it should be emphasized that in Poland and other European countries (e.g., Germany, Czech Republic, Austria), current standards set higher requirements imposing highly insulated buildings. Therefore, the presented case represents the average of buildings erected in the last 10–15 years. The longer walls had an east-west orientation.
The analyses were performed by numerical simulation with the use of the integrated energy modeling tool, ESP-r [32]. The simulation tool allows integrated calculations of the heat and mass transfer in the building to be performed. The thermal model of the hall (one zone model) includes the following heat fluxes: Through the external walls, skylights, and doors; heat flux resulting from solar radiation and air infiltration into the building; sensible and latent heat gains emitted by occupants; sensible heat gains emitted by internal machines and lights; and those emitted by the heating mats installed at the workstations.
The calculations were based on the following assumptions:
- The hall is occupied all week (i.e., 7 days) from 6 am to 10 pm (two typical work shifts per day);
- During the night (from 10 pm to 6 am), the temperature set-point is 16 °C, with only the central heating system in operation;
- The hall is naturally ventilated; the mean air change rate is assumed to 0.5 h−1;
- The heat gains from one person: Qsensible = 97 W, Qlatend = 51 W, is 50% of the sensible heat gains emitted by convection and 50% by radiation;
- The heat gains from equipment (machines + lighting) varied from 10 to 60 W/m2: Six cases are listed in Table 1; and
- The outdoor conditions are in accordance with the typical meteorological data for Poland [33] (site Krakow, temperate climate, typical of Central Europe: Tmin = −19.6 °C, Tmax = 31.9 °C).
All simulations were carried out with a one-hour time step for the period from October to April (total 5088 h). In this period the outdoor temperature changes in the range from −19.6 to 24.7 °C with an average value of 2.7 °C.
A series of computer simulations were performed, resulting in instantaneous and seasonal heat demand for the entire heating zone. Three variants of indoor air temperature control strategy for the heating system’s operation were assumed (Table 2). Each variant was calculated for the six levels of internal heat gains and four numbers of occupied workplaces according to Table 2.

Table 2.
Analyzed cases.
Maximum heating powers for the local heating (heating electrical mats) for one workplace were adopted according to the results of human subject experiments. It was assumed that if the workplace is heated from 16 to 20 °C (excluding 20 °C), the local heating power is 410 W, while from 18 to 20 °C (excluding 20 °C), the local heating power is 373 W.
The seasonal energy consumption for heating up the entire hall was calculated by dividing the seasonal heat demand (obtained from simulation) by the average total efficiency of the building’s central heating system.
Comparative analysis of the heating systems was made taking into account only the part of the energy needed for heating the hall (by the central system) and workplaces (by the local system) from 16 °C or from 18 °C up to 20 °C during working hours (3392 h from October to April).
3.2. Results
The share of internal heat gains in the room’s thermal balance significantly affects the instantaneous and seasonal heat demand. During periods of high internal heat gains, the heat demand drops to zero even in the cooler months, such as January. For the entire heating season, the time of heating the hall to 16 °C is 1200–4650 h, which constitutes 23–91% of the season, depending on the case, i.e., the number of workplaces and additional internal heat gains. The operation time of the central system, when the hall is heated to 18 °C, during working hours increases, on average, by about 200 h, which is only 4% of the heating season. The maximum instantaneous heating power ranges from 190 to 203 kW, depending on the case, and the seasonal heating demand ranges from 19 to 99 kWh/m2. The heating of the hall to 18 °C during working hours increases the maximum power of the central system to 228 kW, and the seasonal heat demand increases by an average of 14%.
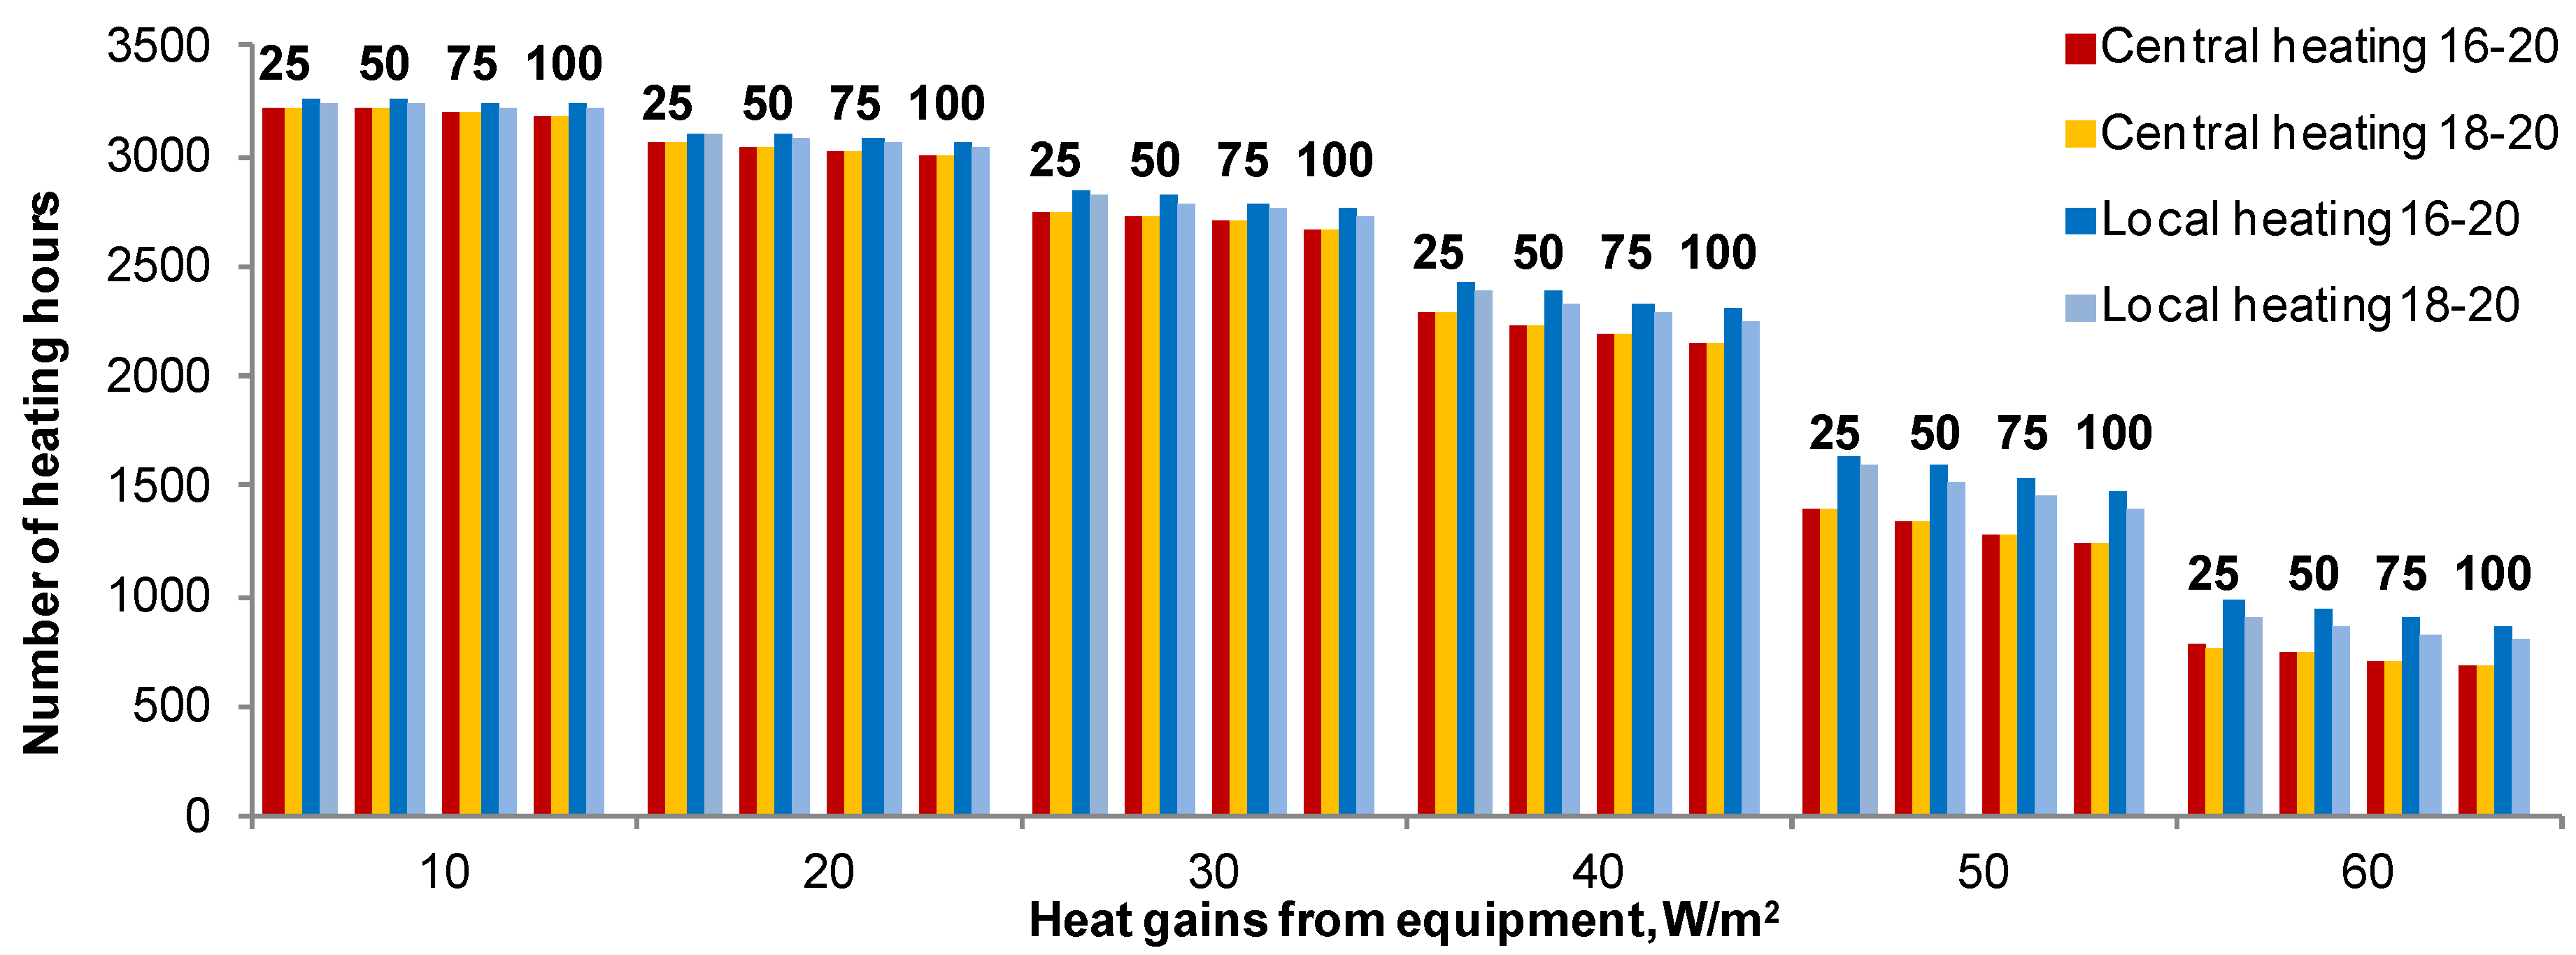
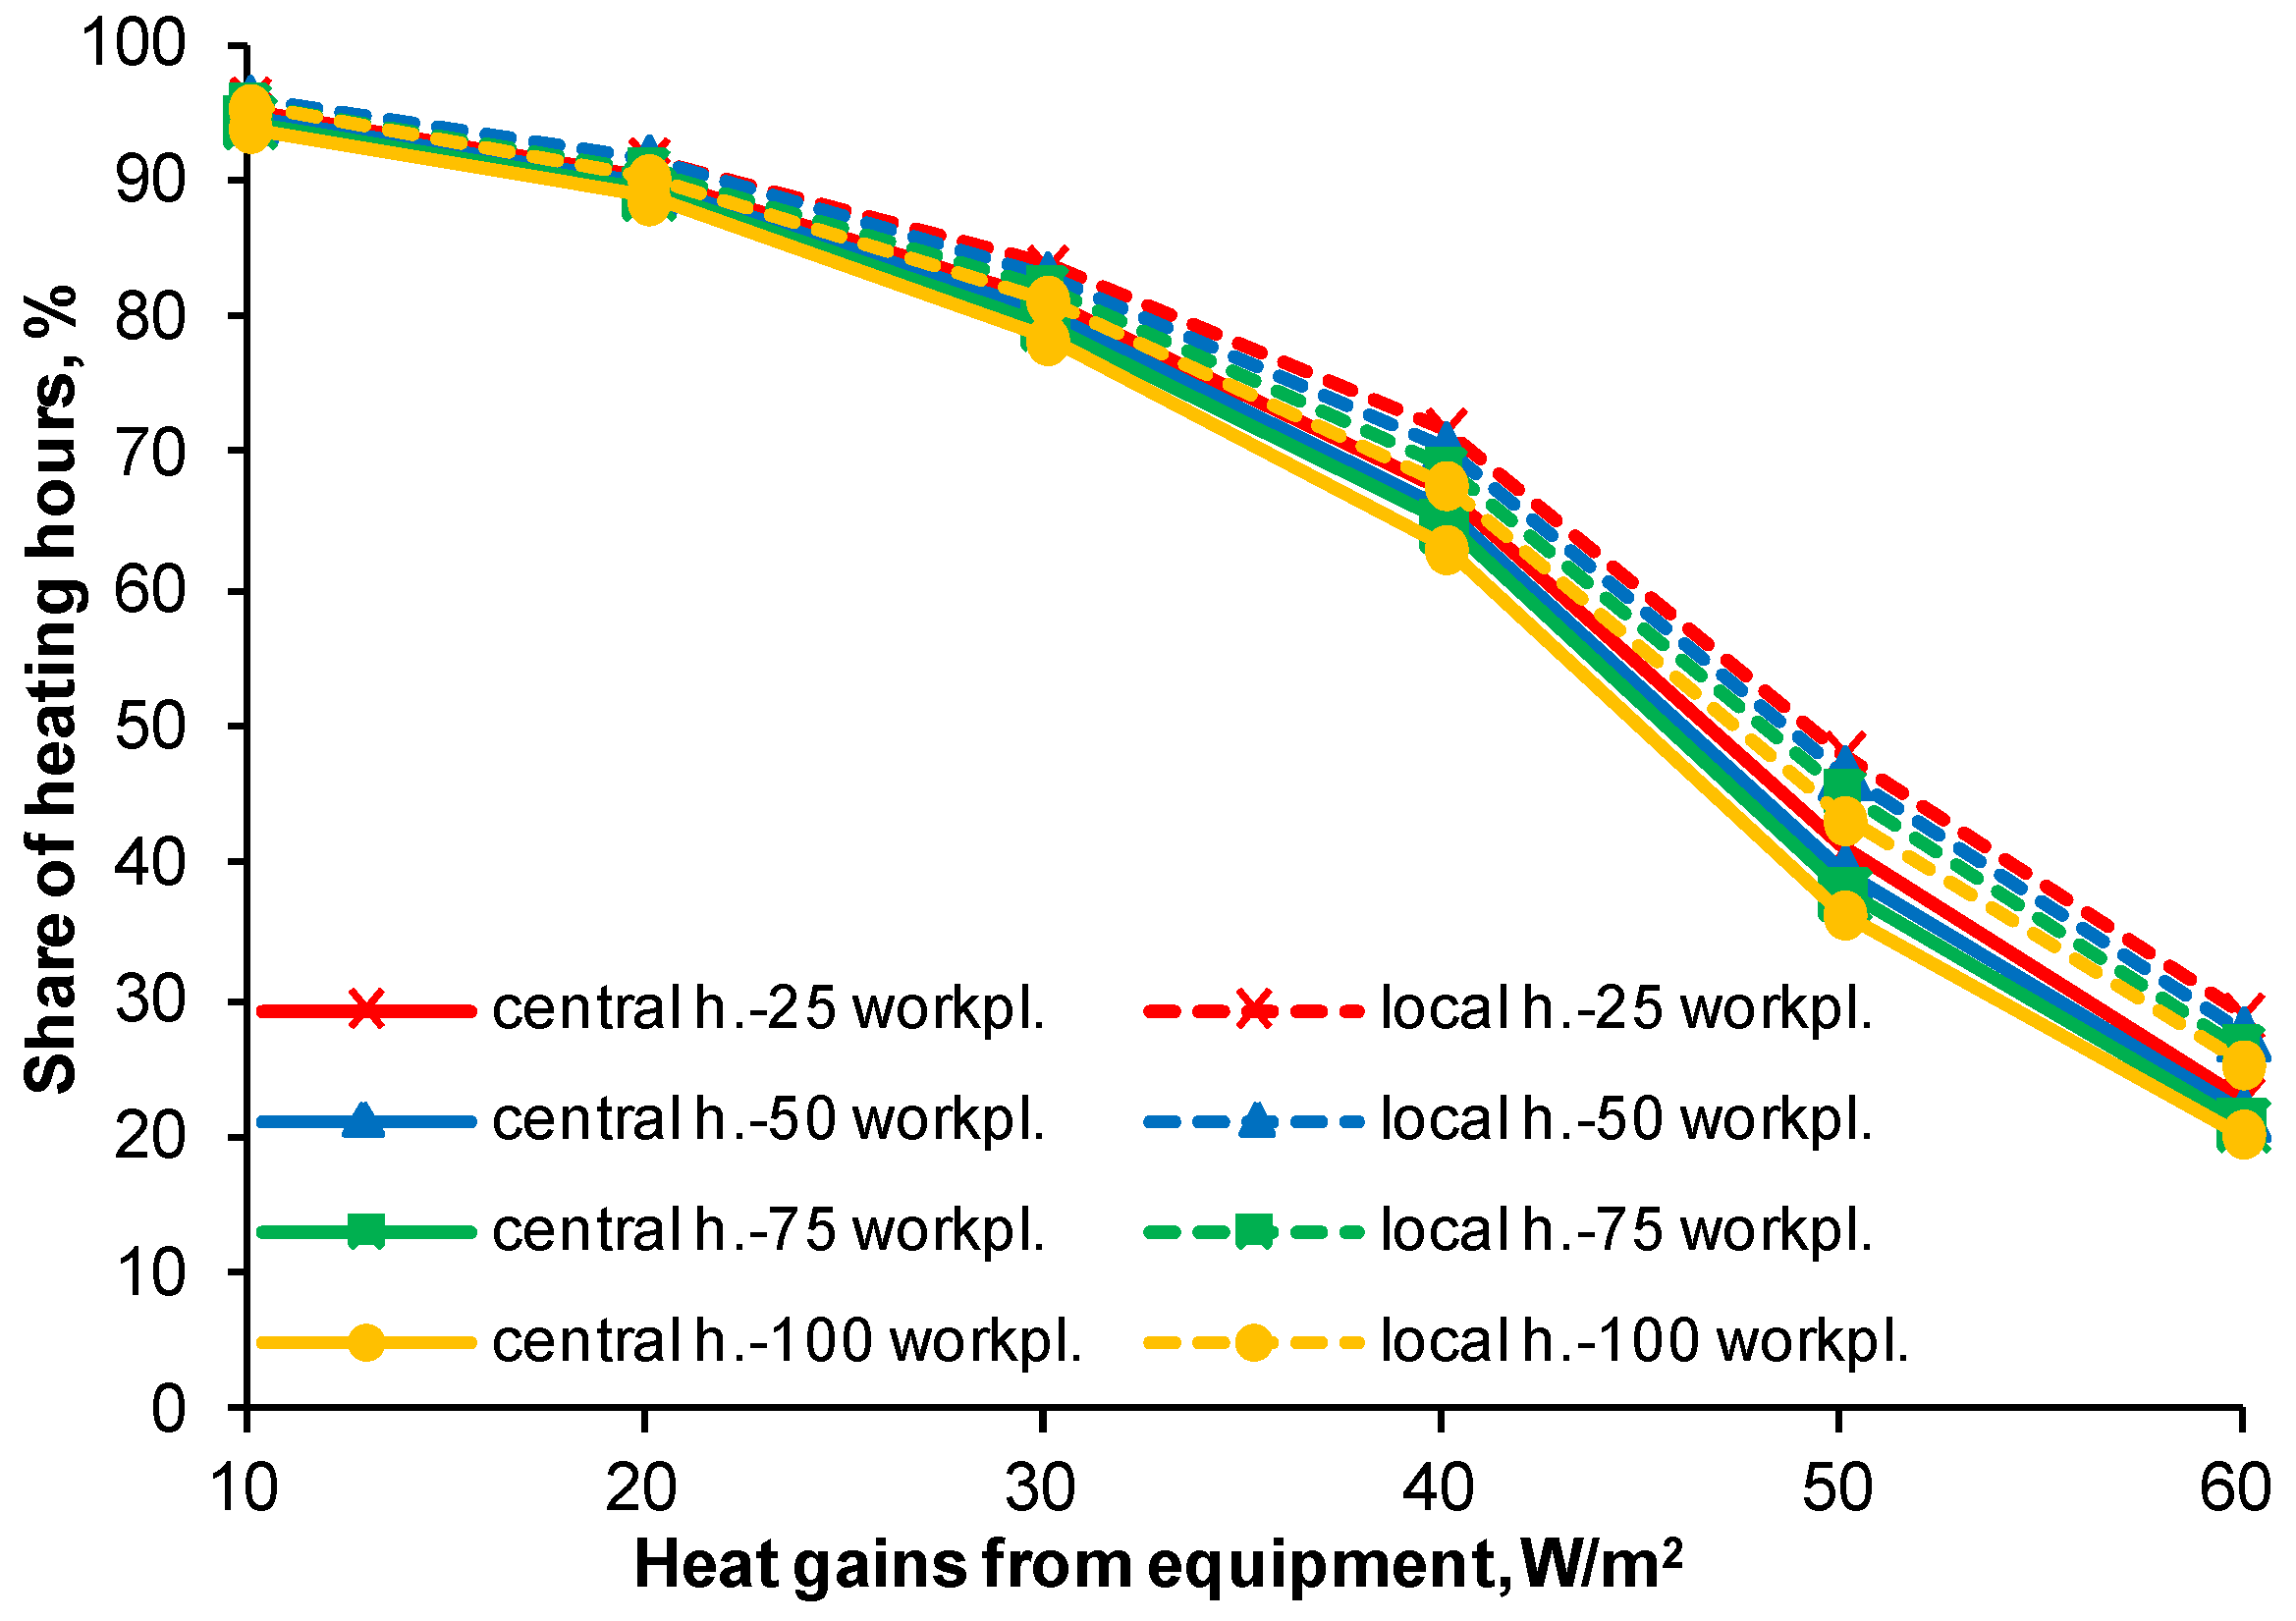
The number of operational hours necessary for heating from 16 to 20 °C and from 18 to 20 °C for the local and central systems is shown in Figure 4. In turn, Figure 5 shows the fraction of the corresponding time of operation in total working hours. With the central system, the number of hours for heating from 18 °C is practically the same as for heating from 16 °C. The differences, which do not exceed 3 h, occurred mainly for cases with the largest internal heat gains. On the other hand, the local system operating time for heating from 18 °C is slightly shorter but no more than 3% of the work time compared to the 16 °C cases.
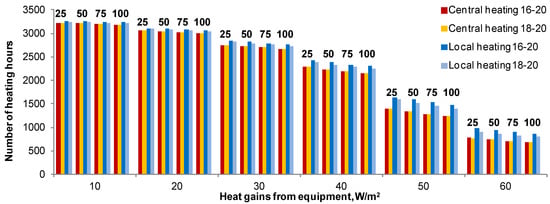
Figure 4.
Number of hours for the entire hall or just workplaces heating from 16 to 20 °C or 18 to 20 °C with central and local systems for all the cases investigated (number of workplaces are indicated above bars).
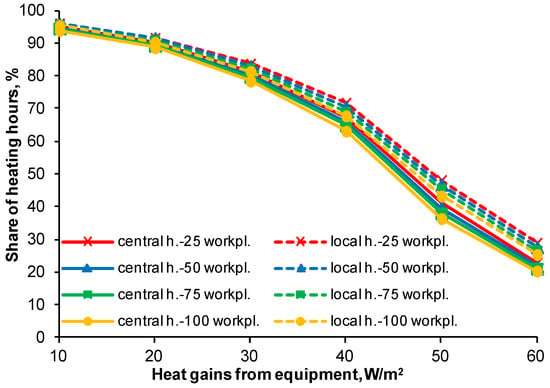
Figure 5.
Percentage share of heating operative hours in the working period, heating from 16 to 20 °C with central and local systems for the cases investigated.
With just central heating, due to the greater instantaneous amount of heat transferred to the room, the heat accumulation in the walls increases, thanks to which the number of heating hours for the total season is smaller compared to the local heating cases. The number of heating hours using a central system is lower by 1% for the low internal heat gains variant (10 W/m2) and by as much as 21% for the large internal heat gains variant (60 W/m2). When heating from 18 °C is compared, the differences are from 1% to 15%, respectively. Increasing the indoor temperature over 16 °C in the entire hall during working time with the use of a central system also results in a reduction in the heating demand at night, due to heat accumulation in the walls. During the heating of the hall to 18 °C, the seasonal demand for heat at night decreased by 4% on average, and for heating to 20 °C by 10% on average.
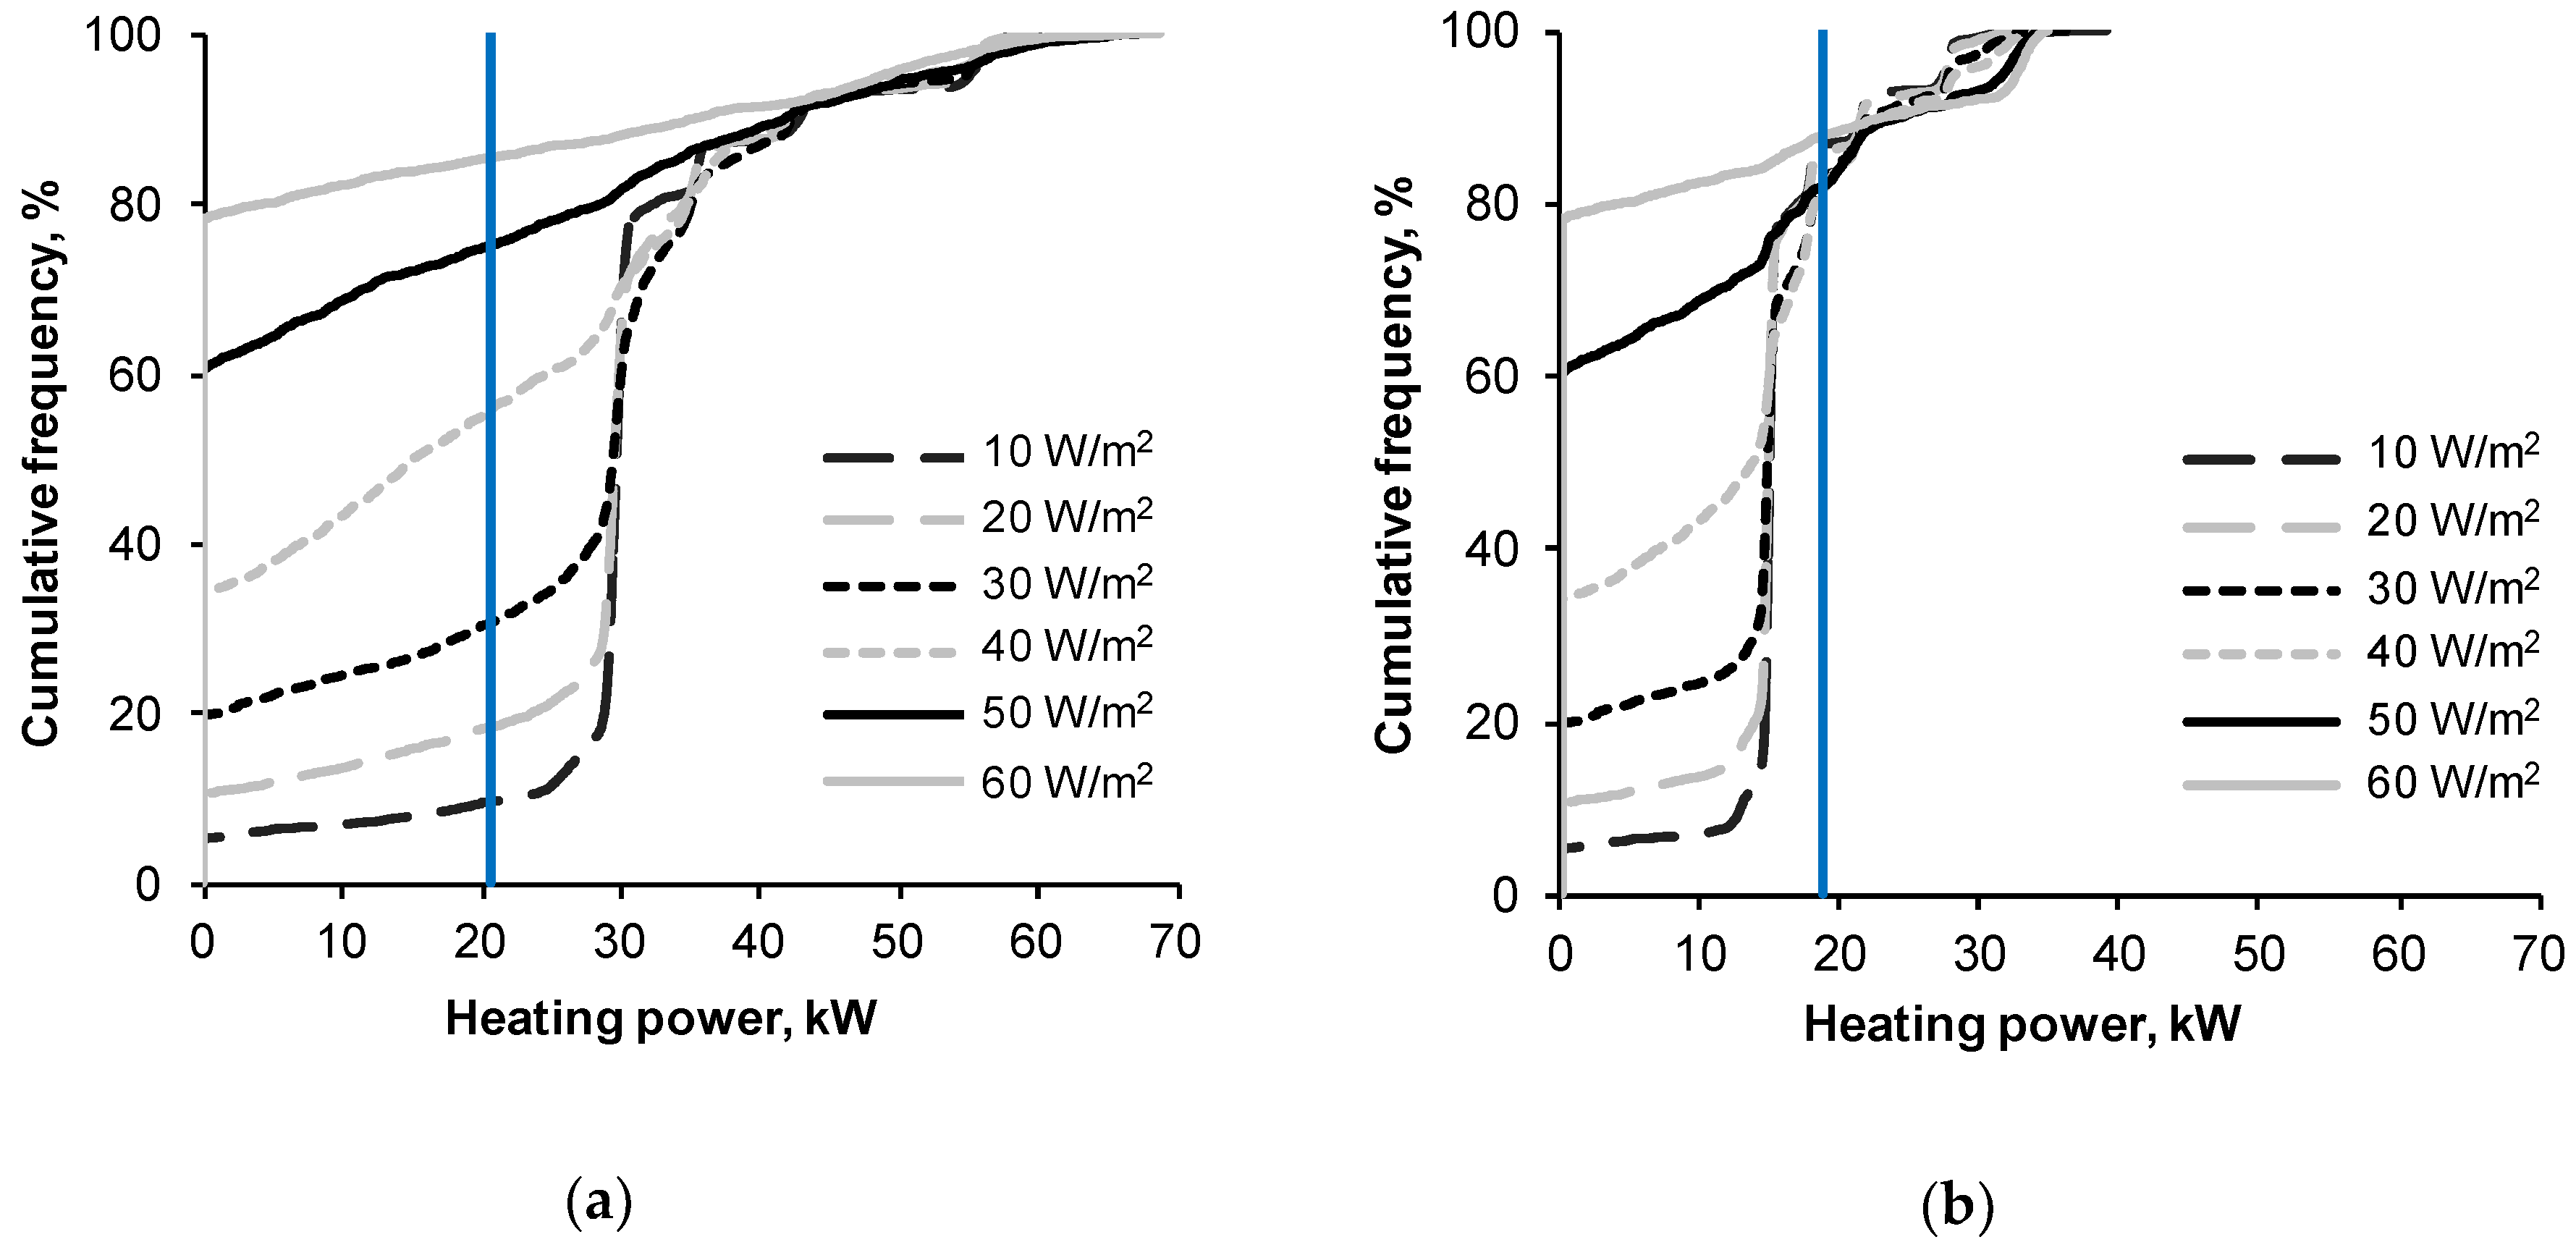
Although for local heating systems the operating time is longer, the maximum instantaneous heating power in this case is considerably lower. For the local heating from 16 °C, the maximum total power for all workplaces is 10 (for 25 seats), 21 (for 50 seats), 31 (for 75 seats), and 41 kW (for 100 seats), respectively. In contrast, Figure 6 shows the distribution of the instantaneous heating power of the central system over the entire heating season for a case of 50 workstations. The values of instantaneous power are higher for the smaller internal heat gains. However, it can be seen (Figure 6a) that for the case of 30 W/m2 for 70% of the heating season, the values are greater than 21 kW, i.e., a total heating power of 50 heating mats. In the case of 25 and 50 workplaces with heating from 16 °C for most of the heating operation time, the local heating system has less total power compared to the central heating system. In the case of heating from 18 °C, this benefit only occurred for the case for 25 workplaces. As can be seen in Figure 6b (for 50 seats), during 80% of the season, the central heating power is less than the total power of 50 heating mats. The instantaneous heating power of the central system significantly decreases by 40% compared to the variant of heating from 16 °C, and the power of local heating is only 9% lower. The time in which the instantaneous local heating-up power is smaller compared to the central heating-up power increases in cases of large internal heat gains. The heating time is then significantly reduced, and the maximum instantaneous heating demand of the entire hall remains high (Figure 6).
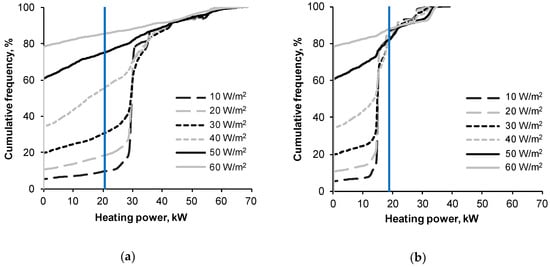
Figure 6.
Cumulative distribution of the instantaneous heating power necessary for workplace heating using central heating (50-workplace case), from 16 °C (a) and from 18 °C (b) and the total heating power for a local system (blue).
The instantaneous heating power and the system’s operating time have a significant impact on seasonal energy consumption for heating the entire hall or only workplaces. Seasonal energy use in overall heating also depends on the system’s efficiency, which is a function of the heat generation efficiency, heat control efficiency, and heat transfer efficiency. The most efficient systems, such as electric heating systems, have an average seasonal total heating system efficiency of 97%. Traditional water heating systems have an efficiency of less than 80%.
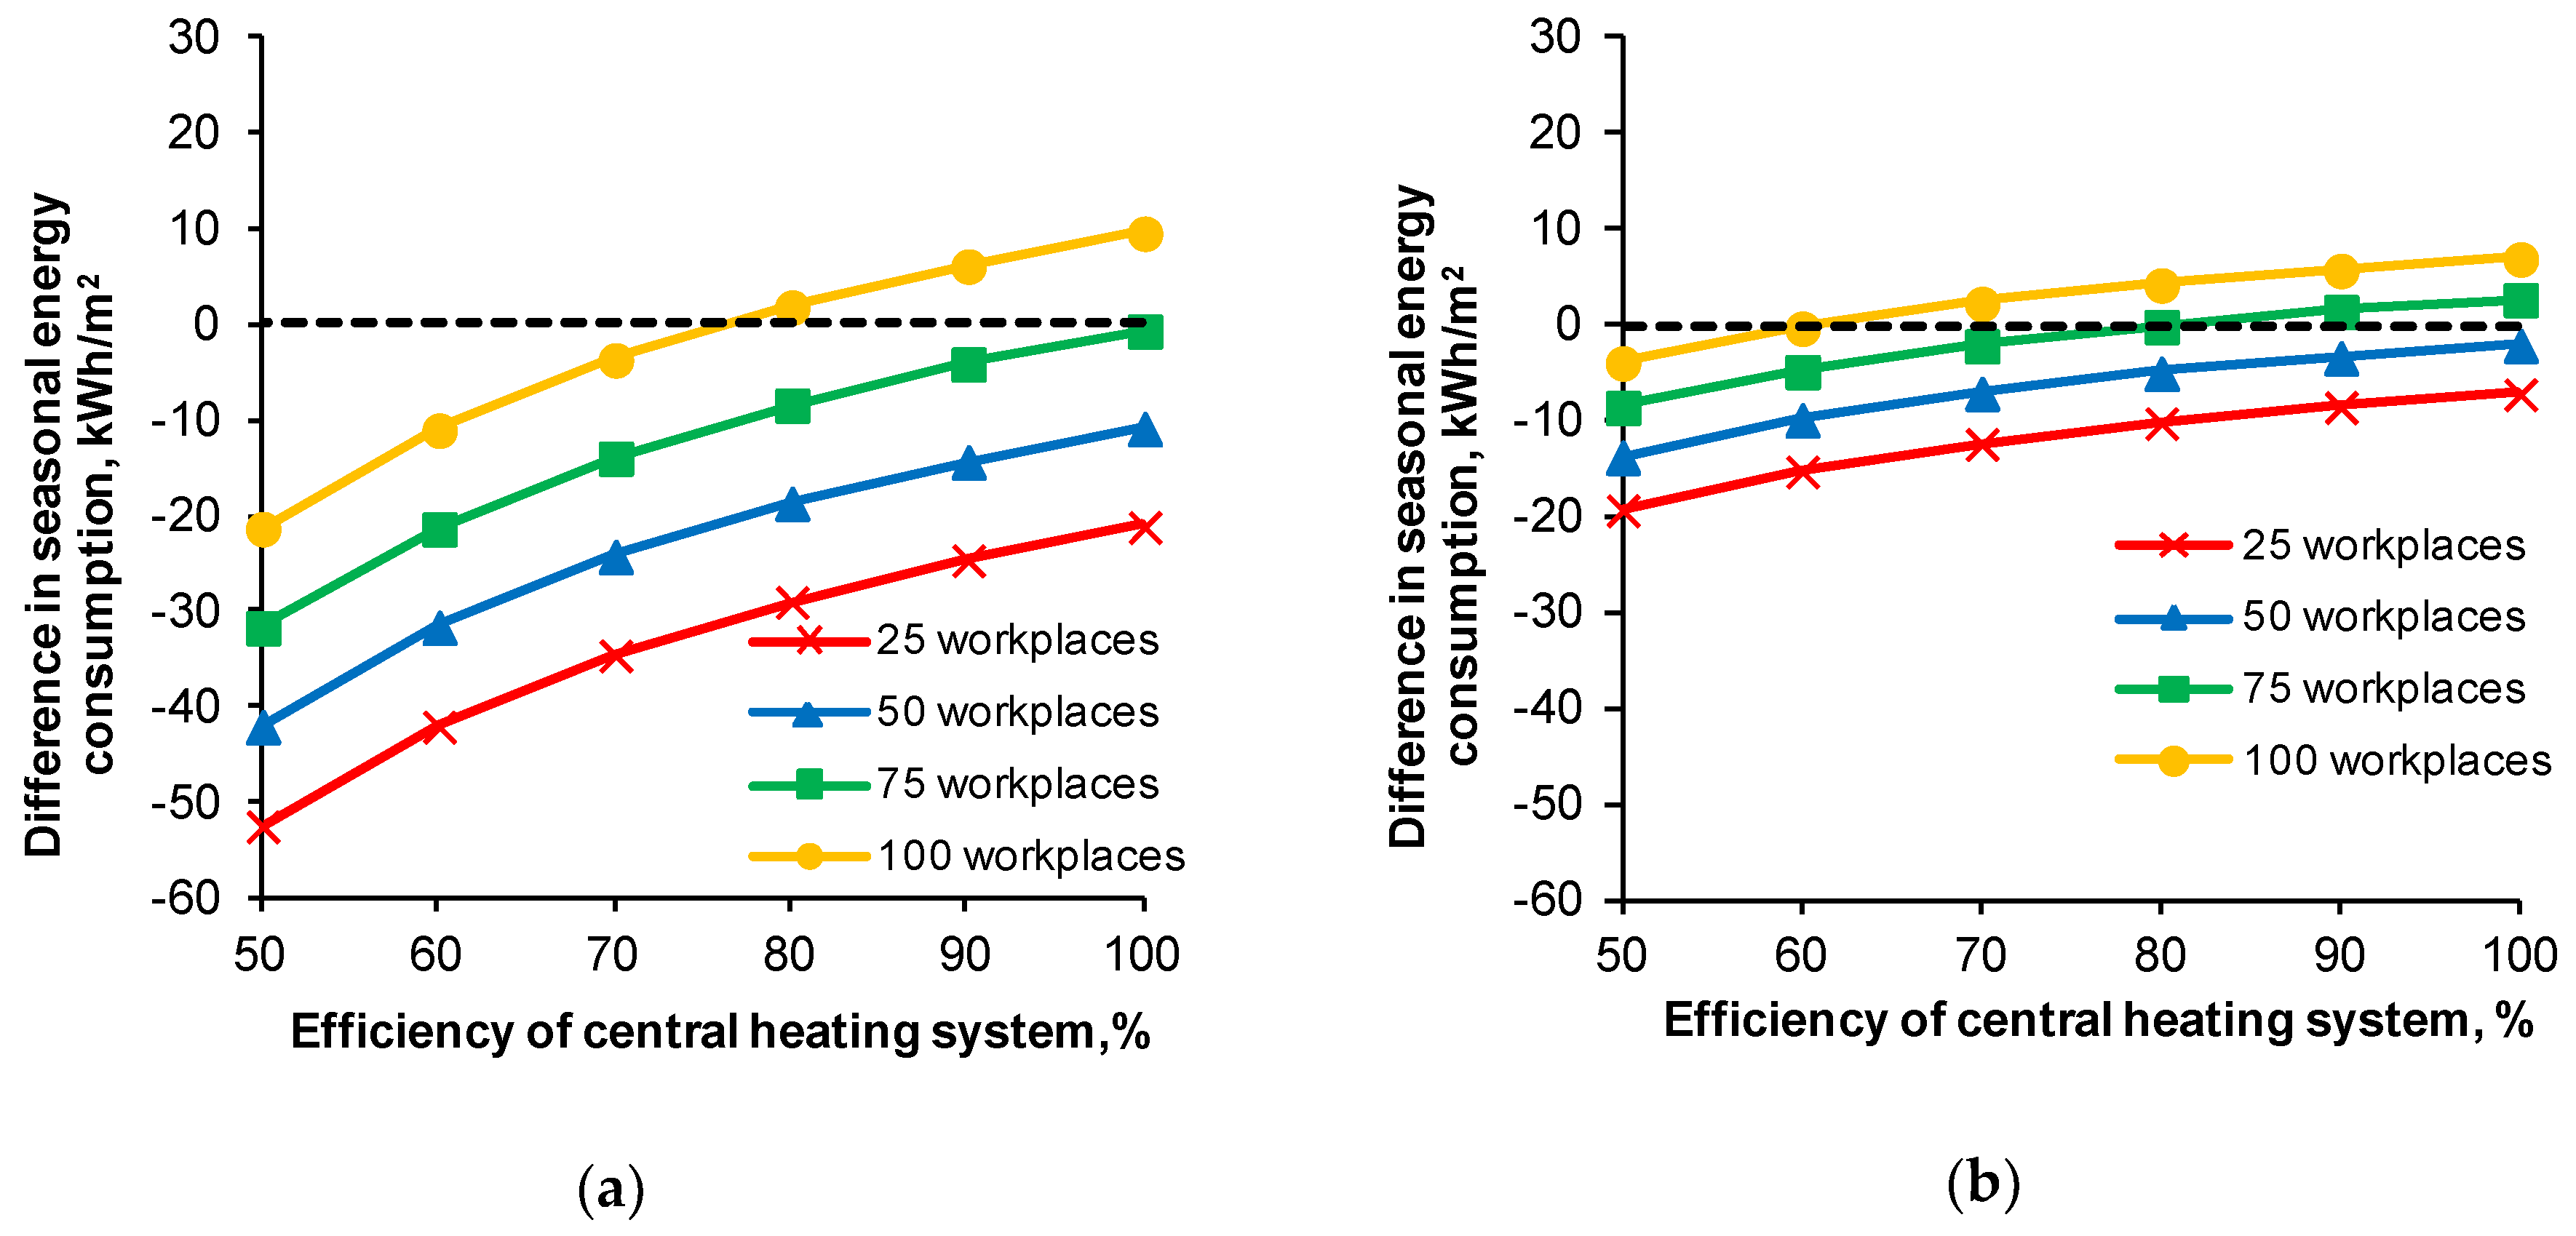
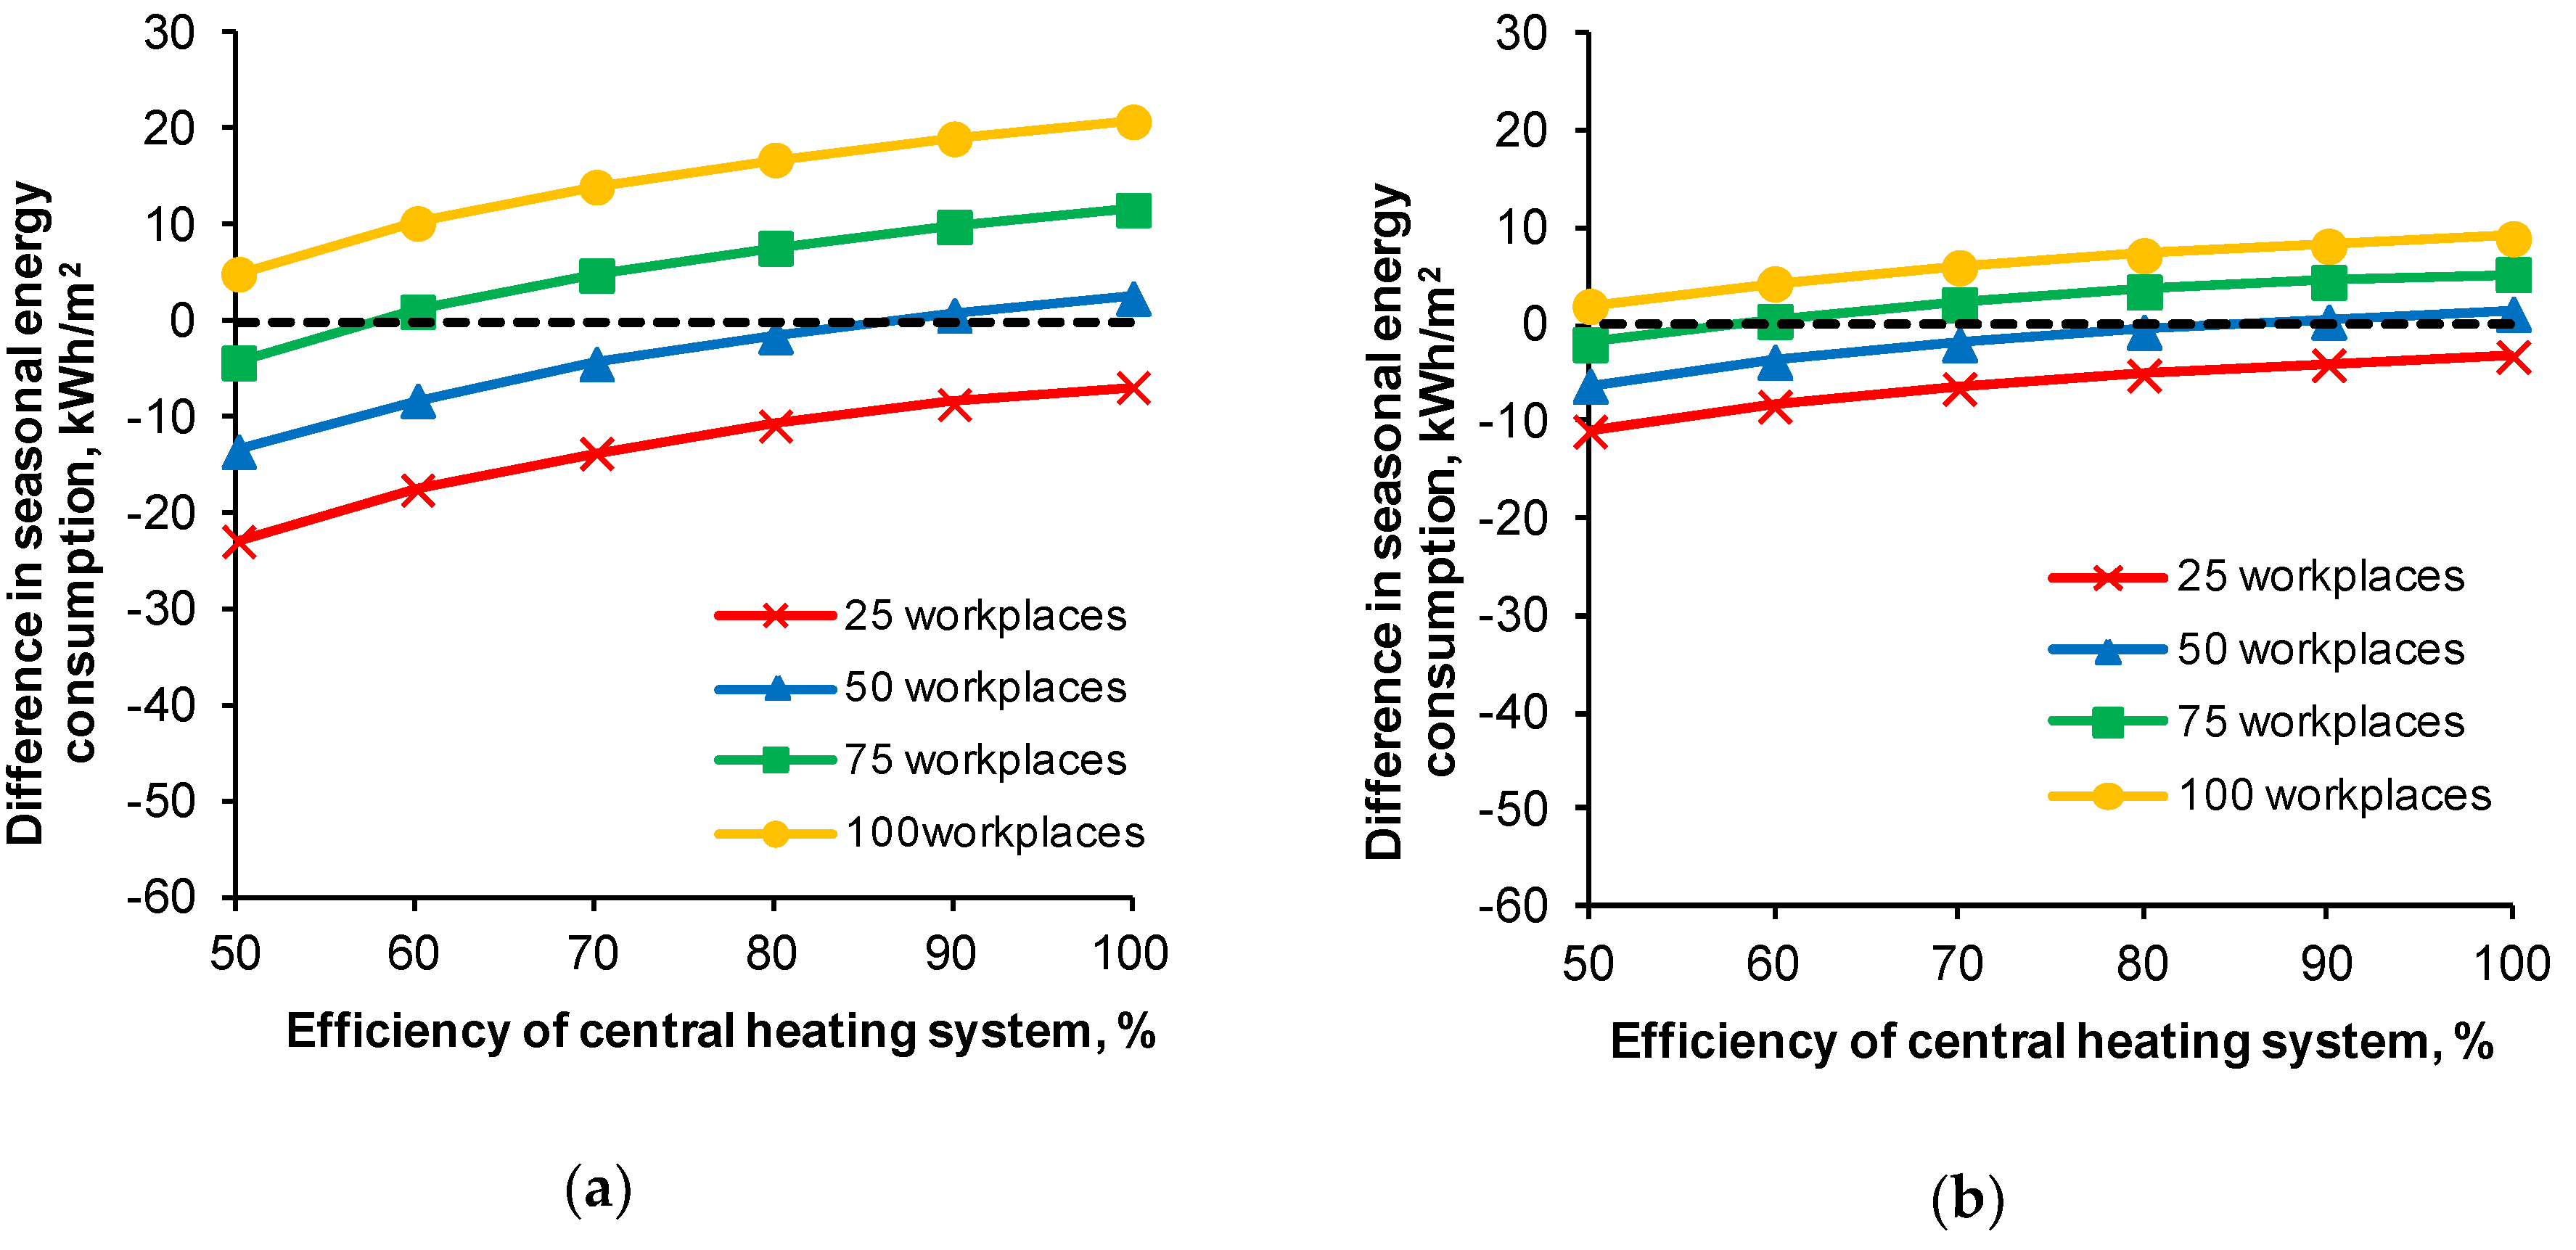
Figure 7 and Figure 8 present (for two selected variants of internal heat gains) the differences in seasonal additional energy consumption for heating up workplaces from 16 °C and from 18 °C to comfortable conditions by the local system in relation to the central system as a function of the efficiency of this system.
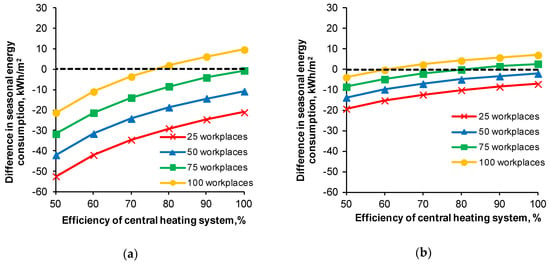
Figure 7.
Difference in the seasonal additional energy consumption for workplaces heating from 16 °C to a comfort temperature with a local system in comparison to a central system for two internal heat gains variants: 10 (a) and 50 W/m2 (b).
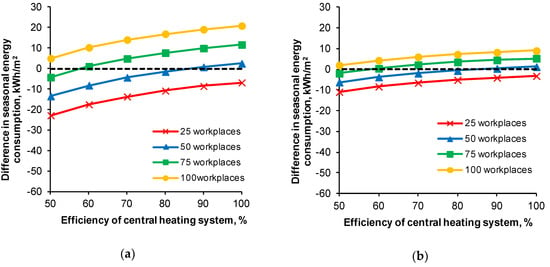
Figure 8.
Difference in the seasonal additional energy consumption for workplaces heating from 18 °C to a comfort temperature with a local system in comparison to a central system for two internal heat gains variants: 10 (a) and 50 W/m2 (b).
When heating from 16 °C and with low internal gains (10 W/m2), the local system is energy-efficient at 25, 50, and 75 workplaces regardless of the efficiency of the central system. At 25 workplaces, the seasonal additional energy consumption is, on average, 75% lower (in the range of 67% to 84% for 50–100% system efficiency) compared to the energy consumption in central heating. For 50 workplaces, an average saving of 29% is achieved. For the 100-workplaces case, the local system is advantageous only compared to a central system with low efficiency (below 75%). With the same heating option but with higher internal gains (50 W/m2), the local system gives less benefits. It is still more energy-efficient at 25 and 50 workplaces regardless of the efficiency of the central system. At 75 and 100 workplaces, it is better compared to a central system, with the efficiency below 80% and 60%, respectively.
When heating up from 18 °C, only the 25-seat option is cost effective. In this case, depending on the efficiency of the central system and the variant of internal heat gains, the percentage benefits range from 41–71%. At the 50-seat option, only the local system is more energy efficient than central low-efficiency systems (below 85%). With 75 and 100 workplaces, the central system is more profitable in almost every analyzed case.
4. Discussion
The test results confirmed that the use of heating mats significantly increases the thermal sensations of the subjects (p = 0.02), improving the level of perceived thermal comfort. The largest increase was observed immediately after sitting down at a workstation with operating heating mats. This effect was, undoubtedly, caused by the fact that the mats were initially set at 100% of their power before the subjects sat at the workstation. However, it was also influenced by the way people react to instantaneous changes in thermal conditions and/or activity level, which is expressed by “over-regulation” of the thermal sensation [34,35]. Later on, a decrease in thermal sensation was observed by the subjects, which was also associated with a gradual decrease in the power of the heating mats. At the end of the experiment, the thermal sensation was assessed at a level of 0.7 in both test conditions, i.e., operational temperature of 16 and 18 °C. This result indicates that people whose thermal sensation was initially below neutral preferred to feel warmer rather than neutral. Analyses of data from real buildings, presented in the literature [36], show a similar direction of preferred thermal sensation in relation to the current one. It was shown that people feeling slightly cool (−1) wanted to feel neutral (0), and people feeling cool (−2) would prefer to feel slightly warmer (+1). The results of this study show that people who have a real impact on shaping the thermal environment, i.e., on their thermal sensations, in a cool environment (thermal sensations close to −1) choose such settings of heating devices that provide them with thermal sensations above neutral. The results of the performed experiments confirm that the application of local heating with the three mats provides preferred thermal conditions for occupants in rooms with temperatures as low as 16 °C. The higher thermal sensation votes corresponded to a higher evaluation of the acceptability of the sensation. However, the correlation between these ratings was low, r = 0.43.
The registered average total power used for the local heating system tested in this study was 373 W for 18 °C and 410 W for 16 °C. It was higher than the power reported in tests of similar systems, e.g., the power of two heating mats mounted under and above the desk [26], where it was about 260 W (with a maximum power of 325 W). The higher values reported in this study may result from the fact that one more mat was used, but it could also be due to a slightly different testing procedure. In both studies, a 30-min acclimatization was allowed before the subjects started using the mats. However, in the experiments reported, during acclimatization, people stayed at the same temperature conditions that were used during the test, while during the experiments described in [26], the room temperature for acclimatization was 21–23 °C. In this case, the initial thermal sensation of people was different (neutral), which could affect the settings.
The results of the simulation analyses showed that using local systems and a strategy to reduce the temperature set-point for the room resulted in a reduction of energy consumption, which confirmed the relation indicated in earlier studies [2]. The analyses showed that heating workstations with local systems in halls with a temperature of 18 °C is much less energy efficient than in rooms with a temperature of 16 °C. The number of hours needed to heat up the hall depends on the heating method. With central (overall) heating, due to the greater instantaneous amount of heat transferred to the room, the heat accumulated in the walls increases, thanks to which the number of hours of additional heating throughout the season will decrease compared to the case with local heating at individual workstations. Heat supplied locally to workplaces is also a component in the balance of heat in the entire room. Local heat mats contribute to the gains, which heat the entire room. It has been shown that the amount of heat introduced into the room with 75 workstations is comparable to the amount of heat necessary to heat the entire hall to 20 °C. The energy consumption analyses were carried out for only one typical building structure. In buildings of lower thermal performance, the detailed results could differ from those presented in this article. It is expected that in buildings with a higher heat demand, the local heating systems will be more beneficial.
The performed energy simulations took into account some of the most important factors, e.g., external climate conditions, air infiltration, and internal heat gains. In real buildings, however, other conditions not considered in the project, may occur, e.g., different hall construction, occupancy hours, etc. Thus, in order to determine the suitability of installing local heating systems for a particular case, all local factors should be taken into account, including the current electricity and heat tariffs.
It should also be noted that the energy savings demonstrated are based on an assumption of a simple relation between the heating power and ambient temperature. In real industrial premises, other factors may occur, such as local draughts due to elevated air movement or radiant asymmetry due to clod or warm surfaces, e.g., walls or equipment. These factors were not considered in the current study. The application of local heating systems in practice would require further development of these systems, including their design, e.g., the size, nominal power, and location of the heating mats. Moreover, for efficient use of the local heating system, the appropriate control of the mats should be developed, which may include the possible transient activity level. Predefined individual power settings would also be useful to shorten the time for adjusting the power. It is also possible to develop advanced HVAC control algorithms that take into account other factors affecting the amount of heating power and its cost [37,38]. The energy consumption by local systems adopted as the basis for calculations was obtained from settings selected by subjects at a low activity level. Although sedentary jobs are not uncommon, e.g., operators, fitters, the activity level of employees often varies during their work. By increasing the activity, which is expected at workstations under real industrial conditions, the need for local heating will decrease; therefore, the actual effectiveness of local heating applications might be higher.
5. Conclusions
The results of experiments with human subjects and from the performed energy calculations allow the authors to draw the following conclusions:
- The local heating system consisting of three heating mats improved the comfort of the occupants and was able to create acceptable thermal conditions under an operative temperature as low as 16 °C.
- The application of local heating systems based on three electric heating mats in industrial halls may be justified. Apart from improving the local thermal conditions for occupants, the heating mats may, in some cases, also reduce the energy needed for heating spaces. The energy benefits depend on numerous parameters, i.e., type of central (overall) heating system used. The local heating is most advantageous to install in halls with a small number of workstations, small internal heat gains, and a low-efficiency central heating system.
- For a profitable implementation of local heating systems in a particular situation, it is advised to perform the analysis for the actual local conditions. To further increase the effectiveness of the local heating systems in practice, an advanced heating control strategy should be considered.
Author Contributions
Conceptualization, J.K.; methodology—human subject experiments, J.K.; methodology—energy simulations, J.F-G.; investigation, formal analysis, J.K. and J.F.-G.; resources, J.K.; writing—original draft preparation, review and editing, J.K. and J.F.-G. All authors have read and agreed to the published version of the manuscript.
Funding
This research received no external funding.
Acknowledgments
The work was supported by the Polish Ministry of Science and Higher Education within research subsidy.
Conflicts of Interest
The authors declare no conflict of interest.
References
- Fleite, T.; Al., E. Mapping and Analyses of the Current and Future (2020–2030) Heating/Cooling Fuel Deployment (Fossil/Renewables). 2016. Available online: https://ec.europa.eu/energy/studies/mapping-and-analyses-current-and-future-2020-2030-heatingcooling-fuel-deployment_en (accessed on 15 April 2020).
- Verhaart, J.; Veselý, M.; Zeiler, W. Personal heating: Effectiveness and energy use. Build. Res. Inf. 2015, 43, 346–354. [Google Scholar] [CrossRef]
- Warthmann, A.; Wölki, D.; Metzmacher, H.; Van Treeck, C. Personal Climatization Systems—A Review on Existing and Upcoming Concepts. Appl. Sci. 2018, 9, 35. [Google Scholar] [CrossRef]
- Veselý, M.; Zeiler, W. Personalized conditioning and its impact on thermal comfort and energy performance—A review. Renew. Sustain. Energy Rev. 2014, 34, 401–408. [Google Scholar] [CrossRef]
- He, Y.; Li, N.; Wang, X.; He, M.; He, D. Comfort, Energy Efficiency and Adoption of Personal Cooling Systems in Warm Environments: A Field Experimental Study. Int. J. Environ. Res. Public Heal. 2017, 14, 1408. [Google Scholar] [CrossRef] [PubMed]
- Rawal, R.; Schweiker, M.; Kazanci, O.B.; Vardhan, V.; Jin, Q.; Duanmu, L. Personal comfort systems: A review on comfort, energy, and economics. Energy Build. 2020, 214, 109858. [Google Scholar] [CrossRef]
- Burch, S.D.; Pearson, J.T.; Ramadhyani, S. Experimental-study of passenger thermal comfort in an automobile under severe winter conditions. Ashrae Trans. 1991, 97, 239–246. [Google Scholar]
- Oi, H.; Tabata, K.; Naka, Y.; Takeda, A.; Tochihara, Y. Effects of heated seats in vehicles on thermal comfort during the initial warm-up period. Appl. Ergon. 2012, 43, 360–367. [Google Scholar] [CrossRef]
- Oi, H.; Yanagi, K.; Tabata, K.; Tochihara, Y. Effects of heated seat and foot heater on thermal comfort and heater energy consumption in vehicle. Ergonomics 2011, 54, 690–699. [Google Scholar] [CrossRef]
- Brooks, J.E.; Parsons, K.C. An ergonomics investigation into human thermal comfort using an automobile seat heated with encapsulated carbonized fabric (ECF). Ergonomics 1999, 42, 661–673. [Google Scholar] [CrossRef]
- Zhang, Y.; Wyon, D.P.; Fang, L.; Melikov, A.K. The influence of heated or cooled seats on the acceptable ambient temperature range. Ergonomics 2007, 50, 586–600. [Google Scholar] [CrossRef]
- Jung, D.M.A.; Strauss, P.; Lindner, H.-J.; Schuppe, H.-C. Influence of heating car seats on scrotal temperature. Fertil. Steril. 2008, 90, 335–339. [Google Scholar] [CrossRef] [PubMed]
- Song, G.-S. Could sperm quality be affected by a building environment? A literature review. Build. Environ. 2010, 45, 936–943. [Google Scholar] [CrossRef]
- Knudsen, G.; Melikov, A. Human response to an individually controlled environment. In Indoor Air 2005: Proceedings of the 10th International Conference on Indoor Air Quality and Climate, Beijing, China, 4–9 September 2005; Tsinghua University Press: Beijing, China, 2005; Volume 1, pp. 1–5421. [Google Scholar]
- Melikov, A.K.; Knudsen, G.L. Human Response to an Individually Controlled Microenvironment. HVAC R Res. 2007, 13, 645–660. [Google Scholar] [CrossRef]
- Watanabe, S.; Melikov, A.; Knudsen, G.L. Design of an individually controlled system for an optimal thermal microenvironment. Build. Environ. 2010, 45, 549–558. [Google Scholar] [CrossRef]
- Conceição, E.Z.E.; Lúcio, M.M.J.R. Evaluation of thermal comfort conditions in a localized radiant system placed in front and behind two students seated nearby warmed curtains. Build. Environ. 2010, 45, 2100–2110. [Google Scholar] [CrossRef]
- Foda, E.; Sirén, K. Design strategy for maximizing the energy-efficiency of a localized floor-heating system using a thermal manikin with human thermoregulatory control. Energy Build. 2012, 51, 111–121. [Google Scholar] [CrossRef]
- Zhang, H.; Arens, E.; Kim, D.; Buchberger, E.; Bauman, F.; Huizenga, C. Comfort, perceived air quality, and work performance in a low-power task–ambient conditioning system. Build. Environ. 2010, 45, 29–39. [Google Scholar] [CrossRef]
- Kaczmarczyk, J.; Melikov, A.K.; Sliva, D. Effect of warm air supplied facially on occupants’ comfort. Build. Environ. 2010, 45, 848–855. [Google Scholar] [CrossRef]
- Al-Othmani, M.; Ghali, K.; Ghaddar, N. Experimental and Theoretical Study of Transient Human Thermal Comfort Response in Convective and Radiative Environments. HVAC R Res. 2009, 15, 855–873. [Google Scholar] [CrossRef]
- Rugh, J.P.; Farrington, R.B.; Bharathan, D.; Vlahinos, A.; Burke, R.; Huizenga, C.; Zhang, H. Predicting human thermal comfort in a transient nonuniform thermal environment. Graefe’s Arch. Clin. Exp. Ophthalmol. 2004, 92, 721–727. [Google Scholar] [CrossRef]
- Ali, A.H.H.; Morsy, M.G. Energy efficiency and indoor thermal perception: A comparative study between radiant panel and portable convective heaters. Energy Effic. 2010, 3, 283–301. [Google Scholar] [CrossRef]
- Hunt, S.; Wells, R. Comparison of five approaches to keeping power line maintainers’ hands warm during work in the cold. Work J. Prev. Assess. Rehabil. 2012, 41, 5836–5838. [Google Scholar] [CrossRef] [PubMed]
- Ducharme, M.B.; Brajkovic, D.; Frim, J. The effect of direct and indirect hand heating on finger blood flow and dexterity during cold exposure. J. Therm. Boil. 1999, 24, 391–396. [Google Scholar] [CrossRef]
- Li, Z.; Ke, Y.; Wang, F.; Yang, B. A study of thermal comfort enhancement using three energy-efficient personalized heating strategies at two low indoor temperatures. Build. Environ. 2018, 143, 1–14. [Google Scholar] [CrossRef]
- Veselý, M.; Kramer, R.; Zeiler, W. Energy performance of personalized heating: Numerical case study for a medium sized office building including different envelope qualities and climates. J. Build. Eng. 2019, 21, 113–119. [Google Scholar] [CrossRef]
- Zhang, H.; Arens, E.; Taub, M.; Dickerhoff, D.; Bauman, F.; Fountain, M.; Pasut, W.; Fannon, D.; Zhai, Y.; Pigman, M. Using footwarmers in offices for thermal comfort and energy savings. Energy Build. 2015, 104, 233–243. [Google Scholar] [CrossRef]
- ISO Standard. ISO 7730:2005. Ergonomics of the Thermal Environment—Analytical Determination and Interpretation of Thermal Comfort using Calculation of the PMV and PPD Indices and Local Thermal Comfort Criteria; International Organization for Standardization: Geneva, Switzerland, 2005. [Google Scholar]
- EU Standard. EN 16798-1:2019. Energy performance of buildings—Ventilation for buildings—Part 1: Indoor Environmental Input Parameters for Design and Assessment of Energy Performance of Buildings Addressing Indoor Air Quality, Thermal Environment, Lighting and Acoustics; European Committee for Standardization: Brussels, Belgium, 2019. [Google Scholar]
- Polish Ministry of Infrastructure. Regulation of the Minister of Infrastructure of 12 April 2002 on the Technical Conditions That Should Be Met by Buildings and Their Location; Journal of Laws of the Republic of Poland No 75, Item. 690, (with Recast); Polish Ministry of Infrastructure: Warsaw, Poland, 2002. (In Polish) [Google Scholar]
- ESRU Manual U02/1. The ESP-r System for Building Energy Simulation, User Guide Version 10 Series; University of Strathclyde. Energy Systems Research Unit: Glasgow, Scotland, 2002. [Google Scholar]
- Typical Meteorological and Statistical Climatic Data for Energy Calculations of Buildings. Available online: https://dane.gov.pl/dataset/797,typowe-lata-meteorologiczne-i-statystyczne-dane-klimatyczne-dla-obszaru-polski-do-obliczen-energetycznych-budynkow (accessed on 15 April 2020).
- Goto, T.; Toftum, J.; De Dear, R.; Fanger, P.O. Thermal sensation and thermophysiological responses to metabolic step-changes. Int. J. Biometeorol. 2006, 50, 323–332. [Google Scholar] [CrossRef]
- Jin, Q.; Duanmu, L.; Zhang, H.; Li, X.; Xu, H. Thermal sensations of the whole body and head under local cooling and heating conditions during step-changes between workstation and ambient environment. Build. Environ. 2011, 46, 2342–2350. [Google Scholar] [CrossRef]
- Humphreys, M.A.; Hancock, M. Do people like to feel ’neutral’? Exploring the variation of the desired thermal sensation on the ASHRAE scale. Energy Build. 2007, 39, 867–874. [Google Scholar] [CrossRef]
- Katić, K.; Li, R.; Verhaart, J.; Zeiler, W. Neural network based predictive control of personalized heating systems. Energy Build. 2018, 174, 199–213. [Google Scholar] [CrossRef]
- Heidrich, T.; Grobe, J.; Meschede, H.; Hesselbach, J. Economic Multiple Model Predictive Control for HVAC Systems—A Case Study for a Food Manufacturer in Germany. Energies 2018, 11, 3461. [Google Scholar] [CrossRef]
© 2020 by the authors. Licensee MDPI, Basel, Switzerland. This article is an open access article distributed under the terms and conditions of the Creative Commons Attribution (CC BY) license (http://creativecommons.org/licenses/by/4.0/).

