1. Introduction
Metropolitan regions are defined as cities and their surrounding areas with close socio-economic links and with a concentration of population, transport and economic activities that are largely dependent on imports from their hinterland [
1]. The accelerated urbanization and industrialization in China is leading to major challenges due to rising energy demand and emissions, especially in the metropolitan regions on the east coast. The current serious urban air pollution and greenhouse gas emissions are mainly caused by local coal-dominated power and heating plants, as well as oil-fueled road transport. The electrification of heating and transport, combined with the decarbonization of the power system, is therefore an important transition strategy for urban areas [
2]. However, the current penetration of renewable energies in the power sector in China’s metropolitan regions is quite low, with a share of less than 5% of total electricity generation (see
Figure 1). The national average target for 2020 is 9%; the four regional targets of 5%, 7%, 10% and 13% are assigned to different provinces [
3]. With the exception of the three provinces of Qinghai, Gansu and Ningxia, which exceeded in 2016 the targets set for 2020, most provinces still have large gaps in relation to the 2020 minimum targets, especially in the eastern provinces. The Chinese Renewable Portfolio Standard Policy (RPS) was released by the National Energy Administration (NEA) in February 2016, and aims to increase the penetration of renewable energy, especially in the centers of consumption, and to reduce wind and PV curtailment in the western provinces that are rich in renewable energy (RE), such as Inner Mongolia, Gansu and Ningxia [
4]. However, due to relatively limited RE potential in the centers of consumption, the eastern coastal regions in particular will have to import large amounts of electricity from the surrounding renewable energy-rich regions [
5,
6]. To overcome the current curtailment of PV in the western provinces, the newly installed PV stations are now mainly located in the eastern provinces. The municipalities Beijing and Tianjin plan to further increase the share of imported electricity from the provinces of Hebei and Inner Mongolia to meet local climate targets and ensure the security of supply. By 2020, Beijing and Tianjin plan to import 10 TWh and 6 TWh annually, respectively, half of which will come from renewable sources [
6]. By 2020, the installed renewable power capacity in Beijing-Tianjin-Hebei (BTH) region is expected to reach 45 GW [
6].
The aim of this case study is to investigate China’s future power supply with temporal and spatial resolution. We focus on the interactions between two structurally very different regional systems regarding the integration of high shares of variable renewable energy (VRE). The study covers four megacities (Beijing, Tianjin, Shijiazhuang, Baoding) with a population of over 10 million [
7], and nine other large cities. The case study considers Inner Mongolia as a resource-rich supply region, which is facing serious curtailment. In 2017, the curtailed wind power in Inner Mongolia reached 9.5 TWh [
8].
The main research questions are how a predominantly renewable energy supply could be implemented, how much locally available renewable resources can be integrated into the power system and how much has to be imported from neighboring supply regions. In order to take into account the variable characteristics of PV and wind, the case study analyses the expansion and use of interprovincial power transmission capacities in temporal and spatial resolution. Furthermore, the modeling deals with the role of local storage expansion and the integration of electric vehicles (EVs) and power to gas into the future energy system. Since there are no long-term targets until 2050 in the form of regional CO2 caps or specific shares of renewable energies, the following case study uses predefined regional CO2 emission limits to analyze selected goal-oriented pathways for the power system. Our study provides insight into the investment decisions from the perspective of a social planner, which are necessary for the significant expansion of renewable energies, assuming minimal curtailment and system integration costs.
Several studies have already examined the transition path to decarbonizing China’s power system beyond the National Determined Contributions for 2030 (for details see
Table S1 in the supplementary material), but with different emphases:
Some have already analyzed the role of inter-regional transmission grid expansion due to load balancing between renewable energy-rich regions and the population-dense coastal east metropolitan regions [
9,
10]. Several addressed the required climate policies, such as the introduction of a CO
2 price, a CO
2 cap and RPS [
9,
10,
11,
12]. Among them, the linear optimization approach of minimizing the costs of producing and supplying electricity was widely used for the analysis of future power generation portfolios and corresponding investment in various options of power generation, storage and transmission [
9,
11,
13,
14]. Some studies have also discussed the robustness of constructed scenarios by analyzing future uncertainties, such as the CO
2 price, fuel prices, capital costs of energy technologies, RE penetration levels, solar and wind potentials, limitations of nuclear energy use and the projected electricity demand [
9,
10,
11,
13,
15]. The in-depth analyses of [
9] and [
13] also focus on the issue at a national level with regard to policy options and transformation strategies.
However, to the best of our knowledge, no study has yet been conducted that incorporates the existing short-term climate policy defined by individual provinces or cities into its long-term transition modelling. Moreover, recent model-based studies have paid little attention to the sensitivities of the model results with respect to the calculated investments for China’s future electricity system. Uncertainties that have not been adequately addressed so far exist in particular with regard to the costs of low-carbon technologies and other predefined system constraints [
11,
14,
15,
16] which can lead to significant variations in the generation system, both in terms of installed capacity and generated energy [
17,
18]. Compared to other applied scenario models, we have chosen a myopic approach to optimize the balance between electricity generation, demand, transmission and storage in an hourly resolution for each target year until 2050. This was done by calculating whole years with an hourly resolution instead of just analyzing typical daily load profiles without distinguishing between weekdays and weekend (e.g., [
9]) or by considering selected time series (e.g., [
13]) or only looking at the medium term until the year 2030 (see, e.g., [
10,
12,
14,
16]). Some studies ignored the dispatchable CSP technology (e.g., [
13,
14,
15]), offshore wind and storage technologies (e.g., [
16]) or considered only pumped hydro (e.g., [
10]) as a storage option. This case study examines, for the first time, the possible future relationship between a solar- and wind-rich supply region and a metropolitan region with high demand using a target-oriented long-term scenario of the entire energy system, and by considering VRE as well as dispatchable CSP, biomass and geothermal technologies, grid expansion and other storage technologies beyond pumped hydro.
Our study is structured as follows. First, in
Section 2, we present our methodology, input data and main assumptions. Based on that,
Section 3 presents the optimization results for a defined reference scenario in terms of total installed capacity, required investments, annual energy and dispatch characteristics by region. In
Section 4, we then analyze the influence of seven key parameters on installed capacity, full load hours of power generation and storage technologies, and total system costs. Finally, we discuss the results and come to our conclusions in
Section 5 and
Section 6.
3. Optimization Results
This section provides the quantitative results of the reference scenario analysis in terms of installed capacity, investment and fuel costs, annual electricity production and resulting CO2 emissions, as well as hourly dispatch for the modeled regions. Furthermore, the required grid expansion between the regions is calculated under the objective function of minimized system costs.
3.1. Summary of Key Results
The optimization results for the reference scenario show that under the given assumptions and system constraints, the share of renewable energy in installed power generation capacity and annual electricity production would significantly increase under the RIS in both the BTH metropolitan region and the Inner Mongolia supply region (
Table 9). However, in Beijing and Tianjin, renewable electricity generation only reaches around 60% by 2050, while the share increases to 74% in Hebei province and 98% in Inner Mongolia.
CO
2 emissions from power generation in the two municipalities would only decrease after 2030 under the current short-term policy till 2020 and the set system constraints (
Table 6). In contrast, emissions in Hebei and Inner Mongolia could be reduced immediately under the same scenario, indicating that renewable technologies are already the most cost effective technologies in these regions. These results reveal that the current short-term policy till 2020 is not yet sufficient to stop the growth of CO
2 emissions in municipalities in the medium term. However, with the further expansion of renewable energies for power generation and the implementation of regional CO
2 emission caps, emissions in the metropolitan region could be reduced to 53% by 2050 compared to the 2010 level (see
Figure 5).
The optimization results show that the mean value of marginal electricity generation costs would increase moderately till 2040 in all modeled municipalities and provinces (see
Figure 6). With better solar and wind resources, Inner Mongolia has lower marginal costs compared with the metropolitan region that are below 56 €/MWh. The average marginal electricity costs in Inner Mongolia are used to calculate the imported electricity costs for the metropolitan region, which have to be added to the cost for its transformation of the energy system.
3.2. Total Installed Capacity
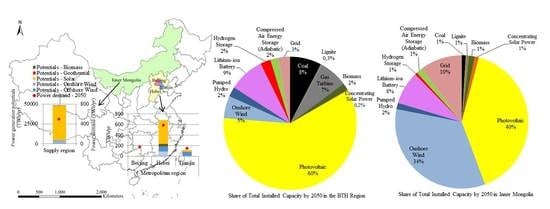
Figure 7 shows the total installed capacities for power generation, electricity storage and grid transmission as a result of exogenously assumed existing installations and additionally required capacities as endogenous result of the system optimization. The total installed fossil-fired power plant capacity in the BTH region decreases after 2040 but only slightly and in line with the requirement of the total CO
2 emission cap. A switch from coal to gas does not take place in power generation in BTH due to the neglect of CO
2 emission costs and the cost advantages of extensive emission reduction in the Inner Mongolia supply region (see
Figure 6). The share of PV in total installed capacity increases from 16% in 2020 to 73% by 2050 in BTH. Limited by the regionally available onshore wind potentials (36 GW and 31 GW if all sites below 4 m/s and 5 m/s wind speed, respectively, are considered) and noncompetitive costs for offshore wind energy, wind installations stagnate and the share of wind in total capacity decreases from 26% in 2020 to only 7% by 2050 in the BTH region. The maximum regional potential of biomass is exploited by 2050, while only the planned capacities for geothermal energy and CSP are installed due to the higher costs compared to other technologies. The maximum potential for pumped hydro is fully exploited already by 2020. This leads to a continuous increase in installed capacity in the BTH region mainly for lithium-ion battery, but also for local electrolyzers and adiabatic compressed air energy storage (CAES_AD) from 16 GW, 3 GW and 0 GW in 2030 to 55 GW, 16 GW and 11 GW by 2050, respectively, to balance the increasing variable generation of PV.
In contrast to the metropolitan region, both PV and onshore wind energy would dominate the power supply system in Inner Mongolia (with a growth from 60% in 2020 to 96% by 2050) in terms of installed capacity (see
Figure 8). Since PV has lower electricity generation costs compared with onshore wind, large amounts of PV are installed in the supply region in the period 2040–2050 (315 GW). Similar to BTH, only the planned installed capacity for geothermal and CSP are installed due to the higher costs compared to other technologies. The maximum regional potential of biomass is also exploited in Inner Mongolia by 2050. The growth in installed capacity for storage technologies shows a similar trend to that in the metropolitan region, especially for the expansion of lithium-ion battery in the last decade of the scenario as a result of the large-scale installation of PV. The installed capacity for fossil-fired generation decreases by 80% from 69 GW in 2020 to 14 GW by 2050. The installed capacities for RE and backup power generation, storage and transmission can ensure that the growing power demand both in the metropolitan regions and in the supply region is covered in every hour of the modeled years.
3.3. Required Investments
In the metropolitan region, investment in renewable power plants rises sharply in this scenario from 67 billion € in the period 2015–2020 to 214 billion € in the period 2040–2050 (see
Figure 9). In contrast, investment in fossil-fueled power plants peaks in 2020–2030 and declines to 95 billion € over the last decade. Total investment in renewable power plant capacity exceeds that of fossil fuels after 2030. Compared to the relatively high investments in power generation capacity, storage expansion requires only between 9 and 72 billion € for each decade from 2020 to 2050. Investments in storage facilities are dominated by lithium-ion batteries for short-term load balancing due to a PV dominated power supply system, which have less limited potential than pumped storage facilities. There is also a limited investment in local electrolyzers and after 2030 additional investment in CAES_AD. Investments in biomass, onshore wind and CSP remain rather stable for each decade at around 20 billion €, 30 billion € and 3 billion €, respectively. Due to the fast expansion of PV in the BTH region, investments also significantly increase from 88 billion € in the period 2020–2030 to 162 billion € in the last decade. In comparison, investment in wind power remains at a lower, and in the long run even slightly declining, level, with only small investments in offshore wind in line with planned capacities by 2020. The reason for this is on the one hand the limited regional onshore wind potential and the assumed relatively higher offshore wind costs at relatively low full load hours (FLH) in the region. On the other hand PV generation in the region in combination with imported electricity from onshore wind energy is advantageous from a system perspective.
In the Inner Mongolia supply region with an onshore wind and solar dominated power supply system, large investments in wind power plants would be required in each decade (from 151 billion € in the period 2020–2030 to 209 billion € in the last decade) (see
Figure 10). Investment in PV capacity only increases significantly in the last decade (to 136 billion € per decade). Investment in fossil-fueled power plants decline from 105 billion € in 2020–2030 to only 21 billion € in the last decade. With CSP installed capacity declining after 2040, more investment is needed for lithium-ion batteries and CAES_AD to balance variable PV and onshore wind power generation. The storage demand arises mainly with regard to short-term load balancing by lithium-ion batteries with a lower demand for local electrolyzer than in the BTH region. Investments in biomass power plants per decade remain relatively stable at around 20 billion €.
During the transition process in the energy system, according to the scenario calculations, additional investments are also required for grid expansion, with an increase from 26 billion € in the period 2020–2030 to 38 billion € in the last decade (see
Figure 11). Such investments are led by the grid expansion of 16 GW from Inner Mongolia to Beijing and Tianjin in 2020 to 68 GW from Inner Mongolia to the BTH region and 2 GW from Tianjin and Hebei to Beijing.
3.4. Annual Power Supply
Figure 12 shows that from 2020 to 2050 electricity imports for the metropolitan region increase due to the additional power demand from heating and transport and the massive installation of RE generation capacity in the supply region. The share of imported electricity in total power demand rises to around 30% by 2050. According to the modeling results, a cost-minimized electricity system would require substantial electricity imports already in the first scenario year 2020. By 2050, PV dominates the power supply system in the BTH region (28%) while onshore wind dominates in the supply region (69%). Accordingly, electricity generation from coal power plants would decline in both regions after 2020. Given the limited potential for pumped hydro storage, other storage technologies such as lithium-ion batteries, hydrogen and CAES_AD play an increasingly important role in a VRE dominated power supply system equally in metropolitan and supply regions with full load hours increasing over time. Local on-site electrolyzers can generate hydrogen as a renewable fuel and help to integrate VRE into the power system, especially in the BTH region. With increasing shares of renewable power generation, there will be a change in the backup power supply from CCGT to GT in the long-term. For reasons of supply costs and by exploiting the given CO
2 caps, a high proportion of coal-fired power plants remains. This effect is reinforced by the fact that no CO
2 costs are assumed in the reference scenario. In parallel to these developments, the curtailed energy in Inner Mongolia rises dramatically from 1% in 2020 to 11% by 2050, mainly from onshore wind (60%) and PV (33%).
3.5. Hourly Dispatch Characteristics
The hourly balance between power generation, storage, transmission and demand shows typical seasonal variations in the study regions. In this section, the hourly dispatch in the years 2030 and 2050, which have significantly different characteristics, is discussed on the basis of selected results (for details see the
Supplementary Material).
In 2030, Beijing’s power supply system would be dominated by imported electricity and storage by pumped hydro. Lithium-ion batteries, hydrogen and EVs still play a minor role in balancing PV and onshore wind, and there is no curtailment of variable generation yet. From our results we identify three characteristic seasons: From February to May, coal and biomass need to be operated flexibly, supplementing imported electricity and power generation from PV and onshore wind to meet the hourly power demand pattern. From June to October, coal and biomass power plants are operated as base loads with GT and CCGT as flexible generators. From November to January, GT and CCGT are not operated; at the same time, power plants using coal and biomass are operated as base load power generators (see
Figure 13).
Tianjin in 2030 would have a lower share of imported electricity than Beijing. Overall the dispatch has quite similar characteristics than the one in Beijing, however, with considerably higher generation from coal and lower electricity import shares (see
Supplementary Material).
In contrast to the two municipalities, onshore wind also plays a major role in Hebei province in 2030 resulting in less import. CSP would operate intermittently in this scenario, especially when PV is not available. Due to the limited potential of pumped hydro storage, more lithium-ion batteries are needed to balance PV in such a system. Coal and biomass power plants are operated flexibly from January to May with increasing curtailment of PV systems over time. From June to August, coal and biomass would act again as base load power plants, GT and CCGT would be operated flexibly, and there would be no curtailment of PV and wind. The higher PV share can be balanced out by the lithium-ion battery and even leads to exports at peak times. After September, the share of power generation from onshore wind increases, while exports of electricity from PV and flexibly operated coal and biomass power plants decline.
As a supply region, Inner Mongolia in 2030 has a power system dominated by onshore wind with a high share of exported electricity. CSP would operate intermittently when PV is not available to meet peak demand and balance base loads. The local pumped hydro potentials could mostly cover the demand for balancing variable wind and solar energies. Due to the still low power consumption from EVs compared to the total power generation demand, EVs would only play a minor role in load balancing. From January to May, coal and biomass power plants would be operated flexibly, with wind and solar energy being severely curtailed during peak periods. From June to October, coal and biomass would operate in baseload with less curtailment, whereas in November and December they would run more flexible, again with increasing curtailment.
In Beijing in 2050, the share of electricity imports further increases with higher demand for hydrogen and electricity for EVs. Still, during several periods of lower demand, PV and onshore wind will be curtailed. From February to May, local PV tends to be unused because of relatively cheap imported electricity. From June to January, coal, biomass and GT are operated as flexible generators and local PV is used most of the time, resulting in less curtailment.
Compared to 2030, the share of imported electricity increases also in Tianjin, while at the same time the curtailment of PV systems becomes more severe. Different from Beijing, CAES_AD would also act as a short-term storage together with EVs, pumped hydro, lithium-ion batteries and flexible hydrogen systems. During several periods, the power supply is completely based on renewable energies, but with high curtailment of PV.
In Hebei, a large share of lithium-ion battery is installed in 2050 to balance PV power generation. From February to May, the power supply system is dominated by PV and onshore wind with an increasing curtailment rate. In June and July, coal, biomass and GT would operate flexibly with a still PV dominated power supply system, but with less curtailment and increasing export. From August to January, coal and biomass would act as base load generators with flexibly operated GT, an increasing share of onshore wind, and less curtailment.
In the scenario, Inner Mongolia still has a power system dominated by onshore wind in 2050, but with a higher share of PV compared to 2030 (see
Figure 14). Besides the fully exploited storage potential of the pumped hydro, lithium-ion batteries would dominate the storage system together with CAES_AD and hydrogen. In contrast to the metropolitan region, EVs would only play a minor role even in 2050, since in relation to total electricity generation, significantly fewer EVs would be available. From January to May, the power system is completely based on renewable energies, with flexibly operated biomass power plants and increasing curtailments of onshore wind and PV over time. In June and July, the remaining coal-fired power plants need to be flexibly operated and PV dominates the power system instead of onshore wind. From August to December, coal and biomass power plants act as base load power plants, but only play a minor role, with less curtailment and an increasing power generation from onshore wind energy.
4. Sensitivity Analysis
The modeling results of the reference scenario shown above are based on a cost optimization approach and are therefore dependent on uncertain cost assumptions for the future [
39,
40]. Other parameters also influence the results, such as used historic time series for the power generation from renewable energies and exogenously defined system constraints. In this section, the influence of costs assumptions and selected constraints on main output parameters for the power generation structure, all storage technologies and grid expansion is discussed. In addition to the technology costs, the sensitivity analysis was also conducted for CO
2 certificate price assumptions, the restriction of grid expansion, the limitation of curtailment of power generation from VRE and CSP, the fossil fuel price paths and the FLH of available offshore wind. The parameter variations are defined in
Table 10. The sensitivity analysis considers the influence of assumptions on installed capacity portfolios, annual electricity generation, CO
2 emissions and system costs.
4.1. Influence on Installed Capacities and Annual Electricity Generation
Figure 15,
Figure 16,
Figure 17 and
Figure 18 show for both regions the results of the sensitivity cases for the calculated installed capacity and annual electricity generation by technology in 2050 compared to the reference scenario. Of all the cases analyzed, a restricted grid expansion from Inner Mongolia to the BTH region has the highest influence on both the installed capacity and the electricity generation structure in the BTH region (see
Figure 15 and
Figure 16). Under this assumption, the regional offshore wind resources of 64 GW would be fully exploited. Furthermore, such a scenario results in a shift from gas turbines to CCGT and to an additional grid expansion of 10 GW within the BTH region. Compared to the reference case, 26 GW lithium-ion batteries, 37 GW CCGT and 1 GW onshore wind would be additionally installed to compensate for the reduced electricity imports. In contrast to the metropolitan region, the influence of parameter variations in Inner Mongolia is particularly evident in changes in the shares of wind, solar and storage technologies due to the high share of renewable energy supply (see
Figure 17 and
Figure 18). This is also the reason why variations in investment costs for VRE and storage systems have the largest influence of all scenario variants in Inner Mongolia.
The effects of assumed CO2 certificate prices on the power system also differ for the two regions. For the BTH region, CO2 certificate prices would contribute to the further reduction of coal and gas turbine power plants. The highest CO2 certificate prices would result in a further installation of lithium-ion batteries and hydrogen storage as well as to more imported electricity from Inner Mongolia. In Inner Mongolia, higher CO2 certificate prices would promote the further expansion of photovoltaic, onshore wind, storage technologies of lithium-ion batteries, hydrogen storage and CAES_AD, and the grid. Higher investment costs of VRE technologies would result in a shift from PV, onshore wind and storage technologies to dispatchable CSP systems with an additional expansion of the grid between Inner Mongolia and the BTH region.
Quite different effects on the two regions also derive from assumed reduced investment costs for storage technologies, decreased VRE investment costs, and a low development path for fossil fuel prices. Under these assumptions, the installed capacity of coal power plants will be significantly reduced by 33 to 38 GW in BTH by 2050. However, this would have to be compensated for by additional installations of various storage technologies (including hydrogen)—each less than 20 GW—and an expansion of up to 6 GW grid transmission capacity. In contrast, these three cases each show significant and different effects on the RE power generation structure in combination with storage demand in Inner Mongolia, with a slight increase in gas consumption in the case of lower fossil fuel prices.
Lower effects are visible for both regions if the costs for grid expansion are changed or the curtailment rate is restricted to 20%. If only a maximum of 10% to 5% curtailment is allowed, some relevant effects become visible. In the case of BTH, a small switch from gas to coal in combination with higher storage demand (above all batteries) can be observed, with some effects on electricity import and PV. In Inner Mongolia, a 5% curtailment restriction leads to significantly lower PV and wind installation and generation in combination with less grid and short-term storage expansion, but with some shift to CSP and hydrogen storage. Furthermore, assuming higher FLH of offshore wind power plants would not increase the use of regional offshore wind resources.
In addition, the results of the sensitivity analysis for the corresponding full load hours of electricity generation and storage technologies are provided in Chapter 2 in the
Supplementary Material. However, the results on the power supply structure only represent the technical perspective. Regarding the environmental and economic effects, we therefore present in the following sections the effects of structural changes in power systems on CO
2 emissions and system costs.
4.2. Influence on CO2 Emissions
The differing CO
2 emissions of the analyzed generation structures are shown in
Figure 19 and
Figure 20. The analysis clearly shows that setting prices for CO
2 certificates is an effective measure to further reduce CO
2 emissions by reducing the FLH of fossil fuel power plants. In addition, lower investment costs for VRE technologies, storage systems and grid expansion would further promote the market penetration of renewable energies with storage and power exchange, which would significantly reduce emissions in the medium to long term. On the other hand, higher investment costs and a restricted grid expansion would delay regional CO
2 emission reduction, especially in the medium term. A special case is the assumption of low prices for fossil fuels. This leads to significantly higher emissions in 2030 due to the economic advantages of coal firing, but in the long term, assuming the CO
2 cap, it would result in a significant switch from coal to gas by 2050 and correspondingly lower specific emissions from power generation.
4.3. Influence on Total System Costs
The influences of the parameter variations on the total system costs are shown from 2030 to 2050 in
Figure 21. The total system costs are calculated from the annuities of investments of all endogenously installed capacities, the fuel costs, the fixed and variable operational and maintenance costs and the operating costs for load shifting by electric vehicles. The influence of storage costs clearly dominates the variation of system costs over the entire time horizon and leads to positive and negative deviations from the reference scenario of over 150 billion € in BTH and 100 billion € in Inner Mongolia. The reason behind is that storage costs significantly influence both the installation of fossil fuel power plants in the BTH region and of RE capacities in Inner Mongolia. This result is particularly relevant when one considers that many storage technologies are still at the beginning of the learning curve [
41,
42]. The uncertainties of cost assumptions are therefore often high, and large cost reductions are expected with further development [
43]. Compared to that, all other parameter variations result in relatively small deviations from the reference case, up to a maximum of less than 25 billion €. Although the variation in investment costs for VRE in Inner Mongolia, the grid restriction to the BTH region, and the setting of CO
2 certificate prices in both regions lead to the highest variations in installed capacities, their impact on the system costs is rather small. Similar conclusions can be found in other sensitivity studies for power systems dominated by renewable energies [
17,
18,
44].
5. Discussion
Our analysis considers a variety of options to supply a metropolitan region of China with renewable power. Biomass, PV and wind appear to be more cost competitive than dispatchable power generation from CSP and geothermal energy, of which only the currently planned capacities are operated at the modelled system cost minimum. Since the regional potential of pumped hydro power is already exploited before 2030, there is a high correlation between the installation of PV and lithium-ion batteries, which is observed from 2030 to 2050 in BTH and in 2050 in Inner Mongolia. Offshore wind energy within the BTH region is only cost competitive if further imports are restricted. Thus, the two municipalities of Beijing and Tianjin will largely depend on imported electricity, which also supports the findings of [
14]. In Hebei province, the power system in 2050 is dominated by PV supplemented with onshore wind and some residual coal in the winter season. Inner Mongolia’s power system is dominated by onshore wind energy, especially in the winter season. Dispatchable CSP will be a pillar both locally and for export, an aspect often neglected in previous studies (see
Table S1 in the supplementary material). Compared to the metropolitan region, the role of electric vehicles in its renewable energy-dominated power system is rather small. The hydrogen systems, compressed air storages and natural gas turbines are operated flexibly to compensate for deficits from import during the night. In Inner Mongolia, storage and grid technologies are of complementary importance to balance peak PV generation during the day and low onshore wind generation at night.
Considering the bandwidth of our sensitivity analysis, we see significant impacts of higher or lower investment costs for VRE and storage on installed capacity in both regions as also shown in [
11,
13,
15]. The introduction of a CO
2 pricing system is an effective measure to further reduce regional CO
2 emissions, but due to different strategies in the two regions. In the metropolitan region we see a strong shift from coal to gas and only little additional renewable generation. In Inner Mongolia there is a major shift in renewable installations. Curtailment restrictions seem to be of minor importance. This is also reflected in the variation of the FLH of all technologies in the sensitivity analysis. We see major differences above all in the dispatchable technologies in both regions.
From a system perspective, our sensitivity analysis reveals how the development of storage costs overshadows all other effects of cost variations and constraints. This is particularly interesting because storage systems include technologies with so far quite uncertain cost learning curves [
42,
45]. For all the other sensitivity parameters we see much lower impacts. Even if they induce a strong change in the system structure in our modeling, we achieve a wide variety of scenarios at roughly the same system costs.
The analysis of the structural changes shows a number of interesting effects on individual technologies. In particular, technology cost assumptions and restrictions on grid expansion between the regions have a large influence on the portfolio of installed capacities of fossil power plants in BTH and of renewable power plants in Inner Mongolia. High VRE technology costs would strongly influence the installation of CSP, PV, onshore wind and lithium-ion batteries in Inner Mongolia. Low storage costs will particularly promote the installation of lithium-ion batteries and hydrogen storage. The installation of onshore wind in Inner Mongolia is highly influenced by the VRE costs, which also have an impact on the expansion of compressed air energy storage. Higher costs for VRE and storage technologies would promote the installation of CSP due to increased cost competitiveness. The restriction of grid expansion would have the largest influence on the installation of offshore wind turbines, lithium-ion batteries and CCGT in the BTH region.
Furthermore, restricting the curtailment ratio to 5% affects the installed capacities of gas turbines and lithium-ion batteries in the BTH region and on the installation of CSP, PV, and onshore wind in Inner Mongolia. Although a strong restriction of curtailment is very likely to lead to an expansion of storages (see also [
43]) it also results in higher operating hours for coal, GT, biomass and CSP and at the same time rather lower FLH for storage technologies.
Many research questions are still open: The consideration of additional sector coupling options such as flexible direct or indirect electrification (via power-to-gas), demand side management in industry or the use of cost-effective energy storage in the heating and gas have an impact on the results of such system modelling, particularly with regard to storage technologies [
40]. Future changes in load profiles could have additional effects and should be investigated. Furthermore, we have not considered the combined impact of individual cost changes on the configuration and operation of the system. The robustness of the results presented here is also challenged by the fact that the linear optimization approach is susceptible to penny switching effects in technology selection, which has already been discussed elsewhere (e.g., [
46]). On the other hand, our scenario analyses result in a large optimization plateau that presents many technologies as valid solutions, thus limiting the risk of costly wrong decisions at the political level. Last but not least, apart from the generation side, exploring carbon reduction potentials from the demand side with options such as carbon cap, cap-and-trade, and carbon tax also play a vital role in achieving a low carbon energy system (see e.g., [
47,
48,
49,
50,
51]).
6. Conclusions
We applied a linear approach to minimize system costs in order to analyze the deployment of various technologies of power generation, storage and grid transmission in a low-carbon scenario at hourly resolution. We also looked at the future role of electric vehicles in the integration of VRE into the regional power supply system. In addition, the current short- or medium-term development targets for renewable energies were integrated into the analysis of a low-carbon power supply in the long-term future. A sensitivity analysis of selected parameters addresses the high level of uncertainty associated with the unclear cost development of new technologies and possible constraints. The optimization results illustrate the possible infrastructural needs of the future power system, which differ significantly in the metropolitan region and the supply region. The hourly dispatch shows the interactions between different technologies in balancing power generation and demand as VRE market penetration increases and additional electricity is needed for the electrification of the heating and transport sectors.
The optimization results show that under the set system constraints, the share of renewable energy in terms of installed capacity and annual electricity generation would increase significantly, leading to an immediate reduction in CO2 emissions from power generation in both regions. With the further expansion of renewable energies in the power systems, the amount of curtailed power also increases. Therefore, much more flexible technologies and operating strategies need to be implemented in the medium to long term.
According to the optimization results, the marginal costs of electricity generation would increase until 2040 in all modeled municipalities and provinces. The better solar and wind resources in Inner Mongolia result in lower marginal costs compared to the BTH region. Even if the overall share of fossil generation declines sharply, under the assumed CO2 emission path, a significant installed fossil power plant capacity in the BTH region would serve as a backup in the long-term. In contrast, the installed fossil power plant capacity in Inner Mongolia could be largely replaced by 2050. The results for the metropolitan region are more sensitive in comparison to the supply region if future import corridors are restricted. In all cases considered, however, the combination of spatial and temporal balancing measures is able to cover the hourly electricity demand with a large share of variable renewable energy such as PV and wind. The relevance of grid expansion and electricity imports illustrates the necessity of integrated regional planning to deal with the unbalanced distribution of electricity demand and renewable resources at minimum cost. The modeling also provides evidence that such regional cooperation reduces the overall curtailment, leading to a more efficient energy system.
The sensitivity analysis revealed that variations in input parameters—apart from storage—have little impact on the total system costs, even if they have significant effects on the other analyzed parameters (capacity and generation/FLH). This means that different system layouts promise a feasible renewable energy system for the interconnected regions at similar costs.
Due to the limited hinterland, the future decarbonization of the energy system in metropolitan regions generally poses a major challenge. The significantly unbalanced distribution of renewable resources and load demand in China further increases the dependence of the future low-carbon energy system on the expansion of transmission corridors. Regionally integrated modeling between RE-rich regions and demand centers provide comprehensive evidence of how renewable power supply could be implemented, and first estimates of required future investments in various power generation, storage and transmission technologies. In addition to setting an overall regional cap on CO2 emissions, the introduction of CO2 certificate prices is proving to be an effective climate policy to reduce the operation of fossil-fuel power plants and further promote the expansion of VRE in the power system.


