An Assessment of Onshore and Offshore Wind Energy Potential in India Using Moth Flame Optimization


 ,
,  and
and 
Abstract
:
1. Introduction
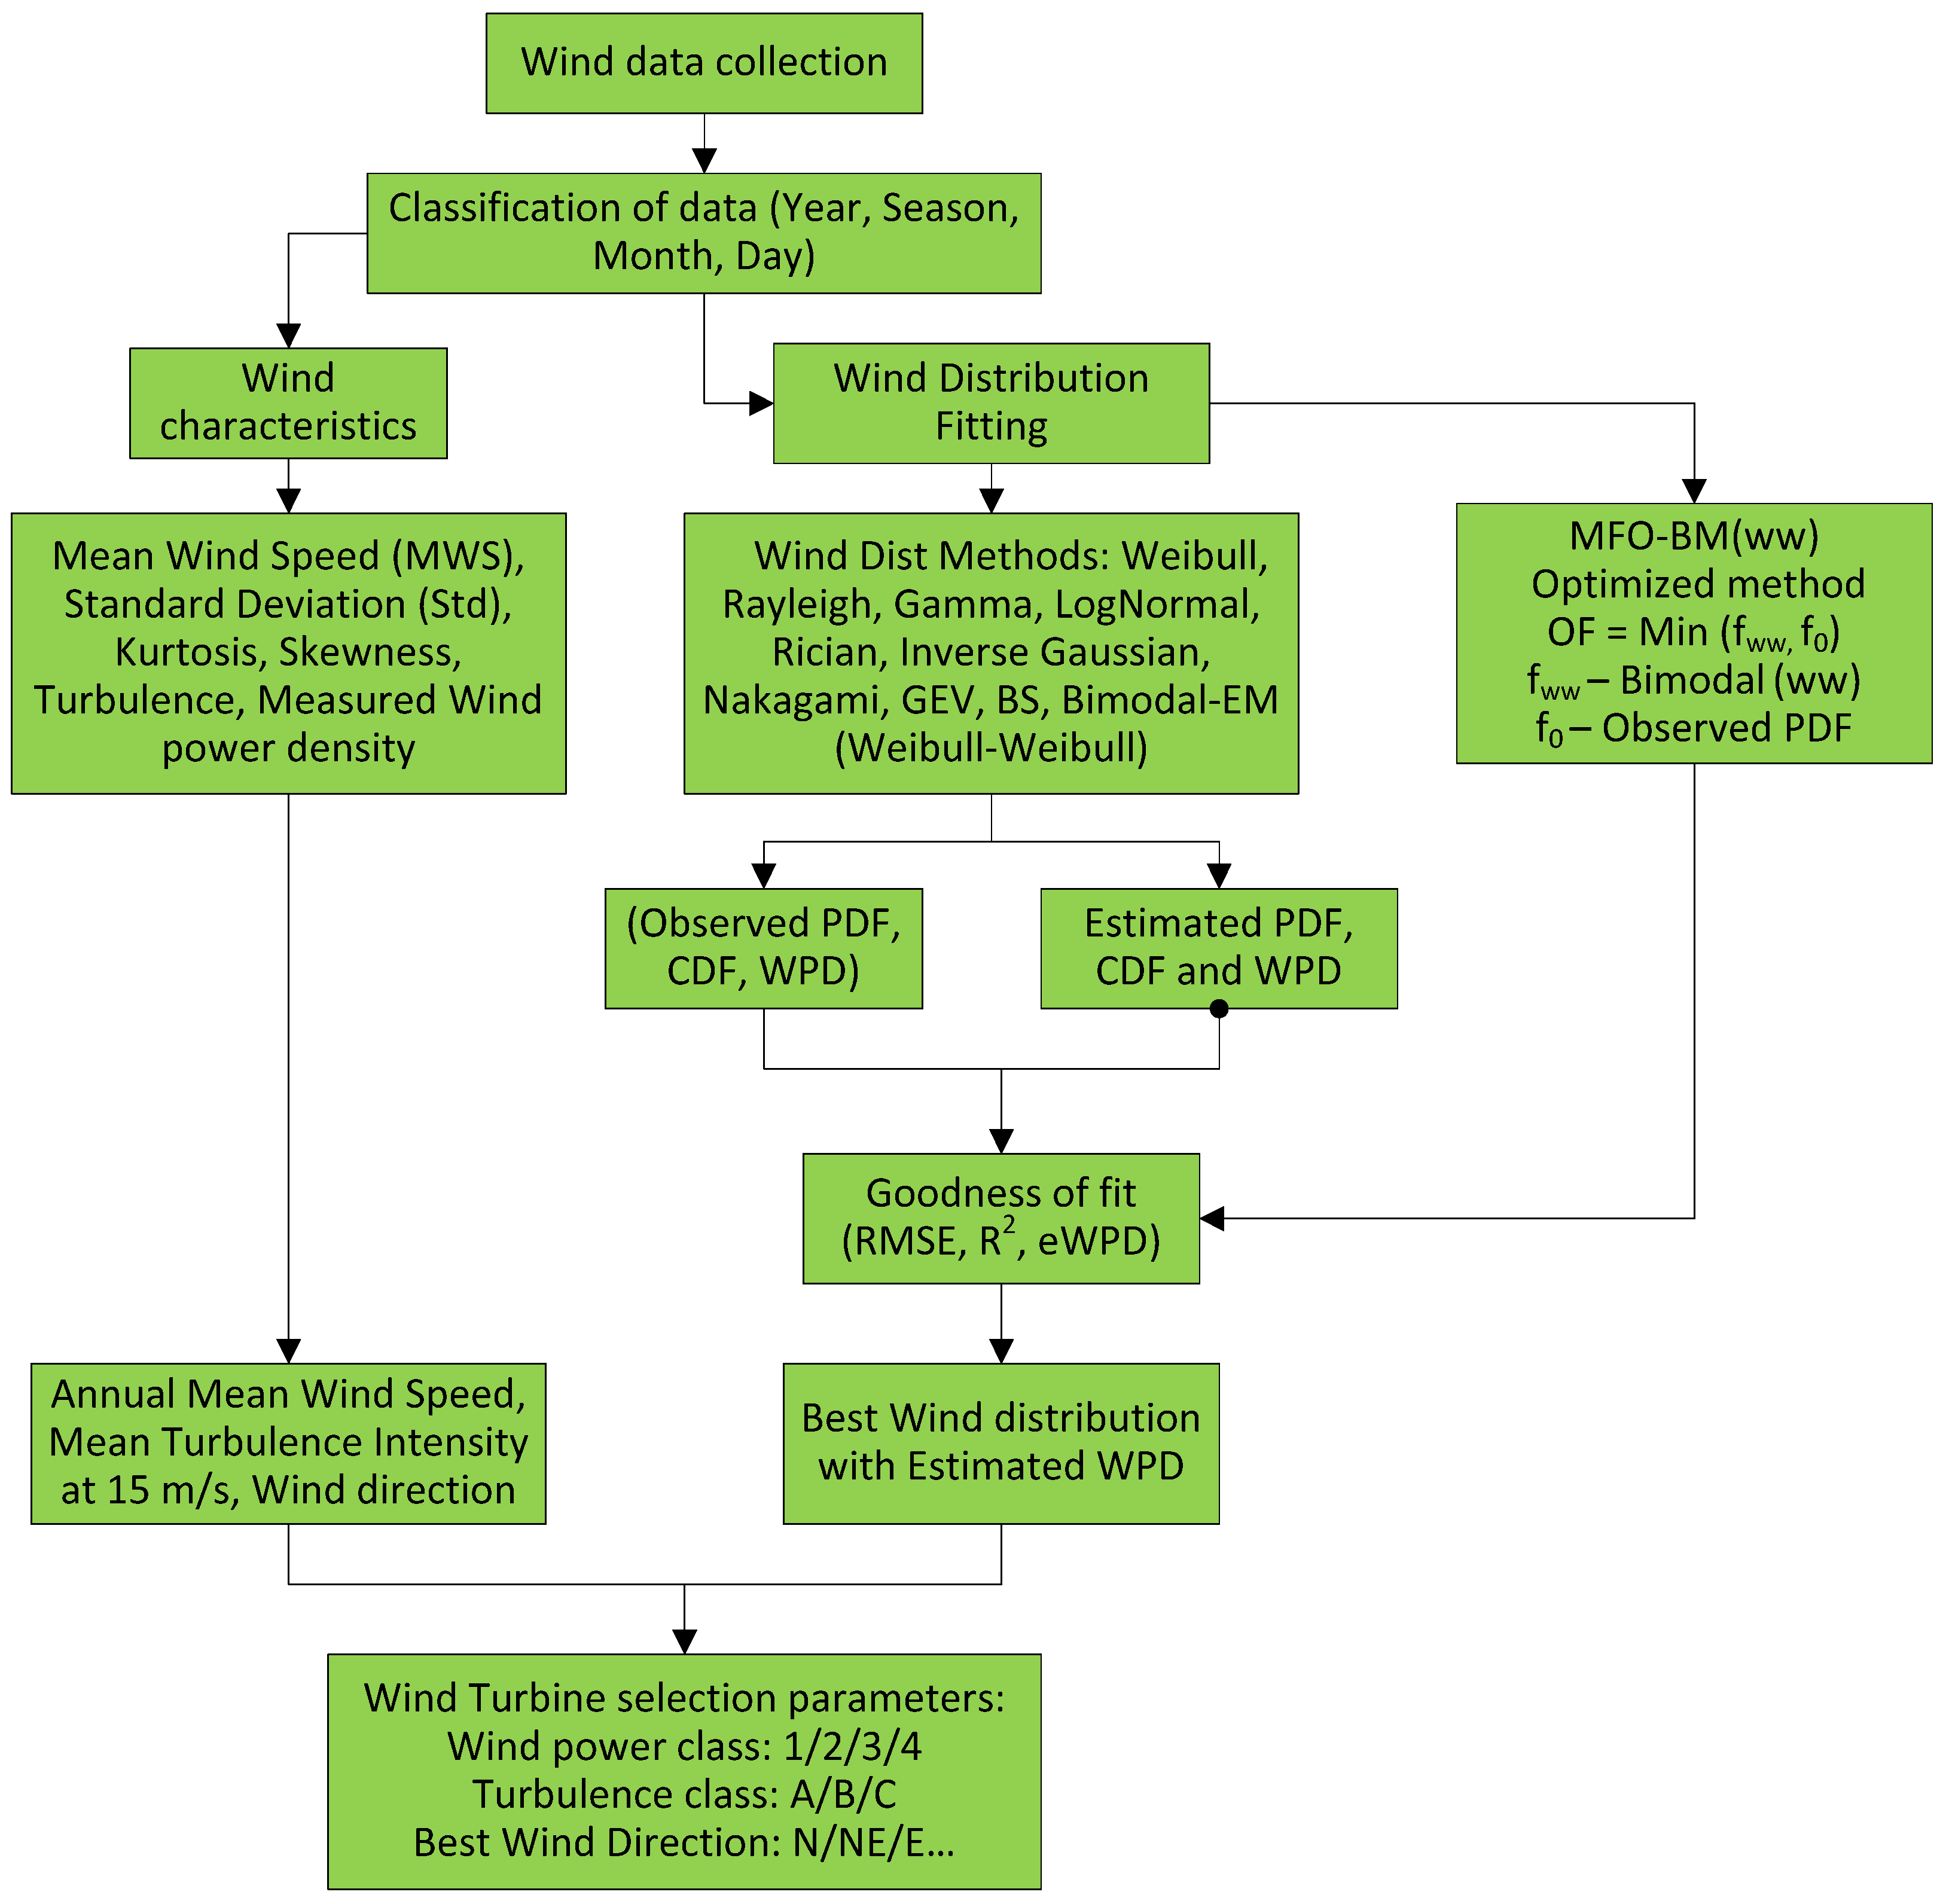
2. Wind Data Analysis Methods
2.1. Wind Characteristics Parameters
- Average, standard deviation, minimum and maximum wind speed (m/s) are measured for wind generation suitability assessment, and turbine selection.
- Average, standard deviation and maximum gust direction (degrees) are estimated for optimizing wind turbines and understand the spatial distribution of wind
- Temperature (°C) and vertical wind speed (m/s) are used for the air density and turbulence application respectively to measure the average and minimum/maximum value.
- Average, standard deviation and minimum/maximum value of barometric pressure (kPa) are measured for air density applications
- Relative humidity (%) and solar radiation (W/m2) (average, minimum/maximum value) are measured for the icing and atmospheric analysis respectively.
2.2. Wind Speed Distribution Methods
2.3. Goodness of Fit
2.3.1. Root Mean Square Value (RMSE)
2.3.2. The Coefficient of Determination (R2)
3. Wind Site and Measurement Details
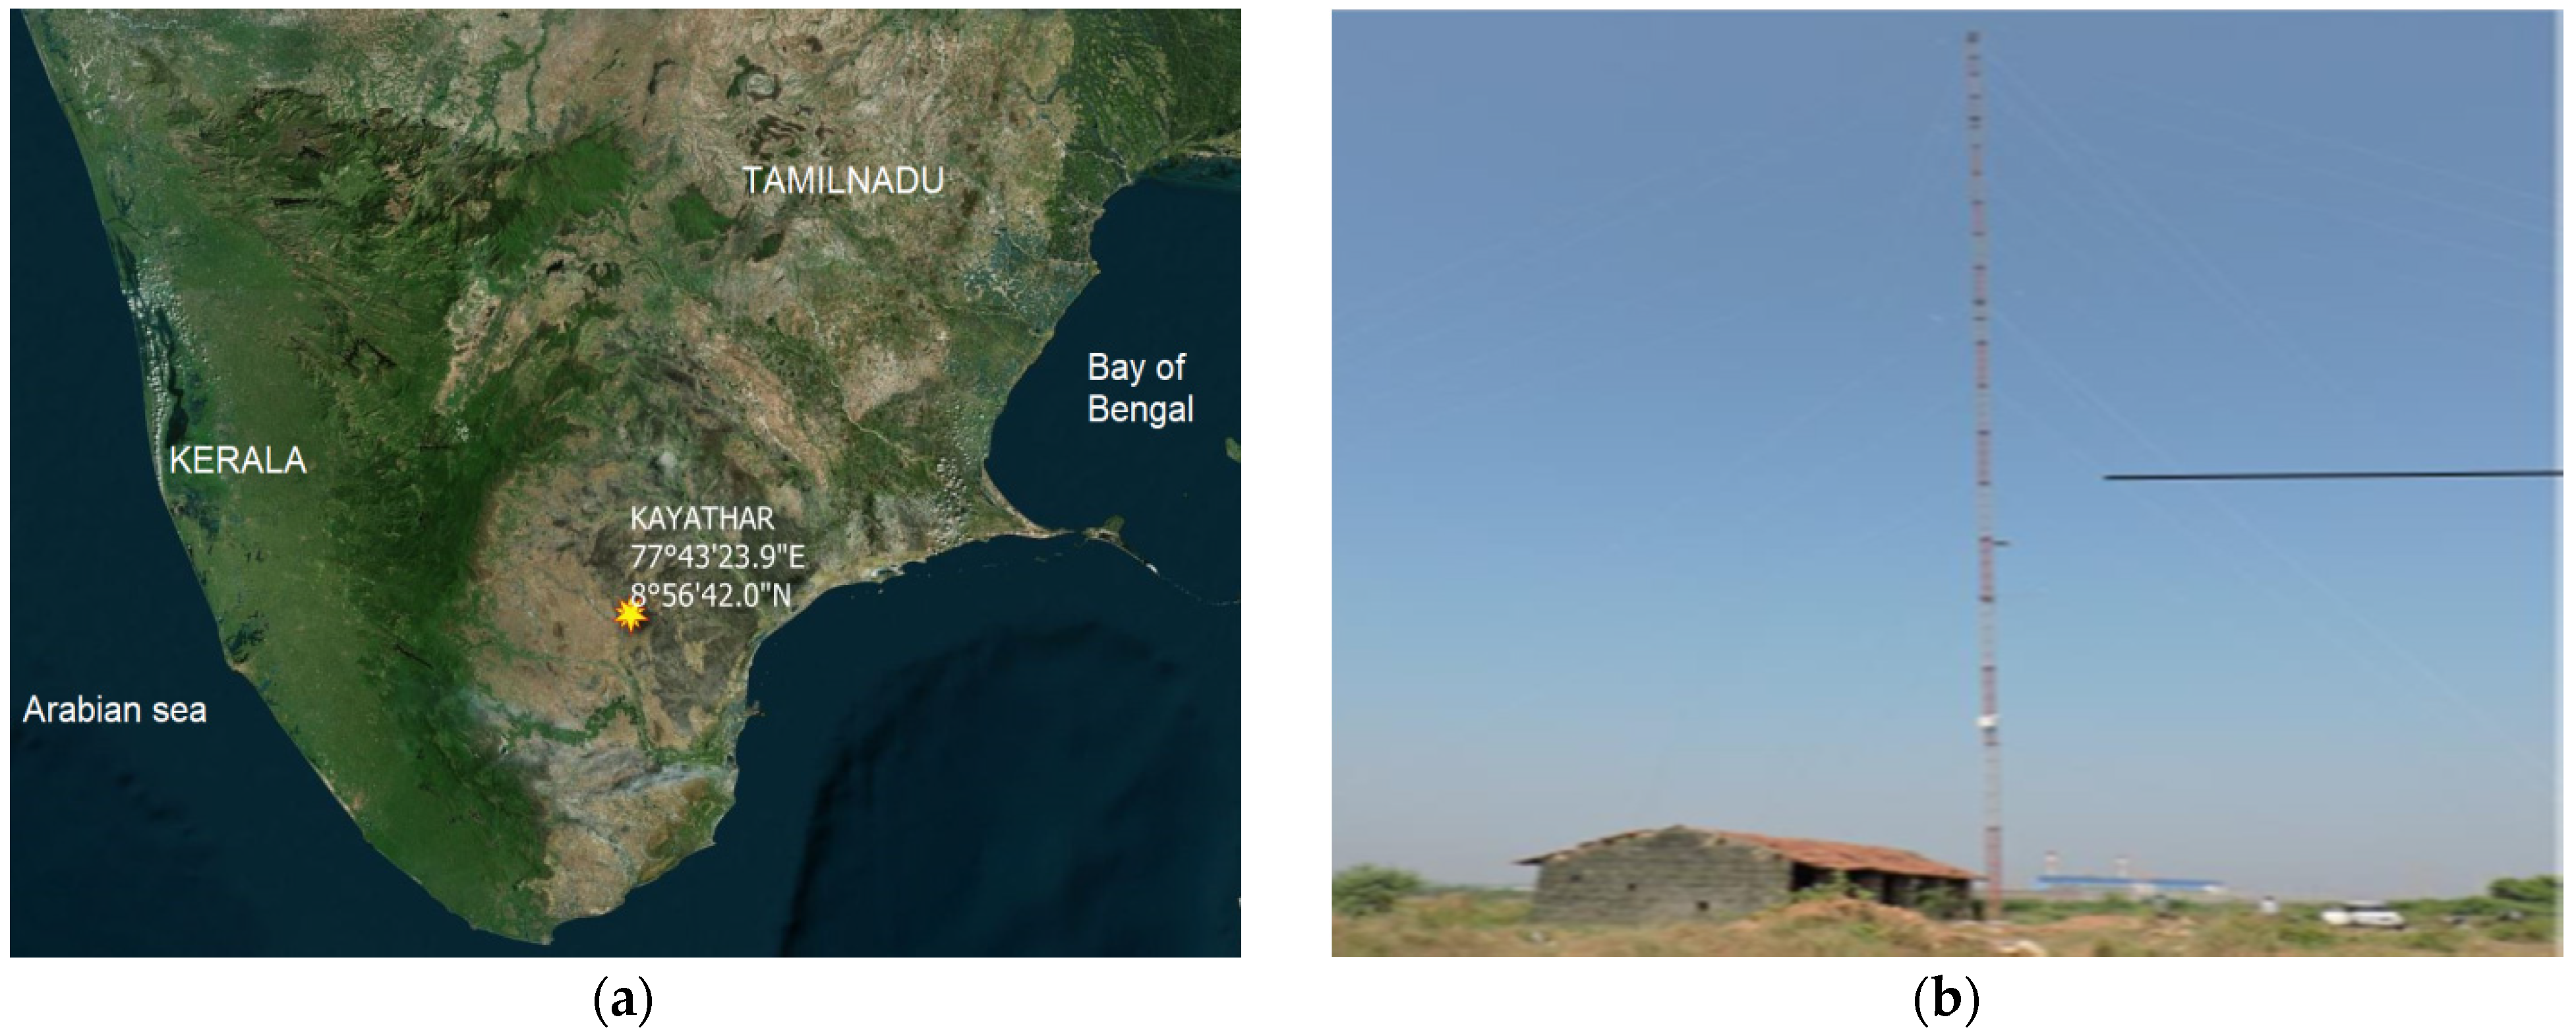
3.1. Kayathar (Tamilnadu)—Onshore Location
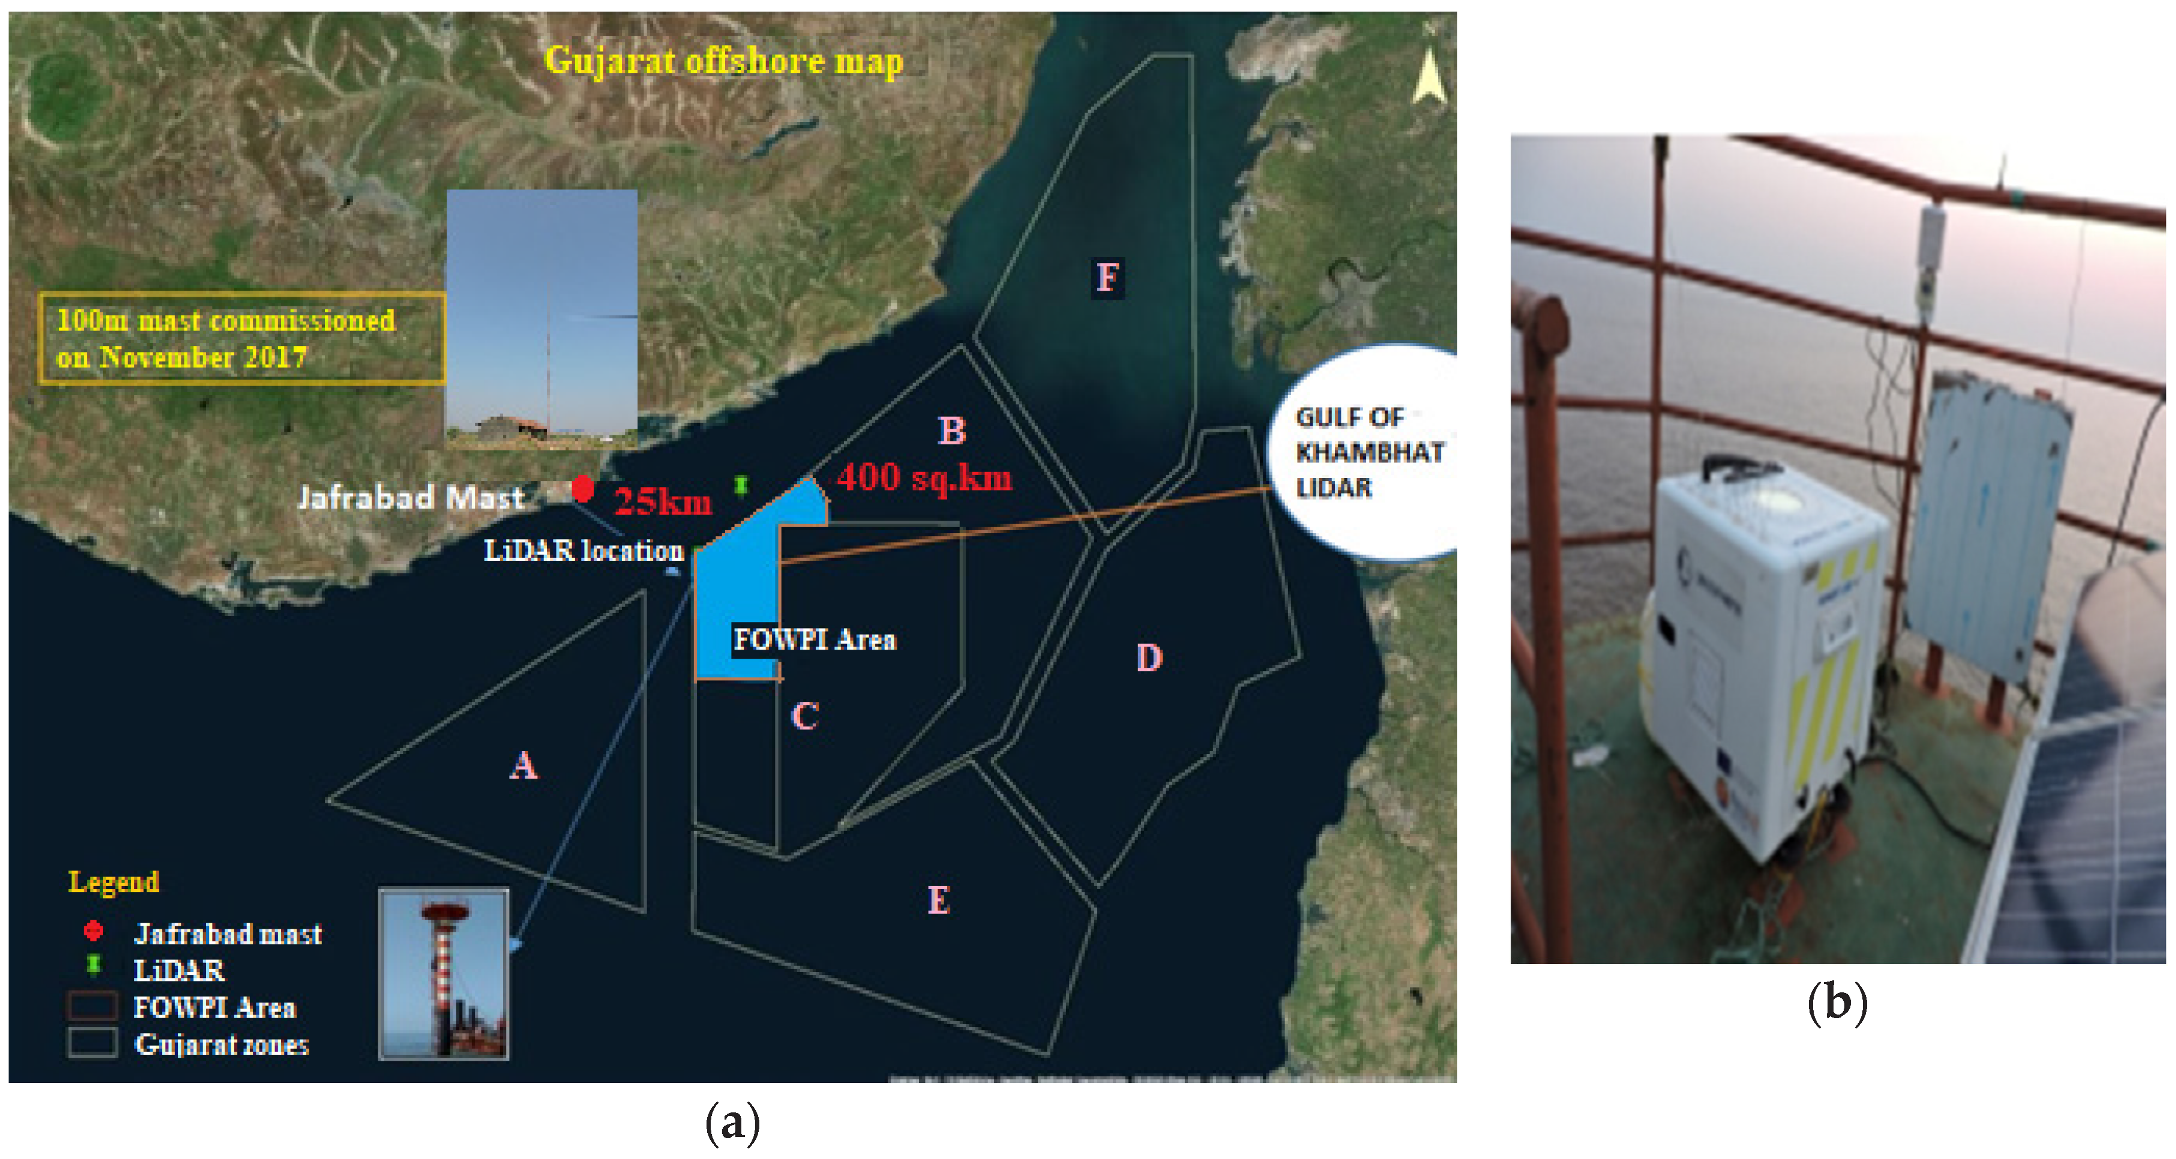
3.2. Gulf of Khambhat (Gujarat)—Offshore Location
3.3. Jafrabad (Gujarat) Nearshore Location
3.4. Seasonal Wind Periods
3.5. Moth Flame Optimization (MFO) Method
4. Results and Discussions
4.1. Wind Characteristics
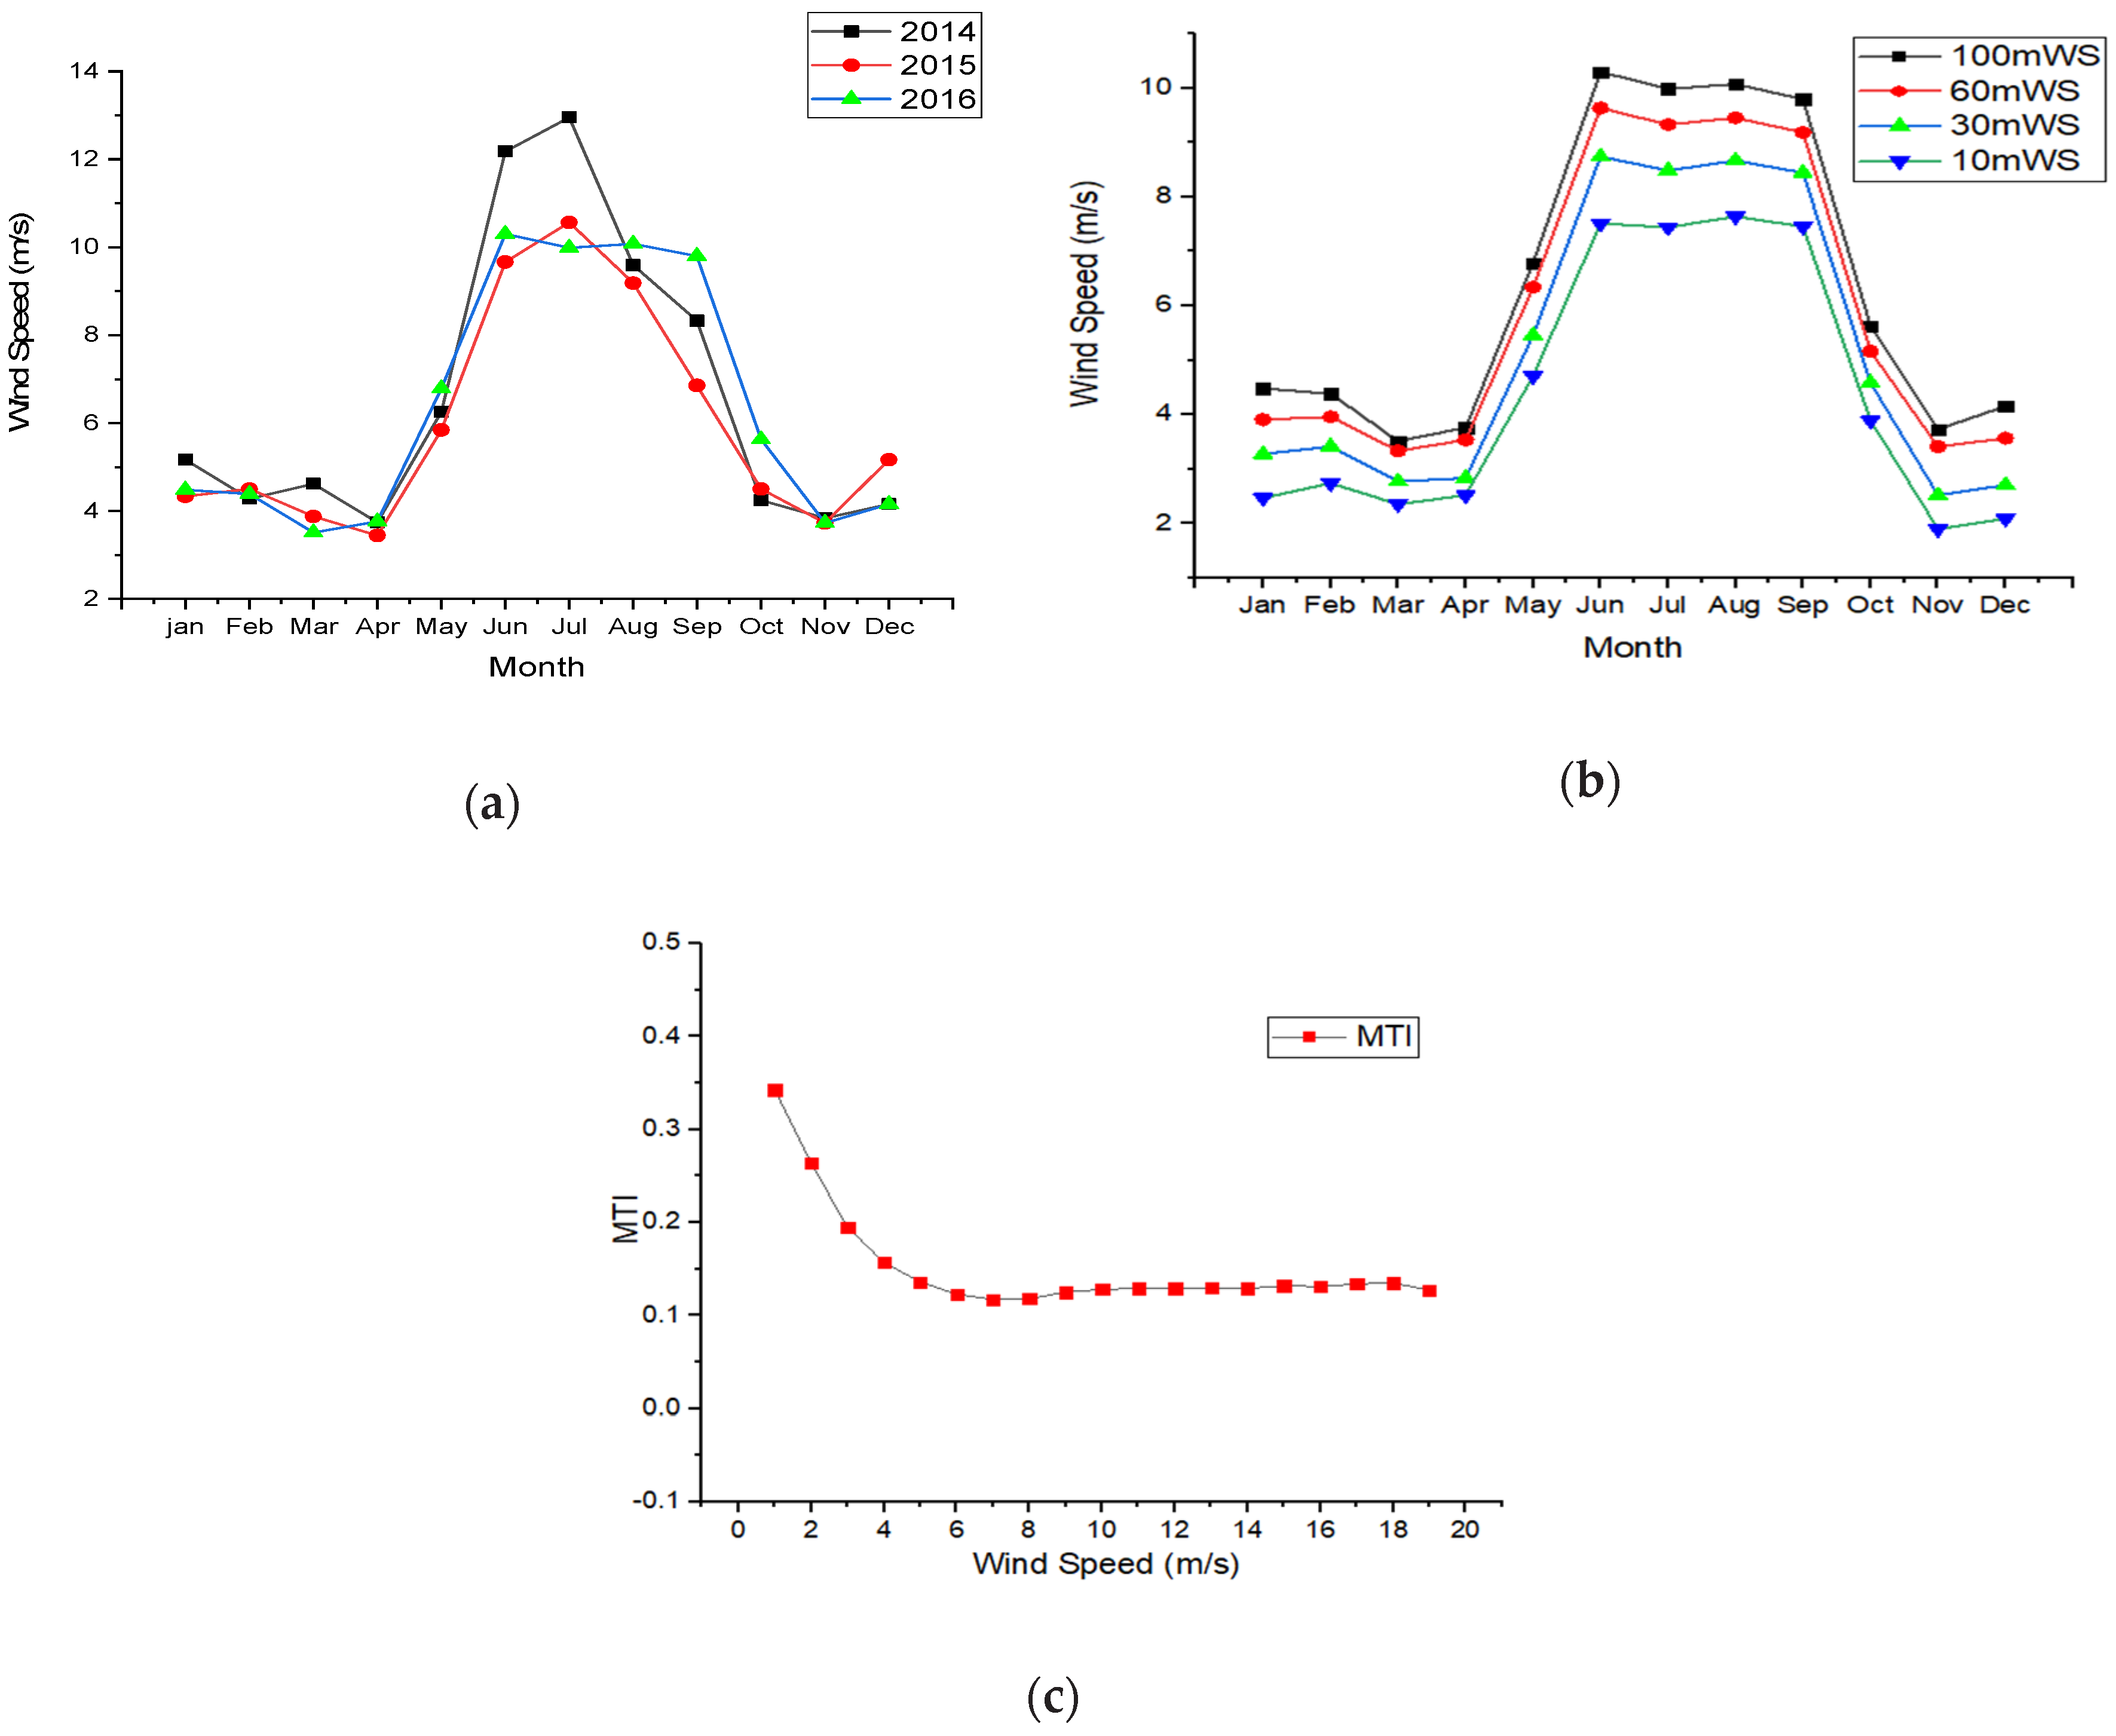
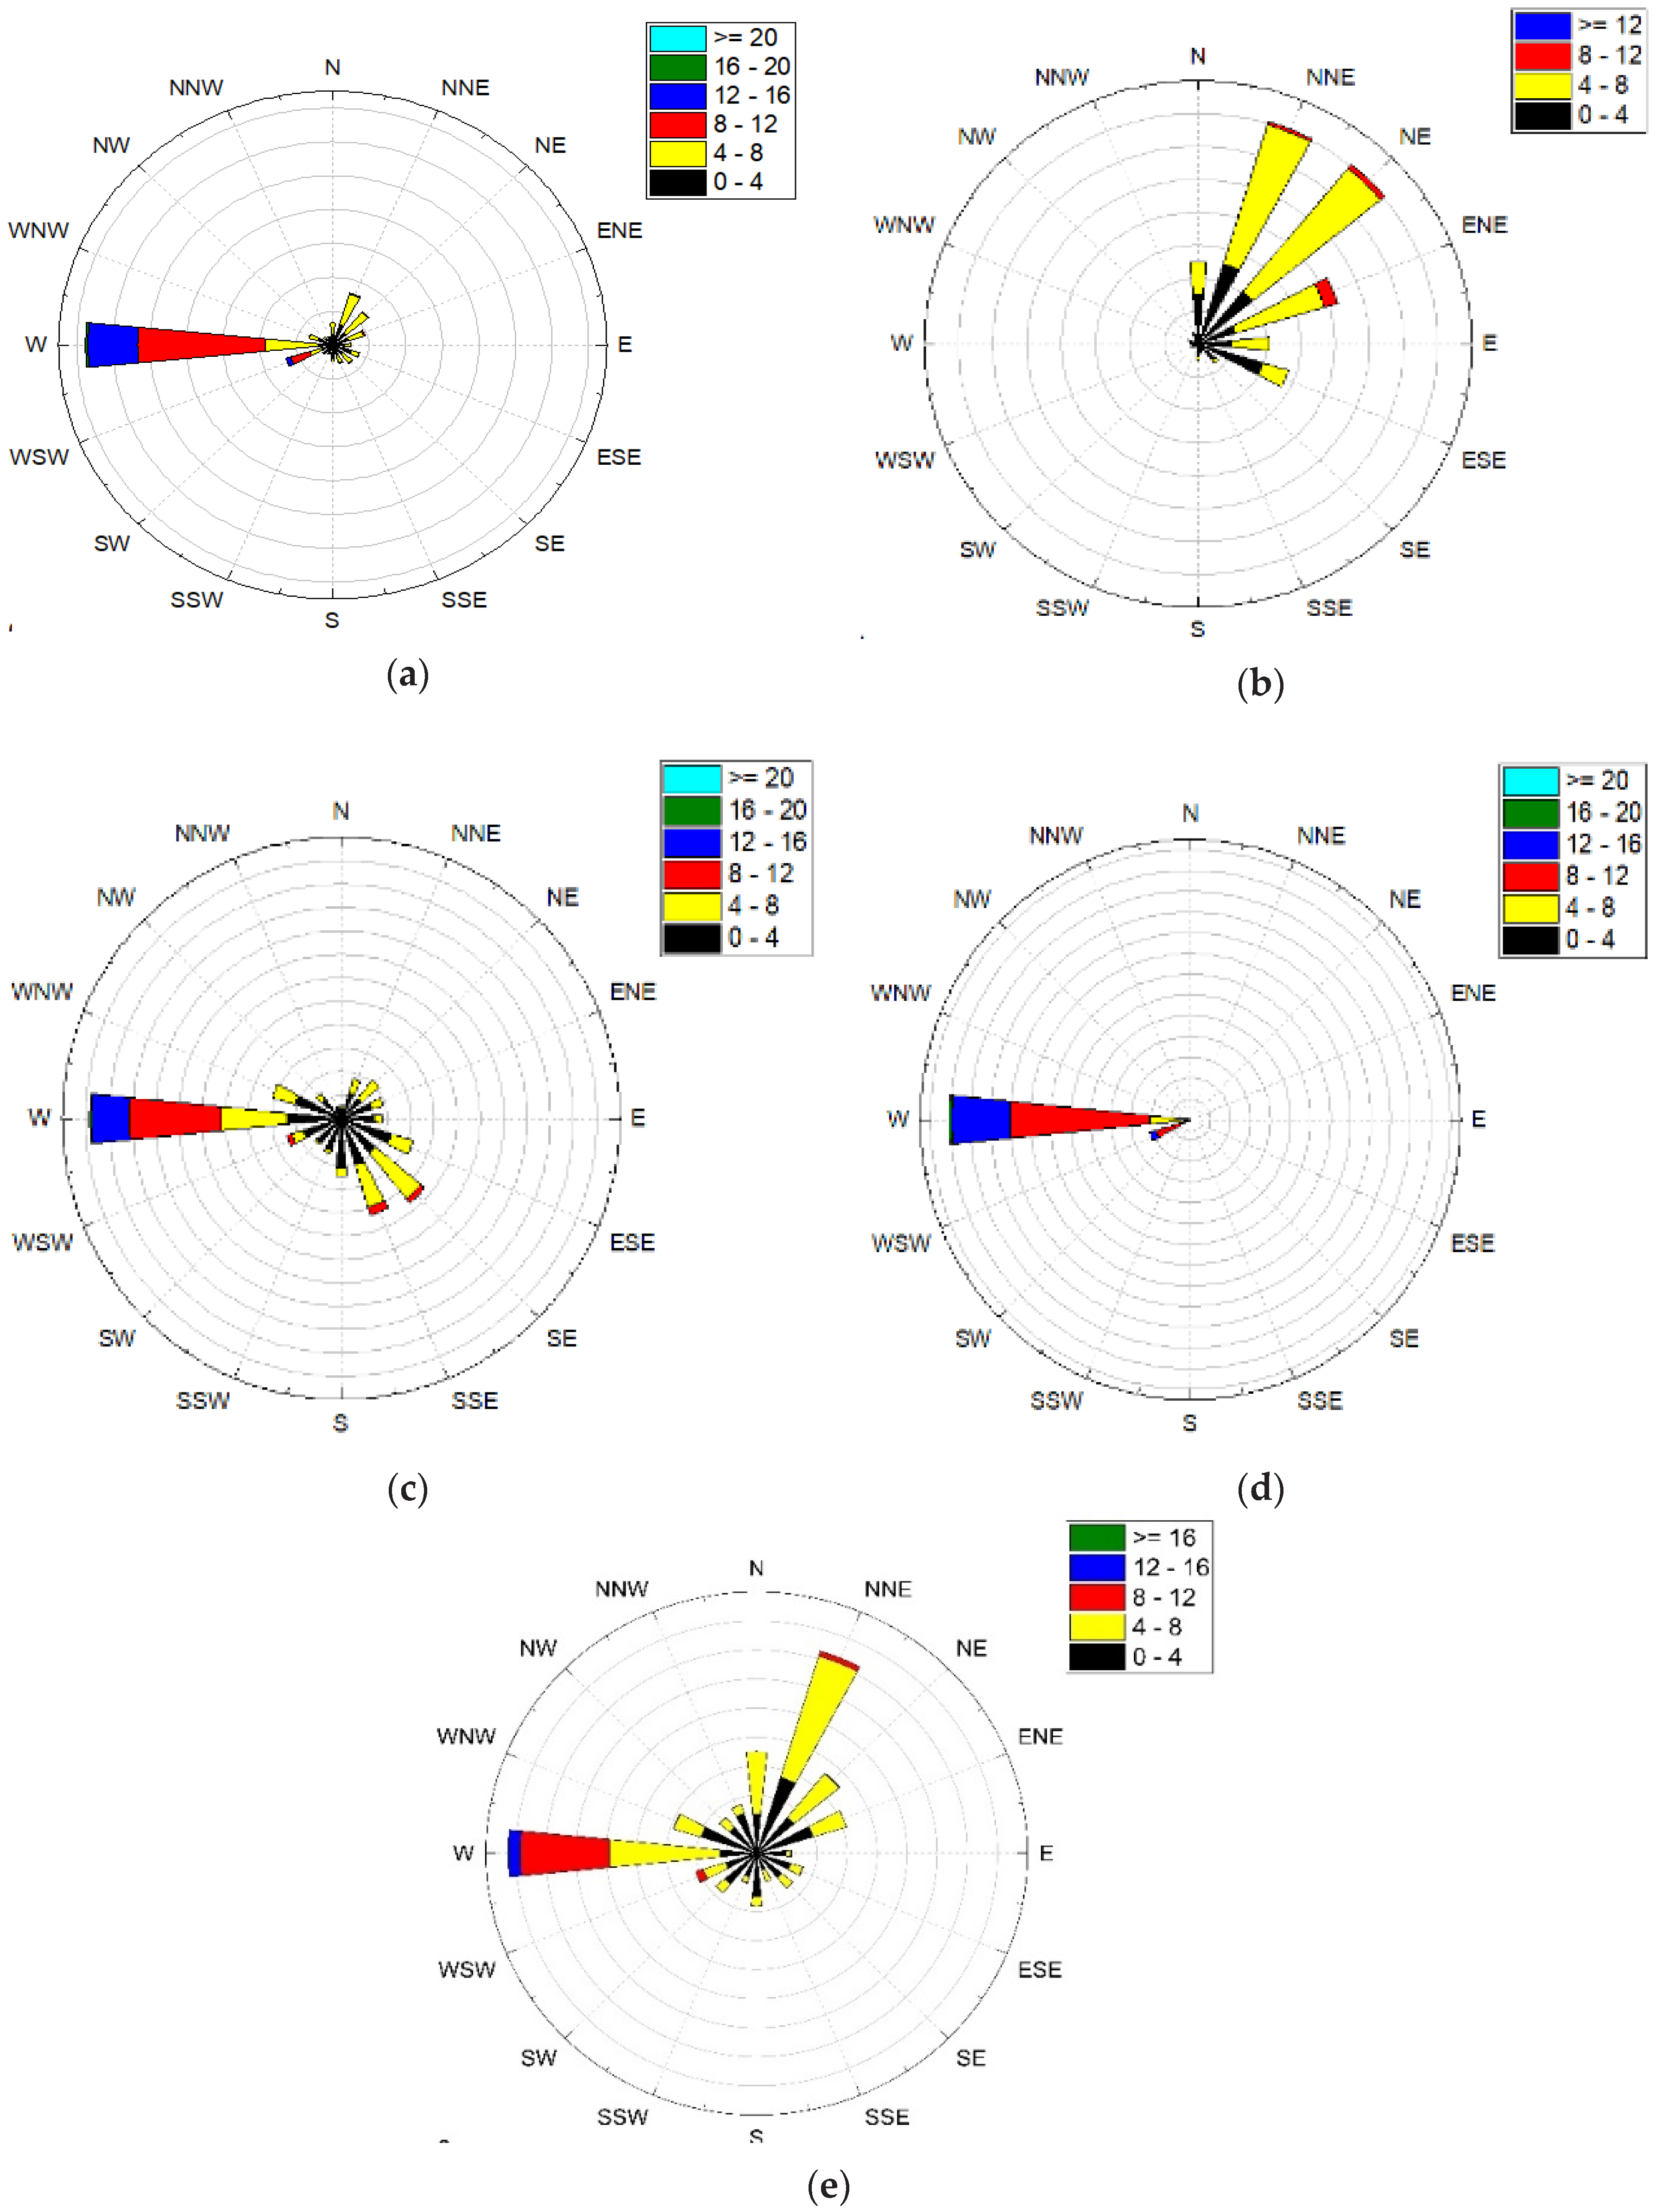
4.1.1. Kayathar Station (Onshore)
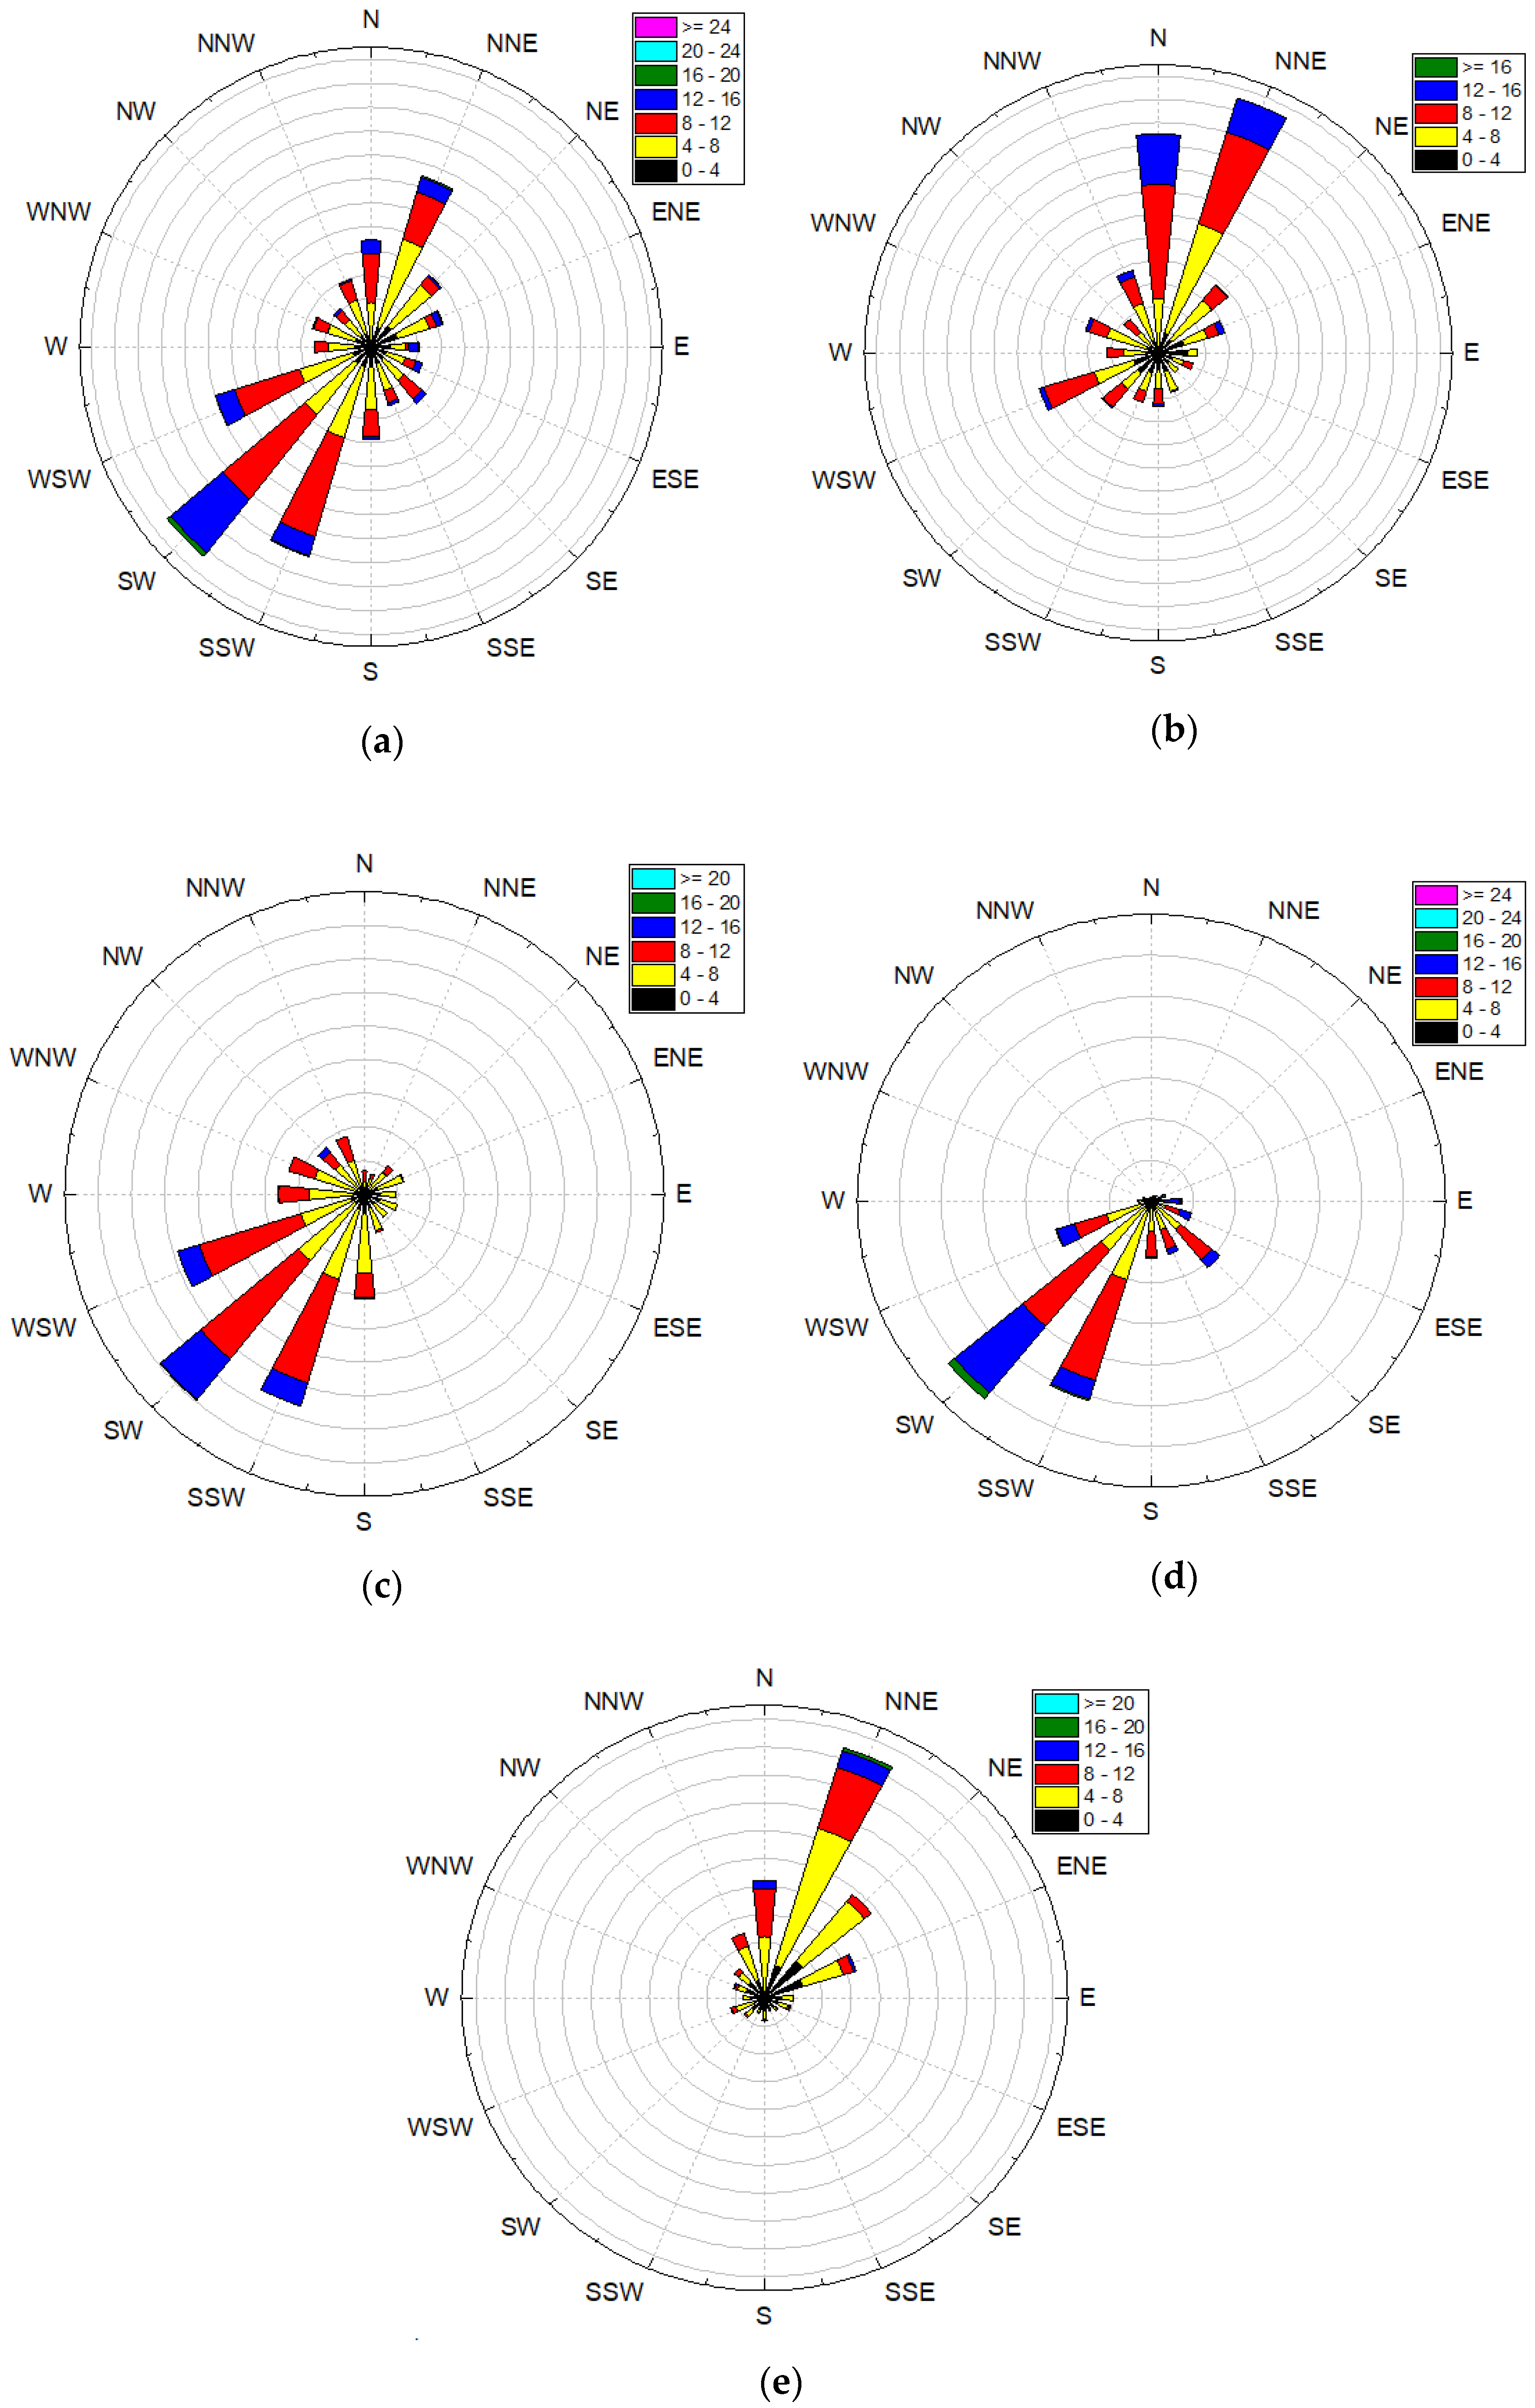
4.1.2. Gulf of Khambhat (Gujarat Offshore) Station
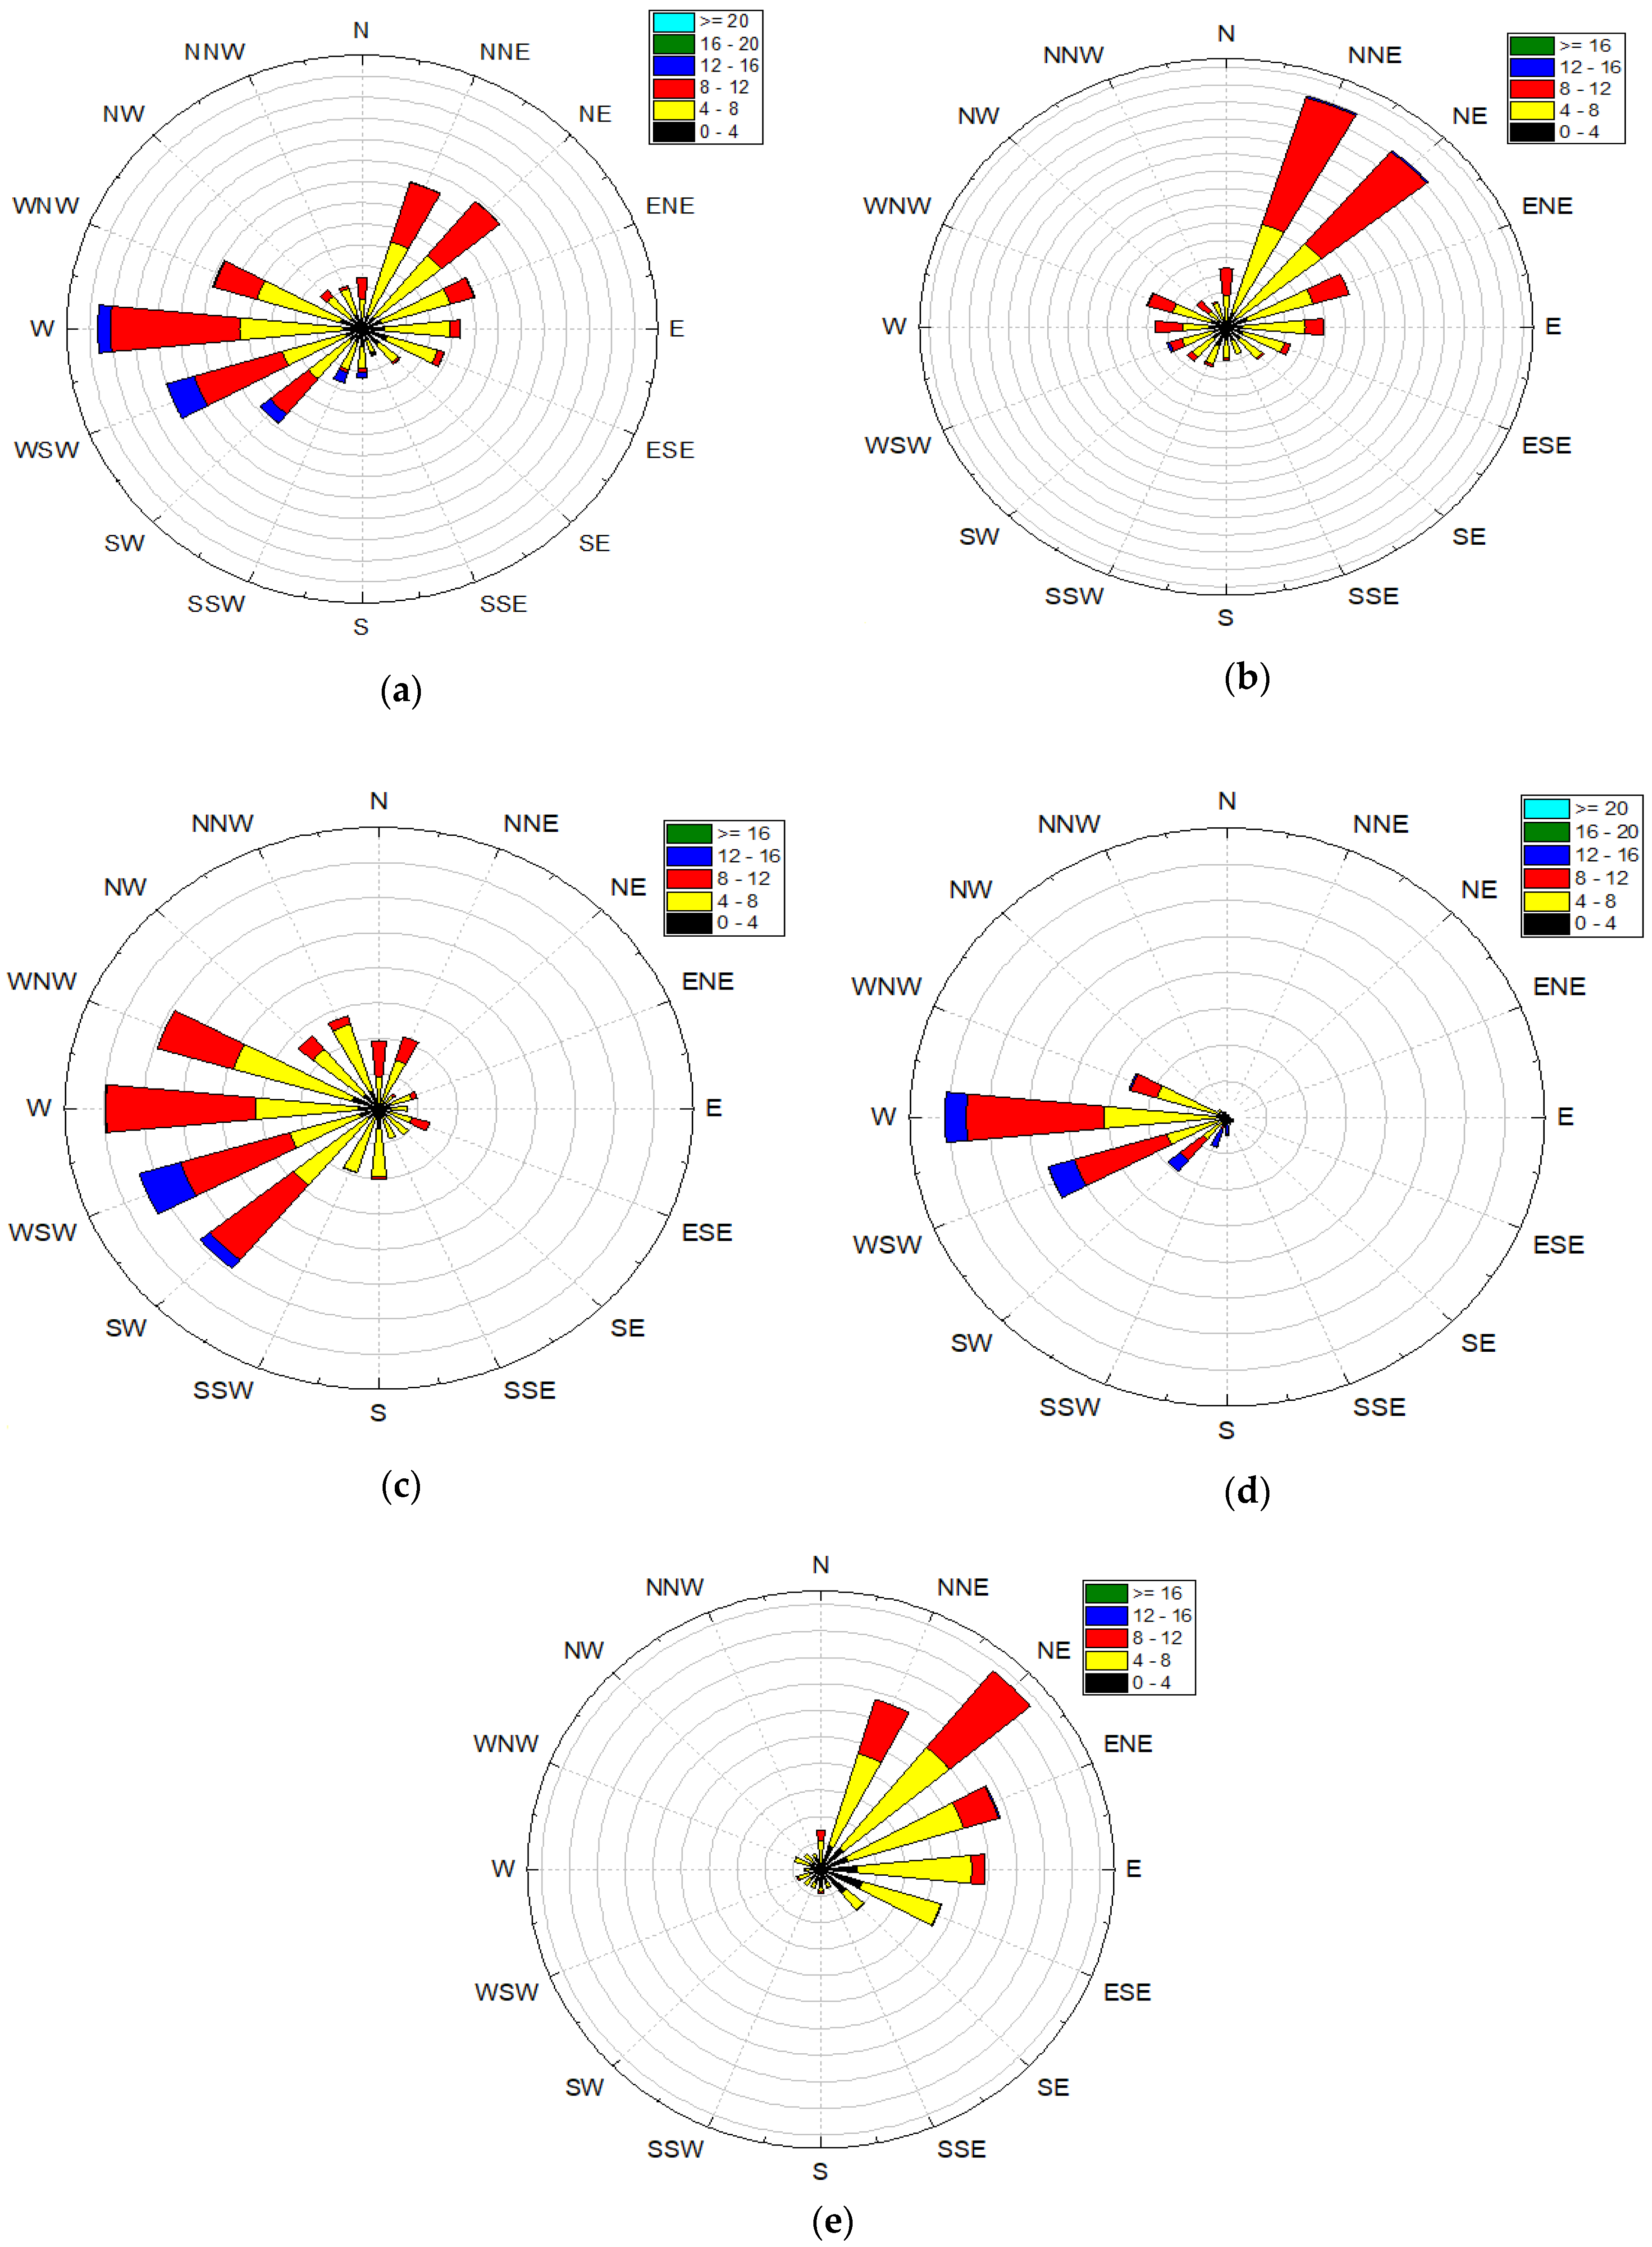
4.1.3. Jafrabad (Gujarat—Nearshore)
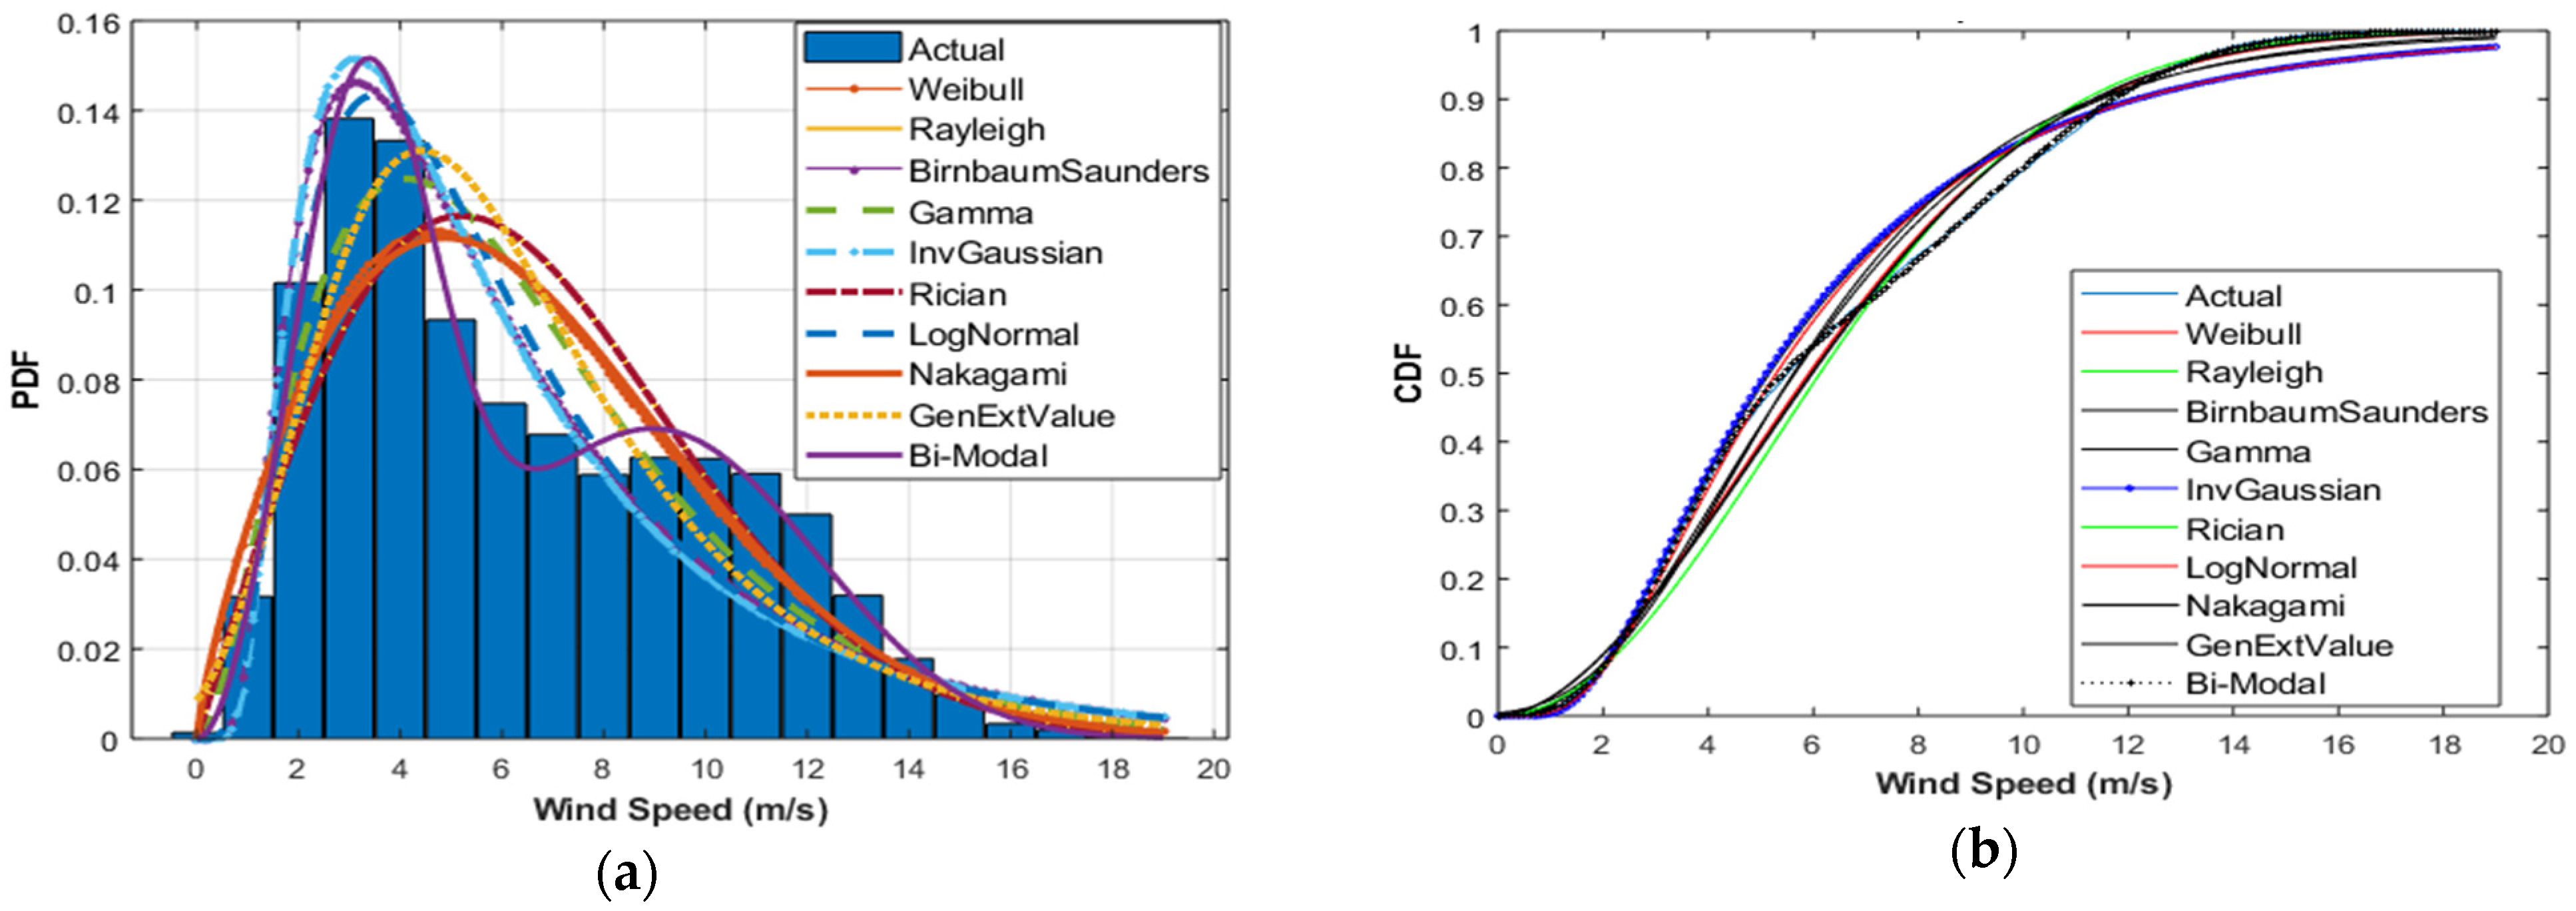
4.2. Wind Distribution Fitting
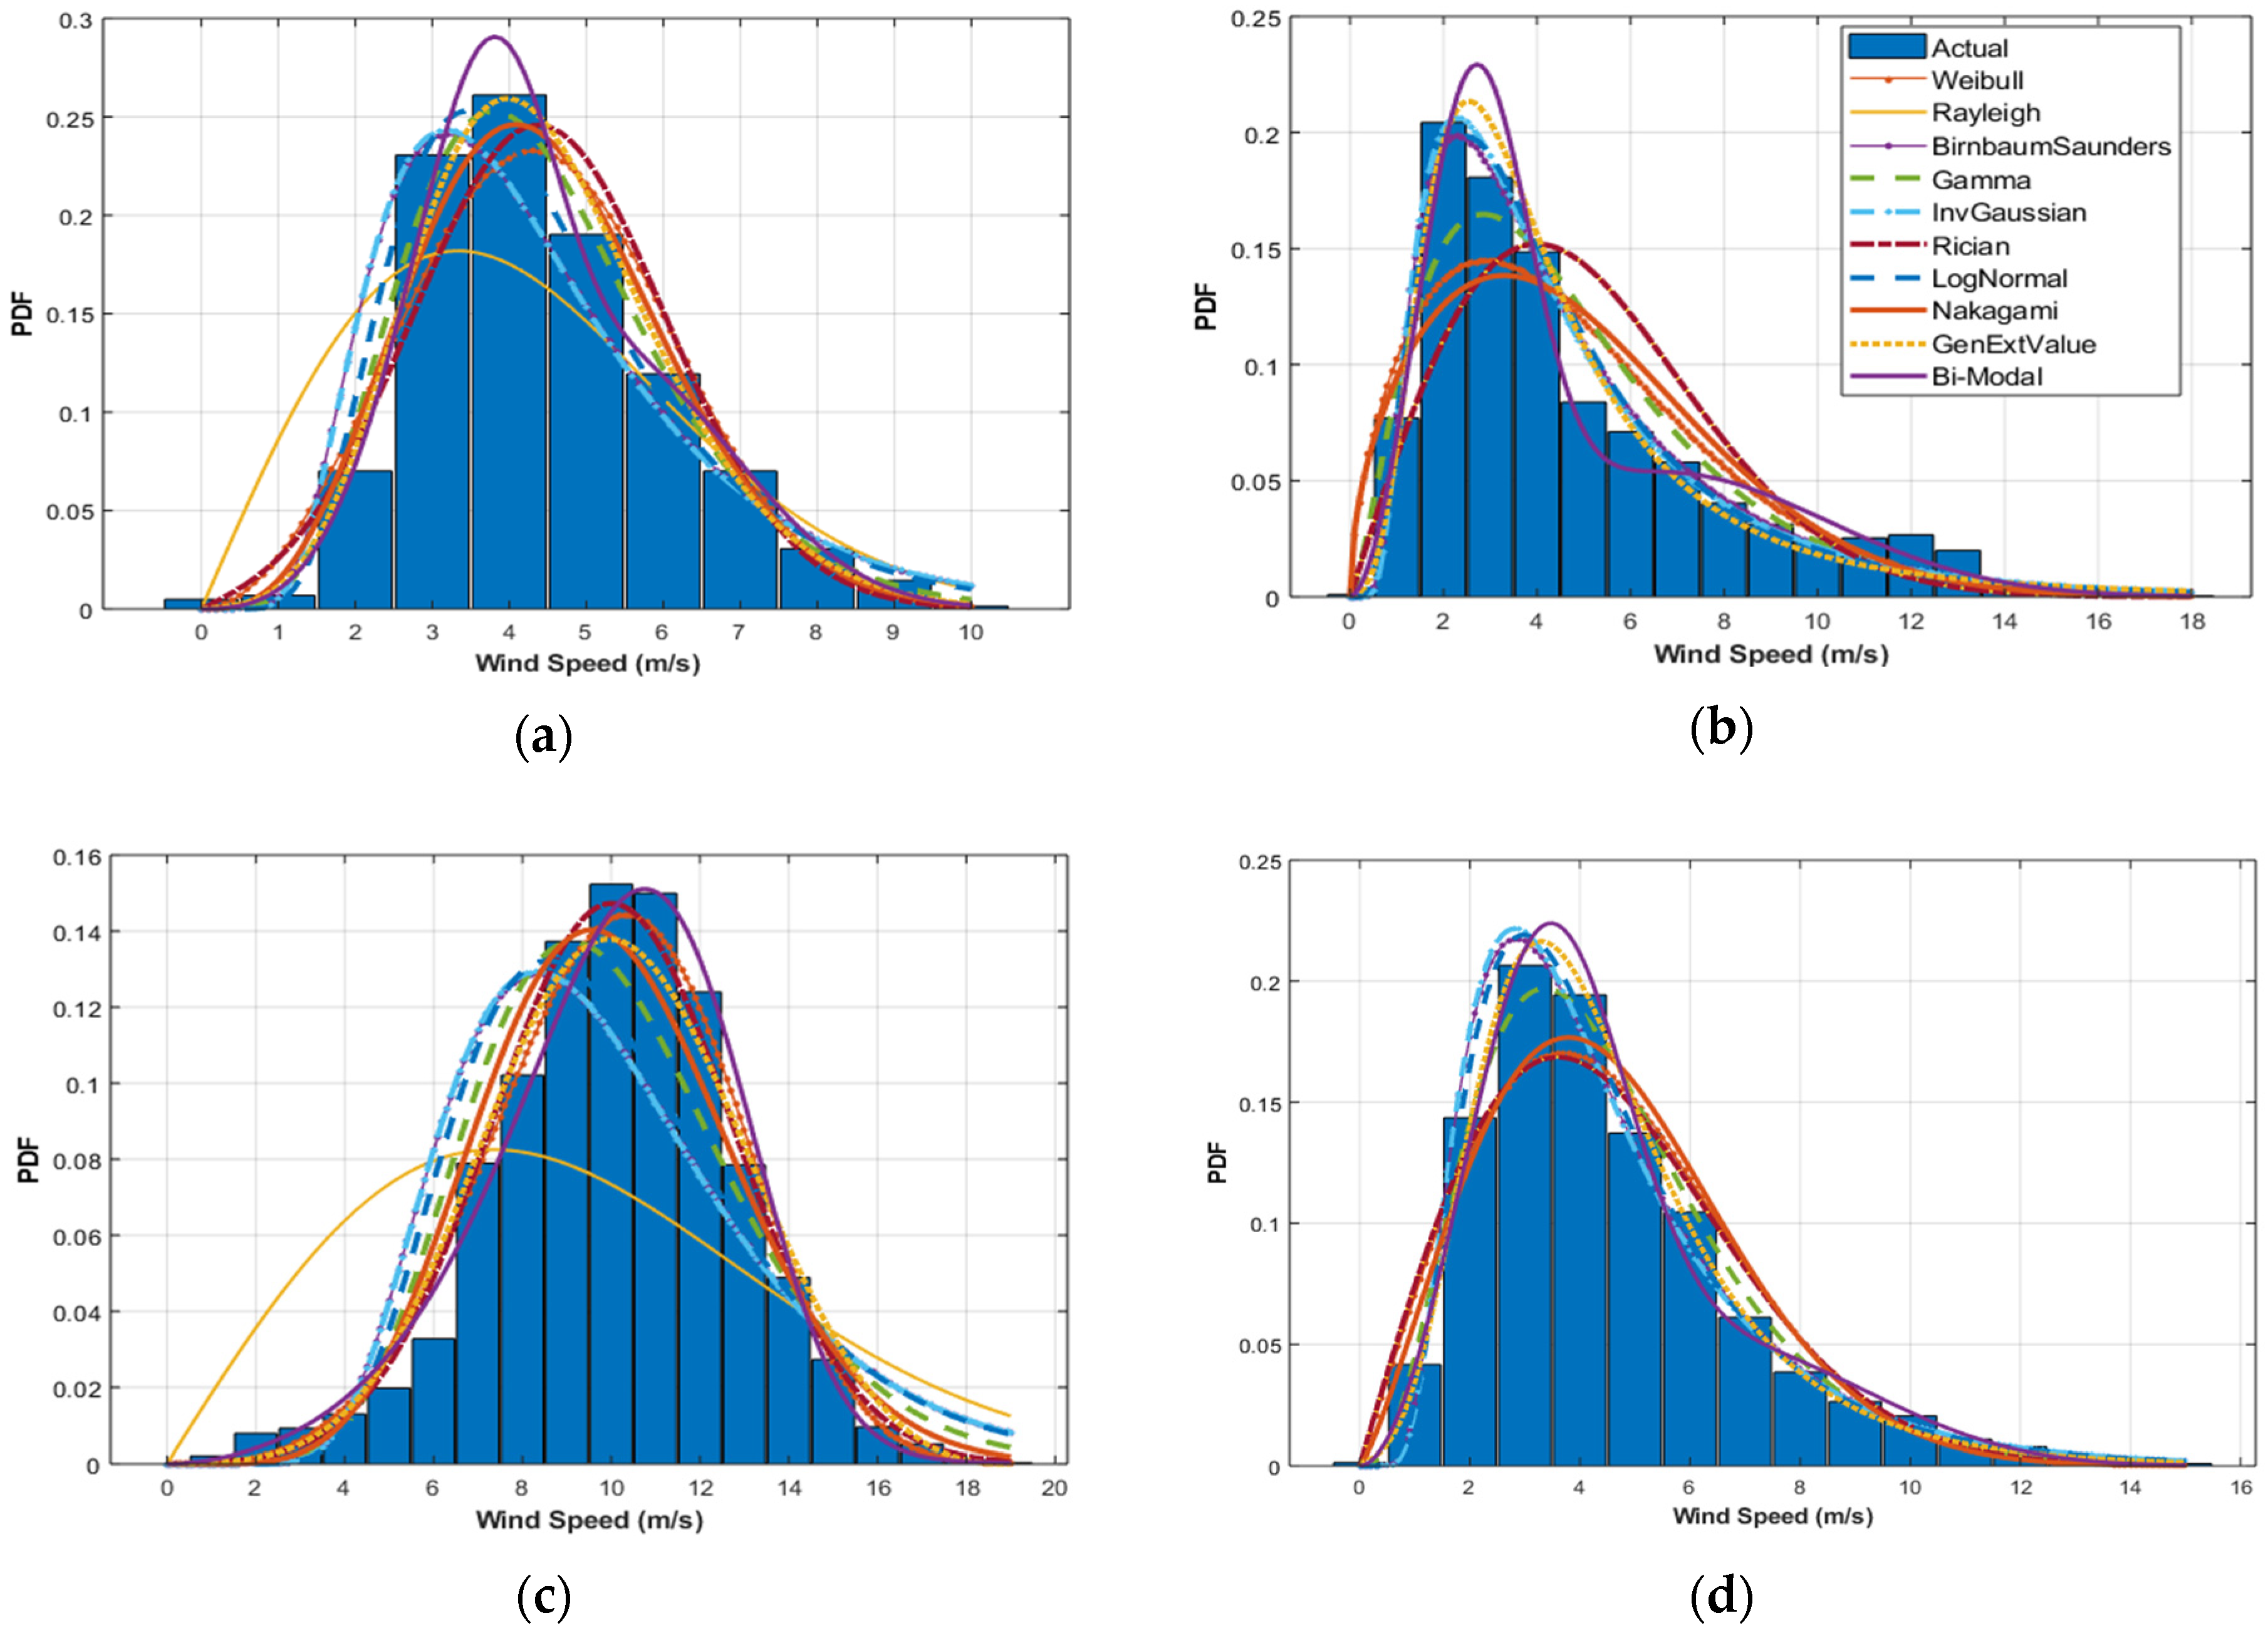
4.2.1. Kayathar Station (Onshore)
4.2.2. Bi-Modal Behavior
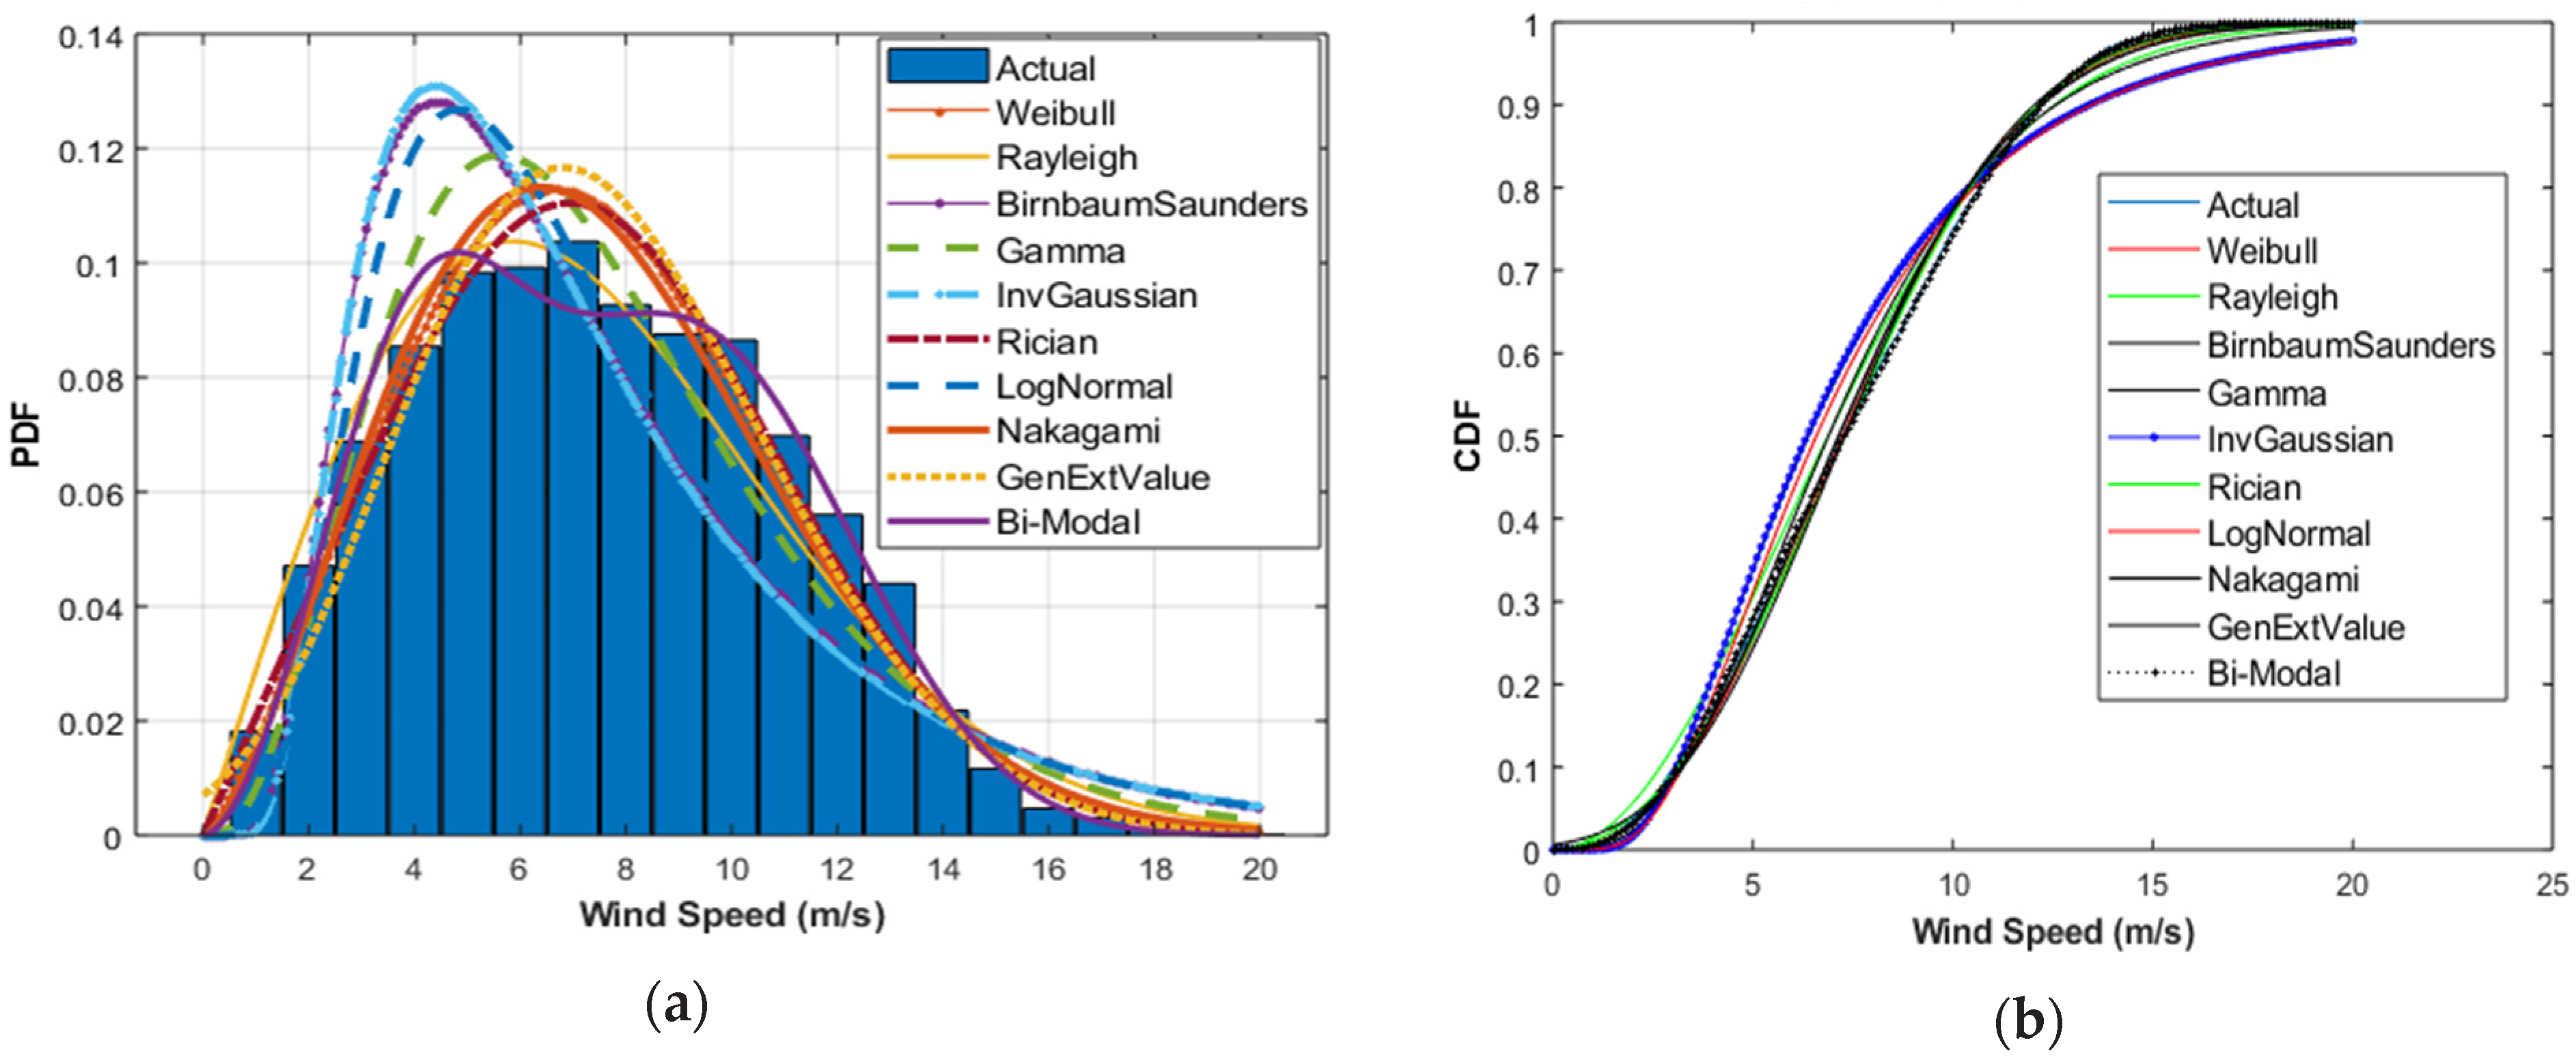
4.2.3. Gulf of Khambat (Offshore) Wind Distribution
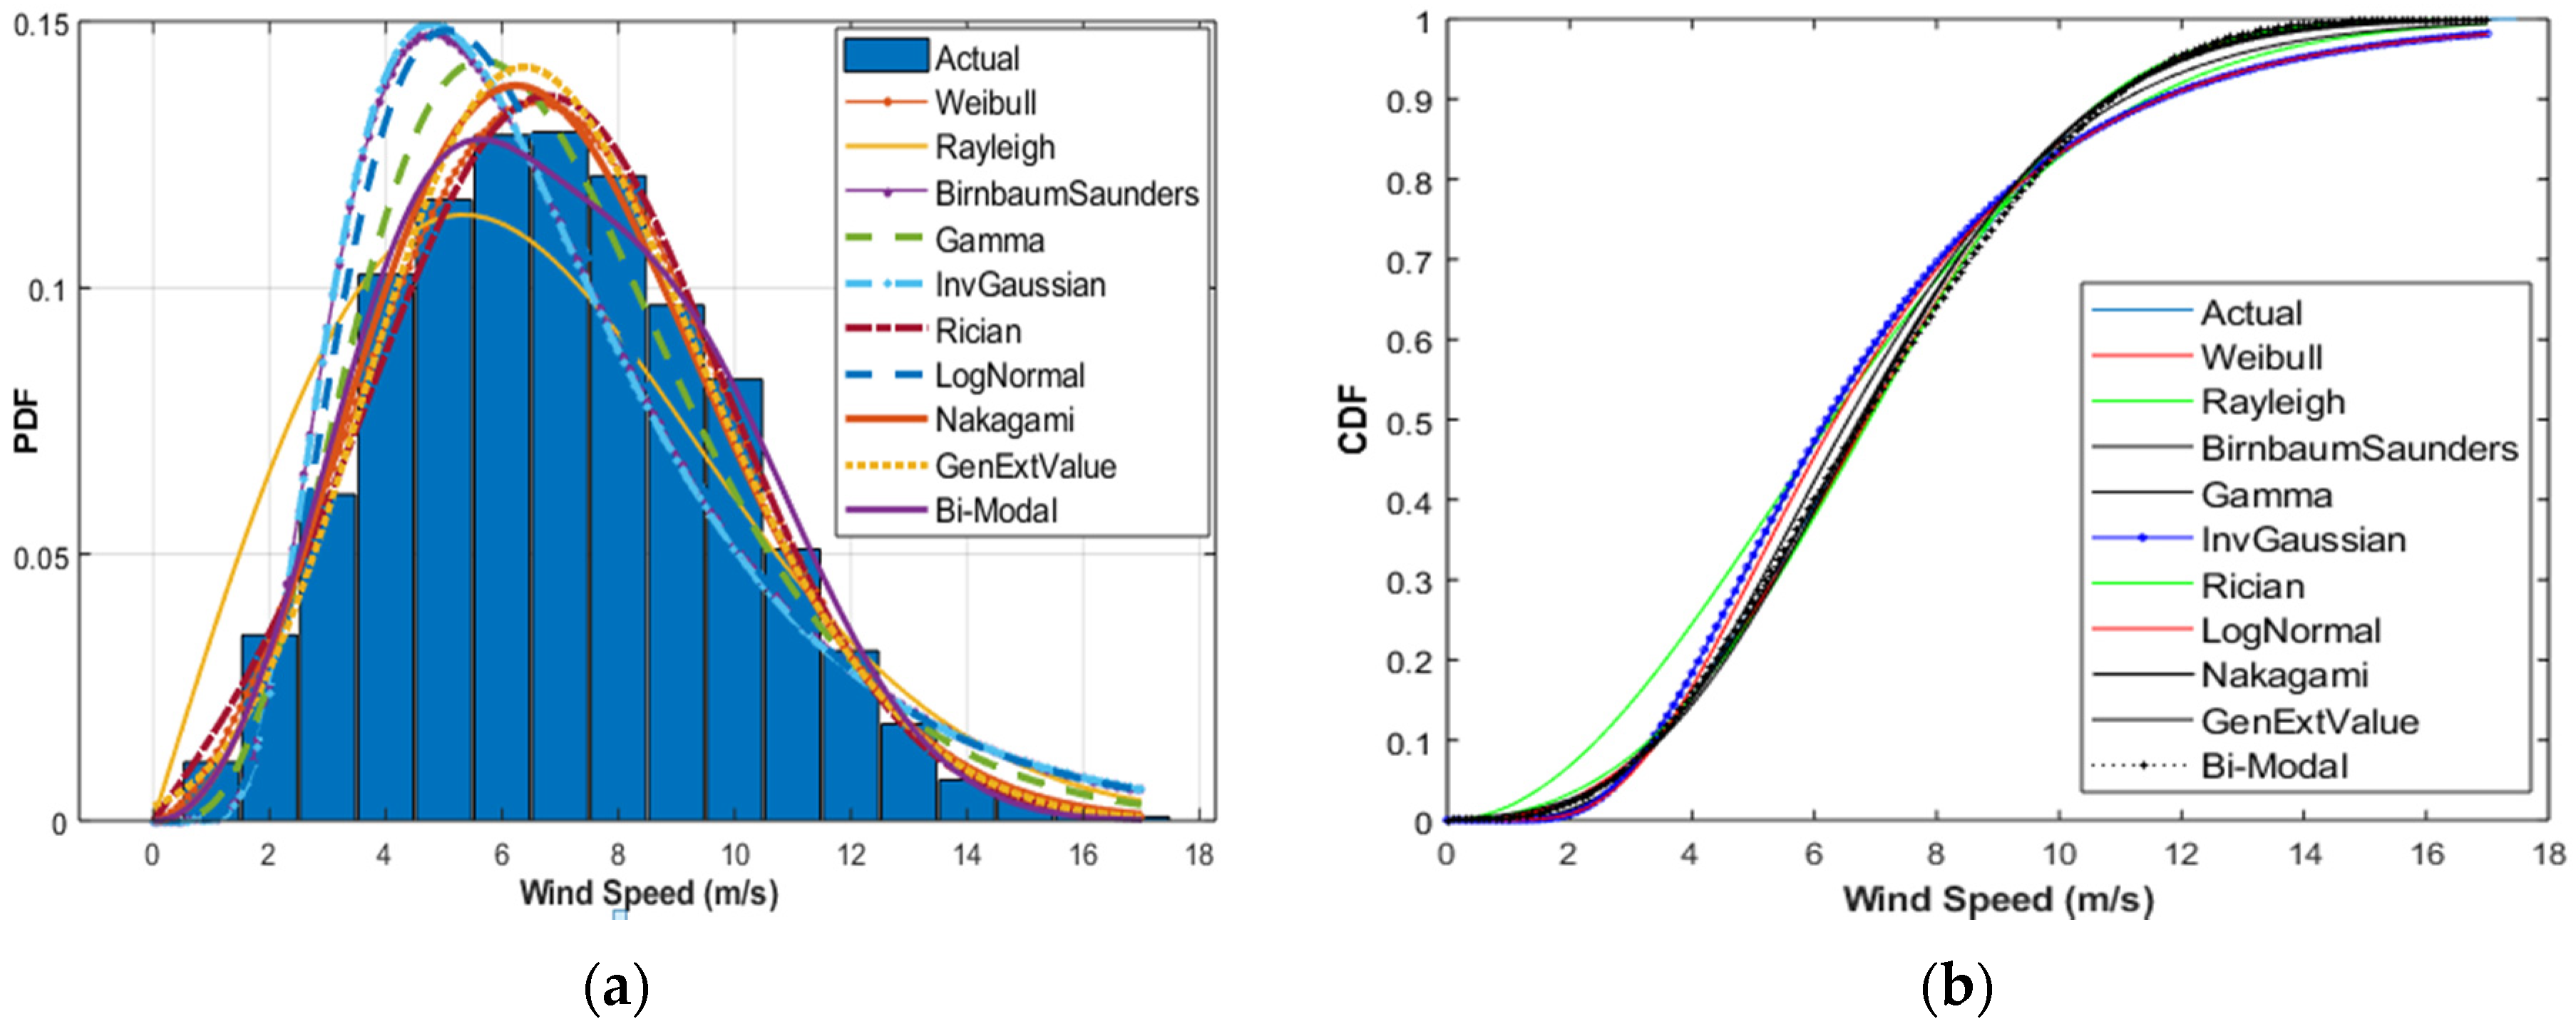
4.2.4. Jafrabad Station (Nearshore) Distribution Fitting
4.3. Optimization Methods for Parameter Estimation
Optimization Parameters Comparison
4.4. Wind Power Density Analysis (WPD)
Comparison of Wind Power Density
4.5. Research Findings
5. Conclusions
- In the offshore coastal area of the Gulf of Khambhat, Gujarat, the turbulence intensity is at the low of 0.0782 due to low surface roughness, in comparison to the onshore Kayathar wind station. The prevailing wind direction for the Gulf of Khambhat is observed on the SW (15.8%) and SSW (13.05%) from the Southwest monsoon. The northeast monsoon fetches low wind and prevailing wind direction with a wind speed of about 11.07% (NNE) and North direction of 10.17% wind speed. The WPD density measured at 100 m of Gulf of Khambhat is highest with 431.53 watts/m2, in comparison with Kayathar and Jafrabad. The annual mean wind speed is better at about 7.51 m/s.
- In the onshore area, the Kayathar region, the WPD obtained a maximum of 68% share during southwest monsoon which is highest compared with the Gulf of Khambhat and Jafrabad. During winter, it is perceived as 7%, and the bimodality nature in the annual wind pattern is achieved a great value comparing with the other two regions. The wind power class for Kayathar and Jafrabad belongs to Class 2 categories while the Gulf of Khambhat falls under the Class 3 category.
- In the nearshore area, the Jafrabad region, the mast is installed at 100 m in line of sight with LiDAR (installed at the offshore location) for correlation and validation. The distance between the two locations is roughly about 25 km. However, the wind pattern has significant variations between the offshore and nearshore, with Jafrabad with a low mean speed of 6.99 m/s in comparison with offshore measurements of 7.51 m/s.
- The influence of SW (South-west) and NEM (North east monsoon) taken for seasonal analysis. The SWM (South west monsoon) fetches more wind power generation than NE (North east).
- The conventional unimodal wind distribution models are overridden by the bimodal (Weibull–Weibull) method with the moth flame optimization method. Comparatively, the bimodal WW performed well, followed by the Nakagami, Rician, and Weibull distributions.
- This research outcome helps with investment in offshore wind farms in Gujarat, due to its higher power density obtained through the proposed method. Moreover, there would be a drop in pricing of offshore wind energy tariffs and land acquisition cost compared to onshore wind farm.
- The proposed MFO method can be extended to short term wind forecasting by optimizing the weight and bias parameters of the artificial neural network (ANN) method. The optimizing parameters of window size and neurons of long short-term memory (LSTM) would be adopted for accurate predictions.
Author Contributions
Funding
Conflicts of Interest
Notations and Abbreviations
| AIC | Akaike information criterion |
| BIC | Bayesian information criterion |
| BM | Bimodal |
| BS | Birnbaum Sandras |
| CDF | Cumulative distribution function |
| E | East |
| EM | Expectation Maximization |
| ENE | East-Northeast |
| ESE | East-Southeast |
| EV | Extreme Value |
| EW | Exponentiated Weibull |
| GEV | Generalized Extreme Value |
| GW | Gamma Weibull |
| IG | Inverse Gaussian/Inverse Gamma |
| IW | Inverse Weibull |
| KS | Kolmogorov-Smirnov |
| LiDAR | Light detection and ranging |
| LN | Lognormal |
| MEP | Maximum entropy principle |
| MFO | Moth Flame Optimization |
| MLM | Maximum Likelihood Method |
| MNRE | Ministry of New and Renewable Energy |
| MTI | Mean Turbulence Intensity |
| MWS | Mean wind speed |
| N | North |
| NE | Northeast |
| NEM | North-East Monsoon |
| NIWE | National Institute of Wind Energy |
| NK | Nakagami |
| NNE | North-Northeast |
| NNW | North-Northwest |
| NW | Northwest |
| NW | Normal Weibull |
| Probability density function | |
| R2 | Correlation coefficient |
| RI | Rician |
| RMSE | Root mean square error |
| RY | Rayleigh |
| S | South |
| SE | Southeast |
| SEM | South East Monsoon |
| SODAR | Sonic detection and ranging |
| SSE | South-Southeast |
| SSW | South-Southwest |
| SW | Southwest |
| SWM | South West Monsoon |
| W | West |
| WB | Weibull |
| WNW | West-Northwest |
| WPD | Wind power density |
| WSW | West-Southwest |
| WW | Weibull-Weibull |
Appendix A
| Algorithm 1 MFO Pseudocode Algorithm |
| Update flame no using Equation (6) OM = Fitness Function(M); if iteration == 1 F = sort(M); OF = sort (OM); else F = sort (Mt-1, Mt); OF = sort (Mt-1, Mt); end for i = 1: n for j = 1: d Update r and t Calculate D using Equation (5) with respect to the corresponding moth Update M (i, j) using Equation (3) and Equation (4) with respect to the corresponding moth end end |
Appendix B. Wind Distribution Parameters (PDFs and CDFs)
References
- Ministry of New and Renewable Energy (MNRE). India-Paris Agreement Commitments, the Government of India. MNRE Annual Report 2018-19; MNRE: New Dehli, India, 2019.
- Rajvikram, M.E. Comprehensive Review on India’s Growth in Renewable Energy Technologies in Comparison With Other Prominent Renewable Energy Based Countries. J. Sol. Energy Eng. 2019, 142, 030801. [Google Scholar]
- Rajvikram, M.E. The Motivation for Renewable Energy and its Comparison with Other Energy Sources: A Review. Eur. J. Sustain. Dev. Res. 2019, 93, em0076. [Google Scholar]
- Ministry of New and Renewable Energy (MNRE). Programme Scheme Wise Physical Progress in 2019-20 and Cumulative up to March 2020; MNRE: New Dehli, India, 2020.
- Rajvikram, M.E.; Shafiullah, G.M.; Nallapaneni, M.K.; Sanjeevikumar, P. A State-of-the-Art Review on the Drive of Renewables in Gujarat, State of India: Present Situation, Barriers and Future Initiatives. Energies 2020, 13, 40. [Google Scholar]
- Rajvikram, M.E.; Shafiullah, G.M.; Sanjeevikumar, P.; Nallapaneni, M.K.; Annapurna, A.; Ajayragavan, M.V. A Comprehensive Review on Renewable Energy Development, Challenges, and Policies of Leading Indian States with an International Perspective. IEEE Access 2020, 8, 74432–74457. [Google Scholar]
- Prabir, D. Offshore Wind Energy in India. MNRE Report April 2019; MNRE: New Dehli, India, 2019. Available online: https://mnre.gov.in/img/documents/uploads/2e423892727a456e93a684f38d8622f7.pdf (accessed on 1 April 2019).
- Global Wind Energy Council. Global Wind Energy Report April 2019; Global Wind Energy Council: Brussels, Belgium, 2019. [Google Scholar]
- Tim, O. Small Wind Site Assessment Guideline; National Renewable Energy Laboratory (NREL) USA Technical Report: Golden, CO, USA, 2015.
- Kang, D.; Ko, K.; Huh, J. Comparative Study of Different Methods for Estimating Weibull Parameters: A Case Study on Jeju Island, South Korea. Energies 2018, 11, 356. [Google Scholar] [CrossRef] [Green Version]
- Pobočíková, I.; Sedliačková, Z.; Michalková, M. Application of four probability distributions for wind speed modeling. Procedia Eng. 2017, 192, 713–718. [Google Scholar] [CrossRef]
- Yilmaz, V.; Heçeli, K.A. Statistical approach to estimate the wind speed distribution: The case of Gelibolu region. Doğuş Üniversitesi Dergisi 2008, 9, 122–132. [Google Scholar] [CrossRef]
- Amaya-Martinez, P.A.; Saavedra-Montes, A.J.; Arango-Zuluaga, E.I. A statistical analysis of wind speed distribution models in the Aburrá Valley, Colombia. Ciencia Tecnologia y Futuro 2014, 5, 121–136. [Google Scholar] [CrossRef] [Green Version]
- Mohamad, M.A.; Youssef, K.; Hüseyin, C. Assessment of wind energy potential as a power generation source: A case study of eight selected locations in Northern Cyprus. Energies 2018, 11, 2697. [Google Scholar]
- Morgan, E.C.; Lackner, M.; Vogel, R.M.; Baise, L.G. Probability distribution for offshore wind speeds. Energy Convers. Manag. 2011, 52, 15–26. [Google Scholar] [CrossRef]
- Gómez-Lázaro, E.; Bueso, M.C.; Kessler, M.; Martín-Martínez, S.; Zhang, J.; Hodge, B.M.; Molina-García, A. Probability Density Function Characterization for Aggregated Large-Scale Wind Power Based on Weibull Mixtures. Energies 2016, 9, 91. [Google Scholar] [CrossRef] [Green Version]
- Tian, P.C. Estimation of wind energy potential using different probability density functions. Appl. Energy 2011, 88, 1848–1856. [Google Scholar]
- Ravindra, K.; Srinivasa, R.R.; Narasimham, S.V.L.; Krishna, M.P. Mixture probability distribution functions to model wind speed distributions. Int. J. Energy Environ. Eng. 2012, 3, 27. [Google Scholar]
- Ijjou, T.; Fatima, E.G.; Hassane, B.; Brahim, B. Wind speed distribution modelling for wind power estimation: Case of Agadir in Morocco. Wind Eng. 2019, 43, 190–200. [Google Scholar]
- Jianxing, Y.; Yiqin, F.; Yang, Y.; Shibo, W.; Yuanda, W.; Minjie, Y.; Shuai, G.; Mu, L. Assessment of Offshore Wind Characteristics and Wind Energy Potential in Bohai Bay, China. Energies 2019, 12, 2879. [Google Scholar]
- Mekalathur, B.H.K.; Saravanan, B.; Padmanaban, S.; Jens, B.H.N. Wind Energy Potential Assessment by Weibull Parameter Estimation Using Multiverse Optimization Method: A Case Study of Tirumala Region in India. Energies 2019, 12, 2158. [Google Scholar]
- de Andrade, C.F.; dos Santos, L.F.; Macedo, M.V.S.; Rocha, P.A.C.; Gomes, F.F. Four heuristic optimization algorithms applied to wind energy: Determination of Weibull curve parameters for three Brazilian sites. Int. J. Energy Environ. Eng. 2019, 10, 1–12. [Google Scholar] [CrossRef] [Green Version]
- Kasra, M.; Omid, A.; Jon, G.M. Use of Birnbaum-Saunders distribution for estimating wind speed and wind power probability distributions: A review. Energy Convers. Manag. 2017, 143, 109–122. [Google Scholar]
- Jaramillo, O.A.; Borja, M.A. Bimodal versus Weibull wind speed distributions an analysis of wind energy potential in La Venta, Mexico. Wind Eng. 2004, 28, 225–234. [Google Scholar] [CrossRef]
- Seshaiah, V.; Indhumathy, D. Analysis of Wind Speed at Sulur—A Bimodal Weibull and Weibull Distribution. Int. J. Latest Eng. Manag. Res. 2017, 2, 29–37. [Google Scholar]
- Feng, J.L.; Hong, K.; Shyi, K.; Ying, H.; Tian, C. Study on Wind Characteristics Using Bimodal Mixture Weibull Distribution for Three Wind Sites in Taiwan. J. Appl. Sci. Eng. 2014, 17, 283–292. [Google Scholar]
- Prem, K.C.; Siraj, A.; Vilas, W. Wind characteristics observation using Doppler-SODAR for wind energy applications. Resour.-Effic. Technol. 2017, 3, 495–505. [Google Scholar]
- Wind Power Profile of Tamilnadu State. Indianwindpower.com Web Portal. Available online: http://indianwindpower.com/pdf/Wind-Power-Profile-of-Tamilnadu-State.pdf (accessed on 21 June 2019).
- Palaneeswari, T. Wind Power Development in Tamilnadu. Int. J. Res. Soc. Sci. 2018, 8, 661–673. [Google Scholar]
- Wind Power Profile of Gujarat State. Indianwindpower.com Web Portal. Available online: http://www.indianwindpower.com/pdf/Gujarat-State-Wind-Power-Profile.pdf. (accessed on 16 April 2018).
- Seyedali, M. Moth-flame optimization algorithm: A novel nature-inspired heuristic paradigm. Knowl.-Based Syst. 2015, 89, 228–249. [Google Scholar]
- Jain, D. Skew and Kurtosis: 2 Important Statistics Terms You Need to Know in Data Science. Codeburst.io Web Portal. Available online: https://codeburst.io/2-important-statistics-terms-you-need-to-know-in-data-science-skewness-and-kurtosis-388fef94eeaa (accessed on 23 August 2018).
- Hajo, H.; Sebastian, V. A likelihood ratio test for bimodality in two-component mixtures with application regional income distribution in EU. AStA Adv. Stat. Anal. 2008, 92, 57–69. [Google Scholar]
- Javad, B. On the Modes of a Mixture of Two Normal Distributions. Technometrics 1970, 12, 131–139. [Google Scholar]
- Oh, K.Y.; Kim, J.Y.; Lee, J.K.; Ryu, M.S.; Lee, J.S. An assessment of wind energy potential at the demonstration offshore wind farm in Korea. Energy 2012, 46, 555–563. [Google Scholar] [CrossRef]
- Thirumoorthy, A.D. LVRT Tamilnadu’s Experience. Windpro Portal. Available online: http://www.windpro.org/Presentations-Forecasting-and-99+Grid-Availability/JAN-23-2018/session/A.D.Thirumoorthy—LVRTTaminadu’sExperience.pdf (accessed on 23 January 2018).
- Munshi, A.A.; Yasser, A.R.M. Big data framework for analytics in smart grids. Electr. Power Syst. Res. 2017, 151, 369–380. [Google Scholar] [CrossRef]


| Location | Landmass Meas. Sensor | Latitude and Longitude | Dataset Period | Interval | Recovery Rate |
|---|---|---|---|---|---|
| Kayathar (Tamilnadu) | Onshore (Mast) | 8°56′42.50″ N, 77°43′24.12″ E | 2014, 2015, 2016 (3 years) | 10 min | 100% |
| Gulf of Khambhat (Gujarat) | Offshore (LiDAR) | 20°45′19.10″ N, 71°41′10.93″ E | 12/2018 to 11/2019 (1 year) | 10 min | 75.85% |
| Jafrabad (Gujarat) | Nearshore (Mast) | 20°53′29.81″ N, 71°27′35.68″ E | 12/2018 to 11/2019 (1 year) | 10 min | 99.89% |
| Year | Vmean (m/s) | Vrmc (m/s) | Vstd (m/s) | Vmax (m/s) | Vmin (m/s) | Vskew (m/s) | Vkurt | Vmedian | MTI (m/s) |
|---|---|---|---|---|---|---|---|---|---|
| 2014 | 6.62 | 8.84 | 4.14 | 20.92 | 0.28 | 0.80 | −0.31 | 5.34 | 0.17 |
| 2015 | 5.98 | 7.81 | 3.56 | 19.27 | 0.41 | 0.77 | −0.32 | 4.96 | 0.18 |
| 2016 | 6.38 | 8.16 | 3.65 | 18.84 | 0.19 | 0.55 | −0.70 | 5.51 | 0.17 |
| Season | Vmean (m/s) | Vstd (m/s) | Vmax (m/s) | VSkew | VKurt | MTI (m/s) |
|---|---|---|---|---|---|---|
| Winter | 4.43 | 1.69 | 10.36 | 0.50 | −0.01 | 0.25 |
| Summer | 4.68 | 2.65 | 14.30 | 0.57 | −0.39 | 0.16 |
| SWM | 10.03 | 2.74 | 18.52 | −0.13 | 0.006 | 0.13 |
| NEM | 4.50 | 2.21 | 13.83 | 0.67 | 0.34 | 0.19 |
| Annual | 6.38 | 3.65 | 18.84 | 0.55 | −0.70 | 0.17 |
| January | 4.48 | 1.49 | 9.66 | 0.45 | −0.06 | 0.18 |
| February | 4.38 | 1.88 | 11.07 | 0.56 | 0.03 | 0.33 |
| March | 3.51 | 1.72 | 13.3 | 0.68 | 0.41 | 0.17 |
| April | 3.76 | 2.23 | 11.18 | 0.74 | −0.46 | 0.17 |
| May | 6.78 | 3.99 | 18.44 | 0.27 | −1.12 | 0.14 |
| June | 10.29 | 2.67 | 19.63 | −0.09 | 0.18 | 0.13 |
| July | 9.98 | 3.53 | 19.81 | −0.29 | 0.0004 | 0.14 |
| August | 10.07 | 2.48 | 17.05 | −0.05 | −0.15 | 0.13 |
| September | 9.79 | 2.29 | 17.6 | −0.10 | −0.009 | 0.13 |
| October | 5.62 | 3.01 | 16.54 | 0.60 | −0.37 | 0.18 |
| November | 3.73 | 1.93 | 12.85 | 0.83 | 0.98 | 0.22 |
| December | 4.15 | 1.68 | 12.1 | 0.57 | 0.41 | 0.18 |
| Direction Sector | Direction Name | Mean (m/s) | Max (m/s) | Std. Dev. (m/s) | Wind Occ. (%) |
|---|---|---|---|---|---|
| 348.75°–11.25° | N | 3.14 | 13.46 | 1.25 | 1.73 |
| 11.25°–33.75° | NNE | 4.25 | 15.05 | 1.68 | 6.50 |
| 33.75°–56.25° | NE | 4.76 | 20.63 | 1.82 | 6.51 |
| 56.25°–78.75° | ENE | 4.82 | 14.03 | 2.03 | 4.67 |
| 78.75°–101.25° | E | 4.62 | 13.38 | 2.24 | 2.84 |
| 101.25°–123.75° | ESE | 3.73 | 16.54 | 1.68 | 4.16 |
| 123.75°–146.25° | SE | 4.20 | 11.82 | 1.98 | 3.51 |
| 146.25°–168.75° | SSE | 4.82 | 11.18 | 2.29 | 3.58 |
| 168.75°–191.25° | S | 3.48 | 11.77 | 1.85 | 2.37 |
| 191.25°–213.75° | SSW | 2.75 | 12.12 | 1.39 | 1.60 |
| 213.75°–236.25° | SW | 2.97 | 10.11 | 1.53 | 1.86 |
| 236.25°–258.75° | WSW | 5.44 | 19.87 | 3.50 | 11.27 |
| 258.75°–281.25° | W | 10.26 | 22.86 | 3.30 | 38.66 |
| 281.25°–303.75° | WNW | 6.06 | 18.82 | 3.00 | 7.57 |
| 303.75°–326.25° | NW | 3.11 | 13.48 | 1.35 | 1.88 |
| 326.25°–348.75° | NNW | 3.07 | 11.94 | 1.30 | 1.21 |
| Param | Winter | Summer | SWM | NEM | Annual |
|---|---|---|---|---|---|
| Vmean(m/s) | 7.12 | 7.56 | 9.04 | 5.74 | 7.51 |
| Vstd(m/s) | 3.31 | 3.07 | 3.44 | 3.01 | 3.44 |
| Vmax(m/s) | 15.28 | 16.87 | 20.26 | 17.02 | 20.26 |
| MTI(m/s) | 0.06 | 0.07 | 0.07 | 0.10 | 0.08 |
| VSkew | 0.15 | 0.08 | 0.05 | 0.72 | 0.25 |
| VKurt | −0.83 | −0.70 | −0.52 | 0.22 | 0.57 |
| Month | Vmean (m/s) | Vrmc (m/s) | Vstd (m/s) | Vmax (m/s) | Vmin (m/s) | Vskew | Vkurt |
|---|---|---|---|---|---|---|---|
| January | 7.61 | 9.06 | 3.64 | 15.34 | 0.43 | 0.02 | −1.06 |
| February | 6.52 | 7.64 | 2.91 | 15.89 | 0.3 | 0.11 | −0.65 |
| March | 6.62 | 7.62 | 2.71 | 15.93 | 0.4 | 0.30 | −0.37 |
| April | 7.25 | 8.36 | 3.04 | 16.42 | 0.35 | 0.08 | −0.65 |
| May | 9.01 | 9.97 | 3.18 | 17.27 | 0.49 | −0.40 | −0.43 |
| June | 9.51 | 10.63 | 3.46 | 22.99 | 0.37 | −0.007 | −0.43 |
| July | 10.13 | 11.18 | 3.54 | 18.74 | 0.54 | −0.57 | −0.26 |
| August | 8.86 | 10.07 | 3.38 | 20.39 | 1.1 | 0.50 | −0.04 |
| September | 7.56 | 8.47 | 2.79 | 15.25 | 0.5 | −0.06 | −0.66 |
| October | 5.40 | 6.84 | 2.90 | 17.98 | 0.42 | 1.07 | 1.35 |
| November | 4.81 | 5.97 | 2.51 | 19.39 | 0.43 | 0.60 | 0.70 |
| December | 6.65 | 8.02 | 3.22 | 17.37 | 0.2 | 0.43 | −0.55 |
| Sector | Direction Name | Mean (m/s) | Median (m/s) | Min (m/s) | Max (m/s) | Std. Dev. (m/s) | Wind Occ. (%) |
|---|---|---|---|---|---|---|---|
| 348.75°–11.25° | N | 7.83 | 7.75 | 0.37 | 15.05 | 3.12 | 10.17 |
| 11.25°–33.75° | NNE | 7.09 | 6.73 | 0.4 | 17.98 | 3.13 | 11.07 |
| 33.75°–56.25° | NE | 5.73 | 5.09 | 0.42 | 18.12 | 3.02 | 5.82 |
| 56.25°–78.75° | ENE | 5.47 | 4.53 | 0.47 | 20.21 | 3.43 | 3.72 |
| 78.75°–101.25° | E | 6.48 | 4.79 | 0.41 | 22.99 | 4.51 | 2.92 |
| 101.25°–123.75° | ESE | 6.65 | 5.49 | 0.44 | 20.27 | 3.89 | 2.93 |
| 123.75°–146.25° | SE | 7.27 | 7.3 | 0.41 | 16.95 | 3.42 | 4.07 |
| 146.25°–168.75° | SSE | 6.35 | 5.66 | 0.43 | 15.74 | 3.29 | 3.53 |
| 168.75°–191.25° | S | 6.76 | 6.7 | 0.47 | 14.05 | 2.85 | 4.66 |
| 191.25°–213.75° | SSW | 8.44 | 8.73 | 0.3 | 18.17 | 2.89 | 13.05 |
| 213.75°–236.25° | SW | 9.80 | 10.06 | 0.48 | 20.39 | 3.48 | 15.80 |
| 236.25°–258.75° | WSW | 8.13 | 8.44 | 0.49 | 18.74 | 3.22 | 8.75 |
| 258.75°–281.25° | W | 6.22 | 5.93 | 0.35 | 14.06 | 2.89 | 3.24 |
| 281.25°–303.75° | WNW | 5.69 | 5.55 | 0.68 | 11.82 | 2.56 | 2.86 |
| 303.75°–326.25° | NW | 5.96 | 5.7 | 0.41 | 16.42 | 3.18 | 3.08 |
| 326.25°–348.75° | NNW | 6.50 | 6.63 | 0.61 | 13.84 | 2.90 | 4.25 |
| Wparm | Winter | Summer | SWM | NEM | Annual |
|---|---|---|---|---|---|
| Vmean (m/s) | 6.67 | 7.08 | 8.01 | 5.74 | 6.99 |
| Vstd (m/s) | 2.58 | 2.63 | 2.97 | 2.43 | 2.83 |
| Vmax (m/s) | 13.38 | 14.75 | 17.47 | 13.72 | 17.47 |
| Skew | −0.008 | 0.09 | 0.27 | 0.30 | 0.29 |
| Kurtosis | 0.85 | −0.42 | 0.36 | 0.47 | 0.26 |
| Month | Vmean (m/s) | Vrmc (m/s) | Vstd (m/s) | Vmax (m/s) | Vmin (m/s) | Vskew | Vkurt |
|---|---|---|---|---|---|---|---|
| January | 6.84 | 7.76 | 2.68 | 14.49 | 0.42 | −0.04 | −0.85 |
| February | 6.48 | 7.38 | 2.58 | 13.70 | 0.37 | 0.03 | −0.74 |
| March | 6.49 | 7.24 | 2.31 | 13.13 | 0.52 | 0.10 | −0.47 |
| April | 6.70 | 7.60 | 2.62 | 15.0 | 0.31 | −0.02 | −0.42 |
| May | 8.02 | 8.93 | 2.88 | 15.56 | 0.51 | −0.14 | −0.47 |
| June | 8.92 | 10.11 | 3.41 | 19.09 | 0.36 | 0.28 | −0.62 |
| July | 8.56 | 9.41 | 2.90 | 17.34 | 0.53 | −0.43 | −0.38 |
| August | 8.07 | 8.88 | 2.61 | 17.79 | 1.80 | 0.55 | 0.30 |
| September | 6.45 | 7.37 | 2.54 | 14.05 | 0.47 | 0.46 | −0.14 |
| October | 5.53 | 6.38 | 2.28 | 13.78 | 0.28 | 0.41 | −0.002 |
| November | 5.11 | 6.01 | 2.28 | 19.36 | 0.24 | 0.31 | −0.06 |
| December | 6.57 | 7.50 | 2.63 | 13.17 | 0.54 | 0.07 | −0.87 |
| Annual | 6.99 | 8.02 | 2.83 | 17.47 | 0.54 | 0.29 | −0.26 |
| Sector | Direction Name | Mean (m/s) | Std. Dev. (m/s) | Wind Occ. (%) |
|---|---|---|---|---|
| 348.75°–11.25° | N | 7.40 | 2.36 | 3.19 |
| 11.25°–33.75° | NNE | 7.21 | 2.23 | 9.42 |
| 33.75°–56.25° | NE | 7.35 | 2.41 | 10.15 |
| 56.25°–78.75° | ENE | 6.23 | 2.38 | 6.69 |
| 78.75°–101.25° | E | 5.39 | 2.02 | 5.59 |
| 101.25°–123.75° | ESE | 5.04 | 1.96 | 4.89 |
| 123.75°–146.25° | SE | 4.45 | 1.93 | 2.81 |
| 146.25°–168.75° | SSE | 4.97 | 3.27 | 1.74 |
| 168.75°–191.25° | S | 6.05 | 3.85 | 3.03 |
| 191.25°–213.75° | SSW | 6.71 | 3.96 | 3.47 |
| 213.75°–236.25° | SW | 7.81 | 3.07 | 7.50 |
| 236.25°–258.75° | WSW | 8.61 | 3.12 | 11.63 |
| 258.75°–281.25° | W | 7.99 | 2.57 | 15.04 |
| 281.25°–303.75° | WNW | 6.65 | 2.41 | 8.89 |
| 303.75°–326.25° | NW | 5.45 | 2.26 | 3.11 |
| 326.25°–348.75° | NNW | 5.14 | 1.86 | 2.77 |
| Seasons | Vmean (m/s) | mu1 | mu2 | sigma1 | sigma2 | w1 | w2 | k1bm | c1bm | k2bm | c2bm | bmc1 | bmc2 |
|---|---|---|---|---|---|---|---|---|---|---|---|---|---|
| Annual | 6.38 | 3.36 | 8.96 | 1.27 | 2.98 | 0.45 | 0.54 | 2.87 | 3.76 | 3.29 | 9.99 | 1.43 | 3.05 |
| Winter | 4.43 | 3.51 | 5.06 | 0.84 | 1.68 | 0.40 | 0.59 | 4.69 | 3.84 | 3.29 | 5.64 | 0.64 | −0.15 |
| Summer | 4.69 | 2.74 | 7.28 | 1.05 | 3.08 | 0.57 | 0.42 | 2.82 | 3.08 | 2.54 | 8.21 | 1.25 | 2.43 |
| SWM | 10.03 | 8.54 | 10.4 | 3.27 | 2.32 | 0.22 | 0.77 | 2.82 | 9.59 | 5.13 | 11.39 | 0.35 | −2.70 |
| NEM | 4.51 | 3.45 | 6.71 | 1.29 | 2.51 | 0.67 | 0.32 | 2.89 | 3.87 | 2.90 | 7.52 | 0.90 | 0.66 |
| Dist | Parameter | Annual | Winter | Summer | SWM | NEM |
|---|---|---|---|---|---|---|
| Vmean (m/s) | 6.38 | 4.43 | 4.69 | 10.04 | 4.51 | |
| WB | k—shape | 7.21 | 4.96 | 5.28 | 11.03 | 5.11 |
| c—scale | 1.84 | 2.93 | 1.61 | 4.19 | 2.05 | |
| Mean | 6.41 | 4.42 | 4.73 | 10.02 | 4.53 | |
| Std | 3.61 | 1.63 | 2.99 | 2.70 | 2.32 | |
| RY | —scale | 5.20 | 3.33 | 3.99 | 7.35 | 3.60 |
| Mean | 6.52 | 4.17 | 5.00 | 9.21 | 4.51 | |
| Std | 3.40 | 2.18 | 2.61 | 4.82 | 2.36 | |
| NK | —shape | 0.88 | 2.00 | 0.75 | 3.24 | 1.13 |
| —scale | 54.17 | 22.22 | 31.85 | 108.07 | 25.88 | |
| Mean | 6.43 | 4.43 | 4.82 | 10.00 | 4.57 | |
| Std | 3.57 | 1.60 | 2.92 | 2.83 | 2.24 | |
| IG | —mean | 6.38 | 4.43 | 4.69 | 10.04 | 4.51 |
| —shape | 12.27 | 19.58 | 9.02 | 80.13 | 13.79 | |
| Mean | 6.38 | 4.43 | 4.69 | 10.04 | 4.51 | |
| Std | 4.60 | 2.11 | 3.38 | 3.55 | 2.58 | |
| RI | b—location | 0.68 | 4.06 | 0.23 | 9.63 | 0.27 |
| a—scale | 5.18 | 1.69 | 3.99 | 2.76 | 3.59 | |
| Mean | 6.52 | 4.43 | 5.00 | 10.04 | 4.51 | |
| Std | 3.41 | 1.59 | 2.61 | 2.70 | 2.36 | |
| BS | —scale | 5.16 | 3.99 | 3.81 | 9.46 | 3.91 |
| —shape | 0.68 | 0.46 | 0.68 | 0.35 | 0.55 | |
| Mean | 6.37 | 4.42 | 4.70 | 10.03 | 4.51 | |
| Std | 4.43 | 2.08 | 3.27 | 3.54 | 2.54 | |
| GM | θ—scale | 2.82 | 6.94 | 2.54 | 11.00 | 3.91 |
| k—shape | 2.26 | 0.63 | 1.85 | 0.91 | 1.15 | |
| Mean | 6.38 | 4.43 | 4.70 | 10.04 | 4.51 | |
| Std | 3.80 | 1.68 | 2.95 | 3.03 | 2.28 | |
| GEV | —location | 0.05 | -0.13 | 0.31 | -0.28 | 0.07 |
| —scale | 2.81 | 1.43 | 1.80 | 2.79 | 1.70 | |
| —shape | 4.58 | 3.77 | 3.01 | 9.07 | 3.40 | |
| Mean | 6.38 | 4.43 | 4.84 | 10.06 | 4.51 | |
| Std | 3.92 | 1.59 | 4.59 | 2.78 | 2.42 | |
| LN | µ—mean | 1.66 | 1.41 | 1.34 | 2.26 | 1.37 |
| —scale | 0.64 | 0.41 | 0.65 | 0.33 | 0.53 | |
| Mean | 6.53 | 4.49 | 4.72 | 10.13 | 4.55 | |
| Std | 0.64 | 0.41 | 0.65 | 0.33 | 0.53 |
| Distribution Metrics | ||||||
|---|---|---|---|---|---|---|
| Season | Fitness | Annual | Winter | Summer | SWM | NEM |
| Vmean | 6.39 | 4.43 | 4.70 | 10.04 | 4.51 | |
| BM | RMSE | 0.00 | 0.01 | 0.01 | 0.01 | 0.01 |
| R2 | 0.99 | 0.99 | 0.96 | 0.98 | 0.99 | |
| WB | RMSE | 0.02 | 0.02 | 0.02 | 0.01 | 0.02 |
| R2 | 0.82 | 0.93 | 0.87 | 0.99 | 0.94 | |
| RY | RMSE | 0.02 | 0.05 | 0.03 | 0.04 | 0.02 |
| R2 | 0.76 | 0.76 | 0.73 | 0.46 | 0.94 | |
| NK | RMSE | 0.02 | 0.02 | 0.03 | 0.01 | 0.02 |
| R2 | 0.81 | 0.97 | 0.82 | 0.95 | 0.95 | |
| IG | RMSE | 0.02 | 0.03 | 0.01 | 0.03 | 0.01 |
| R2 | 0.91 | 0.90 | 0.98 | 0.78 | 0.97 | |
| RI | RMSE | 0.02 | 0.03 | 0.03 | 0.01 | 0.02 |
| R2 | 0.76 | 0.92 | 0.73 | 0.99 | 0.94 | |
| BS | RMSE | 0.01 | 0.03 | 0.01 | 0.03 | 0.01 |
| R2 | 0.91 | 0.90 | 0.98 | 0.78 | 0.98 | |
| GM | RMSE | 0.02 | 0.01 | 0.02 | 0.02 | 0.01 |
| R2 | 0.86 | 0.99 | 0.91 | 0.91 | 0.99 | |
| GEV | RMSE | 0.02 | 0.01 | 0.01 | 0.01 | 0.00 |
| R2 | 0.81 | 0.98 | 0.98 | 0.98 | 1.00 | |
| LN | RMSE | 0.02 | 0.02 | 0.01 | 0.02 | 0.01 |
| R2 | 0.90 | 0.97 | 0.98 | 0.83 | 0.99 | |
| Good Fit | RMSE | BM | Gamma | IG | Rician | GEV |
| Good Fit | R2 | BM | Gamma | IG | Rician | GEV |
| Season | mu1 | mu2 | sigma1 | sigma2 | w1 | w2 | k1bm | c1bm | k2bm | c2bm | bmc1 | bmc2 |
|---|---|---|---|---|---|---|---|---|---|---|---|---|
| Ann | 4.18 | 9.01 | 1.66 | 2.95 | 0.31 | 0.69 | 2.72 | 4.70 | 3.36 | 10.04 | 1.09 | 1.51 |
| Win | 3.35 | 8.32 | 1.31 | 2.82 | 0.24 | 0.76 | 2.78 | 3.76 | 3.24 | 9.29 | 1.30 | 2.36 |
| Sum | 4.63 | 9.29 | 1.66 | 2.32 | 0.37 | 0.63 | 3.05 | 5.18 | 4.51 | 10.18 | 1.19 | 1.34 |
| SWM | 5.68 | 10.62 | 2.04 | 2.78 | 0.32 | 0.68 | 3.04 | 6.36 | 4.29 | 11.67 | 1.04 | 0.86 |
| NEM | 3.78 | 7.59 | 1.57 | 2.87 | 0.48 | 0.52 | 2.60 | 4.26 | 2.87 | 8.51 | 0.90 | 0.67 |
| Dist | Param | Annual | Winter | Summer | SWM | NEM |
|---|---|---|---|---|---|---|
| Vmean | 7.51 | 7.13 | 7.56 | 9.05 | 5.75 | |
| WB | k—shape | 8.48 | 8.05 | 8.51 | 10.15 | 6.50 |
| c—scale | 2.33 | 2.30 | 2.68 | 2.87 | 2.02 | |
| Mean | 7.52 | 7.13 | 7.56 | 9.05 | 5.76 | |
| Std | 3.43 | 3.28 | 3.05 | 3.42 | 2.98 | |
| RY | —scale | 5.84 | 5.56 | 5.77 | 6.85 | 4.59 |
| Mean | 7.32 | 6.97 | 7.23 | 8.58 | 5.75 | |
| Std | 3.83 | 3.64 | 3.78 | 4.48 | 3.01 | |
| NK | —shape | 1.24 | 1.20 | 1.53 | 1.72 | 1.05 |
| —scale | 68.31 | 61.77 | 66.64 | 93.71 | 42.10 | |
| Mean | 7.49 | 7.10 | 7.53 | 9.01 | 5.78 | |
| Std | 3.49 | 3.37 | 3.15 | 3.54 | 2.95 | |
| IG | —mean | 7.51 | 7.13 | 7.56 | 9.05 | 5.75 |
| —shape | 20.02 | 17.96 | 26.08 | 35.49 | 13.92 | |
| Mean | 7.51 | 7.13 | 7.56 | 9.05 | 5.75 | |
| Std | 4.60 | 4.49 | 4.07 | 4.57 | 3.69 | |
| RI | b—location | 5.96 | 5.60 | 6.61 | 8.13 | 0.65 |
| a—scale | 4.05 | 3.90 | 3.39 | 3.71 | 4.57 | |
| Mean | 7.51 | 7.13 | 7.56 | 9.04 | 5.75 | |
| Std | 3.45 | 3.31 | 3.09 | 3.45 | 3.01 | |
| BS | —scale | 6.39 | 6.01 | 6.64 | 8.06 | 4.82 |
| —shape | 0.59 | 0.60 | 0.52 | 0.49 | 0.61 | |
| Mean | 7.49 | 7.11 | 7.55 | 9.03 | 5.73 | |
| Std | 4.49 | 4.37 | 4.01 | 4.51 | 3.60 | |
| GM | θ—scale | 3.96 | 3.77 | 4.96 | 5.63 | 3.42 |
| k—shape | 1.90 | 1.89 | 1.52 | 1.61 | 1.68 | |
| Mean | 7.51 | 7.13 | 7.56 | 9.05 | 5.75 | |
| Std | 3.78 | 3.67 | 3.40 | 3.81 | 3.11 | |
| GEV | —location | −0.19 | −0.25 | −0.26 | −0.25 | −0.02 |
| —scale | 3.21 | 3.19 | 3.01 | 3.38 | 2.43 | |
| —shape | 6.15 | 5.91 | 6.44 | 7.77 | 4.37 | |
| Mean | 7.49 | 7.10 | 7.55 | 9.04 | 5.73 | |
| Std | 3.41 | 3.24 | 3.04 | 3.44 | 3.05 | |
| LN | µ—mean | 1.88 | 1.83 | 1.92 | 2.11 | 1.60 |
| —scale | 0.56 | 0.57 | 0.50 | 0.47 | 0.59 | |
| Mean | 7.70 | 7.32 | 7.71 | 9.20 | 5.86 |
| Season | Fitness | Annual | Winter | Summer | SWM | NEM |
|---|---|---|---|---|---|---|
| BM | RMSE | 0.00 | 0.01 | 0.01 | 0.01 | 0.01 |
| R2 | 0.99 | 0.95 | 0.98 | 0.98 | 0.97 | |
| WB | RMSE | 0.01 | 0.01 | 0.01 | 0.01 | 0.01 |
| R2 | 0.97 | 0.93 | 0.95 | 0.96 | 0.99 | |
| RY | RMSE | 0.01 | 0.01 | 0.02 | 0.02 | 0.01 |
| R2 | 0.96 | 0.91 | 0.84 | 0.79 | 0.99 | |
| NK | RMSE | 0.01 | 0.01 | 0.01 | 0.01 | 0.01 |
| R2 | 0.97 | 0.92 | 0.93 | 0.94 | 0.98 | |
| IG | RMSE | 0.02 | 0.03 | 0.02 | 0.02 | 0.02 |
| R2 | 0.78 | 0.68 | 0.73 | 0.73 | 0.90 | |
| RI | RMSE | 0.01 | 0.01 | 0.01 | 0.01 | 0.01 |
| R2 | 0.98 | 0.94 | 0.94 | 0.96 | 0.99 | |
| BS | RMSE | 0.02 | 0.03 | 0.02 | 0.02 | 0.02 |
| R2 | 0.79 | 0.70 | 0.75 | 0.74 | 0.91 | |
| Gamma | RMSE | 0.01 | 0.02 | 0.02 | 0.01 | 0.01 |
| R2 | 0.92 | 0.85 | 0.87 | 0.89 | 0.99 | |
| GEV | RMSE | 0.01 | 0.01 | 0.01 | 0.01 | 0.01 |
| R2 | 0.96 | 0.90 | 0.94 | 0.96 | 0.97 | |
| LN | RMSE | 0.02 | 0.02 | 0.02 | 0.02 | 0.01 |
| R2 | 0.83 | 0.74 | 0.78 | 0.79 | 0.93 | |
| Good Fit | RMSE | BM | WB | BM | BM | Rayleigh |
| R2 | BM | BM | BM | BM | Rayleigh |
| Season | mu1 | mu2 | sigma1 | sigma2 | w1 | w2 | k1bm | c1bm | k2bm | c2bm | bmc1 | bmc2 |
|---|---|---|---|---|---|---|---|---|---|---|---|---|
| Annual | 4.47 | 7.96 | 1.58 | 2.61 | 0.28 | 0.72 | 3.10 | 5.01 | 3.36 | 8.88 | 0.86 | 0.33 |
| Winter | 4.68 | 8.81 | 1.61 | 1.52 | 0.51 | 0.48 | 3.20 | 5.23 | 6.75 | 9.44 | 1.32 | 1.09 |
| Summer | 3.71 | 7.57 | 1.24 | 2.42 | 0.12 | 0.87 | 3.30 | 4.15 | 3.46 | 8.43 | 1.12 | 1.38 |
| SWM | 5.77 | 9.58 | 1.83 | 2.60 | 0.41 | 0.58 | 3.50 | 6.42 | 4.12 | 10.55 | 0.87 | 0.16 |
| NEM | 3.85 | 7.10 | 1.40 | 2.09 | 0.41 | 0.58 | 3.01 | 4.32 | 3.78 | 7.87 | 0.95 | 0.45 |
| Dist. | Param | Annual | Winter | Summer | SW-Mon | NE-Mon |
|---|---|---|---|---|---|---|
| Vmean | 6.99 | 6.67 | 7.08 | 8.02 | 5.75 | |
| WB | k—shape | 7.87 | 7.50 | 7.94 | 8.99 | 6.48 |
| c—scale | 2.66 | 2.84 | 2.94 | 2.93 | 2.54 | |
| Mean | 6.99 | 6.68 | 7.08 | 8.02 | 5.76 | |
| Std | 2.83 | 2.55 | 2.62 | 2.98 | 2.42 | |
| RY | —scale | 5.34 | 5.06 | 5.34 | 6.05 | 4.42 |
| Mean | 6.69 | 6.34 | 6.70 | 7.58 | 5.53 | |
| Std | 3.50 | 3.32 | 3.50 | 3.96 | 2.89 | |
| NK | —shape | 1.58 | 1.67 | 1.82 | 1.89 | 1.47 |
| —scale | 56.93 | 51.21 | 57.13 | 73.11 | 38.98 | |
| Mean | 6.98 | 6.65 | 7.06 | 8.01 | 5.74 | |
| Std | 2.87 | 2.65 | 2.70 | 3.00 | 2.45 | |
| IG | —mean | 6.99 | 6.67 | 7.08 | 8.02 | 5.75 |
| —shape | 26.86 | 25.99 | 31.60 | 40.51 | 20.27 | |
| Mean | 6.99 | 6.67 | 7.08 | 8.02 | 5.75 | |
| Std | 3.57 | 3.38 | 3.35 | 3.57 | 3.06 | |
| RI | b—location | 6.11 | 5.96 | 6.42 | 7.27 | 4.90 |
| a—scale | 3.13 | 2.81 | 2.83 | 3.18 | 2.74 | |
| Mean | 6.99 | 6.67 | 7.08 | 8.01 | 5.74 | |
| Std | 2.85 | 2.59 | 2.64 | 2.98 | 2.45 | |
| BS | —scale | 6.22 | 5.94 | 6.39 | 7.32 | 5.07 |
| —shape | 0.50 | 0.49 | 0.46 | 0.43 | 0.52 | |
| Mean | 6.98 | 6.66 | 7.07 | 8.01 | 5.74 | |
| Std | 3.52 | 3.34 | 3.32 | 3.54 | 3.02 | |
| GM | θ—scale | 5.26 | 5.45 | 6.05 | 6.47 | 4.85 |
| k—shape | 1.33 | 1.22 | 1.17 | 1.24 | 1.19 | |
| Mean | 6.99 | 6.67 | 7.08 | 8.02 | 5.75 | |
| Std | 3.05 | 2.86 | 2.88 | 3.15 | 2.61 | |
| GEV | —location | −0.18 | −0.31 | −0.25 | −0.19 | −0.18 |
| —scale | 2.65 | 2.59 | 2.58 | 2.79 | 2.25 | |
| —shape | 5.86 | 5.79 | 6.11 | 6.85 | 4.78 | |
| Mean | 6.98 | 6.66 | 7.08 | 8.00 | 5.74 | |
| Std | 2.82 | 2.55 | 2.62 | 2.95 | 2.40 | |
| LN | µ—mean | 1.85 | 1.80 | 1.87 | 2.00 | 1.64 |
| —scale | 0.48 | 0.47 | 0.44 | 0.42 | 0.50 | |
| Mean | 7.10 | 6.78 | 7.18 | 8.09 | 5.84 |
| Season | Fitness | Annual | Winter | Summer | SWM | NEM |
|---|---|---|---|---|---|---|
| 6.99 | 6.67 | 7.08 | 8.02 | 5.75 | ||
| BM | RMSE | 0.01 | 0.01 | 0.01 | 0.01 | 0.01 |
| R2 | 0.99 | 0.98 | 0.98 | 0.99 | 0.98 | |
| WB | RMSE | 0.00 | 0.02 | 0.01 | 0.01 | 0.01 |
| R2 | 1.00 | 0.89 | 0.99 | 0.98 | 0.97 | |
| RY | RMSE | 0.02 | 0.03 | 0.03 | 0.02 | 0.02 |
| R2 | 0.89 | 0.75 | 0.77 | 0.80 | 0.91 | |
| NK | RMSE | 0.01 | 0.02 | 0.01 | 0.01 | 0.01 |
| R2 | 0.99 | 0.87 | 0.97 | 0.99 | 0.98 | |
| IG | RMSE | 0.02 | 0.03 | 0.03 | 0.02 | 0.02 |
| R2 | 0.84 | 0.71 | 0.76 | 0.90 | 0.85 | |
| RI | RMSE | 0.01 | 0.02 | 0.01 | 0.01 | 0.01 |
| R2 | 0.99 | 0.88 | 0.99 | 0.97 | 0.96 | |
| BS | RMSE | 0.02 | 0.03 | 0.03 | 0.02 | 0.02 |
| R2 | 0.85 | 0.72 | 0.77 | 0.90 | 0.86 | |
| GM | RMSE | 0.01 | 0.02 | 0.02 | 0.01 | 0.01 |
| R2 | 0.96 | 0.83 | 0.91 | 0.97 | 0.96 | |
| GEV | RMSE | 0.01 | 0.02 | 0.01 | 0.01 | 0.01 |
| R2 | 0.99 | 0.89 | 0.99 | 0.98 | 0.97 | |
| LN | RMSE | 0.02 | 0.03 | 0.02 | 0.01 | 0.02 |
| R2 | 0.88 | 0.75 | 0.81 | 0.92 | 0.89 | |
| Good Fit | RMSE | Weibull | BM | Weibull | BM | BM |
| R2 | Weibull | BM | Rician | BM | BM |
| Method | Station | Mean | k1 | c1 | k2 | c2 | w1 | w2 |
|---|---|---|---|---|---|---|---|---|
| BM-EM | Kayathar | 6.39 | 2.87 | 3.77 | 3.29 | 9.99 | 0.46 | 0.54 |
| BM-MFO | Kayathar | 2.63 | 3.82 | 3.01 | 9.89 | 0.46 | 0.54 | |
| BM-EM | GoK | 7.51 | 2.72 | 4.70 | 3.36 | 10.04 | 0.31 | 0.69 |
| BM-MFO | GoK | 2.44 | 5.04 | 3.37 | 9.96 | 0.30 | 0.70 | |
| BM-EM | Jafrabad | 6.99 | 3.10 | 5.01 | 3.36 | 8.88 | 0.28 | 0.72 |
| BM-MFO | Jafrabad | 2.95 | 5.08 | 2.99 | 8.41 | 0.16 | 0.84 |
| Method | Station | RMSE | R2 | eWPD% | WPD |
|---|---|---|---|---|---|
| Pactual | Kayathar | 334.17 | |||
| BM-EM | Kayathar | 0.005 | 0.99 | 0.08 | 333.89 |
| BM-MFO | Kayathar | 0.004 | 0.99 | 0.00 | 334.17 |
| Pactual | GoK | 431.53 | |||
| BM-EM | GoK | 0.005 | 0.99 | 0.22 | 430.56 |
| BM-MFO | GoK | 0.004 | 0.99 | 0.00 | 431.53 |
| Pactual | Jafrabad | 318.18 | |||
| BM-EM | Jafrabad | 0.005 | 0.99 | 0.45 | 316.76 |
| BM-MFO | Jafrabad | 0.003 | 1.00 | 0.68 | 318.18 |
| WB-Unimodal | Jafrabad | 0.003 | 1.00 | 0.68 | 316.03 |
| WPD Annual Comparison | GoK Annual | Jafrabad Annual | WPD Annual Fitness Comparison | ||||
|---|---|---|---|---|---|---|---|
| Dist. | Kayathar Annual | Distribution | Kayathar Annual | GoK Annual | Jafrabad Annual | ||
| Actual | 334.17 | 431.53 | 318.18 | ||||
| BM-MFO | 334.17 | 431.53 | 318.185 | BM-MFO | 5.42 × 10⁻⁸ | 5.81 × 10⁻¹⁰ | −1.409 × 10⁻⁵ |
| BM-EM | 333.89 | 430.54 | 316.76 | BM-EM | 0.08 | 0.23 | 0.45 |
| WB | 325.23 | 430.55 | 316.03 | WB | 2.68 | 0.23 | 0.68 |
| RY | 319.76 | 445.6 | 330.17 | RY | 4.31 | −3.26 | −3.77 |
| BS | 319.05 | 447.39 | 324.34 | BS | 4.53 | −3.67 | −1.93 |
| GM | 323.06 | 448.22 | 323.65 | GM | 3.32 | −3.87 | −1.72 |
| IG | 312.96 | 443.16 | 322.83 | IG | 6.35 | −2.69 | −1.46 |
| RI | 320 | 431.11 | 315.26 | RI | 4.24 | 0.1 | 0.92 |
| NK | 325.25 | 434.01 | 317.14 | NK | 2.67 | −0.58 | 0.33 |
| GEV | 310.55 | 423.73 | 314.85 | GEV | 7.07 | 1.81 | 1.05 |
| LN | 317.4 | 455.52 | 328.18 | LN | 5.02 | −5.56 | −3.14 |
| Dist. | Kayathar Winter | Summer | SWM | NEM | GoK Winter | Summer | SWM | NEM | Jafrabad Winter | Summer | SWM | NEM |
|---|---|---|---|---|---|---|---|---|---|---|---|---|
| Actual | 76.45 | 170.80 | 751.97 | 111.58 | 370.79 | 399.83 | 653.26 | 225.29 | 266.13 | 310.66 | 450.83 | 183.59 |
| Bimodal EM(WW) | 75.67 | 168.67 | 750.22 | 110.19 | 359.69 | 398.02 | 652.35 | 222.89 | 263.94 | 308.88 | 449.94 | 181.97 |
| WB | 75.54 | 156.24 | 748.65 | 106.16 | 341.26 | 395.26 | 649.57 | 219.07 | 255.79 | 307.45 | 447.10 | 180.98 |
| RY | 78.83 | 146.27 | 715.72 | 106.94 | 328.76 | 398.12 | 657.39 | 219.67 | 235.35 | 304.32 | 439.72 | 187.25 |
| BS | 78.20 | 161.23 | 762.86 | 112.67 | 283.22 | 379.98 | 637.78 | 225.76 | 222.95 | 296.18 | 428.90 | 182.70 |
| GM | 76.15 | 150.80 | 769.73 | 104.86 | 317.66 | 396.48 | 658.32 | 221.09 | 242.02 | 306.61 | 440.03 | 184.01 |
| IG | 78.00 | 161.12 | 761.83 | 113.11 | 278.06 | 376.72 | 633.71 | 223.84 | 221.01 | 294.55 | 427.05 | 181.56 |
| RI | 74.49 | 146.33 | 753.27 | 106.99 | 344.94 | 396.46 | 651.02 | 219.82 | 256.04 | 307.38 | 444.62 | 180.83 |
| NK | 75.00 | 155.61 | 757.78 | 104.41 | 335.75 | 395.91 | 652.69 | 218.08 | 250.37 | 306.87 | 443.05 | 181.33 |
| GEV | 74.77 | 153.03 | 766.27 | 106.14 | 349.27 | 392.36 | 650.64 | 214.73 | 259.20 | 307.47 | 443.06 | 178.76 |
| LN | 78.76 | 156.70 | 774.63 | 112.23 | 289.81 | 387.29 | 650.40 | 226.53 | 227.56 | 300.51 | 432.14 | 184.80 |
| Kayathar | Gulf of Khambhat | Jafrabad | ||||||||||
|---|---|---|---|---|---|---|---|---|---|---|---|---|
| Season | Win | Sum | SWM | NEM | Win | Sum | SWM | NEM | Win | Sum | SWM | NEM |
| BM-EM | 1.02 | 1.25 | 0.23 | 1.25 | 0.30 | 0.04 | 0.04 | −0.29 | 0.82 | 0.57 | 0.20 | 0.89 |
| WB | 1.19 | 8.53 | 0.44 | 4.86 | 7.96 | 0.56 | 0.56 | 2.76 | 3.88 | 1.03 | 0.83 | 1.43 |
| RY | −3.10 | 14.36 | 4.82 | 4.16 | 11.34 | −0.63 | −0.63 | 2.49 | 11.57 | 2.04 | 2.46 | −1.99 |
| BS | −2.30 | 5.60 | −1.45 | −0.97 | 23.62 | 2.37 | 2.37 | −0.21 | 16.22 | 4.66 | 4.87 | 0.49 |
| GM | 0.39 | 11.71 | −2.36 | 6.03 | 14.33 | −0.77 | −0.77 | 1.87 | 9.06 | 1.30 | 2.40 | −0.23 |
| IG | −2.00 | 5.67 | −1.31 | −1.37 | 25.01 | 2.99 | 2.99 | 0.64 | 16.95 | 5.18 | 5.27 | 1.10 |
| RI | 2.56 | 14.33 | −0.17 | 4.12 | 6.97 | 0.34 | 0.34 | 2.43 | 3.79 | 1.05 | 1.38 | 1.50 |
| NK | 1.90 | 8.89 | −0.77 | 6.43 | 9.45 | 0.09 | 0.09 | 3.20 | 5.92 | 1.22 | 1.73 | 1.23 |
| GEV | 2.20 | 10.40 | −1.90 | 4.87 | 5.80 | 0.40 | 0.40 | 4.69 | 2.60 | 1.03 | 1.72 | 2.63 |
| LN | −3.00 | 8.25 | −3.01 | −0.58 | 21.84 | 0.44 | 0.44 | −0.55 | 14.49 | 3.27 | 4.15 | −0.66 |
| GF | BM | BM | BM | BM | BM | BM | BM | IG | BM | BM | BM | BS |
| S. No | Annual Parameter (@ 100 m) | Kayathar (Onshore) | Gulf of Khambhat (Offshore) | Jafrabad (Nearshore) |
|---|---|---|---|---|
| 1 | Mean wind speed (m/s) | 6.38 | 7.51 | 6.99 |
| 2 | Standard deviation (m/s) | 3.65 | 3.44 | 2.83 |
| 3 | Max. wind speed (m/s) | 18.8 | 20.26 | 17.4 |
| 4 | Skew | 0.55 | 0.25 | 0.29 |
| 5 | Kurt | −0.70 | 0.57 | 0.26 |
| 6 | MTI at 15 (m/s) | 13.2% | 5.9% | 6.4% |
| 7 | Shear power law index | 0.17 | 0.07 | 0.02 |
| 8 | Mean cubic wind speed | 8.16 | 8.88 | 8.02 |
| 9 | WPD (observed) W/m2 | 334.17 | 431.53 | 318.18 |
| 10 | Turbulence category | B | C | C |
| Wind power class | 2 | 3 | 2 | |
| 11 | Wind distribution fit (Rank) |
|
|
|
| 12 | WPD (Estimated) | 333.89 | 431.11 | 317.14 |
| 13 | Best wind direction | W—38% WSW—11% WNW—7.57% NE—6.51% NNE—6.50% | SW—15.8% SSW—13.05% NNE—11.07% N–10.17% WSW—8.75% | W—15.04% WSW—11.63% NE—10.158% NNE—9.421% WNW-8.891% |
| 14 | Wind power density share | Winter—7% Summer—15% SWM—68% NEM—10% | Winter—22% Summer—24% SWM—40% NEM—14% | Winter—22% Summer—26% SWM—36% NEM—15% |
© 2020 by the authors. Licensee MDPI, Basel, Switzerland. This article is an open access article distributed under the terms and conditions of the Creative Commons Attribution (CC BY) license (http://creativecommons.org/licenses/by/4.0/).
Share and Cite
R, K.; K, U.; Raju, K.; Madurai Elavarasan, R.; Mihet-Popa, L. An Assessment of Onshore and Offshore Wind Energy Potential in India Using Moth Flame Optimization. Energies 2020, 13, 3063. https://doi.org/10.3390/en13123063
R K, K U, Raju K, Madurai Elavarasan R, Mihet-Popa L. An Assessment of Onshore and Offshore Wind Energy Potential in India Using Moth Flame Optimization. Energies. 2020; 13(12):3063. https://doi.org/10.3390/en13123063
Chicago/Turabian StyleR, Krishnamoorthy, Udhayakumar K, Kannadasan Raju, Rajvikram Madurai Elavarasan, and Lucian Mihet-Popa. 2020. "An Assessment of Onshore and Offshore Wind Energy Potential in India Using Moth Flame Optimization" Energies 13, no. 12: 3063. https://doi.org/10.3390/en13123063
APA StyleR, K., K, U., Raju, K., Madurai Elavarasan, R., & Mihet-Popa, L. (2020). An Assessment of Onshore and Offshore Wind Energy Potential in India Using Moth Flame Optimization. Energies, 13(12), 3063. https://doi.org/10.3390/en13123063