Abstract
The diffusion of distributed energy resources in distribution networks requires new approaches to exploit the users’ capabilities of providing ancillary services. Of particular interest will be the coordination of microgrids operating as an aggregate of demand and supply units. This work reports a model predictive control (MPC) application in microgrids for the efficient energy management of energy storage systems and photovoltaic units. The MPC minimizes the economic cost of aggregate prosumers into a prediction horizon by forecasting generation and absorption profiles. The MPC is compared in realistic conditions with a heuristic strategy that acts in a instant manner, without taking into account signals prediction. The work aims at investigating the effect that different types of energy tariffs have in enhancing the end-users’ flexibility, based on three examples of currently applied tariffs, comparing the two storage control modes. The MPC always achieves a better solution than the heuristic approach in all considered scenarios from the cost minimization point of view, with an improvement that is amplified by increasing the energy price variations between peak and off-peak periods. Furthermore, the MPC approach provides a cost saving when compared to the case considering a microgrid endowed with only photovoltaic units, in which no storage is installed. Findings in this work confirm that storage units better perform when some knowledge of future demand and supply trends is provided, ensuring an economic cost saving and an important service for the overall community.
1. Introduction
The climate action policies undertaken worldwide for decarbonisation in the energy sector are resulting in a continuous growth of renewable energy sources (RES) diffusion. In Europe, the “Clean Energy for All Europeans” package released in 2016 has set, among others, the objective of increasing to 32% the share of energy consumption fed by renewables [1]. In Italy, for example, this objective translates, in the electricity sector, into a target of about 55% of consumption coverage by RES (20% more compared to the present share), with an expected increase of about 2.5 times of photovoltaic (PV) annual production [2].
Such an increase, however, brings some challenges from both the technical and economic standpoints. At the European level, standard bodies are constantly tackling the challenge of improving the grid support actions required to RES connected to the grid, especially concerning the connection of medium and small scale distributed generators and storage units [3,4]. From an economic standpoint, considering the very low marginal cost of RES, along with the RES support policy, fossil-fuelled thermal power plants owners are facing financial issues due to the largely reduced operation time during the year [5]. Nonetheless, the increased uncertainty in power generation has to be faced by keeping in operation some of the thermal plants that would be phasing out otherwise, with a resulting increase of costs for ancillary services provision and capacity remuneration mechanisms [6]. A study on GB’s generation mix shows the impact of renewables on the usage of thermal power plants, with significant increase of start-up and ramping events in the projections to 2030 scenarios [7].
In order to overcome such issues while improving the efficiency of both market operation and power system regulation, Demand Response (DR) will play a fundamental role [8]. In this field, building’s consumption management is recognized as one of the most promising paths towards implementation of DR. Control of residential and commercial buildings for the provision of ancillary services can be obtained by managing the thermostatically controlled loads such as HVAC (Heating, Ventilating and Air Conditioning) systems [9,10] and by controlling the electric vehicles chargers and storage units, including sharing of storage units among customers [11,12].
With the deployment of smart metering in many countries, demand-side management has become a business opportunity [13,14]. DR programmes can be divided in (i) incentive-based and (ii) price-based [15]. In the former group, DR is obtained through special tariffs (incentives) for the direct control of load shares by the system operator. The latter set of DR measures relies on the retail price variations leading the load change. Under this approach, two main approaches are commonly adopted for retail pricing: Time-Of-Use (TOU) and Real-Time-Pricing (RTP) [16]. TOU tariffs introduce a variation in retail price shaped in accordance with the typical demand shape (higher price in the peak-load period and lower in others), with the possibility to integrate “critical-peak pricing” rates, which consist of price increases at pre-determined times. RTP tariffs, instead, foresee a retail price varying in each time interval (e.g., every hour), following the electricity market price trends. As one of the goals at European level for the next future is to entitle all users to enter dynamic pricing contracts with their suppliers, the application of retail rates reflecting the wholesale price of electricity will be fundamental [17].
The control of RES and, in particular, of Energy Storage Systems (ESSs), is fundamental for the increase of flexibility provision [18,19,20] and the optimal management of consumers’ expenditure [21]. Distributed ESSs are important for peak management, consisting in stocking energy when energy is cheaper for subsequent use during peak periods when energy is more expensive. Furthermore, batteries are used to compensate the differences between power production and demand, storing energy when solar power is higher than load and realising it in case of need.
This work exploits an advanced control method called Model Predictive Control (MPC) [22,23] with the aim of an efficient management of energy storage systems coupled with PV units. MPC is a method of process control that minimizes a cost function into a prediction horizon by predicting future system evolution, while satisfying system constraints. Nowadays model predictive control is largely adopted in power systems applications [24,25,26,27]. For example, in [28] the authors design an advanced control system using MPC for the efficient management of a system provided with wind-solar energy production, connection to the grid, ESS, and reverse-osmosis water desalination sub-system. Model predictive control manages the resources in order to guarantee sufficient energy to the reverse-osmosis subsystem in order to meet the requested water demand. In [27], Parisio et al. apply model predictive control in order to efficiently optimize a microgrid provided with RESs, storage, electric generation and connection to the grid. The authors show the improvements of the predictive solution, in terms of economic cost minimization, with respect to the case in which the battery is not installed, also taking into considerations prediction errors of production and load. In [21], the authors propose a two-layer structure for the control of a microgrid including a battery, a microturbine, PV units, and connection with the grid. At a higher layer, a deterministic MPC is used to schedule the use of the resources with a prediction horizon of 24 h using a sampling rate of 15 min. At the lower layer, a stochastic MPC regulator runs at higher frequency in order to compensate uncertainties of production and absorption.
The aim of this work is to investigate the performance of different storage control techniques in relation to different retail tariff structures. Considering an aggregate of end-users, the goal is to demonstrate the increasing demand flexibility obtainable by adopting variable retail prices and smarter storage control techniques. In particular, with the knowledge of future generation and demand profiles, the predictive control manages the energy resources in order to, on the one hand, satisfy power balance equation and, on the other hand, minimize the overall economic cost. The predictive solution is compared to a simple method called heuristic approach, which manages the ESS without exploiting future signals prediction. Despite there are papers that compare the performance of the predictive approach with the heuristic method, in terms of energy cost minimization [29], an important observation is not sufficiently highlighted: the time-variability of energy prices influences the performances of the MPC when compared to the heuristic approach and the advantages of the predictive solution increase with the rise of the daily price variation. In detail, the previous observation will be verified by comparing the two control techniques in three different scenarios, based on current retail tariffs in Italy, Australia and Great Britain, where the resources are in a cluster of low-voltage prosumers coordinated through the mentioned controlling techniques. Moreover the MPC is proved to be a smart control solution in the decision of the charging time of the storage, fully or partially, shifting power demand during night, when the price is low. Economic cost saving is also obtained by comparing the predictive control with the case in which batteries are not installed in the microgrid, confirming predictive solutions as desirable control approaches in the future.
The paper structure is as follows. Section 2 describes the aggregate system model. The heuristic approach and the predictive solution control implementation is explained in Section 3. In Section 4 simple examples are analyzed to compare the heuristic strategy and the MPC. Simulations are given in Section 5. Numeral results are provided in Section 6. Section 7 reports the conclusions.
2. Aggregate System Model
This work focuses on the provision of ancillary services by low-voltage end-users. In this context, in order to promote the application of DR programmes, energy communities are created by the aggregation of a number of users in the same area, allowing to better exploit the flexibility services provided by the distributed resources.
An aggregate system by the type in Figure 1 is considered, consisting of a microgrid that in this work has been assumed having the size of an entire LV (Low Voltage) network (i.e., all the users connected downstream the same secondary substation). The system comprises:
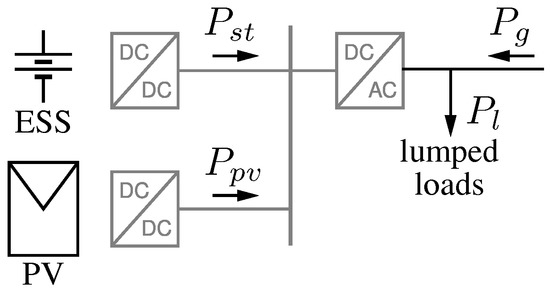
Figure 1.
Schematic representation of the considered powers.
- Connection with the upstream grid, the end-users aggregate in the microgrid exchange with the upstream grid the power ;
- Photovoltaic (PV) sources, generating the maximum aggregate output power , given by the sum of local generation units powers;
- Loads, consisting of the aggregate of distributed loads in the microgrid, resulting in an overall power absorption ;
- Energy storage system (ESS), consisting of the aggregate capacity of smaller distributed storage units summing up to , exchanging the total power . Maximum discharging power , and maximum charging power are considered as upper and lower bounds. The ESS can be used in the capacity range in order to guarantee practical needs [30].
A dynamic discrete-time model for the aggregate ESS is set with as sampling interval:
where is the stored energy, with superscript indicating to the variable value at the following time, and c accounts for the distributed ESS converters losses. According to Figure 1, the power balance equation of the aggregate system model is:
3. Control Formulation
In this section, a simple control technique called heuristic approach is presented at first. Then the model predictive control implementation is described.
3.1. Heuristic Approach
The heuristic approach considered herein is a basic control mode in which the control signal is computed in an instant manner, without taking into account any predictions about prices and signals. By this approach, which is comparable to those used, for example, in [25,31], no available information on the controlled system is exploited and the battery is driven to immediately achieve , if it is possible.
For this purpose, if PV production is greater than load, i.e., , the excess power is driven to the battery; in case the storage has not sufficient capacity or it is full the unused power is realised to the grid. If , the heuristic approach discharges the battery, while absorbs the required power from the grid when the storage has not enough capacity or it is empty.
Figure 2 provides a flow-chart related to the implemented heuristic strategy.
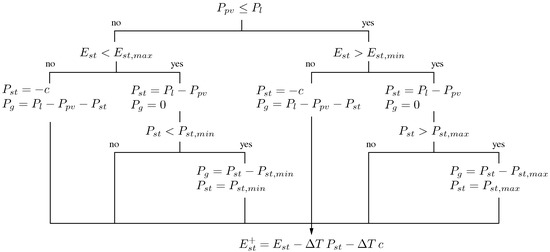
Figure 2.
Flow-chart of the heuristic approach.
3.2. Model Predictive Control
Model predictive control is an advanced control methodology that optimises the future evolution of a controlled process by computing a optimal sequence of inputs.
It is a model-based optimal control mode that, at each sampling instant, calculates the control signal of a plant minimizing a cost function over a prediction horizon, always satisfying system constraints. The first input of the computed sequence is then applied, the system state is updated and the optimization procedure rerun, beginning from the updated state, with a receding horizon strategy.
In this work, the MPC approach computes the optimal control inputs that minimize the economic cost over a prediction horizon :
where:
- The first term takes into account the cost of purchasing energy, is the cost coefficient, measured in €/kWh;
- The second term takes into account the revenue of selling energy, is the revenue coefficient, measured in €/kWh. This term is a negative cost, representing the revenue for the user when is negative (energy is sold to the upstream grid);
- The third term weights the degradation of the battery with the coefficient , measured in €/kWh, that will be defined later. This term considers the economic cost given by the wearing of the storage.
3.2.1. Absorption and Generation Profiles Forecasting
Different prediction techniques, which mainly include Multiple Autoregressive Integrated Moving Average (ARIMA), Linear Regression (LR), grey-box and black-box identification, data mining approaches like Artificial Neural Network (ANN), have been largely applied for load and generation profiles forecasting. While photovoltaic production can be well forecasted, for example, with weather predictions, load prediction for single users is a non-trivial task, due to the random use of energy by the end-users, making the profile hardly predictable. It should be noted that the actual power profile consumption not only depends on the users’ habits, but also on the characteristics of the installed appliances. However, aggregate loads can be easily predicted if compared to those of single users, since they present a more regular behaviour, as depicted in Figure 3.
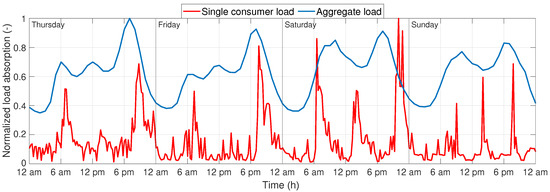
Figure 3.
Examples of load profiles: single consumer load and aggregate absorption of about 100 users.
The work focuses on the application of the predictive control in the context of aggregate users, working with easily predictable profiles of both production and absorption. Within the research in this work, this paper considers a particular case, where future generation and load are perfectly known, with the aim of emphasizing the differences between the predictive solution and the heuristic one in the control of ESSs. Future work will be dedicated in the research of how prediction errors affect the optimization procedure in MPC approach.
3.2.2. Estimating the Economic Cost of ESS Wearing
A battery ESS is considered herein. Providing an estimate of storage lifetime is a difficult task for ESS realization due to the lack of measured data. For example in [30] the authors present a battery lifetime estimation methodology, developing a dynamic capacity fading model estimating the wearing of the storage with its usage, and verify the validity of the approach with an empirical method.
In economic optimization tasks the problem of finite lifetime of the battery is usually tackled by introducing an additional term in the cost function in order to preserve the life expectancy of the device. For example in [21] this term weighs the absolute value of the storage power variation. In [27], the authors add a term in the cost function proportional to the absolute value of the exchanged power with the storage.
In this paper, the same approach of [27] is adopted: the third term in (3) weighs the absolute battery power, through the coefficient , that is function of the storage price , the expected cycle lifetime , and the capacity . Taking into account the overall energy throughput tolerable by the storage in its entire lifetime (i.e., ), the coefficient is estimated equal to and is measured in €/kWh [32].
4. Model Predictive Control and Heuristic Approach: Application Example
In order to show the advantages of MPC methodology, in this section the predictive controller and the heuristic procedure are compared considering scenarios with simple generation and load profiles.
The cost function specified in (3) is now analyzed considering a simulation period lasting one day with the following hypothesis:
- The state of charge of the storage at the beginning and at the end of the day is equal to the lower bound constraint;
- Storage converters are ideal ( W);
- The day is divided in two different periods:
- -
- Nighttime, lasting 12 h, with constant cost of energy , with no generation and absorption signals;
- -
- Daytime, lasting 12 h, with constant cost of energy , constant load and constant production , with .
In Figure 4, examples of consumption and generation signals are shown for the considered simplified scenario.
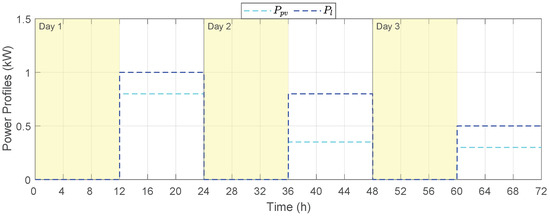
Figure 4.
Examples of constant load and photovoltaic power profiles lasting 12 h during daytime; the nighttime period is characterized by a yellow background.
Since the demand and the PV power are constant signals lasting 12 h, a control procedure with a sample time of 12 h can be applied. The nighttime and daytime storage powers are denoted as and , respectively. Since ESS is empty and , the cost function analysis is limited to the case in which energy is never sold to the grid (considering actual market prices, the eventuality in which it is convenient to buy energy during nighttime and sell it during daytime is not taken into account). Denoting as and the nighttime and daytime grid powers, respectively, from Equation (2), it results:
Being the state of charge at the beginning and the end of the day the same, the following Equation holds:
Now, considering the constraints in Equation (4), it is possible to assign a value of to the daytime storage power:
and, consequently,
with the constraint:
The optimization problem in Equation (6) becomes:
J is a line that is function of with slope . Three cases are possible:
- : the value that minimizes the cost function, considering the constraint (10), is , and the minimum of the cost function is ;
- : the value that minimizes the cost function is W and the corresponding value of the cost function is .
- : J is a constant signal with value .
Considering the first case, the optimal solution is charging the storage during nighttime exploiting the grid when the cost of energy is low and discharging the battery during the following daytime to satisfy the demand when the cost of energy is high; in this case the nighttime and daytime grid power values are:
In the second case, the daytime demand is satisfied by the grid and the PV production while the storage is not used. The corresponding nighttime and daytime grid power values are:
In the third case, any value of (satisfying the constraint) can be applied by the controller; from the power balance, the following Equations hold:
The considered simple example shows that the MPC approach with a prediction horizon of one day provides a lower economic cost with respect to the heuristic approach if . Indeed, during periods of low energy prices, the MPC achieves the accumulation of the energy needs that are subsequently required to feed local loads during periods of higher energy prices. Notably, such control actions based on predictions of future price evolution and energy needs are not possible by approaches performing on an instantaneous basis, like the considered heuristic one.
A simple scenario is considered above, in order to show how the predictive approaches like the MPC can provide advantages in scenarios with high energy price variability. Now a more practical example is presented considering a two-day simulation with constant loads and production during daytime and a control sample time of 1 h. A battery with ideal converters implements the ESS, with 13.5-kWh nominal capacity and 4-kW maximum output power, which represents a household-size installation [33]. Real storage data have been used for this study, consisting of an expected cycle life of 5000 cycles and a cost of EUR 7030, which makes c€/kWh. In this example, a constant marginal revenue is assumed, equal to 8 c€/kWh.
In Figure 5, simulation results given by the MPC controller with a prediction horizon of 24 h are reported in case c€/kWh (during night-time, yellow background) and c€/kWh (during daytime, no coloured background). At the beginning of the simulation the state of charge is equal to the lower bound value of 2 kWh. During nighttime the grid is exploited to charge the storage when the cost of energy is low in both the considered days. During daytime there is no exchanged power with the grid, and the demand is satisfied by storage and generation powers.
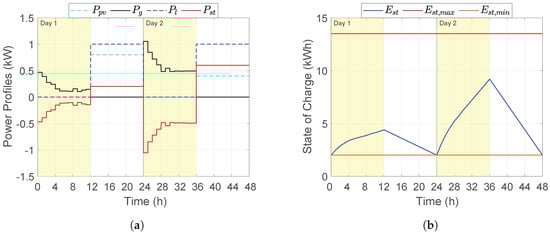
Figure 5.
Simulation results given by the predictive controller considering a simple scenario. On the left power profiles are given, on the right the state of charge is reported: (a) Power Profiles; (b) State of Charge.
In Figure 6, the results by the heuristic approach are shown. Since absorption is greater than production during daytime, the storage remains at the lower bound level: the daytime demand is satisfied by both the grid and generation powers.

Figure 6.
Simulation results given by the heuristic strategy considering a simple scenario. On the left power profiles are given, on the right the state of charge is reported: (a) Power Profiles; (b) State of Charge.
The overall economic costs obtained from the simulations for both the MPC and the heuristic approach (HA) are reported in Table 1, and consist of energy purchase, energy sale and ESS wearing cost (ESS).

Table 1.
Economic costs in a simulation of two days considering a simple scenario.
It is worth to note that MPC provides a lower overall cost than the heuristic strategy since the daily energy cost difference is greater than .
If c€/kWh and the MPC and the heuristic results coincide with a resulting overall economic cost of EUR 2.11.
In this Section, simple examples have been presented with constant production and consumption during daytime, showing how variability of energy cost influences the performance of the predictive solution with respect to heuristic approach. The authors have verified the validity of the key result of the section with dynamical signals; the MPC controller charges the storage with the electrical grid during the low price period in scenarios in which:
- The energy cost difference with the high price time exceeds ;
- A sufficient long prediction horizon is implemented in the MPC settings;
- The PV production together with the power that can be exploited from ESS are not sufficient to satisfy the demand during peak period.
In the next section the MPC and the heuristic approaches are compared considering energy tariffs currently available in representative Countries.
5. Case Study
In order to validate the proposed MPC logic, it has been set up a case study to investigate the comparison of its performance under different end-user tariff schemes. Three different tariffs will be applied in order to examine the benefits deriving from the application of the MPC approach. The first rate is based on the TOU approach but with a low price variation between periods. The second tariff is still a TOU rate but with a bigger difference in prices between periods. The third one, instead, is a dynamic pricing tariff, with a price changing in all time intervals. These tariffs are based on three real retail rates being currently available in Italy, Australia and Great Britain.
The simulations presented below assume an aggregation of 100 users rated 3 kW connected to the microgrid, each equipped with a storage unit with the characteristics introduced in the previous section. Therefore, the aggregate ESS nominal capacity is 1350 kWh, whereas the maximum exchanged power is ±400 kW. The capacity of the storage refers to a typical size for the considered application [33]. Since the aim of this paper is the comparison of MPC and the heuristic approach in the control of ESSs, the size was considered fixed in the two cases. Efficient distributed static converters have been assumed, having constant overall losses equal to W. The estimated cycle life of the storage is 5000 cycles and the aggregate price is EUR 703,000, i.e., c€/kWh. The model sample time is set to 60 s while the control procedure is applied every hour. Lower control sample times can be taken into account, for example, with a higher variability of signals. The prediction horizon is set to 36 h in the MPC procedure. It has been verified that a longer prediction horizon would bring to not significant changes of the results at the cost of a significantly higher computational effort while the overall economic cost rises with shorter prediction horizons. The prediction horizon set to 36 h can be considered a good trade-off between reliable signals prediction and economic cost minimization. For the sake of readability, the reported figures include a time period which lasts five days (three working days and weekend) with measured generation and load data with a mean generated PV energy of about 1018 kWh/day while the mean required energy by the users is about 2015 kWh/day.
Numerical comparison among the simulated scenarios is then made in a further section considering the whole week period.
5.1. Flat Time-of-Use Rate - MPC Simulation
In this scenario, a TOU retail tariff with slightly changing retail price is applied. This price structure is currently applied in the Italian retail market, and it is based on three time intervals: (i) high consumption (midday hours), (ii) low consumption (night hours) and (iii) weekend. In this specific case, as in most of the tariffs offered in Italy, prices in the second and third intervals coincide.
Italy was one of the first European countries to spread on a wide scale TOU tariffs, especially considering that since 2012 this type of tariff is mandatory for all customers that did not choose a supplier in the liberalized market (56% of all low voltage residential customers in 2018 are supplied with these regulated conditions) [34,35,36]. Since this tariff was introduced by the Italian regulator (ARERA), it aims at protecting the small consumers from the wholesale market price oscillations by introducing a narrow price variation between the time intervals (in the range 1–2 c€/kWh).
As far as the supply price is concerned, in Italy is employed a state-run net metering scheme for power injections of small generators. This means that the energy produced by a small PV plant, at first, is sold at market price, then, at the end of the year, there is a settlement in favour of the prosumer based on the injected and absorbed energy [37]. In this work, only the market price has been considered since the heuristic and the MPC approaches do not take into account the whole injection and consumption throughout the year.
In Figure 7, energy prices and the MPC simulation results are reported. The energy purchase price, Figure 7a, is 26.42 c€/kWh from 8 am to 8 pm and 24.24 c€/kWh from 8 pm to 8 am during working days. The revenue of energy varies on a daily basis and is dynamic with a low variation. In the simulations the supply price for the upcoming day is updated everyday at 4 pm. In case there is no information about the future sale price at a certain time in the prediction horizon, a mean value based on the three previous days at the same time is given to the controller.
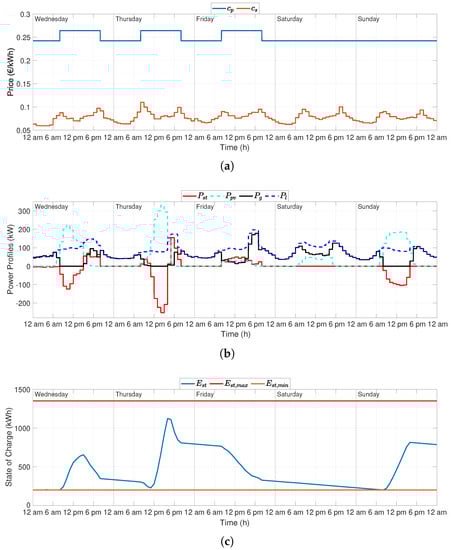
Figure 7.
MPC results with Italian prices in a simulation of five days: (a) Cost and revenue of energy; (b) Power Profiles; (c) State of Charge.
Power profiles and the state of charge are reported in Figure 7b,c, respectively. It is worth to highlight that the storage is charged in case generation exceeds absorption, while during working days the grid is not exploited during nighttime to charge the storage for daytime demand satisfaction due to the small variation of the cost of energy between midday and night hours (the difference does not exceed ). In order to save economic costs, MPC exploits the storage during peak price hours while during low price periods both grid and PV power (if available) are used to satisfy the demand: the MPC smartly exploits the available stored energy discharging the ESS during the midday hours.
5.2. Steep Time-of-Use Rate—MPC Simulation
In this scenario, a TOU tariff with larger variability in price is considered. This rate is currently applied in the Australian electricity market (New South Wales). As in the previous case, three time intervals are considered: (i) peak (midday hours), (ii) shoulders (morning, late evening and weekend) and (iii) off-peak (night hours).
Unlike the previous case, significant differences are found between time intervals (up to 24 c$/kWh, [38]). This is due to the very structure of the Australian market. While in the Italian market the demand at the peak is managed through ancillary services, in the Australian market the spot price is free to vary with very wide margins (from negative prices up to 14,500 $/MWh, more than double respect to the Italian market) [39]. Inevitably this reflects on the retail market, especially on the dynamic tariffs such as the TOU one, since the retailer transfers part of the risk on the customers. Along with this varying energy component price, Australian offers require a daily charge between 90 and 120 c$/day.
As far as the supply price is concerned, Australia adopts a Feed-In-Tariff (FIT) policy, where every retailer must offer a selling price to the prosumer. This price is a flat rate that varies between 9 and 12 c$/kWh. In this scenario, a FIT price equal to 12 c$/kWh and a fixed daily supply charge of 110 c$/day are applied.
In the simulations, an exchange rate of 0.6 €/$ is adopted. Figure 8 shows the simulation results of MPC approach together with the energy prices. The cost of energy, Figure 8a, during working days, has three different values:
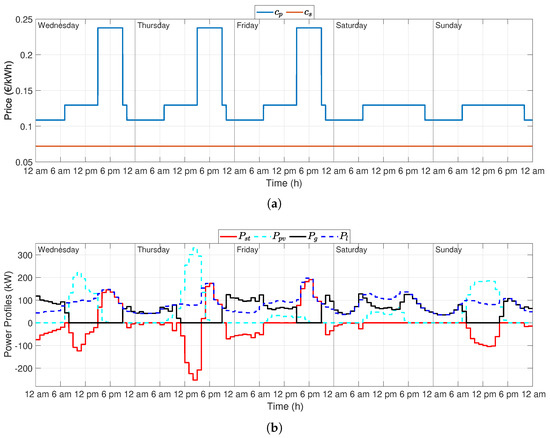
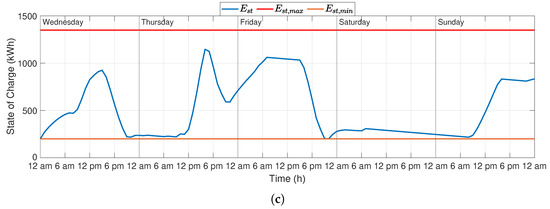
Figure 8.
MPC results with Australian prices in a simulation of five days: (a) Cost and revenue of energy; (b) Power Profiles; (c) State of Charge.
- Peak: 23.76 c€/kWh (from 3 pm to 9 pm);
- Shoulder: 12.95 c€/kWh (from 7 am to 3 pm, from 9 pm to 10 pm);
- Off-peak: 10.86 c€/kWh (from 10 pm to 7 am),
while on the weekend there are two different periods:
- Shoulder: 12.95 c€/kWh (from 7 am to 10 pm);
- Off-peak: 10.86 c€/kWh (from 10 pm to 7 am).
In Figure 8b,c, simulation results given by the MPC controller are shown. In this case, on Wednesday, due to the daily tariff difference, the storage is charged during off-peak time exploiting the grid in order to satisfy the daytime demand during peak price period since the controller forecasts lack of production in the prediction horizon; the same scenario also happens during the night between Thursday and Friday with the aim of satisfying demand on Friday afternoon. During the night between Friday and Saturday the ESS is charged in such a way as to only satisfy lower bound constraint since the daily price variation does not exceed on the weekend; with a daily variation of about 2 c€/day one storage cycle would increase the overall economic cost.
5.3. Dynamic Pricing Rate—MPC Simulation
In this scenario, a dynamic pricing rate has been applied taking as a reference the retail offer proposed by a British retailer. Under this tariff, the price is set differently for each time interval in the upcoming day, based on the wholesale market results. In particular, a high price in the late afternoon period can be detected. This interval coincides with the most stressful hours for the grid (load peak) and the highest prices in the wholesale market. In this way, the retailer shifts part of the risk on the customer but, at the same time, offers saving opportunities for those users capable of shifting their load or controlling in a smart way their storage systems. Moreover, the retail price may vary on a daily basis, being updated everyday at 4 pm, according to the results of the day-ahead market. Such variations aim at inducing a responsive behaviour in the demand, which could be exploited in presence of a storage unit operating a load shifting over time. In this way, the tariff results even more dynamic and the customer has all the information to plan its consumption for the next day. This tariff requires a fixed daily charge of 21 p/day, while ensuring a price cap of 35 p/kWh.
Regarding the sale price, in April 2019 Great Britain ended the state-run FIT scheme [40]. Since January 2020, suppliers with more than 150,000 domestic customers must offer a rate for the energy produced by users who installed a generator with a capacity up to 5 MW. In this case, the retailer offers a flat rate of 5.5 p/kWh for the energy produced.
In Figure 9, energy prices and the MPC simulation results are reported. A rate exchange of 1.19 €/£ is adopted. It is worth to note that from 4 pm to 7 pm the cost of energy exceeds 30 c€/kWh, with a daily variation that is higher than 20 c€/kWh. In the simulation, the ESS is charged in case of excess of PV power with respect to the demand, while the MPC exploits the power grid to charge the storage on Friday morning and during the night between Friday and Saturday, buying energy during low price hours in such a way as to efficiently exploit only the storage during peak price period (in the late afternoon).

Figure 9.
MPC results with Great Britain prices in a simulation of five days: (a) Cost and revenue of energy; (b) Power Profiles; (c) State of Charge.
5.4. Heuristic Approach Simulation
Since the heuristic approach does not exploit future information about energy prices and predicted signals, the reported simulations are the same ones for the three considered cases and are provided in Figure 10. When the PV power is higher than the load, the excess power is driven to the storage, while in case of lack of generation the storage is discharged or even it requires power to the grid if the state of charge is equal to the lower bound constraint.
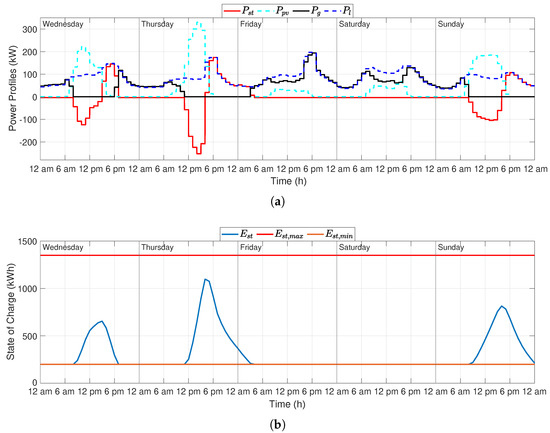
Figure 10.
Heuristic approach results in a simulation of five days: (a) Power Profiles; (b) State of Charge.
6. Results Comparison
In this section, based on the results obtained in the simulations shown above, observations are made on the comparison of the two control approaches performances. Table 2 reports the economic costs given by the predictive solution, the heuristic approach (HA) and the case in which no ESS system is installed (No ESS) in the three considered scenarios, considering a time horizon of one week including the five days discussed in the previous section.
Table 2.
Economic costs in a simulation of one week in the three considered scenarios *.
In the simulations, the mean energy generated by the photovoltaic production is about 843 kWh/day and the mean energy absorbed by consumers is about 1971 kWh/day. The overall economic costs related to the four columns of each scenario in Table 2 consist of the three terms defined in Section 3.2 and the charge contribution explained in Section 5:
- Purchase: economic cost for energy purchase;
- Sale: revenue from the sale of energy;
- ESS: storage wearing economic cost;
- Charge: charge contribution. The charge contribution values come from a fixed daily aggregate charge of 66 €/day in Scenario 2 and about 25 €/day in Scenario 3, while in Scenario 1 there is no charge.
Summing all the aforementioned components, the overall cost can be obtained and it represents the cost incurred by the energy community to supply its members. Through the employment of a smart ESS management logic (MPC), the expected reduction in the electricity purchase cost will provide a clear advantage for the community members, in the form of a lower overall expenditure.
It is worth to note from Table 2 that in the MPC simulations, energy is never sold to the grid, exploiting all available power from storage and production; this happens also in the heuristic strategy simulation since the ESS never reaches the upper bound constraint. The economic cost for ESS wearing is the same for the three scenarios in the heuristic approach case, since its algorithm implementation does not depend on energy tariff. A great attention has to be given to the ESS wearing cost in the predictive controller simulations. While in the first scenario the MPC cost results lower than the heuristic approach value, in both the second and third scenarios the MPC cost is higher. This is justified since in both cases the daily tariff (energy purchase price) variation results higher than : the predictive solution widely exploits the ESS using in a smart way the available resources in such a way as to obtain a substantial economic saving from energy purchase; indeed the MPC saving with respect to heuristic solution is 21.71% and 23.60% in case a steep TOU rate or dynamic pricing are applied, respectively, while a very small advantage is obtained in the case of a flat TOU rate, 0.68%.
Paying attention on the overall economic costs, the MPC saving with respect to the heuristic strategy is 2.75% in Scenario 1, 7.85% in Scenario 2 and 14.53% in Scenario 3. The results of the comparison do not significantly change if the charge contribution is neglected: 2.75% in Scenario 1, 10.27% in Scenario 2 and 16.09% in Scenario 3.
In Scenario 1, where there is a low daily variation of the purchase price, the lowest saving is obtained; in Scenario 2, introducing a higher variability in the purchase price, a greater saving is achieved while in Scenario 3 the highest result is obtained, as a consequence of a larger variability in the purchase price.
When compared to heuristic solution, the predictive approach improves the performances as much as a higher daily variation of the cost of energy is adopted by the retailer. Moreover the MPC proves to be doubly smart in optimization; on one hand, it decides when to charge the ESS exploiting the grid in case the purchase price is sufficiently low, on the other hand, it discharges the storage during the daytime price peak.
The authors have verified that, when compared to the heuristic approach, the MPC saving numerical results change with scenarios considering different generation and absorption profiles and modified parameters; however, simulations confirm that MPC provides a better solution than the heuristic approach with higher advantages as the daily price variation increases. Of course, the final extent of the obtained advantages depend on the actual signals and parameters.
Considering the case of a microgrid endowed with only PV units, in which energy is sold to the grid whenever production exceeds the load, the MPC achieves a saving of 1.86% in Scenario 1, 3.20% and 14.92% in Scenario 2 and Scenario 3, respectively; it is worth highlighting that the negative cost values reported in Table 2 in case no storage is installed (No ESS) correspond to positive revenues (a net positive income is obtained if total revenues are greater than total costs).
It is worth to note that the comparison of the two control modes and the case in which no ESS system is installed depends on generation and absorption profiles, on the value of and on system’s losses. In detail, the MPC advantages increase if the ratio between the generated and absorbed energy rises and when and ESS losses decrease. An analysis of the investment on end-users side, considering all possible working conditions and different options for the storage installation is beyond the scope of this work. However, the future trend of diffusion of renewable energy resources, ESS realization technology improvement and decrease of batteries price will make the use of predictive approaches for the control of ESS systems desirable in order to obtain consistent economic cost savings, offering an important service for the aggregate prosumers.
7. Conclusions
In this paper, an advanced control methodology called model predictive control is used to minimize the economic cost of an energy community of prosumers by predicting future system’s dynamics and future aggregate production and load. The predictive approach is compared to a heuristic strategy that acts in an instant manner, without any information about future, in three different scenarios considering current retail tariffs available in Italy, Australia and Great Britain characterized by increasing retail price variability. The MPC always obtains a lower cost than the heuristic strategy: the cost saving is proved to increase with the rise of price variation during the day. A key observation regards the MPC smart optimization procedure: on the one hand it decides the charging time of the storage exploiting the grid in case the purchase price is low enough, on the other hand it discharges the storage during the daytime price peak. Simulations conducted in this study confirm that the MPC, compared with the heuristic approach, allows a better exploitation of existing ESS, taking advantage of the time varying rates that emphasize this effect, indicating that retail tariffs reflecting the actual market price trend allow enhancing the end-users’ flexibility as an ancillary service for the system operator. The comparison of MPC numerical results with the case in which the microgrid is provided only with PV production confirms the validity of predictive approaches for the control of energy storage systems in a future perspective.
Author Contributions
M.C., T.C. and R.C. conceived the study. M.A., M.C. and A.C. supported the work by making studies and searches on the energy tariffs currently applied in different countries. F.S., T.C. and R.C. derived the methodology. F.S. and F.L. developed the software, working in the MATLAB® environment. R.T. and P.T. are the project managers and supervised the research. All authors have read and agreed to the published version of the manuscript.
Funding
The research received funding from the Interdepartmental Centre Giorgio Levi Cases, NEBULE project.
Conflicts of Interest
The authors declare no conflict of interest.
References
- Directorate-General for Energy. Clean Energy for all Europeans; Technical Report; European Commission: Brussels, Belgium, 2019. [Google Scholar] [CrossRef]
- Italian Ministry for Economic Development. Proposal of a National Integrated Plan for Energy and Climate; [Proposta di Piano Nazionale Integrato per L’energia e il Clima], Technical Report; Italian Ministry for Economic Development: Roma, Italy, 2019.
- Bignucolo, F.; Cerretti, A.; Coppo, M.; Savio, A.; Turri, R. Effects of energy storage systems grid code requirements on interface protection performances in low voltage networks. Energies 2017, 10, 387. [Google Scholar] [CrossRef]
- Bignucolo, F.; Cerretti, A.; Coppo, M.; Savio, A.; Turri, R. Impact of distributed generation grid code requirements on islanding detection in LV networks. Energies 2017, 10, 156. [Google Scholar] [CrossRef]
- Eser, P.; Singh, A.; Chokani, N.; Abhari, R.S. Effect of increased renewables generation on operation of thermal power plants. Appl. Energy 2016, 164, 723–732. [Google Scholar] [CrossRef]
- Rejc, Ž.B.; Čepin, M. Estimating the additional operating reserve in power systems with installed renewable energy sources. Int. J. Electr. Power Energy Syst. 2014, 62, 654–664. [Google Scholar] [CrossRef]
- de Mars, P.; O’Sullivan, A.; Keppo, I. Estimating the impact of variable renewable energy on base-load cycling in the GB power system. Energy 2020, 195, 117041. [Google Scholar] [CrossRef]
- IRGC. Demand-Side Flexibility for Energy Transitions: Ensuring the Competitive Development of Demand Response Options; Technical Report; International Risk Governance Council (IRGC): Lausanne, Switzerland, 2015. [Google Scholar]
- Yin, R.; Kara, E.C.; Li, Y.; DeForest, N.; Wang, K.; Yong, T.; Stadler, M. Quantifying flexibility of commercial and residential loads for demand response using setpoint changes. Appl. Energy 2016, 177, 149–164. [Google Scholar] [CrossRef]
- Qureshi, F.A.; Jones, C.N. Hierarchical control of building HVAC system for ancillary services provision. Energy Build. 2018, 169, 216–227. [Google Scholar] [CrossRef]
- Zhao, J.; Kucuksari, S.; Mazhari, E.; Son, Y.J. Integrated analysis of high-penetration PV and PHEV with energy storage and demand response. Appl. Energy 2013, 112, 35–51. [Google Scholar] [CrossRef]
- Wang, Z.; Gu, C.; Li, F.; Bale, P.; Sun, H. Active demand response using shared energy storage for household energy management. IEEE Trans. Smart Grid 2013, 4, 1888–1897. [Google Scholar] [CrossRef]
- Behrangrad, M. A review of demand side management business models in the electricity market. Renew. Sustain. Energy Rev. 2015, 47, 270–283. [Google Scholar] [CrossRef]
- Asadinejad, A.; Tomsovic, K. Optimal use of incentive and price based demand response to reduce costs and price volatility. Electr. Power Syst. Res. 2017, 144, 215–223. [Google Scholar] [CrossRef]
- Haider, H.T.; See, O.H.; Elmenreich, W. A review of residential demand response of smart grid. Renew. Sustain. Energy Rev. 2016, 59, 166–178. [Google Scholar] [CrossRef]
- Eid, C.; Koliou, E.; Valles, M.; Reneses, J.; Hakvoort, R. Time-based pricing and electricity demand response: Existing barriers and next steps. Util. Policy 2016, 40, 15–25. [Google Scholar] [CrossRef]
- Mirza, F.M.; Bergland, O. Pass-through of wholesale price to the end user retail price in the Norwegian electricity market. Energy Econ. 2012, 34, 2003–2012. [Google Scholar] [CrossRef]
- Mazidi, P.; Baltas, G.N.; Eliassi, M.; Rodriguez, P.; Pastor, R.; Michael, M.; Tapakis, R.; Vita, V.; Zafiropoulos, E.; Dikeakos, C.; et al. Zero Renewable Incentive Analysis for Flexibility Study of a Grid. In Flexitranstore; Németh, B., Ekonomou, L., Eds.; Springer International Publishing: Berlin, Germany, 2020; pp. 47–60. [Google Scholar] [CrossRef]
- Vita, V.; Zafiropoulos, E.; Gonos, I.F.; Mladenov, V.; Chobanov, V. Power System Studies in the Clean Energy Era: From Capacity to Flexibility Adequacy Through Research and Innovation. In Flexitranstore; Németh, B., Ekonomou, L., Eds.; Springer International Publishing: Berlin, Germany, 2020; pp. 73–83. [Google Scholar] [CrossRef]
- Mladenov, V.; Chobanov, V.; Zafeiropoulos, E.; Vita, V. Flexibility Assessment Studies Worldwide-Bridging with the Adequacy Needs. In Proceedings of the 2019 11th Electrical Engineering Faculty Conference (BulEF), Varna, Bulgaria, 11–14 September 2019; pp. 1–5. [Google Scholar] [CrossRef]
- Raimondi Cominesi, S.; Farina, M.; Giulioni, L.; Picasso, B.; Scattolini, R. A Two-Layer Stochastic Model Predictive Control Scheme for Microgrids. IEEE Trans. Control Syst. Technol. 2018, 26, 1–13. [Google Scholar] [CrossRef]
- Wang, L. Model Predictive Control System Design and Implementation Using MATLAB; Springer: Berlin, Germany, 2009. [Google Scholar] [CrossRef]
- Camacho, E.; Bordons, C.; Alba, C. Model Predictive Control; Advanced Textbooks in Control and Signal Processing; Springer: Berlin, Germany, 2004. [Google Scholar]
- Lei, M.; Yang, Z.; Wang, Y.; Xu, H.; Meng, L.; Vasquez, J.C.; Guerrero, J.M. An MPC-Based ESS Control Method for PV Power Smoothing Applications. IEEE Trans. Power Electr. 2018, 33, 2136–2144. [Google Scholar] [CrossRef]
- Hu, J.; Xu, Y.; Cheng, K.W.; Guerrero, J.M. A model predictive control strategy of PV-Battery microgrid under variable power generations and load conditions. Appl. Energy 2018, 221, 195–203. [Google Scholar] [CrossRef]
- Shan, Y.; Hu, J.; Li, Z.; Guerrero, J.M. A Model Predictive Control for Renewable Energy Based AC Microgrids Without Any PID Regulators. IEEE Trans. Power Electr. 2018, 33, 9122–9126. [Google Scholar] [CrossRef]
- Parisio, A.; Rikos, E.; Glielmo, L. A Model Predictive Control Approach to Microgrid Operation Optimization. IEEE Transactions on Control Systems Technology 2014, 22, 1813–1827. [Google Scholar] [CrossRef]
- Qi, W.; Liu, J.; Christofides, P.D. Supervisory Predictive Control for Long-Term Scheduling of an Integrated Wind/Solar Energy Generation and Water Desalination System. IEEE Trans. Control Syst. Technol. 2012, 20, 504–512. [Google Scholar] [CrossRef]
- Antonini, F.; Giannitrapani, A.; Paoletti, S.; Vicino, A. Optimal management of energy storage systems for residential customers with photovoltaic generation. In Proceedings of the 2018 IEEE International Energy Conference (ENERGYCON), Limassol, Cyprus, 3–7 June 2018; pp. 1–6. [Google Scholar] [CrossRef]
- Narayan, N.; Papakosta, T.; Vega-Garita, V.; Qin, Z.; Popovic-Gerber, J.; Bauer, P.; Zeman, M. Estimating battery lifetimes in Solar Home System design using a practical modelling methodology. Appl. Energy 2018, 228, 1629–1639. [Google Scholar] [CrossRef]
- Sechilariu, M.; Wang, B.; Locment, F. Building Integrated Photovoltaic System With Energy Storage and Smart Grid Communication. IEEE Trans. Ind. Electron. 2013, 60, 1607–1618. [Google Scholar] [CrossRef]
- Kolar, J.W.; Krismer, F.; Lobsiger, Y.; Muhlethaler, J.; Nussbaumer, T.; Minibock, J. Extreme efficiency power electronics. In Proceedings of the 2012 7th International Conference on Integrated Power Electronics Systems (CIPS), Nuremberg, Germany, 6–8 March 2012; pp. 1–22. [Google Scholar]
- Tesla Powerwall. 2020. Available online: https://www.tesla.com/powerwall (accessed on 29 May 2020).
- ARERA. Resolution ARG/elt 122/11: Start of the Process for the Formation of Measures About the Application of Time-Differentiated Fees in the Regulated Retail Market; [Avvio di Procedimento per la Formazione di Provvedimenti in Materia di Modalità di Applicazione]; ARERA: Milano, Italy, 2011. [Google Scholar]
- Torriti, J. Price-based demand side management: Assessing the impacts of time-of-use tariffs on residential electricity demand and peak shifting in Northern Italy. Energy 2012, 44, 576–583. [Google Scholar] [CrossRef]
- ARERA. Retail Monitoring. Report for Year 2018; [Monitoraggio Retail. Rapporto per L’anno 2018]; ARERA: Milano, Italy, 2019. [Google Scholar]
- ARERA. DCO 322/2012/R/eel: Review of the Integrated Text on “Scambio sul Posto” Measure; [Revisione del Testo Integrato per lo Scambio sul Posto]; ARERA: Milano, Italy, 2012. [Google Scholar]
- Australian Government. Energymadeeasy-Electricity Plans; Australian Government: Canberra, Australian, 2020.
- Australian Energy Market Commission. Spot and Contract Markets; Australian Energy Market Commission: Sydney, Australian, 2020.
- Ofgem. About the Smart Export Guarantee (SEG); Technical Report; Ofgem: London, UK, 2019.


© 2020 by the authors. Licensee MDPI, Basel, Switzerland. This article is an open access article distributed under the terms and conditions of the Creative Commons Attribution (CC BY) license (http://creativecommons.org/licenses/by/4.0/).