Abstract
Early fault detection and diagnosis in heating, ventilation and air conditioning (HVAC) systems may reduce the damage of equipment, improving the reliability and safety of smart buildings, generating social and economic benefits. Data models for fault detection and diagnosis are increasingly used for extracting knowledge in the supervisory tasks. This article proposes an autonomic cycle of data analysis tasks (ACODAT) for the supervision of the building’s HVAC systems. Data analysis tasks incorporate data mining models for extracting knowledge from the system monitoring, analyzing abnormal situations and automatically identifying and taking corrective actions. This article shows a case study of a real building’s HVAC system, for the supervision with our ACODAT, where the HVAC subsystems have been installed over the years, providing a good example of a heterogeneous facility. The proposed supervisory functionality of the HVAC system is capable of detecting deviations, such as faults or gradual increment of energy consumption in similar working conditions. The case study shows this capability of the supervisory autonomic cycle, usually a key objective for smart buildings.
1. Introduction
Buildings consume above one-third of the total electrical energy supplied to the city. Research on energy efficiency in buildings becomes imperative. Energy consumption can be normally cut down by deploying a BMS (building management system), which monitors and controls the building facilities, such as the elevators, the heating, ventilation and air conditioning (HVAC) or the lighting systems [1]. The BMS processes the logs coming from the connected devices deployed in the building for controlling the equipment, supervising the system or optimizing the energy efficiency. The energy supervisory system is one of the key components of any BMS, comprising a meter module and an efficiency analyzer that captures abnormal situations [1,2,3]. The supervisory function shows what it is worth in case of unforeseen malfunction, such as hardware failures, voltage fluctuations, insufficient fluid pressure or temperature out of range. These events, when not being supervised, turn into expenses due to the required inspections to identify in the building the points where they were originated.
Focusing on the building services, the HVAC system is the most consuming one, as it works with boilers, coolers, air-handling units, cooling towers or water pumps. A smart building requires hence to wisely adjust the HVAC’s operational modes to save energy. The automation and optimization have been applied for decades in this field, but there is still room to improve. Previous studies propose an autonomous management architecture that operates on a multi-HVAC model based on the autonomic cycle of data analysis tasks (ACODAT) concept [1], leading to improving the energy efficiency and reducing costs. This management system gathers the data read from the system and environment sensors and regulate the controllers, following the multi-HVAC model predictions. Another article proposes the LAMDA (learning algorithm for multivariant data analysis) robust fuzzy-based control method for HVAC, being susceptible to be incorporated in the management system as an ACODAT [4]. This study keeps this line of research and proves the idea of ACODAT for the supervision of building HVAC systems.
ACODAT paradigm was initially proposed for smart classrooms [5] and lately applied to different fields, such as telecommunications [6], e-learning environments [7,8] or Industry 4.0 [9]. It is based on the autonomic computing paradigm proposed by IBM, also known as MAPE-K (monitors, analyze, plan and execute—knowledge base) [10], which works in autonomic cycles. The first phase, known as the monitoring phase, collects and prepares the data coming from the managed resources. Then, in the analysis phase, complex situations are identified, and future situations assessed for the planning phase, in which the instruction set will be built to approach the system’s goals. Finally, the instruction set is executed in the execution phase. ACODAT, similarly to MAPE-K’s cycles, allows the development of an autonomous intelligent cycle for achieving the desired behavior, by using sets of data analysis tasks, able to perform both individually and coordinated. In this proposal, the analysis tasks interact with each other assuming specific roles in the cycle [5,7,8], to monitoring the supervised process and analyzing the observations, so that the management system can make effective decisions based on the actual behavior of the HVAC and leads to accomplish the objectives for which it was designed.
This study proposes an ACODAT-based HVAC supervisory autonomous cycle, centered in the fault detection and diagnosis (FDD) of abnormal situations, being able to trigger alarms. The current HVAC system operation is identified with improved knowledge models. Traditionally, these knowledge models were affected by unrealistic situations or not well-calibrated mathematical models. This article presents a proposal to overcome this problem, in which the ACODAT-based module makes use of real-time data for ongoing modeling of the HVAC equipment, and discovers its behavior with the context information. The article will show how well the knowledge-extraction is performed with the chosen machine learning (ML) techniques leading to reduce the energy consumption and prevent the equipment’s degradation with an autonomic HVAC supervision.
The use of the ACODAT-based supervisory module for building’s HVAC equipment is a novel proposal, which could be expressed as the use of autonomic cycles of data analysis tasks for the self-supervision of building HVAC systems. This article is organized as follows: Section 2 summarizes the scientific work around the proposal. Section 3 presents the functionality of the ACODAT-based supervisory module for HVAC systems. Section 4 proves the concept in a case study and its performance. Finally, Section 5 raises the conclusions of this research.
2. Related Work
BMS is considered as an assistant tool requiring a human behind and never has been the advantage of getting some of their functions running autonomously. In any case, several considerations related to this topic have been treated independently, such as its automation, control optimization, FDD, process supervisory management or its energy efficiency improvements with predicting models. The multiple dimensions of the proposed problem, such as its nonlinear responses, dynamic nature, wide and unpredictable range of perturbations and, sometimes, the fear of the building owners and the operators to new experimental technologies, make it complex. The next subsections describe the main elements of this proposal.
2.1. Smart Buildings
The ‘smart building’—or ‘intelligent building’—concept has been primarily associated with the bare automation of the systems providing any service to building’s users. It extended certain characteristics of the ‘smart home’, where the technology automated several processes with schedule and remote control [11]. In general, the most consuming systems were the first ones to be automatized (controlled and supervised), as a whole, with building automation systems (BAS). The BAS, also known as BMS, stresses its management behavior to plan midterm and long-term strategies for the improvement of the performance of the systems. The introduction of ICT (information and communications technologies) allowed this significant advance. The advances in telecommunications enabled the use of the existing data networks for the interconnection of the elements, and even, the systems. The state of the equipment, the controlled variables and the context information, could be gathered to make better decisions about the comfort and energy savings. But it is yet a hard task to get the perfect optimization of all systems. However, the automated supervision brings benefits, such as the maintenance cost reduction and the robustness against unpredictable perturbations [12].
On the other hand, the industry around the smart cities is increasingly providing solutions in areas like energy, water, mobility, buildings or government in the short term. Energy is probably the most concerning matter because of its economic impact and social concerns. Buildings consume over 40% of the electrical energy in the most populated cities of the West [13]. The HVAC system is the building service that consumes more with 32.7% of the power supply on average, while lighting requires 17.1% of the supply and the computers and appliances the 13.6% [14]. When buildings are public, such as offices, malls or museums, the HVAC consumption is even higher, reaching 40.3% on average of the total supply.
To address this problem, researches have been seeking to optimize the consumption of the building’ services, like HVAC, lighting or elevators, applying control policies, automation and optimization. If the energy efficiency is critical, other objectives, such as improving the security & access control or people-centered policies, are gradually getting importance in smart building’s considerations. Technology evolution makes systems become ‘smarter’. Energy efficiency has been achieved with good practices in the daily operations, with social responsibility, government’s enforcement regulation or by financial departments’ cost-effectiveness pressure. Now, a smart building is broadening the response to these challenges with AI, the Cloud, Big Data, IoT or hardware parallelization, to improve the mobility, ubiquity, accuracy and interoperability.
The study of Navigant Research pointing at a cognitive management concept, identified in 2016 the following trends in the smart building’s market [15]. Utility companies, such as electricity, water, telephone or gas suppliers, have started significant investments in BMS aiming to hopefully experience a noticeable development in management. Another trend is that the energy cloud will redefine buildings as energy assets. Climate policies will be oriented towards improving the energy efficiency. Buildings will optimize the experience of the occupants and their health conditions. New operational practices will drive to more savings and generate new financial opportunities. Finally, cybersecurity will become in this new context a key differentiator. However, some of these trends are difficult to implement and expensive, not giving back clear returns (e.g., the energy cloud) [16].
2.2. HVAC Systems
HVAC systems are complex structures, made up of coolers, heat pumps, heating or cooling coils, boilers, air-handling units, fans, pumps, thermal storage systems and liquid or air distribution systems. Deployed sensors and actuators allow the regulation of the controllable variables, such as indoor temperature, humidity, fluid pressure flowing throughout the pipes, chilled or heated water temperature or air fans speed. The system is difficult to model due to its dynamic and nonlinear nature [1].
The simplest way for controlling HVAC has been by sequencing ON–OFF orders, but these are far to meet the multi-objective building requirements [17]. Continuous regulation is widely performed with classic and inexpensive proportional integral derivative (PID) controllers. Nonlinearities, like partial loads, requiring self-tuning techniques, such as relay-autotuning, open-loop step tests and more recently fuzzy logic, Ziegler–Nichols or Cohen–Coon methods [4]. HVAC also requires multiple input and multiple output variables (MIMO) handling, like splitting the mechanism into several SISO subsystems—or just the PID. This in any case remains difficult to stabilize [4]. Complexity arises in applying multi-objective optimization requiring advanced control methods. Advanced control works with models that fall into three categories: ‘white box’, ‘black box and ‘gray box’ [17].
White box models are built with direct mathematical formulations, modeling the mass balance, heat transfer, thermal momentum or flow rates with differential equations. The system analysis and generalization are simple but require deep knowledge in physics field. These models can be used only in simple systems, like SISO and steady-state systems, because otherwise could incur in heavy computational costs or low accuracy due to simplifications.
Black box or empirical models work with data and need to be built in a preliminary phase, by relating the recorded outputs to the inputs via statistic or ML methods. These data models are being implemented for real-time control, plant modeling, controller design, system performance improvement, calibration and parameterization. Once the model is learned, they are very fast, consume low computational resources, and can be used for simulating any layer components, since heat pumps up to complete subsystems, like multi-HVAC [1]. As a drawback, they have less capability of generalization, remaining constrained to the experience learned from the actual data.
Gray or hybrid models balance the black and white box drawbacks, improving simultaneously the accuracy and generalization capabilities. They normally use optimization like least squares, gradient descent or genetic algorithm (GA) to discover the ideal system parameters. fuzzy logic (FL) optimization shows also satisfactory performance, using simple mathematics—without formulating the physics inside- ruling robustly the systems even when they were nonlinear and complex. fuzzy adaptive network (FAN), Takagi–Sugeno fuzzy model (TS) and adaptive neuro-fuzzy inference system (ANFIS) controllers improve the accuracy of the prediction with a fast execution. However, when higher accuracy is needed, they require more grading, increasing exponentially the number of rules, and therefore, performing slower. When contextual information, such as the year season or scheduled activities are incorporated into the system’s knowledge, they are translated into fuzzy rules that shorten the training stage.
Other models are used to fit the system to desired trajectories based on evolutionary algorithms or statistics or linear or polynomial regressions, like nonlinear ARX (autoregressive with exogenous inputs), ARMAX (autoregressive-moving average with exogenous variables) and ARIMA (autoregressive integrated moving average) models. ANNs (artificial neural networks) also contribute through the application of NNARX (neural network autoregressive with exogenous inputs), FFBP (feed forward back propagation) and RBF (radial basis function). frequency–domain, state–space, geometric, case-based reasoning, stochastic and instantaneous methods are also applied.
2.3. BMS
The BMS is a computer-based control system that supervises and manages the building’s service, actuating in the networked electromechanical equipment. It was originally intended for monitoring the systems and improve the energy savings with the automation of control and is also known as BAS (building automation system). Nowadays, BMS usually stores data that can be analyzed for making longer-term decisions supporting the optimization of multiple objectives, such as healthier environments, pleasant indoor climate or cost reduction. The architecture has evolved from closed and standalone to an open and networked paradigm with more efficient remote procedures, providing intelligence and analytics, becoming in a cloud-based and multi-sourced architecture [14].
However, it is unclear in the state-of-the-art that the current technology can simultaneously optimize the multiple required objectives. The estimations about energy savings differ considerably depending on where solutions are applied, i.e., production, load or user’s behavior; the type of building; or the number of pursued objectives. For example, some authors claim that energy can be saved up to 27% working on the BMS [18]. Others estimate that they can save up to 20% of the energy applying control optimization in space heating and others that can be reduced up to 10% in lighting and ventilation [19].
Focusing on the technological challenges for the research applied to BMS, the following ones are identified [20]:
- The integration and usability of heterogeneous networks, technologies and applications into one single platform;
- The maintenance and support of smart, self-adaptive, autonomous applications and objects.
- The on-demand and flexible service provision;
- The size of the foreseen infrastructure with an estimation of 500 billion devices connected to the Internet by 2020, 50 billion of them via mobile wireless [21];
- The machine-machine communication and multi-agent orchestration.
2.4. Self-Management
HVAC management literature has treated about supervision of control and optimization processes with predicting models, networked elements in higher hierarchical layers or orchestrated in multi-agent architectures. However, the potential of an autonomic management entity has not been fully studied and proved yet. Plain operational decisions still require manual procedures. The autonomic learning capability of the management system will probably lead to improve the system control accuracy and robustness. The ACODAT-based management for HVAC will likely improve the multi-objective based on changing fuzzy policies [1]. The original idea published by IBM in 2001 [22] was that the software was sufficiently intelligent for caring of itself, similar to what the autonomic nervous system does, getting self-configuration, self-optimization, self-protection and self-healing. The data analysis tasks comprised in an autonomous cycle work together for shared common goals in the managed process, exploiting the data collected from the system to build knowledge models that describe, optimize and predict its behavior. They co-operate among them and interact with the system according to their specific roles.
ACODAT is decision-making oriented [5,7,8], and its tasks work together to achieve the objective of the supervised process. The tasks have different roles in the autonomous cycle, such as observing the process, analyzing and interpreting the events and making decisions to reach the objective for which the cycle was designed. This cycled solution allows solving complex problems in real time. The detailed description of the roles of each task is as follows:
- Monitoring: Tasks in charge of observing the supervised system. They capture data and information about the behavior of the system. In addition, they are responsible for the preparation of the data for the next steps (preprocessing, selecting the relevant features, etc.).
- Analysis: Tasks in charge of interpreting, understanding and diagnosing what is happening in the monitored system. These tasks use building knowledge models of observed dynamics and behaviors, to understand what is happening in the system.
- Decision-making: Tasks in charge of defining and implementing the necessary actions based on the previous analysis, in order to improve the performance, detect failures, among other things, in the supervised system. These tasks impact the dynamics of the system to improve it. The effects of these tasks are again evaluated in the monitoring and analysis steps, restarting a new iteration of the cycle.
An ACODAT has a multidimensional data model that works with the data collected from different sources, to characterize the behavior of the context and transform it into knowledge. Particularly, it can work with multiple data models, like ontologies, cognitive maps, etc. It runs on a single platform that integrates the necessary tools required for the tasks to process the information. Some of these tools are of data mining, semantic mining or linked data.
Thus, the tasks specifically required for the HVAC management perform system and context monitoring, data analysis, state diagnosis and decision-making, transformed into physical signals for the actuators.
2.5. Supervision System
The supervision system interacts with the controller. The latter regulates the machines and/or processes and the former watches the activity to detect abnormal situations [2,3,23]. FDD is one of these supervision systems indicating abnormal conditions necessary to discover. Faults in coolers are usually caused by degraded installations or bad human practices. coolers’ performance degradation is hardly detected and causes 42% of the service calls and 26% of repairing expenses [23].
Classifying fault severity level has three steps: the detection of the fault, its isolation and its identification. First-generation FDDs were based on rules and statistics and provided simplistic knowledge with a limited set of expected faults, and thus the support of field experts was unavoidable [3]. Today’s generation uses ML techniques and stands out for detection and diagnosis [24,25]. An AFD (automatic fault detection) system continuously monitors the HVAC system’ states with fuzzy algorithms [26]. Recent AI models allow dynamic fault detection thresholds minimizing the number of false positives and reducing the number of missed faults, with agglomerative clustering that starts with one cluster per data point and groups them into likelihood-based clusters. Some studies associate these models with the Bayesian’s DBNs (dynamic Bayesian networks) and Markov’s HMM (hidden Markov model) techniques.
The fault prognosis (early diagnosis) by detecting equipment degradations allows keeping the optimum performance throughout the facility’s life cycle. Classical fault detection and diagnosis is based on supervised learning models, while the prognosis is based on RL [27]. The most common reinforced learning (RL) is implemented with MDP (Markov decision process) or its variant, POMDP (partially observable Markov decision process), necessary when the context state is not fully known. RL can be applied to a multi-agent problem, such as MARL (multi-agent reinforcement learning) or deals with the optimal coordination between cooperative or competitive agents with decentralized POMDP. When the problem applies to different tasks, TL (transfer learning) transfers knowledge once the problem is solved to support solving the next one. MTL (multi-task learning) is also based on this principle, but tasks are variants of the same problem. Another important approach is the MORL (multi-objective reinforced learning), whereas the objective is to learn multiple policies simultaneously for every objective [28,29].
Kim et al. review studies about the automated FDD (AFD) since 2004 for commercial buildings [30]. They categorize AFD’s methods in three groups and analyze several to understand their strengths and weaknesses. Deshmukh et al. present analytical methods embodied in useful software tools to identify and evaluate some building system faults, which cause large building energy inefficiencies [31]. They define the target faults, such as the imbalanced airflows within several large air-handling units. The experiments show that embracing uncertainty with an HVAC’s fault detection system is paramount to a good fault inference. Deshmukh, continuing his study, considers algorithms for faults like stuck dampers and leaking dampers [32]. These damper’s fault detection algorithms can be applied to both outdoor and return air dampers. They combine expert-rule based fault detection models with the first principles of thermodynamics, for fault detection with minimal non-intrusive measurements. The algorithms focus on detecting faults with minimal data in a large monitored academic building. The experiment used the data collected from the BEMS (building energy management system) of an academic building in Boston.
3. ACODAT-Based supervision of HVAC Systems
This section describes the proposed ACODAT-based supervision approach for HVAC systems. It is a novel and versatile concept that allows concurrent data-driven models to reach strategic goals. This concept has not previously been used in the context of supervision tasks in smart buildings.
3.1. General Architecture
The multi-HVAC model is made of one or several HVAC’ subsystems, formed of coolers and their associated mechanisms, water pumps, electro-valves, etc. The proposed autonomic cycle supervises each subsystem and works with the data obtained by the BMS. ACODAT-based supervision is composed of four data analysis tasks, as shown in Figure 1.
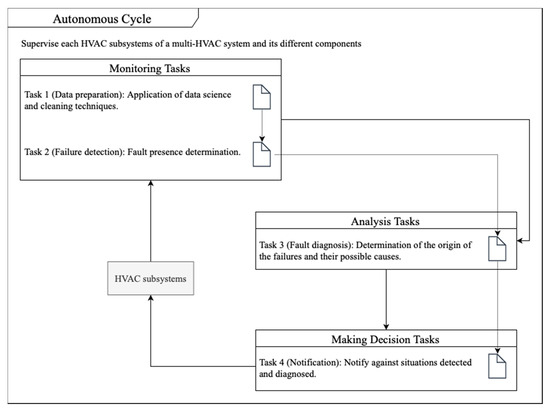
Figure 1.
ACODAT-based supervision for HVAC systems.
By monitoring the subsystems, Task 1 prepares the data and Task 2 detects failures. Task 3 diagnoses failures and Task 4 notifies failures and possible causes for the decision-making. Hence, the functionalities provided by the ACODAT-based supervision are as follows:
- Monitoring process: The tasks watch the subsystem, capture the data and get the information about its behavior, preprocessing or selecting relevant features, for consumption in the next steps.
- Analysis process: The tasks interpret, understand and diagnose in real time what happens in the subsystem assisted with data-driven models, discovering their dynamics.
- Decision-making process: The tasks define and launch the necessary physical actions on the subsystem’s controllable elements based on the passed analysis to accomplish the goals. The effects of these tasks are sent back for monitoring and analysis, re-starting a new cycle.
Table 1 shows the tasks proposed for the supervision, their roles in the ACODAT-based supervision system and data sources. The next subsections describe the set of tasks according to the role in the ACODAT-based supervision system.

Table 1.
ACODAT-based supervision tasks, roles and data sources for heating, ventilation and air conditioning (HVAC).
3.2. Monitoring Role
This section describes the tasks where the role in the ACODAT-based supervision system is the monitoring of the supervised process. According to Table 1, these tasks are the data preparation (Task 1) and the detection of failures (Task 2).
Specifically, Task 1 prepares the data, gathering it from the system and context sources, cleaning it and transforming it, improving its quality. The data may come from other autonomic cycles, such as for example from other building’ systems. Table 2 describes Task 1′s activities. Specifically, some of the activities defined in this task are: The selection of the target variables, a phase of feature engineering and data cleaning, among other data preparation processes. Particularly, feature engineering consists of the extraction of features from raw data, several feature analysis processes and fusion and selection of features.
Table 2.
Description of Task 1 of data preparation.
The monitoring process, then provides fault detection. The objective of this task is the real-time analysis of the variables’ behavior and detects when they deviate from the stipulated as normal ranges, identifying hence immediately the potential faults. The description of this task can be seen in Table 3.
Table 3.
Description of Task 2 for fault detection.
Particularly, this task extracts the knowledge for the failure detection, for which it uses classification and prediction models. Classification models are not totally data-driven, requiring an expert to identify the equipment’s normal working ranges. Prediction models, on the contrary, work autonomously, self-training only with data extracted from the original database. Once trained, the incoming real-time data are compared with the predictive model’s output at a given time. Unexpected deviations between both raise an indication that a potential failure is occurring.
Once the knowledge model to detect failures is selected, it is necessary to specify which algorithm to apply for the case study, based on its performance [33] in terms of accuracy and prediction error [34]. The accuracy is defined as the ratio between the correct predictions over all the observations, while the error is the mean squared error (MSE) between the observed values and their corresponding estimations produced by the model.
3.3. Analysis Role
This section describes the task with the role in the ACODAT-based supervision system of interpretation and analysis of the information from the supervised process. According to Table 1, this task carries out a diagnosis of the failure (Task 3).
Thus, Task 3 performs the fault diagnosis, i.e., it determines where the failures come from and their possible causes, as shown in Table 4. Its goal is to identify in which area of the building the problem is present and why it happens. Particularly, this task defines a knowledge model to carry out a diagnostic of the fault. The diagnostic model must assess the potential causes of the failures.
Table 4.
Description of Task 3 for analysis.
3.4. Decision-Making Role
In this section, is described the task which role in the ACODAT-based supervision system is to decide from the current situation detected and diagnosed in the previous phases. According to Table 1, this task is the notification of the current state of the supervised process (Task 4).
Task 4 notifies detected and diagnosed occurrences from the previous task. It raises alarms or alerts triggered by abnormal-tagged situations in the subsystems, such as an excess of energy consumption, failures, outliers, among other situations. Alarms simply warn about something, while alerts not only warn, but also request further surveillance on something. In the proposed case study, Task 4 raises alarms for any failure, and reports alerts when the subsystems are shutdown.
4. Case Study
The proposed concept is proven with a real case. The experiment works with actual data obtained from the BMS controlling the HVAC systems of the Teatro Real (Royal Theatre) in Madrid.
4.1. Experiment Context
Teatro Real is the opera palace in Madrid, Spain. The total floor square footage in squared meters is 65,000 m2 (700,000 ft2). The theatre has a capacity of 1746 seats. The building has 11 lounges for events, 4 rehearsal rooms, 7 multipurpose studios, an office area surrounding the main theater room occupying several floors and warehouses and technical areas in the basements. Figure 2 is a photo of the theatre’ seats.
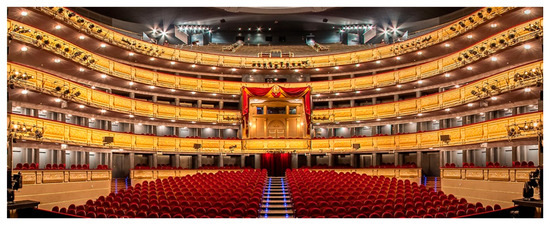
Figure 2.
Teatro Real of Madrid. View of the seats.
The building is used from September to July, requiring heating in the winter and cooling in the summer season. The HVAC system has had multiple HVAC systems deployed for decades. Four coolers remain operative; these are two water–air heat pumps with 195 kW of nominal capacity each for heating and cooling, and two water–water coolers with 350 kW each for extra cooling connected to two cooling towers. In the multi-HVAC model, each cooler and its associated equipment are an HVAC subsystem. The multi-HVAC system is supervised and operated with a commercial BMS that reads the temperatures from the sensors located all around and sets the instructions for the actuators for regulating the water or the air flow rates and the fluid temperature.
The diversity of cases of use makes the building HVAC operation difficult, and the supervision requires support from the engineering department. Figure 3 shows the working scenario where the supervision system is deployed.
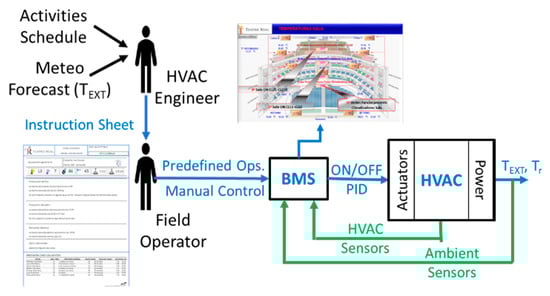
Figure 3.
Standard HVAC system operations in Teatro Real of Madrid.
The BMS samples 169 historical variables every 15 min, including the outdoor temperature, selected zone temperatures, power supply by transformers, thermal energy generated for each HVAC subsystem, their COP (coefficient of performance). Other query results stored by the BMS are a table with 45 additional temperatures from other building rooms every hour. The persistent database also contains a table with different variables read from different elements only during the shows and rehearsals from 69 sensors every 10 min. This is the data that feeds the first tasks of the supervisory system.
Figure 4 shows the ACODAT instantiation in the opera’s HVAC, where the ACODAT tasks embed into the BMS. Particularly, in Figure 4 is shown the BMS, which has our supervision system based on ACODAT. Additionally, there are two other components for the management of the multi-HVAC system. A controller for each HVAC subsystem that regulates its behavior using control loops and the optimizer that determines the ideal configuration of the multi-HVAC system (it determines the level of operation of each HAVC subsystem).
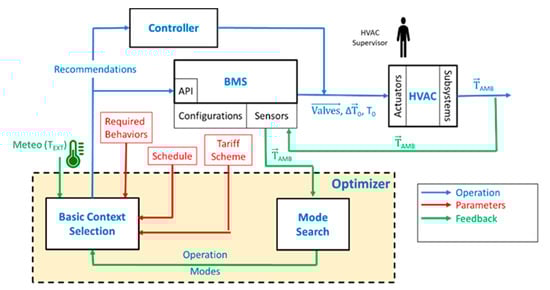
Figure 4.
ACODAT-based first integration.
Particularly, in a previous work has been introduced the autonomous management architecture of the multi-HVAC model based on ACODAT that sear to optimize the configuration of the HVAC subsystems in a given moment improve the energy efficiency and costs, and other work that proposes a fuzzy-based control method for HVAC [4], which can be incorporated in the management system. This study is a continuation of the previous research and introduces the concept of ACODAT for the supervision of building multi-HVAC systems.
The following values are chosen from each HVAC subsystem for the experiment:
- Fluid- specific heat capacity in subsystem j: ;
- Refrigerant fluid density in subsystem j: ;
- Maximum electrical power consumed in subsystem j: ;
- Maximum temperature provided with subsystem j: ;
- Thermal capacity of subsystem j: .
Some of them are normally given by the manufacturer in the technical specifications under standard working conditions and specifically, for the two heat pumps and the two water–water coolers in the Teatro Real of Madrid, Table 5 shows the information.
Table 5.
Cooler characteristics obtained from user manuals.
The ACODAT-based supervisory system use in this experiment the historical data in the BMS’ database to capture value deviations in the HVAC system’ components, such as the performance degradation of each subsystem. The ACODAT does not require different training sessions because the data analysis tasks can implement continuous learning that could be discretionally calibrated with mid-term context-based information, such as seasonal ones. Particularly, the dataset used has information of different periods about the year.
The software of the experiment was implemented in Python on Jupyter (IPython Project, open-source software, Atlanta, USA): Python 3.7.3 (Mar 27, 2019, 17:13:21), IPython 7.4.0. The libraries used for the study are: pandas, numpy, matplotlib.pyplot, sklearn (metrics: pairwise_distances, model_selection: train_test_split, cluster: KMeans, mpl_toolkits.mplot3d: Axes3D, apriori: apyori).
4.2. Instantiation of ACODAT
This section instantiates ACODAT in every phase of the supervision of the Teatro Real’s multi-HVAC system.
4.2.1. Task 1: Preparation of the Data.
The HVAC system is made up of 4 coolers that bring together pumps, cooling towers and other elements in 4 HVAC subsystems, called: ‘Grupo Frio 1′ (cold group 1), ‘Grupo Frio 2′ (cold group 2), ‘Bomba Calor Carlos’ (Charles heat pump) and ‘Bomba Calor Felipe’ (Philip heat pump). The data extraction process is simple and just requires collection and understanding. The collection is carried out on a database made of several tables that are the result of pre-existing queries over some chosen variables with different sampling rates and events. The most significant table reads the assigned sensors every 15 min and the information was taken over several years some selection of numerical variables read from sensors deployed in the HVAC system and its context.
Target Variable Selection
For data understanding, the target variables/features for FDD are identified and unnecessary ones are removed. In Teatro Real, the example takes the performance of each subsystem, ‘COP’ and ‘potency’ (consumed energy) as target variables. New variables may be generated for evaluation when needed, and in this case, it was necessary to calculate a new variable for each subsystem, ‘Thermal Power’ (thermal capacity).
Feature Relevance analysis
Features are ranked with random forest Classifier, for providing a good view of their significance. Figure 5 shows the features-relevance ranking for the target variable ‘COP cold group 1′. Figure 5 is an example of the “influence” of each variable (feature) on one of the target variables, the ‘COP cold group 1′. For example, the variable ‘potency cold group 1′ has the highest influence on this target variable. The variables shown in Figure 5 are the sensed from the different sensors in the multi-HVAC system about the 4 coolers (thermal potency, potency, output temperature in the coolers and water entry to the towers, among others). The score of all the variables adds up to (100%), so they have a greater weight if they are the most important. It is similarly determined for each target variable, in order to determine the relationship with the rest of the variables, information used to build the knowledge models in the second data analysis task 2.
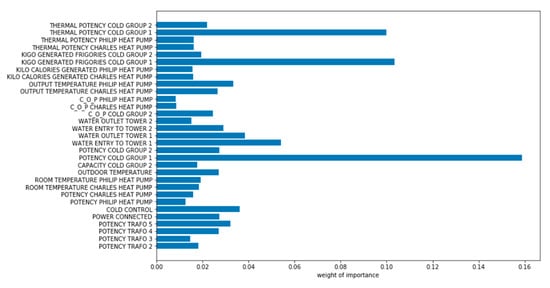
Figure 5.
Influence of the variables in the variable ‘COP cold group 1′.
Statistical analysis
This task uses statistics to analyze the central values of the variables, getting a better understanding of the variables’ behavior, in order to improve the data quality by taking out the outliers. Table 6 shows a partial table with the statistical metrics of some variables. The variables shown in Table 6 correspond to the Charles heat pump (potency, COP, kilocalories generated, input and output temperature in the coolers, among others). With this information of each variable (mean, maximal and minimum values, first, second and third quartile, among other measures), different studies can be done to determine if it is necessary to normalize the variables, detect outliers, among other things. For example, we can detect an outlier if that value is more than 1.5 times distant from the first or third quartile—between these values, it would be considered normal.
Table 6.
Partial table with some statistic values of some HVAC system variables.
Data Cleaning
The information obtained from the statistical analysis leads to discover the outliers with the classical interquartile range (IQR) and minimize the number of false positives in ulterior fault detection. The outliers are in distances beyond 1.5 times the IQR, i.e., in Q1—1.5 * IQR or Q3 + 1.5 * IQR. In addition, repeated variables and null or zero values are eliminated, as they are unnecessary.
Correlation Analysis
After the statistical analysis and data cleaning processes, the variables are correlated using the classical Pearson’s correlation coefficient, which quantifies the linear distance between two variables [35]. This provides an approximate view of the dependency level between each pair of variables. Figure 6 depicts with colors, ranging from yellow to dark blue for positive and inverse correlations, respectively. Only independent variables are considered. These independent variables are used in order to analyze the target variables of the supervision model, to determine with what independent variables it is related. This information is used to build the knowledge models in the second data analysis task 2.
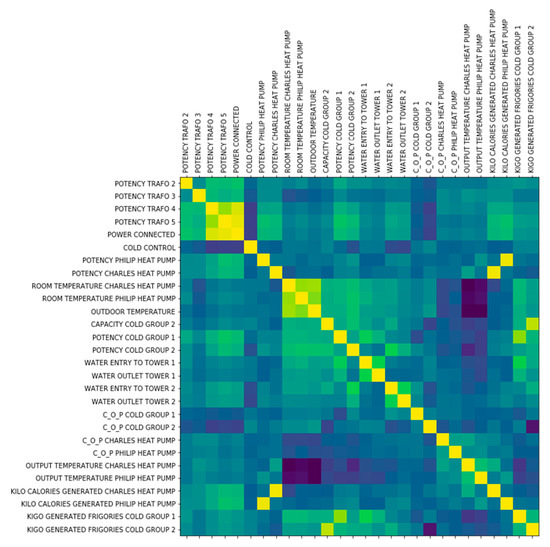
Figure 6.
Pearson’s correlation coefficient for the variables of the case study.
4.2.2. Task 2: Detection of Failures
For the case study, the target variable selected was the COP and the knowledge model to detect failures is a predictive model. Thus, the algorithms used were MLP (multilayer perceptron), K-NN (K-nearest neighbor) and gradient boosting. The MLP regressor predicts the subsystem’s behavior with a configurable MLP, such as the number of neurons, layers or activation functions. The K-NN regressor assigns values with the vote of the plurality of its k “nearest neighbors” in the training set. The gradient boosting regressor belongs to the family of ensemble algorithms that combines several weak predictive models (weak learners)—normally decision trees—to create stronger predictive models. Table 7 shows the performance of each algorithm predicting the COP of the 4 coolers in the Teatro Real.
Table 7.
Quality of the algorithms used to predict the variable COP.
Based on these results, the K-NN regressor was selected as the predicting model for variables COP, because it reaches the highest accuracy and the lowest MSE (mean squared error). The performance is similar in the other HVAC subsystems.
For predicting ‘potency’, a random forest regressor is also compared with the other 2 models that were evaluated for the COP. random forest regressor is an ensemble of learning methods for classification and regression, which bags multiple decision trees diced from the dataset and combines the obtained results. The combination uses average techniques, like weighted average, majority vote or normal average. Table 8 shows the quality metrics of the variable “potency” for the HVAC subsystems.
Table 8.
Quality of the data model algorithms used to predict the variable potency.
Random forest regressor performs better than the other models to predict the ‘potency’ in terms of accuracy and MSE. The results are similar for every HVAC subsystem.
4.2.3. Task 3: Diagnosis of Failures
In this case study, the diagnostic model used is based on a clustering approach. The centroid of each cluster is analyzed to extract the knowledge about the pattern of the fault, in order to diagnose the fault. The clustering algorithm is the K-means and the metric to measure the consistency within the clusters of data, the silhouette coefficient. The elbow method allows finding out the appropriate number of clusters to discover knowledge from the data. The algorithm was tested with a different number of clusters, as shown in Figure 7. The higher the coefficient is, the better defined the clusters are. The score goes from −1, for wrong clustering results, to +1, for highly dense clustering, and the intermediate scores around zero indicate that clusters are overlapped.
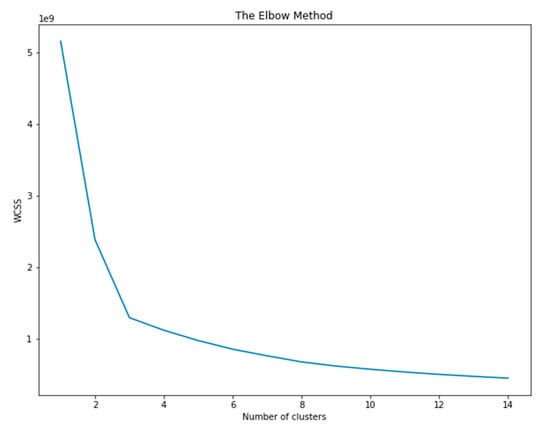
Figure 7.
Elbow method used during the clustering problem to test the different numbers of clusters.
Table 9 shows the application of the elbow method from 2 to 5 clusters in the case study, concluding that the best number of clusters is 3. The value of K has a relationship with the number of faults that can be detected using this dataset. With the elbow method, is detected the number of faults (clusters) that can be analyzed with this dataset, because it contains information about them (their centroids). The analysis of the information in each centroid must be carried out by experts to understand the type of faults (pipes or ducts blocked, engine overheating, valve problems).
Table 9.
Silhouette Coefficient obtained for different number of clusters applied to one single HVAC subsystem.
5. Results: Supervisory Dashboard
This Section describes the last task of the autonomous cycle that displays a dashboard, where the actual data stream is steadily monitored with its corresponding expected ranges. The dashboard also includes another gauge, a watchdog for notifying the failures and their possible causes.
The data analysis tasks of the autonomous cycle all work at once, so that the knowledge models interact with each other with the common objectives. The autonomous cycle cleans and transforming the data assisted with statistical analysis in Task 1, preparing it for the next tasks. Task 2 assesses the best algorithm among K-NN, RF (random forest), MLP and gradient boosting for predicting the ‘COP’ and ‘potency’ variables. Once the algorithm is chosen, the data stream coming from the HVAC subsystems is parsed through the predicting model. Thus, the stream is monitored and triggers the next data when detects a deviation that could be a potential failure. When a potential failure is detected, the next task analyzes the possible causes with the K-means clustering algorithm, which classifies it into one of the possible clusters learned from the data. The centroids are analyzed to define the cause and diagnosis.
5.1. Multi-HVAC System: Overall, Status
The overall picture of the system is depicted in a grid of boxes that display the actual real-time values of the target variables from each system. Figure 8 is a screenshot of the developed system, with the ‘COP’ and ‘potency’ of the four coolers of the Teatro Real’s HVAC. The gray color of the blocks and light gray of the text indicate ‘normal condition’.
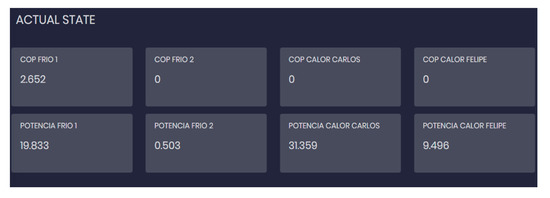
Figure 8.
Real-time value of variables ‘COP’ and ‘potency’ of each cooler.
5.2. Variables: Time–Domain Evolution
The time evolution of the monitored variables is also visible on the dashboard. Figure 9 is a screenshot depicting the last 10 samples of the ‘COP’ and ‘potency’ of coolers 1 and 2 of the Teatro Real, along with a standard interpolation curve that allows an intuitive interpretation of the current subsystems’ operation. The dispersion graphic shows both the actual values read from the sensors and the predicted values.
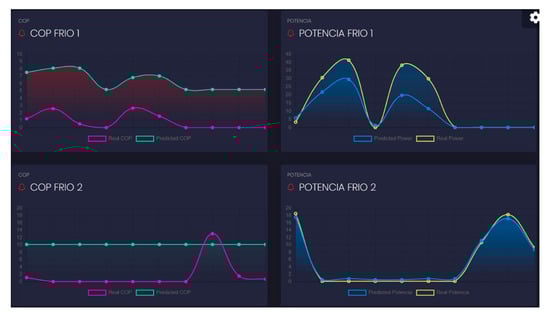
Figure 9.
Time–domain evolution of variables ‘COP’ and ‘potency’ for coolers 1 and 2.
The picture shows the differences between the observed and the predicted values, which will be compared with the data-calibrated threshold for deciding or not to raise an event to the next task.
5.3. Clustering of Detected Events
In the data stream coming from the subsystems, suddenly a problem is detected in one of them due to an abnormal difference between the observed and predicted values. For example, supposing the reported problem corresponds to the variable ‘potency’ of ‘cold group 1′, the data are sent to the clustering analysis to get a diagnosis. Figure 10 is a screenshot of the read variables, showing the block corresponding to the compromised behavior (‘potency cold group 1′) in dark pink and white text.
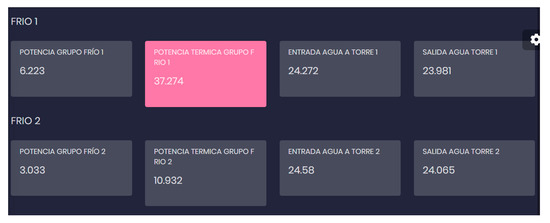
Figure 10.
An example with an abnormal value highlighted.
5.4. Failure Notification
The clustering analyzes the abnormal values and generate alarms or alerts, describing the issue and pointing to its possible cause/diagnosis. Figure 11 is a screenshot of the notification window, where it is possible to detect the reported alarm coming from ‘potency cold group 1′, with basic textboxes indicating which problem is, the possible cause and the suggested actions.
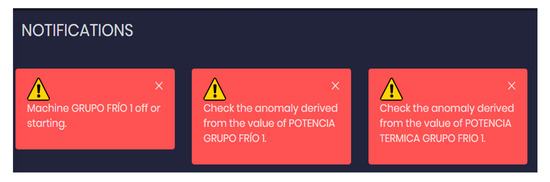
Figure 11.
An example of the diagnosis.
5.5. Case Study Performance
This section evaluates the performance of the proposed ACODAT-based supervisory module under different exception scenarios, where the context information varies, or the real-time data stream coming from the HVAC system can be changed to simulate standard failures and also unexpected situations, such as the visit of a dignitary to the Teatro Real. The goal is to analyze the capability of the system to properly detect these exceptions, and thus, the metric is the right decision on known abnormal situations.
The context is defined by the outdoor weather, the number of visitors in the opera building or the current indoor temperature. The possible abnormalities are bounded in the experiment according to the following environmental conditions (EC):
- (1)
- Extreme weather conditions;
- (2)
- Visit of dignitaries;
- (3)
- Excessive energy consumption rises;
- (4)
- A combination of 1 and 3.
The other combinations are not analyzed, because condition 2 is the most important in these cases. In the case of the abnormal situations, it is considered the failure of one or two of the HVACs systems. The experiment has trialed 30 iterations of the four environmental conditions with random failures in 1 subsystem, and another 30 with random failures in 2 subsystems. The obtained results are shown in Table 10.
Table 10.
Results of the simulations.
Success decision rate ranges from 81% in EC 4 & 2 HVACs (2 faults in extreme weather and energy excess) to 97% in EC 2 & 1 HVACs (1 fault in the visit of dignitaries), thus, the difference is 16% between the two. Comparing ECs averages, EC 2 outperforms the average 6% (92%), followed by EC 1 (89%), EC 3 (84%) and EC 4 (83%). With regard to the number of faults discovered, 1 HVAC is 8% better (90%) than 2 HVAC (83%).
In general, the data-driven models of ACODAT for supervision are not much affected by the environmental conditions, because these variables are used for the calculation of the cost of the deployment of the configuration of HVAC subsystems, and not in the diagnosis of the current situation (the centroid of our clustering model determines the current operational state of the HVAC system of the opera and is based in the variables of the HVAC subsystems).
6. Comparison with other Works
In this section, we compare our approach with similar works. This is a qualitative comparison (see Table 11), where the next criteria are considered:
Table 11.
Comparison with other works.
- (a)
- The approach is based on the autonomous paradigm for the self-supervision process;
- (b)
- The approach considers the integration of several machine learning approaches for the supervision;
- (c)
- The approach is easily adaptable and extensible;
- (d)
- The approach considers different aspects for a correct supervision: detection, diagnosis, among others.
The authors of [2] present a method of evaluation of diagnostic information systems in district heating efficiency supervision based on exploring the evolution of the information system and analyzing its dynamic features. They use data mining in the data acquired from district heating substations’ energy meters to provide the automated discovery of the diagnostic knowledge base necessary for the efficient supervision of district heating-supplied buildings. The implemented algorithm consists of several steps, including preparation, segmentation, aggregation and knowledge discovery stage, where classes of abstract models representing the energy efficiency constitute an information system representing diagnostic knowledge about the energy efficiency of buildings favorably operating under similar climate conditions and supplied from the same district heating network. The study [3] enables the supervision of buildings by the use of semantic technologies. They define an information base that describes the main physical and conceptual building elements, their characteristics and interrelationships, as well as the constraints that apply to them. Additionally, they define a logical framework based on the rules, which allows describing any domain as a set of facts, a set of rules and a set of constraints.
The focus of [23] is to develop a generic FDD scheme for centrifugal coolers and also to develop a nominal data-driven model of the cooler that can predict the system response under new loading conditions. They use support vector machines, principal component analysis and partial least squares like the fault classification techniques; and a genetic algorithm-based approach to select a sensor suite for maximum diagnosability and also evaluated the performance of selected classification procedures with the optimized sensor suite. The study [26] describes a dynamic, machine learning-based technique for detecting faults in commercial air handling units. It is an automated fault detection and diagnostics tool to be used by the building energy systems. The authors of [32,35] present analytical methods embodied within useful software tools to quickly identify and evaluate selected building system faults that cause large building energy inefficiencies. As a first step to developing this general framework for fault detection, first-order faults such as simultaneous heating and cooling and imbalanced airflows within several large air-handling units were targeted.
Our approach proposes an autonomous cycle of tasks for the self-supervision of a process, which integrates several machine learning approaches for the different aspects to be considered during the supervision: detection, diagnosis, among others. The main finding of this work is that it is necessary to integrate a set of data analysis tasks, to achieve a better performance of the system in its supervision task. This integrative scheme is effective, to consider the complexities of the problem, at the level of data extraction and preparation, its use to understand what is happening, and finally, make decisions. Autonomous cycles naturally manage and integrate those aspects, simplifying the development of robust solutions.
As a final comment, we have shown the application of the concept of autonomous cycles of data analysis tasks for the supervision of multi-HVAC systems. We have studied its behavior in different scenarios, and its adaptability to the context. Something to highlight is that this system is quite flexible, since it can incorporate more data analysis tasks to make a deeper study of the supervision problem, if required, as well as update the implementation of the analysis tasks with new approaches or techniques.
7. Conclusions
This study proposes a novel supervisory module for the management of building HVAC systems. The work brings data-based ACODAT concept from other fields and applies it to a multi-HVAC model, for the building HVAC management. The ACODAT concept was successfully proven in telecommunications [6], Education with smart classroom [7,8], but it is still unknown in HVAC management [1].
Thanks to ACODAT, the supervisory scheme is capable to detect faults and degradations in the HVAC subsystems and notify the diagnosis of unknown events. The ACODAT tasks are based on several ML techniques that work together with common goals—failure detection and diagnosis- that are autonomously achieved.
The proposed autonomic cycle was proven with real data from the BMS that operates the HVAC installations of the Teatro Real of Madrid (Spain). The HVAC System of this building is heterogeneous, which has been deployed along several decades, making the scenario very appropriate for extending the results to other scenarios.
The results with real data show the ability of the proposed supervisory scheme to detect and differentiate among several environmental conditions, potential failures coming from different abnormal values in the monitored variables. A success rate of 87% on average is promising, as the tasks considered in the experiment are simplistic and, in the future, can be more focalized to specific problems of the HVAC subsystems.
The second objective of this study of proving that the ACODAT supervisory scheme provides a novel detection approach in the buildings. In addition to the flexibility of selecting the most appropriate algorithms and model configurations, the ACODAT supervisory scheme can be re-trained in real time becoming increasing adapted to the supervised system and improving its predicting accuracy. The real-time training will improve the accuracy of the diagnosis.
A future work will extend this supervisory scheme based on ACODAT for other types of buildings, such as public buildings, commercial malls, museums, etc. Other future work is extended the current dataset with information about more faults, in order to extend the capability of our system to diagnose a bigger number of faults. In addition, other future works will incorporate meta-learning approaches to autonomously update the knowledge models of the cycle or other sources of knowledge, such as the SBOnto [12,36] or the BOnSAI [37] ontologies, which describe the domain of knowledge in smart buildings. A final work will study the integration of the scheme with existing BMS standards aiming to optimize and effectively control the HVAC systems, which is an essential requirement of smart buildings.
Author Contributions
Conceptualization, J.A., A.G.-J. and J.G.-P.; methodology, J.A. and J.G.d.M.; software, D.A., A.A., F.M. and C.W.; validation, J.A., D.A., A.A., F.M., C.W. and A.G.-J.; investigation, J.A., J.G.-P., J.G.d.M. and A.G.-J.; resources, J.G.d.M.; data curation, D.A., A.A., F.M., C.W. and A.G.-J.; writing, J.A., D.A., A.A., F.M., C.W. and A.G.-J.; visualization, D.A., A.A., F.M., and C.W.; funding acquisition, J.G.d.M. All authors have read and agreed to the published version of the manuscript.
Funding
The authors wish to acknowledge for the financial support from the Universidad de Alcala, for the work reported in this paper.
Conflicts of Interest
The authors declare no conflict of interest.
Acronyms
| ACODAT | autonomic cycle of data analysis tasks |
| AFD | automatic fault detection |
| AI | artificial intelligence |
| ANFIS | adaptive neuro-fuzzy inference system |
| ANN | artificial neural networks |
| ARIMA | autoregressive integrated moving average |
| ARMAX | autoregressive-moving average with exogenous variables |
| ARX | autoregressive with exogenous inputs |
| BAS | building automation system |
| BEMS | building energy management system |
| BMS | building management system |
| EC | environmental conditions |
| COP | coefficient of performance |
| DBN | dynamic Bayesian networks |
| FAN | fuzzy adaptive network |
| FDD | fault detection and diagnosis |
| FFBP | feed forward back propagation |
| FL | fuzzy logic |
| GA | genetic algorithms |
| HMM | hidden Markov models |
| HVAC | heating, ventilation and air conditioning |
| IQR | interquartile range |
| K-NN | K-nearest neighbor |
| LAMDA | learning algorithm for multivariant data analysis |
| MAPE-K | monitors, analyze, plan and execute—knowledge base |
| MARL | multi-agent reinforcement learning |
| MAS | multi-agent system |
| MDP | Markov decision process |
| MIMO | multiple input and multiple output variables |
| ML | machine learning |
| MLP | multilayer perceptron |
| MORL | multi-objective reinforced learning |
| MSE | mean squared error |
| MTL | multi-task learning |
| NNARX | neural network autoregressive with exogenous inputs |
| PID | proportional integral derivative control |
| POMPD | partially observable Markov decision process |
| RBF | radial basis function |
| RL | reinforced learning |
| SISO | single input and single output variables |
| TL | transfer learning |
| TS | Takagi–Sugeno fuzzy model |
| WCSS | within cluster sum of squares |
References
- Aguilar, J.; Garces-Jimenez, A.; Gallego-Salvador, N.; De Mesa, J.A.G.; Gomez-Pulido, J.M.; Garcia-Tejedor, A.J.; Garcis-Jiminez, A.; De Mesa, J.G.; Garcma-Tejedor, A. Autonomic Management Architecture for Multi-HVAC Systems in Smart Buildings. IEEE Access 2019, 7, 123402–123415. [Google Scholar] [CrossRef]
- Kiluk, S. Diagnostic information system dynamics in the evaluation of machine learning algorithms for the supervision of energy efficiency of district heating-supplied buildings. Energy Convers. Manag. 2017, 150, 904–913. [Google Scholar] [CrossRef]
- Tamani, N.; Ahvar, S.; Santos, G.; Istasse, B.; Praça, I.; Brun, P.-E.; Ghamri, Y.; Crespi, N.; Becue, A. Rule-Based Model for Smart Building Supervision and Management. In Proceedings of the 2018 IEEE International Conference on Services Computing (SCC), San Francisco, CA, USA, 2–7 July 2018; pp. 9–16. [Google Scholar]
- Escobar, L.M.; Aguilar, J.; Garcés-Jiménez, A.; De Mesa, J.A.G.; Gómez-Pulido, J.M.; Morales, L. Advanced Fuzzy-Logic-Based Context-Driven Control for HVAC Management Systems in Buildings. IEEE Access 2020, 8, 16111–16126. [Google Scholar] [CrossRef]
- Aguilar, J.; Sanchez, M.; Cordero, J.; Valdiviezo, P.; Guamán, L.R.B.; Chamba-Eras, L. Learning analytics tasks as services in smart classrooms. Univers. Access Inf. Soc. 2017, 17, 693–709. [Google Scholar] [CrossRef]
- Morales, L.; Ouedraogo, C.A.; Aguilar, J.; Chassot, C.; Medjiah, S.; Drira, K. Experimental comparison of the diagnostic capabilities of classification and clustering algorithms for the QoS management in an autonomic IoT platform. Serv. Oriented Comput. Appl. 2019, 13, 199–219. [Google Scholar] [CrossRef]
- Aguilar, J.; Cordero, J.; Buendía, O. Specification of the Autonomic Cycles of Learning Analytic Tasks for a Smart Classroom. J. Educ. Comput. Res. 2017, 56, 866–891. [Google Scholar] [CrossRef]
- González-Eras, A.; Buendia, O.; Aguilar, J.; Cordero, J.; Rodriguez, T.; Peñalvo, F.J.G.; Lagos-Ortiz, K.; Alcaraz-Mármol, G.; Del Cioppo, J.; Vera-Lucio, N.; et al. Competences as Services in the Autonomic Cycles of Learning Analytic Tasks for a Smart Classroom. In International Conference on Technologies and Innovation; Springer: Cham, Switzerland, 2017; pp. 211–226. [Google Scholar]
- Lopez, C.P.; Santorum, M.; Aguilar, J. Autonomous Cycles of Collaborative Processes for Integration Based on Industry 4.0. In Information Technology and Systems; Rocha, A., Ferrás, C., Paredes, M., Eds.; Springer: Berlin, Germany, 2019; pp. 1771–1786. [Google Scholar]
- Vizcarrondo, J.; Aguilar, J.; Exposito, E.; Subias, A. MAPE-K as a service-oriented architecture. IEEE Lat. Am. Trans. 2017, 15, 1163–1175. [Google Scholar] [CrossRef]
- Snoonian, D. Smart buildings. IEEE Spectr. 2003, 40, 182–183. [Google Scholar] [CrossRef]
- Žáček, M.; Janošek, M. SBOnto: Ontology of Smart Building. Far East J. Electron. Commun. 2017, 17, 1101–1109. [Google Scholar] [CrossRef]
- Khatib, H. IEA World Energy Outlook 2011—A comment. Energy Policy 2012, 48, 737–743. [Google Scholar] [CrossRef]
- Minoli, D.; Sohraby, K.; Occhiogrosso, B. IoT Considerations, Requirements, and Architectures for Smart Buildings—Energy Optimization and Next-Generation Building Management Systems. IEEE Internet Things J. 2017, 4, 269–283. [Google Scholar] [CrossRef]
- Staff. Global Revenue for Energy Efficiency Commercial Building Retrofits Is Expected to Exceed $100 Billion in 2025, According to Navigant Research. Available online: https://www.businesswire.com/news/home/20160714005110/en/Global-Revenue-Energy-Efficiency-Commercial-Building-Retrofits (accessed on 10 April 2020).
- Mohamed, N.; Al-Jaroodi, J.; Lazarova-Molnar, S. Energy Cloud: Services for Smart Buildings. In Sustainable Cloud and Energy Services; Springer Science and Business Media LLC: Berlin, Germany, 2017; pp. 117–134. [Google Scholar]
- ASHRAE. ASHRAE Handbook–HVAC Applications; American Society of Heating, Refrigerating and AIR-Conditioning Engineers, Inc.: Atlanta, GA, USA, 2003. [Google Scholar]
- Reynolds, J.; Rezgui, Y.; Kwan, Y.; Piriou, S. A zone-level, building energy optimisation combining an articial neural network, a genetic algorithm, and model predictive control. Energy 2018, 151, 729–739. [Google Scholar] [CrossRef]
- Wang, F.; Yoshida, H.; Ono, E. Methodology for optimizing the operation of heating/cooling plants with multi-heat-source equipments. Energy Build. 2009, 41, 416–425. [Google Scholar] [CrossRef]
- Foteinos, V.; Kelaidonis, D.; Poulios, G.; Vlacheas, P.; Stavroulaki, V.; Demestichas, P. Cognitive Management for the Internet of Things: A Framework for Enabling Autonomous Applications. IEEE Veh. Technol. Mag. 2013, 8, 90–99. [Google Scholar] [CrossRef]
- Organisation for Economic Co-Operation and Development. No. 192. In OECD Digital Economy Papers; Organisation for Economic Co-Operation and Development (OECD): Paris, France, 2010. [Google Scholar]
- Kephart, J.; Chess, D. The vision of autonomic computing. Computer 2003, 36, 41–50. [Google Scholar] [CrossRef]
- Namburu, S.M.; Azam, M.S.; Luo, J.; Choi, K.; Pattipati, K.R. Data-Driven Modeling, Fault Diagnosis and Optimal Sensor Selection for HVAC Chillers. IEEE Trans. Autom. Sci. Eng. 2007, 4, 469–473. [Google Scholar] [CrossRef]
- Bravo, C.; Aguilar, J.; Rivas, F. Diseño de una Arquitectura de Automatización Industrial basada en Sistemas Multi-agentes. Ciencia e Ingeniería 2004, 25, 75–88. [Google Scholar]
- Araujo, M.; Aguilar, J.; Aponte, H. Fault detection system in gas lift well based on artificial immune system. In Proceedings of the International Joint Conference on Neural Networks, Portland, OR, USA, 20–24 July 2003; Volume 3, pp. 1673–1677. [Google Scholar] [CrossRef]
- Wall, J.; Guo, Y.; Li, J.; West, S. A Dynamic Machine Learning-based Technique for Automated Fault Detection in HVAC Systems. ASHRAE Trans. 2011, 117, 449–456. [Google Scholar]
- Lo, C.; Chan, P.; Wong, Y.; Rad, A.B.; Cheung, K. Fuzzy-genetic algorithm for automatic fault detection in HVAC systems. Appl. Soft Comput. 2007, 7, 554–560. [Google Scholar] [CrossRef]
- Neto, A.H.; Fiorelli, F.A.S. Comparison between detailed model simulation and artificial neural network for forecasting building energy consumption. Energy Build. 2008, 40, 2169–2176. [Google Scholar] [CrossRef]
- Aguilar, J. Definition of an energy function for the random neural to solve optimization problems. Neural Netw. 1998, 11, 7317–7337. [Google Scholar]
- Mason, K.; Grijalva, S. A review of reinforcement learning for autonomous building energy management. Comput. Electr. Eng. 2019, 78, 300–312. [Google Scholar] [CrossRef]
- Kim, W.; Katipamula, S. A review of fault detection and diagnostics methods for building systems. Sci. Technol. Built Environ. 2017, 24, 3–21. [Google Scholar] [CrossRef]
- Deshmukh, S.; Glicksman, L.; Norford, L. Case study results: Fault detection in air-handling units in buildings. Adv. Build. Energy Res. 2018, 1–17. [Google Scholar] [CrossRef]
- Lai, C.S.; Tao, Y.; Xu, F.; Ng, W.W.; Jia, Y.; Yuan, H.; Huang, C.; Lai, L.L.; Xu, Z.; Locatelli, G.; et al. A robust correlation analysis framework for imbalanced and dichotomous data with uncertainty. Inf. Sci. 2019, 470, 58–77. [Google Scholar] [CrossRef]
- Cakir, F.; He, K.; Xia, X.; Kulis, B.; Sclaroff, S. Deep Metric Learning to Rank. In Proceedings of the 2019 IEEE/CVF Conference on Computer Vision and Pattern Recognition (CVPR); Institute of Electrical and Electronics Engineers (IEEE): Los Alamitos, CA, USA, 2019; pp. 1861–1870. [Google Scholar]
- Deshmukh, S.; Samouhos, S.; Glicksman, L.; Norford, L. Fault detection in commercial building VAV AHU: A case study of an academic building. Energy Build. 2019, 201, 163–173. [Google Scholar] [CrossRef]
- Žáček, M. Knowledge formalization of intelligent building. In AIP Conference Proceedings; AIP Publishing LLC: Melville, NY, USA, 2016; Volume 1738, p. 120005. [Google Scholar]
- Stavropoulos, T.G.; Vrakas, D.; Vlachava, D.; Bassiliades, N. BOnSAI: A smart building ontology for ambient intelligence. In Proceedings of the 2nd International Conference on Web Intelligence, Mining and Semantics, Craiova, Romania, 13–15 June 2012; pp. 11–12. [Google Scholar]


© 2020 by the authors. Licensee MDPI, Basel, Switzerland. This article is an open access article distributed under the terms and conditions of the Creative Commons Attribution (CC BY) license (http://creativecommons.org/licenses/by/4.0/).