1. Introduction
Modern day diesel injection systems usually consist of a high-pressure fuel pump, and common rail and fast-response diesel injectors. The combination of high injection pressure, fine nozzle holes and fast injector actuation enables the precise control of multiple fuel injection events within one cycle. Injection timing, quantity and fuel distribution are all key factors for an ideal combustion process. Effective efficiency improvement and in-cylinder emission reduction can be achieved simultaneously by optimizing fuel injections [
1,
2,
3,
4].
However, with such a high level of fuel injection precision, deviation from the ideal fuel injection could have major influences. Relatively consistent fuel injection characteristics through the lifespan of the engine are critical to maintain a good engine performance and restricted emissions.
Faulty or aged injectors can impact the spray patterns and combustion process, leading to reduced efficiency, power loss and high emissions, etc. [
5] Injector faults and injection related engine faults are the most common problems in diesel engines. Some common injector problems are: (1) clogged nozzle holes; (2) injector needle and control valve stiction; (3) eroded/worn injector nozzles; (4) injector needle actuation related opening/closing/leaking problems and faulty solenoids.
The formation of deposits and the influences of injector deposits on fuel injection are the most studied topics among injector problems. A primary and commonly agreed indication of injector fouling is a reduced flow rate and associated power loss [
6,
7]. Deposits built up on the injector tip can reduce the spray cone angle and disrupt the atomization [
8,
9]. The spray penetration speed and length usually decrease as well [
10,
11,
12]. However, the deposits’ effects on the spray penetration might depend on the fuel properties, the form of the deposits and the injector geometry, since a longer spray penetration is found when coking occurs in some gasoline direct injection research [
6,
9,
13]. Cylinder-to-cylinder and cycle-to-cycle variations due to asymmetric spray patterns are usually increased as well.
Consequently, emissions are also affected by the disturbed sprays. While the HC and NOx emissions are often marginally influenced, the soot emissions show significant increases when the injector is coked, due to degraded air-fuel mixing [
9,
11].
Few studies about the influences of nozzle erosion on sprays can be found in the literature. Most of them are cavitation-related numerical research studies on erosion-induced geometry damage, affecting the discharge rate and the flow field [
14,
15,
16]. A nozzle hole with erosion is locally widened and rough surfaces are formed due to material loss, which can cause a reduced discharge rate, narrower spray cone angle and shorter spray penetration by increased turbulence in these areas.
The injector needle motion is another important factor that can affect the fuel injection, especially during the lifting and closing phases. The needle oscillation is found to have a certain impact on the internal flow dynamics. The off-axis motion at low and medium lift positions has a direct impact on the mass flow rate and hole-to-hole variations [
17,
18]. Needle bouncing during the closing stage is confirmed to be a major cause of after-injection (fuel dribbles). An increase of the needle valve spring stiffness or an increase of the gap between the needle and the nozzle body can worsen the needle bouncing problem [
19]. In addition to the after-injection problem, leakage can also be caused by needle tip wear [
20].
In addition to the analysis of the various physical influences of aging components, control strategies which focus on identifying and compensating for the aging effects of injectors are also studied in several research studies [
21,
22,
23]. Such efforts on the research of injector aging all serve the same purpose: ensuring an ideal fuel injection to achieve high efficiency, low emissions and low noise.
One of the targets of optimizing the fuel injection is soot reduction. Soot has been a research focus in past decades. Both its toxicity to health and impact on the environment have been revealed [
24,
25] and in-cylinder soot processes have been extensively studied in compression ignition engines [
26]. In addition to the evolution of the fuel injection systems and the after-treatment system, oxygenated fuels are also considered to have clear soot reduction effects compared with non-oxygenated fuels [
27,
28]. Among many candidates, tripropylene-glycol monomethyl ether (TPGME, C
10H
22O
4) shows good performance [
27,
29].
A recent study conducted on a light-duty diesel engine at our laboratories found that a set of aged injectors yielded higher flow rates than a set of new injectors, when using the same injection strategies and injection pressure [
30]. It was hypothesized that the geometry and/or the needle actuation could be the major causes of the phenomenon, while the presence of deposits were less likely. However, the spray formation of these injectors and combustion process remains unknown. Hence, a more detailed in-cylinder investigation is carried out in this study to explain the observation. It was also found that the TPGME, as a soot reducer additive, works well, even in an environment with excessive oxygen, but its impact on the combustion process, especially the in-cylinder soot formation and oxidation, remains to be revealed.
Previous research about injector aging has mostly focused on deposits and their effects on sprays. Few studies are found regarding the needle actuation. None of them have done so in optical diesel engines with real-world multiple injection strategies. The link between the aging effects, the spray formation and soot in the combustion processes is not revealed.
In this work, optical diagnostics are performed to trace the difference between the aged and the new injectors in real-world part-load operating conditions. The main purpose is to establish an experimental approach which is able to identify different aging problems and their effects on fuel injection and combustion processes.
X-ray tomography is performed first to investigate the internal nozzle geometry of the injectors. After this, the liquid fuel spray development is studied using high-speed Mie scattering imaging. Finally, the natural luminosity is imaged to investigate the influences of different injectors and the effects of the TPGME additive.
This work will also provide a basis for a combined laser induced incandescence (LII) and laser extinction measurements of in-cylinder soot processes with these injectors and additive in the future.
2. Materials and Methods
2.1. Optical Engine Set-Up
The high-speed imaging experiments are conducted on a single-cylinder light-duty Volvo diesel engine. The design of this optical engine is illustrated in
Figure 1. The construction of the engine applies a Bowditch design [
31], maintaining the stock engine block, crank shaft and pistons as a base. A single cylinder head which contains identical valve and intake systems to the stock engine is specially built. A quartz liner holds four quartz windows, providing optical access from the side in four directions of the combustion chamber. The quartz piston is mounted on a piston extension, which is connected with the stock piston in the engine block. The geometry of the quartz piston is identical to the stock piston, to ensure a realistic flow field in the cylinder. A mirror reflects the light passing down through the quartz piston and provides a bottom view of the combustion chamber. The quartz material is non-crystalline fused silica, which provides high transmission in the (ultraviolet) UV region. Some of the key dimensions of the engine are shown in
Table 1.
The engine is equipped with an external intake system which contains two compressors and a heater. One compressor takes ambient air from the test cell and the other takes EGR gas from an external diesel burner. The gases are mixed to obtain the required oxygen concentration in the final mixture. A minimum level of around 5% oxygen is achievable. Combustion is suppressed at this low oxygen level, avoiding any flame luminosity that could disturb the spray imaging.
The injectors tested are the Denso G4S solenoid injectors. One is from a new batch (only used for brief tests) and one is from an aged batch (after over 100,000 km of usage). In a previous reference test, it was found that the aged injectors deliver significantly more fuel when using the same injection strategy and the difference between the new and the aged set is bigger than the difference between the individuals in the same set. In this work, one aged injector that shows the most substantial difference is selected.
Despite the fact that the geometric compression ratio is lower than that in a stock multi-cylinder engine (13.5 vs. 15.8), the geometry of the combustion chamber and intake manifold should create a realistic in-cylinder flow field, similar to that in a stock engine. The high-pressure fuel system equipped on the optical engine is the same as that on a stock engine, to ensure similar fuel injections.
2.2. Operating Points and Fuels
Two reference points are adapted from [
32]. They both implement two pilot injections, one main injection and one post injection, which represent real-world part-load operating conditions in light-duty vehicles. The operating conditions are summarized in
Table 2. Similar TDC (top dead center) conditions to a stock engine can be achieved by adjusting the intake temperature and pressure, to compensate the lower compression ratio in the optical engine. Due to the limitation of the strength of the optical parts, severe temperature gradient should be avoided. Thus, the engine is operated in skip-fire mode. There are nine motored cycles after one combustion cycle. The amount residual gases could be different, since a real engine runs continuously. The wall temperature could be different from a stock engine condition, due to different heat transfer rate, due to materials difference. However, since we only focus on comparative investigations of injectors, these differences are considered insignificant and should not affect the comparison of the fuel injection and combustion processes.
Two fuels are tested in this work. One is a baseline reference diesel CEC RF-79-07. It does not contain any additives or FAME, making it ideal for additive testing. The other fuel is a blend of the baseline fuel and a 5% by volume of soot reducer (tripropylene-glycol methyl ether, TPGME, C
10H
22O
4). Thus, the blend has a calculated 1.54 weight percentage of oxygen, assuming that there is no oxygen in the baseline fuel. The TPGME additive has similar physical properties to diesel, despite its slightly higher density. This means that it can be blended with regular diesel without changing much of the overall physical properties. Two of the most notable difference in the chemical properties are: (1) a higher flash point at 121 °C; (2) a lower net heating value compared with diesel at around 43 MJ/kg. Some of the measured fuel properties provided by the supplier are listed in
Table 3.
2.3. Optical Set-Up
Mie scattering is used to study the spray formation in a non-reacting environment. This technique is based on elastic scattering of light from particles or droplets that have a diameter similar to or larger than the wavelength of the incident light. The Mie signal is proportional to the square of the particle/droplet diameter, meaning that it is suitable for characterizing initial liquid phase sprays [
33]. A 452 nm continuous wave laser diode is used as the incident light source. The laser is aimed directly at one of the side windows. With two cylindrical lenses shaping the laser, it covers the entire entrance of the window. The purpose is to make the incident light as even as possible at the entrance. Because of the shape of the side window and the bowl shape of the piston, the laser light is heavily distorted by refraction before encountering the spray near TDC. Strong reflection is also observed from the cylinder head. To minimize this interference, graphite spray is applied to the cylinder head.
The camera used is a Photron FASTCAM SA5. It has a monochrome sensor which can capture 12-bit uncompressed data. The recording speed is set at 25,000 fps, with a shutter time of 39,754 ns. The resolution is 512 × 512 pixels, which is the maximum setting at this speed. A 100 mm focal length, f/2 fixed aperture B. Halle lens is used for imaging. A band-pass 452 nm (±22 nm) filter is placed in front of the objective lens.
Natural luminosity (NL) imaging is performed to characterize the general features of the combustion process. Diesel combustion emits high intensity thermal radiation. Thus, in addition to the 452 nm bandpass filter, ND05 and ND07 filters are used for reducing the NL at low load and at medium load, respectively, to prevent sensor saturation. The rest of the optical set-up remains the same as the set-up for the spray imaging. The ND factors are multiplied to the recorded signals to retrieve the original ones.
A grid image with 2 × 2 mm squares is used for the focusing adjustment of the camera. It is attached on top of the optical piston. Then, the piston is cranked to 5 CAD (crank angle degree) after TDC, which is approximately in the middle of the injection events. When the piston is close to the TDC position, a couple of degrees of movement does not affect the focusing significantly, since the piston only travels a short distance. For the NL imaging, it is difficult to get a good focus in the late cycle when the piston is moving away from the TDC. This is not considered problematic, however, as only the soot luminosity is of importance in the late cycle in this comparative work.
2.4. X-Ray Tomography
There are several methods to obtain the internal geometry of the injector nozzles. The 3D nozzle hole dimensions can be obtained by using silicone molding [
34]. However, this method is limited to the nozzle region. For 2D imaging, optical microscopy can provide direct visualization of the orifice exit, while phase-contrast X-ray imaging can reveal the internal structure very well. Phase-contrast can also be coupled with high speed imaging to determine the needle motions [
35].
Moreover, 3D X-ray tomography can characterize the internal 3D shape very well and it has been used for extracting the internal structure of fuel injectors [
35,
36,
37]. The principle can be found in [
38]. In this work, X-ray tomography is performed using a ZEISS Xradia 520 3D X-ray microscope. A maximum X-ray source voltage of 160 kV and a power of 10 W are used for the dense metal material on the injectors. Approximately 5 mm of the nozzle tip region is scanned, in which the nozzle holes and a certain part of the needle tip and the needle seat surface are covered in the imaging. The voxels are set to cubic with 8 microns, meaning there is an 8-micron distance between two neighboring slices and the pixels in each slice are square with 8-micron sides. Around 680 slices are acquired for each case. Then, a 3D reconstruction is performed using the slices of the tomography results in the 3D Slicer software. Since the material density of the injector nozzle tip and the needle are different, the different levels of X-ray absorption lead to different intensities in the tomography images. The geometry of these two components can thus be extracted by a proper thresholding. Finally, the surface conditions of the nozzle orifices, needles and needle seats can be observed through the reconstructed surfaces.
2.5. Natural Luminosity Analysis
Before diving into the analysis of the natural luminosity (NL) of the combustion progresses, the major factors that can influence the NL signal are discussed briefly, to clarify the interpretation of the signals in this work. The NL luminosity mainly consists of soot incandescence and chemiluminescence. In a diesel combustion mode, soot incandescence is a strong broadband thermal radiation from hydrocarbon combustion, while chemiluminescence is a weaker, narrowband non-thermal radiation, mostly emitted by gaseous intermediate combustion products. The NL is mainly dependent on soot volume fraction and soot temperature and can therefore be used as a qualitative indicator in the combustion analysis. It is difficult to use NL as a quantitative soot diagnostic because there are many interferences [
39]: (1) interference from chemiluminescence; (2) soot particle size, spectral emittance, refractive index, and temperature; (3) quantum efficiency and linearity of the detection systems; (4) adiabatic flame temperature; (5) in-cylinder temperature; (6) spatial distribution of luminous soot; (7) optical thickness effects.
The chemiluminescence emission is usually in the 300 to 600 nm region and often much weaker than the soot luminosity [
39]. Additionally, the 452 nm bandpass filter can effectively block most of the typical chemiluminescence emissions, such as OH*, CH* and C2* [
40]. Thus, the chemiluminescence contribution can be neglected in this work.
The use of different ND filters at each load point ensures there is no saturation of the camera sensor in the measurement. Although the linearity of the camera response is not verified, it is assumed to be linear in this work. An investigation of the same model camera in [
41] shows good linear response of the sensor. The wavelength-dependent quantum efficiency of the camera is also neglected, since no intensifier is used and the narrow-band incoming signals after the band-pass filter.
The difference of adiabatic flame temperature between the two fuels can also be considered negligible, as the SR fuel only contains a limited amount of additive. The fuel property change is thereby small, and the overall air-fuel ratio is not affected when comparing the fuels.
The difference in the optical thickness needs to be considered in line-of-sight measurement. Any medium between the signal source and the detection system that can absorb and/or scatter the radiation affects the recorded results. If a flame is thick, the burning soot signal on the far side from the camera is attenuated when it passes the flame, while the soot on the close side is not affected.
3. Results and Discussion
3.1. Injector Geometry Analysis
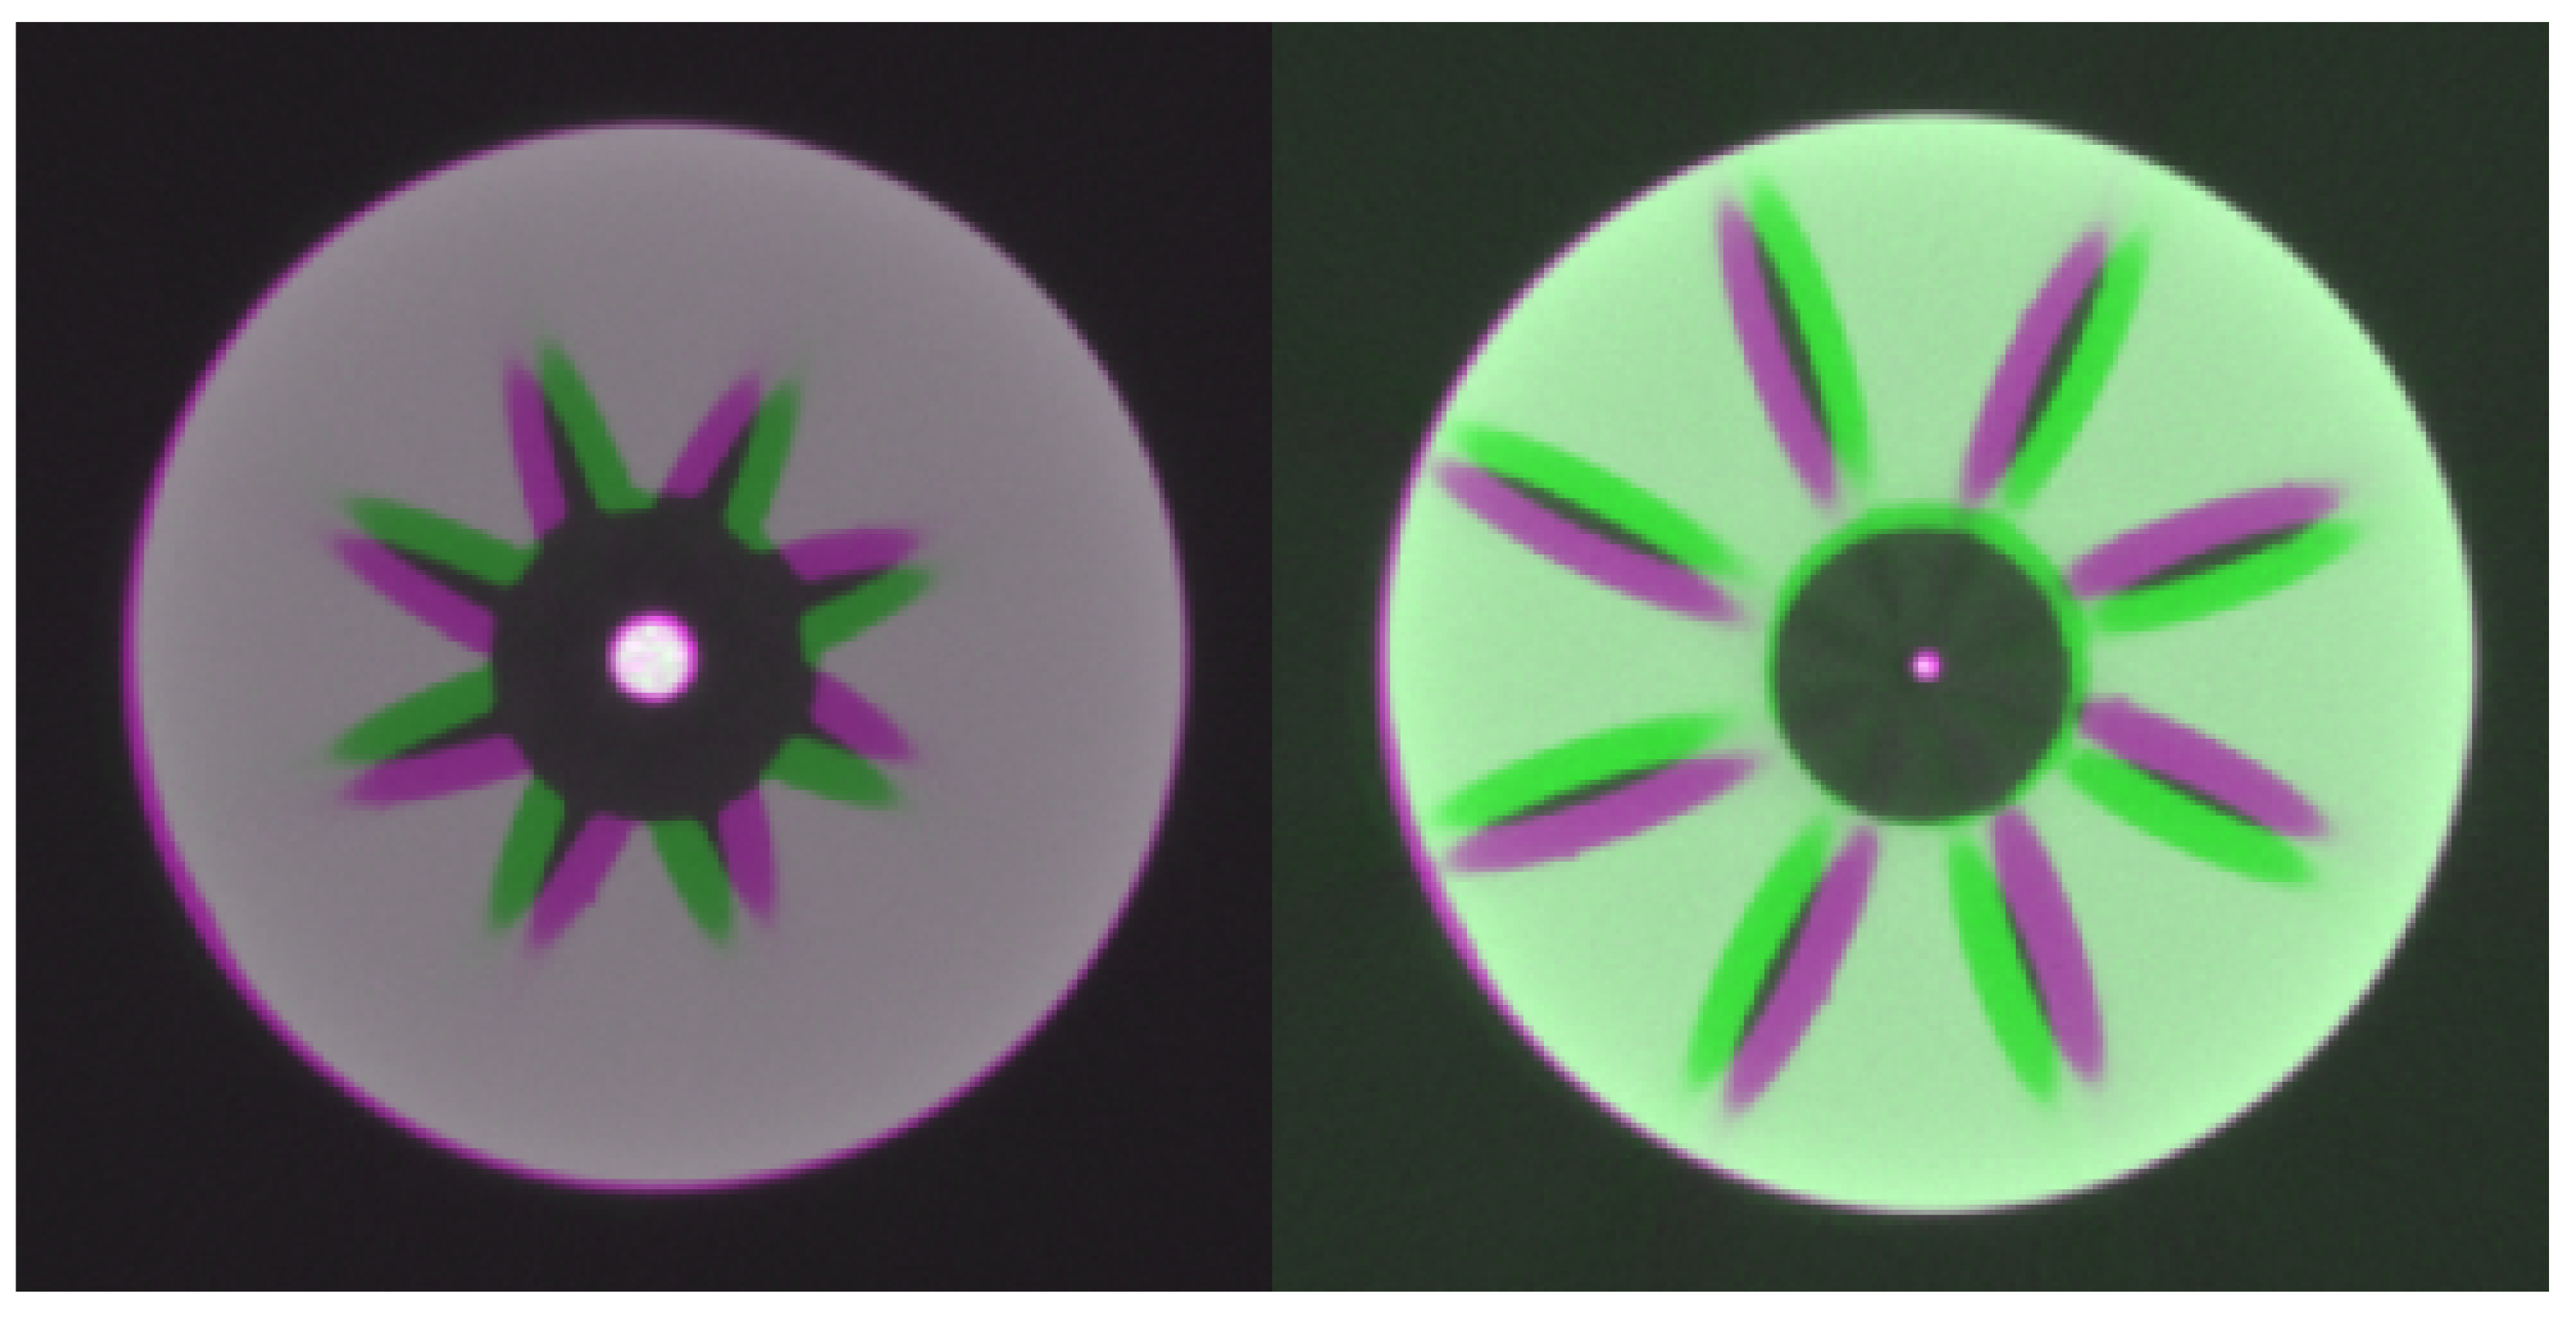
Figure 2 and
Figure 3 show the cross-sections (subplot a) and the reconstructed 3D surfaces of the nozzles (subplot b) and the needle tip areas (subplot c and d) of the new and the aged injector, respectively. The cross-section figures are directly obtained from the tomography and the surfaces are reconstructed from the cross-section slices.
It can be noted that all orifice surfaces are smooth, as well as the transition area from the sac volume to the nozzle channel. The needle tips and the needle seat surfaces show a good match without any gap.
Figure 4 shows an overlapped cross-section view comparison at different positions in the nozzles, from both the new and the aged injectors. It demonstrates that the geometry is similar in both injectors. Despite some small variation, most likely caused by manufacturing tolerance, there is no substantial geometry difference. Thus, it can be concluded that the nozzle geometry of the aged injector does not explain the increased fuel injection quantity. The spray pattern is also unlikely to be affected. The hypotheses of deposits or nozzle wearing can be thus eliminated.
Spray Analysis
A detailed image processing procedure can be found in
Appendix A. The spray measurements are conducted in non-reacting conditions to avoid interferences from combustion. Fifteen cycles are recorded at each operating point. After the image processing, the results are averaged, and the standard deviations are calculated.
3.2. Injection Quantity
The total intensity in the region of interest (ROI) is calculated by just summing the signal in all the pixels in an image. Although there is some background noise, the scattering signal is generally much stronger. Thus, the addition of the noise is considered negligible. The results at low load and medium load are shown in
Figure 5 and
Figure 6, respectively. At low load, all four injections show an approximately Gaussian intensity profile, meaning that the fuel injection is mostly in a transient condition (i.e., the needle does not reach its fully open position). The scattering signal from the aged injector is significantly higher, especially during the two pilot injections. This supports the previous observation that the aged injectors deliver more fuel than the new ones do, as the higher signal indicates that more liquid fuel is present in the cylinder.
At medium load, the main injections show a top-hat profile, which means that the needles are fully lifted and the fuel injection reaches a quasi-steady state. The peak scattering values during the main injection are similar for both injectors, meaning that the discharge rates when the needle is fully lifted are similar for the two injectors. The fact that the integrated signal does not increase, despite the ongoing fuel injection during this period, indicates that the fuel injection rate equals the evaporation rate. Note that although this total scattering signal can be used as an indicator of the fuel quantity, the actual amount of fuel is not directly proportional to the scattering signal, due to the occurrence of multiple scattering.
By calculating the time derivatives of the total scattering signals, the scattering intensity change rate is obtained, which is shown in
Figure 7 and
Figure 8 for the low and medium load cases, respectively. The instants where the change rate starts to increase above zero are very close for both injectors, which means that the delay between the injection signal and the actual fuel injection is similar (approximately 0.32 ms, 2.3 CAD at 1200 rpm). The fuel injection pressure at different load points does not affect this delay time. The response of the needle in the lifting stage is thus similar. However, there is a time gap between the instants where the scattering signals start to decrease (the derivative goes from positive to negative). Since the ambient conditions are similar, the liquid fuel length cannot be affected considerably by different evaporation rates. It is most likely that the needle closing is having a lag with the aged injector, especially during the main injection. This therefore seems to be the main reason why the aged injector shows a higher injection quantity. If the delay between the closing command signal and the actual needle closing is constant, the percentual increase will be larger for a short injection than for a longer.
A close look at the nozzle area after the fuel injection events, especially the pilot injections, shows that there is more fuel dribbling after injections from the aged injector. An example is shown in
Figure 9 and
Figure 10 for the new and the aged injector at medium load, respectively. The near nozzle area of the new injector shows small fuel dribbles from one orifice, while there are five obvious fuel dribbles from the aged injector. These dribbles contribute to the fuel flow difference between the injectors. They are induced by the evacuating fuel flow right after the needle closing, which means the dribbling process is primarily governed by the needle closing speed and not the injection velocity [
42]. It is also pointed out that the injection pressure plays an insignificant role if the needle closing speed is the same [
42]. Whether the dribbling is caused by severe needle bouncing in the end of injection requires further investigation.
3.3. Spray Penetration Length
The spray length is calculated by sampling the pixel intensity along the spray axis to obtain an intensity-position curve. A threshold of 5% of the maximum intensity is applied to obtain the spray length. Finally, an actual distance can be calculated by multiplying the spatial resolution with the pixel count.
Figure 11 and
Figure 12 present the spray penetration at low load and medium load, respectively. The liquid spray length in the pilot injections from the aged injector is significantly longer than that from the new injector, mainly due to the prolonged injection duration. In the main injection, both liquid lengths can approximately reach the bowl wall and thus their maximum penetration distances are inherently limited. Large cycle-to-cycle variation can be observed in the main injection at medium load, because of spray tip fluctuations caused by turbulence. In that case, the fuel injection rate is equal to the evaporation rate. Since the hot air is mainly entrained upstream and the liquid fuel is mostly evaporated downstream, the liquid fuel droplets close to the spray tip are highly sensitive to turbulence, leading to larger fluctuations.
3.4. Spray Penetration Speed
The fuel spray penetration speed during the injection can be derived by calculating the time derivatives of the liquid spray lengths.
Figure 13 shows the results at low load and
Figure 14 shows the results at medium load. No significant penetration speed difference can be found between the two injectors in the main injection events. This matches what is observed in the total intensity change rate, where the needle response during the lifting stage is similar between the two injectors. Due to the limited time resolution of the imaging system, the liquid spray may have travelled a different distance between the first image, with clear scattering signals and its previous frame. This leads to a relatively large variation in the initial spray speed estimation. In the later liquid spray development phase, both the mean values and the standard deviations are close.
3.5. Fuel Spray Spreading Angle
The spray spreading angle is a function of the ratio of the fuel and the ambient gas density, orifice geometry parameters and the effects of the injector needle and tip design on flow through the orifice [
43]. The spray spreading angle and the general spray morphology can be used as indicators for identifying problems such as asymmetric sprays or large shot-to-shot variations. There are different ways of defining the spray spreading angle [
44]. For comparing the spray morphology between the two injectors, the spray width is calculated at different locations. The intensities on axes perpendicular to the spray axis are sampled at different downstream locations. Pixels on each axis that have higher intensities than 5% of the maximum are counted as the spray width at this position. A frame of a fully developed spray during the main injections is selected for the width estimation. Then, the average of all measured cycles is calculated.
The results are shown in
Figure 15 and
Figure 16 for low load and medium load case, respectively. Generally, the spray widths are very similar between the injectors at both load points. There is strong reflection at around 7 to 8 mm downstream of the injector nozzle during the measurement of the new injector, leading to a large overestimation of the spray width. The standard deviation increases with the increasing distance from the nozzle. As the atomization of the liquid spray increases downstream the nozzle, multiple scattering increases. This can cause overestimated spray widths and the influences forming turbulence in the far end are increased, which generates a larger fluctuation. No consistent asymmetric spray patterns are observed. Thus, the conclusion is drawn that the air entrainment rates during the injections are similar for both injectors, since both the liquid spray penetration and spray spreading angles are similar.
3.6. Combustion Analysis
Figure 17 shows a sequence of NL images, while
Figure 18 shows the corresponding cylinder pressure, heat release, and the spatially integrated NL signals. The first soot luminosity appears at around 3 CAD, with weak and unevenly distributed signals (see
Figure 17). These arise from soot luminosity in the rich premixed pilot combustion. Just after 7 CAD, the main injection occurs and the cool fuel jets are injected into the combusting areas, getting ignited by the heat released in the pilot combustion. Eight individual reacting plumes are formed and the integrated NL increases sharply to a peak just after 10 CAD (see
Figure 18).
As the piston goes down, a small part of the combusting products expand into the squish volume, while the majority gets redirected along the bowl wall towards the center of the piston. The soot oxidation continues while the combined effects of diffusion and post injection help redistribute the unoxidized soot more evenly in the cylinder. After the short post injection, the second NL peak occurs at around 19 CAD, as the added heat release from the post injection increases the temperature again (see
Figure 17). The momentum of the injection also boosts the mixing of unoxidized soot and oxygen. This peak is most likely contributed by the mixing of the remaining oxygen in the central area which is not previously consumed. After this peak point, the signal has a fast decay, since most soot is oxidized (see
Figure 18).
As can be seen in
Figure 17, all three cases at low load show a similar in-cylinder process. The integrated intensity is very close when comparing the fuels for the new injector. On the other hand, the aged injector shows a significantly stronger soot luminosity during the entire combustion process (see
Figure 18). This could simply be caused by the difference in the fuel quantity, which elevates both soot volume fraction and in-cylinder temperature. It is more obvious at the second NL peak when the soot clouds get redirected into the center and more oxygen is entrained for further oxidation. Because of the elevated temperature, there is a larger soot oxidation window. Thus, the NL signal observed with the aged injector continues its decay to the later parts of the cycle.
At medium load, rich premixed combustion appears more clearly just after the second pilot injection at around 5 CAD (see
Figure 19) while the very first NL signal starts at around 3 CAD when the first pilot injection is ignited (see
Figure 20). These are the soot particles from the second pilot injection being oxidized. They keep travelling towards the bowl boundary and growing larger until about 8 CAD, as evidenced by the increasing signals. Then, the main injection starts. This time, the cool fuel jets shoot into the already reacting products and lead to a small reduction in the NL by partially quenching the reactants, as shown in
Figure 19, at around 9.6 CAD.
The fuel jets from the main injection get ignited quickly, which leads to the sharp increase of the main combustion heat release just after 10 CAD (see
Figure 20). The main combustion heat release still appears to be highly premixed. When the reacting jets reach the bowl wall, they impinge on it until the end of the main injection. During this time, soot particles may not have sufficient temperature to be oxidized due to heat losses to the wall. The wall also limits the access to oxygen, which limits the oxidation rate and leads to a decreased temperature. Cold soot is driven and redirected by the fuel injection towards the central area. The NL only starts to climb sharply after 15 CAD and peaks at around 22 CAD (see
Figure 20). The peak NL is higher at the medium load when using the new injector, with the SR fuel being the highest. The aged injector shows the lowest NL, but it still has a longer decay time. Compared with the low load case, the soot is more evenly distributed in the cylinder volume after the main injection (see
Figure 19).
One possible reason for this is that the aged injector’s longer injection duration provides both a higher fuel quantity and more momentum exchange, which provides a better mixing and higher temperature. The initial heat release from the aged injector’s pilot combustion is significantly higher than that from the new injector, leading to a slightly advanced ignition of the main injection. Thus, the overall combustion process of the aged injector tends to be more even and prompt. Less soot is formed thanks to the improved mixing, and hence, less soot luminosity is shown in the late cycle. Another possible reason is that there is in fact more soot formed by the aged injector, due to the higher fuel quantity injected. A thicker cool soot cloud along to the bowl wall could be formed due to heat loss and restricted oxygen access, leading to significantly attenuated NL signals in the imaging plane. The total soot luminosity could be higher because of a slightly higher temperature and increased soot volume fraction. However, in this case, the difference of the optical thickness between the combustion cases becomes too large to provide a proper estimation of the soot volume fraction.
As for the fuel comparison, the SR fuel gives a stronger NL signal compared with the baseline fuel, indicating either that more soot is formed in the early stages, or that the soot temperature in the late cycle is boosted by the added oxygen in the fuel. It is noteworthy that the integrated NL intensity might be different for broadband signal collection, since relatively cold soot emits much less. Only high temperature burning soot is then observed in the images, while the size and volume fraction of cold soot particles remains unknown. Moreover, as the piston goes down during the expansion stroke, the temperature decreases fast and the remaining cooled soot is not visible anymore.
4. Conclusions
In this work, the effects of injector aging on the spray formation and combustion are studied using optical diagnostics, where one new injector and one aged injector are compared. The combustion process of the TPGME soot reducer is also investigated against a baseline reference fuel.
An X-ray tomography of the injectors eliminates the hypothesis that the aging leads to significant geometric differences in the injector nozzle and needle areas. The high-speed Mie-scattering imaging of fuel injection under non-reacting conditions demonstrates that the liquid sprays from both injectors are even and symmetric. The liquid fuel penetration and jet spreading angles are also similar. However, the aged injector shows a longer injection duration when using the same injection strategy, as well as more fuel dribbling after the injection. This means that the needle actuation of the aged injector is behaving differently in the close stage, which is considered as the main reason of the fuel quantity difference between the two injectors.
Natural luminosity imaging of the combustion processes reveals differences in the in-cylinder soot processes. At low load, the difference in fuel quantity dominates the total luminosity signal. More soot is formed with more fuel and the oxidation also lasts longer, with a longer high temperature window. No significant difference is observed between the two fuels. At medium load, the TPGME fuel shows stronger soot luminosity than the base fuel, while the aged injector using base fuel gives the lowest. Enhanced mixing and higher temperature lead to an overall prompter combustion, which restricts the time for soot formation, while the oxidation rate is boosted drastically. The strong soot luminosity from the SR fuel might be caused by a higher soot volume fraction or elevated temperature, due to the oxygen content.
This work will be followed by combined measurements using laser induced incandescence and laser extinction, for further clarifying the late cycle oxidation process of the soot.

 ,
, 


