Abstract
The primary objective of the research was to compare the viscosity parameters of the same viscosity grade engine oils, as declared by the manufacturers, to the actual laboratory measurements. The secondary objective was to briefly investigate (1) what kind of information oil manufacturers provide in the product data sheets of the studied oils, and (2) the potential savings resulting from the use of the energy efficient oils. The study material consisted of 42 selected synthetic engine oils that belong to the 5W-30 viscosity grade. Stabinger SVM 3001 viscometer was used to determine kinematic viscosity at −20 °C, 40 °C, 100 °C and 130 °C. The HTHS (high temperature high shear), CCS (cold cranking simulator), FTIR (Fourier-transform infrared spectroscopy) and GC (Gas Chromatography) measurements were also performed for the samples that had the lowest and the highest kinematic viscosity. Large differences (5–25%) between oil producers’ declarations and the results of laboratory tests were found. Although all of the engine oils tested met the 5W-30 grade standards, the high variability of viscosity measurements needs to be reported. The difference between the oil with the highest and the oil with the lowest kinematic viscosity at −20 °C was 11,804 mm2/s. The outlying temperature-related viscosity profiles were recovered using Mahalanobis distances which identified 16 out of 42 analyzed oil samples as atypical.
1. Introduction
A variety of chemical compositions and properties, a very large number of commercial types of products, a multitude of normative documents issued by various organizations, and a wide range of applications make the proper selection of lubricants for vehicles that are used by millions of people every day a challenging task [1,2,3]. Furthermore, within the same oil group (e.g., synthetic oils), both cheaper hydrocracked oils (sometimes referred to as manufactured “in synthetic technology”) and much more expensive fully synthetic oils based on PAO (Polyalphaolefin) or esters are available [4]. Finally, combinations of letters and numbers that are found on the labels of all engine oils available on the market may be incomprehensible to people who do not know how to decipher technical abbreviations—mostly because basic knowledge is necessary to understand the terms related to engine oils [5]. When selecting an engine oil, several factors should be considered. Primarily engine oil should match the car model but also a high quality lubricant should be able to efficiently remove contaminations from the engine parts and provide protection against corrosion and wear [6]. Such properties may be expected from fully synthetic engine oils. The sales of synthetic oils have been steadily increasing in the past few years [7]. Oil producers respond to the growing demand by offering a wide range of oils, from flagship products based on the most advanced technologies and innovative solutions, down to the less technologically advanced ones. Faced with such a wide range of goods, consumers have a very complex buying decision to make.
Viscosity is a parameter that characterizes the flow resistance created by a fluid during movement. The viscosity of a liquid is a function of temperature and it decreases as the temperature goes up. This phenomenon is of great importance for lubricating oils and operating fluids. There is an optimal viscosity range for liquids used as lubricants for each technical system [8]. Increasing the viscosity through lowering the temperature leads to a negative outcome for the engine and potential functional losses while overcoming frictional resistance [9,10]. In extreme cases, increasing the viscosity of the lubricating fluid may prevent the machine from operating or damage some of its parts [11]. On the other hand, a decrease in viscosity as a result of an increase in the temperature of the lubricating liquid may lead to a decline in the thickness of the oil film (leakage) between the lubricated elements, and consequently to an increase in the wear of the mating surfaces or even engine seizure [12].
Viscosity is one of the most important properties of oils and it has a direct impact on the lubrication process [13]. When selecting the oil viscosity for a particular friction pair, two main aims must be taken into account in order to achieve smooth lubrication. These are: minimizing friction and creating a permanent oil film [14]. From the point of view of optimal lubrication of machines and devices, lubricating oils should slightly change their viscosity as the temperature changes, i.e., the viscosity change curve should have the smallest possible angle of inclination [15]. This facilitates starting at low temperatures, and at high temperatures ensures optimum lubrication through the durability of the oil film [10,16]. The dependence of viscosity changes on temperature is characterized by the viscosity index (VI). As a result of the aging process (polymerization, condensation) its value increases, whereas it decreases when the unburned fuel gets into the lubrication system [17,18,19].
Oil viscosity has an impact on the operation of an internal combustion engine, because [20,21,22] the maintenance of liquid friction and the reduction of wear of two mating surfaces strictly depend on viscosity—too low viscosity causes the loss of liquid friction, and leads to an increase in wear of the two elements. Furthermore, the amount of energy and losses to overcome friction depend on viscosity—high viscosity increases the energy needed to overcome friction. The efficiency of engine operation at low temperatures is also dependent on the viscosity—in winter conditions it is necessary to use oils that will have the lowest possible viscosity. Yet another variable is the degree of sealing the over-piston space in the cylinder—oils with higher viscosity have a better effect on the sealing. Viscosity also affects the amount of oil loss for combustion—low viscosity oil easily enters the combustion chamber. The last two factors are: efficient removal of impurities as they pass through the filters (the higher the viscosity, the easier blocking of the filter with impurities) and effective cooling of heated engine parts (low viscosity oils clean heated parts more efficiently, cooling the engine at the same time).
The SAE J300 classification (The Society of Automotive Engineers) describes the viscosity properties of multi-grade oils, which are widely used because they meet the requirements for both summer and winter oil grades—they are usually marked, for example, SAE 10W-30 or SAE 10W-40. Low viscosity “resource-conserving” oils have recently seen a sharp rise in popularity. These oils belong to the following viscosity grades: 5W-30, 0W-30, 0W-20. The subject of oil’s energy efficiency will be discussed more closely later in the article. One of the most frequently bought oil groups on the market is the 5W-30 viscosity grade. Oils of this class are to ensure both energy efficiency, due to low viscosity, as well as good engine starting conditions at low temperatures [5,23,24].
In addition to viscosity classification, performance classifications are equally important; it should be noted that in Europe the oil quality testing system of the ACEA (European Automobile Manufacturers’ Association) is widely applicable. It is the car manufacturer who determines the parameters that the oil must meet in order to fit a particular car model. The requirements can be formulated in two ways: by providing own standards (e.g., VW505.00) or by using the general ACEA system (e.g., ACEA A4/B3). Oils of different brands which meet the same standards can be considered similar [25].
Given the importance of the oil viscosity parameters, a thorough examination of available products reaching the same viscosity grade was made. Particular attention was devoted to the different viscosity levels. The main purpose of the study was to describe and compare the viscosity parameters of engine oils of the same viscosity grade. The HTHS (high temperature high shear), CCS (cold cranking simulator), FTIR (Fourier-transform infrared spectroscopy) and GC (Gas Chromatography) measurements were also performed for the samples that had the lowest and the highest kinematic viscosity. In addition, the paper explores manufacturers’ information practices regarding oil viscosity provided in the product data sheets as any differences in this area may pose an additional barrier for consumers in a fair comparison of products offered by different manufacturers. Moreover, the objective of the article was to briefly investigate potential savings resulting from the use of the energy efficient oils.
2. Materials and Methods
2.1. Materials
The study material consists of 42 synthetic 5W-30 engine oils that were selected for testing. This number represents about 15% of all available oils in the selected viscosity grade on the domestic market. They all came from the same distributor in Poland and were available commercially in an online store specializing in the sale of engine oils. The primary criterion for oil selection was the viscosity grade (5W-30). All oils had a synthetic base declared by the manufacturers, but in most cases it was not specified whether it was group IV or V according to API (American Petroleum Institute). The oils were dedicated to gasoline and diesel engines of passenger cars as well as light commercial vehicles. The oils included global brands as well as European, American and local ones. The price range of oils was quite wide. The minimum price per liter was about 4 euros/L, the maximum was 13 euros/L, while the median and average were around 7 euros/L. Oil samples tabulation according to manufacturers’ brands is presented in Table 1.

Table 1.
Number of oil samples collected from tested manufacturers.
The results of this study reflect the properties of engine oils that were obtained for testing in July 2018. These results do not refer to any subsequent manufacturer-made improvements of the tested oils or oils introduced to the market after the test. During the tests all of the examined engine oils were available on the market.
It should be noted that tested oils differed in API and ACEA quality classes or manufacturers’ approvals. However, due to the fact that the study focused on viscosity parameters, data on quality classes were not analyzed. To show the variety of quality classes in a group of oils of the same viscosity grade, Table 2 presents data collected from labels and safety data sheets for the oils tested. In most cases, the tested oils belonged to the following classes: ACEA C3, A5/B5, A3/B4, C2 or C4. The C3 quality class was the most numerous (23 samples). These oils are used in modern passenger cars and light commercial vehicles with both diesel and gasoline engines.
Table 2.
The number of oils in quality classes (European Automobile Manufacturers’ Association—ACEA, American Petroleum Institute—API).
2.2. Kinematic Viscosity
Kinematic viscosity was measured using Stabinger SVM 3001 viscometer (Anton Paar GmbH, Graz, Austria) which is widely used by laboratories controlling the quality of petroleum products, both at the production stage and after entering the market. The SVM viscometer operation is based on the modified Couette measurement principle. The measuring element consists of a density cell and a viscosity cell. Both measuring elements are closed in a thermostated chamber, where the temperature is maintained by a cascade Peltier element. The density cell consists of an oscillating U-tube placed in the immediate vicinity of the viscosity measurement cell. The viscosity measuring cell contains a tube that rotates at a constant speed and is filled with a fluid sample, while a measuring rotor with a built-in magnet floats freely in the sample. The shear forces the sample drive the rotor, while the magnetic forces delay its rotation. The dynamic viscosity is calculated from the rotor speed, after reaching equilibrium between the effect of the eddy current brake and the shear forces at work in the sample. The two different measurements occur simultaneously. Kinematic viscosity is automatically calculated based on dynamic viscosity and sample density. The construction of the measuring cell requires only small amounts (about 2 mL) for KV (kinematic viscosity) measurement. A single sample application enables assessment of dynamic viscosity and density at 40 °C and 100 °C, kinematic viscosity and viscosity index (according to American Society for Testing and Materials —ASTM D 2270, PN-C-04358:2019-11 and International Organization for Standardization—ISO 2909 procedures). Each measurement was performed in triplicate and the repeatability was ±0.35%. By using a highly efficient Peltier element in the apparatus, it is also possible to measure viscosity at other temperatures (0–135 °C), including sub-zero ones (−60–0 °C). Stabinger viscometer meets ASTM D7042, D4052 standards or similar.
Amongst the tested parameters are kinematic viscosity (KV) at −20 °C, 40 °C, 100 °C, 130 °C and the calculated viscosity index (VI).
For three parameters, i.e.: kinematic viscosity at 40 °C, kinematic viscosity at 100 °C, and the VI, the results were compared with the information taken from the manufacturers’ labels/product data sheets.
2.3. CCS and HTHS
The measurement of cranking viscosity at low temperatures was carried out on the Cold Cranking Simulator (CCS) in accordance with the ASTM D5293-15.
Measurement of HTHS (high temperature high shear—at a temperature of 150 °C and at a shear rate of 106 s−1) viscosity was carried out on Ravenfield viscometer with coaxial cones.
Both CCS and HTHS were used only for selected oils—those that set border (extreme) values in the analyzed groups of oils.
2.4. FTIR Analysis
The FTIR spectra were recorded on a Nicolet iS10 FT-IR sepctrometer (Thermo Fisher Scientific, Waltham, MA, USA). The spectra were acquired (32 scans per sample) in the range of 4000–650 cm−1. ZnSe window with a 0.1 mm spacer was used. All experiments were carried out at 22 °C.
2.5. Gas Chromatography (GC) Analysis
The gas chromatography (GC) method was used with the SIMDIS (Simulated Distillation) analyzer according to ASTM D-7169 standards using Agilent Technologies 7890B-GC (Santa Clara, CA, USA) equipped with a flame ionization detector (FID).
2.6. Statistical Analysis
To determine the presence of any atypical results or outliers the Mahalanobis distance (MD) was used , where x is the multivariate point (temperature-related viscosity profile) for which MD is calculated, μ is the center of the data set, and S is the covariance matrix. As the data has not followed a multivariate normal distribution, the so-called robust estimator (Minimum Covariance Determinant) of μ and S was used. The MD analysis was performed with the use of the R statistical software, version 3.6.1 [26].
3. Results and Discussion
3.1. Parameter Values Declared by the Manufacturer in Reference to the Parameter Values Measured in the Laboratory
Figure 1, Figure 2, Figure 3, Figure 4 and Figure 5 present the distributions of values of the tested parameters: kinematic viscosity at 40 °C, 100 °C, −20 °C and 130 °C as well as the viscosity index (VI). With the beginning kinematic viscosity at 40 °C, kinematic viscosity at 100 °C and the VI (Figure 1, Figure 2 and Figure 3) are analyzed as they are among the information provided by the manufactures. For those three parameters the results are compiled in such a way that on one side (on the left) there is information taken from the manufacturers’ labels/product data sheets, while on the other (on the right) there are results obtained from laboratory tests. To facilitate an easy interpretation of the results the data were divided into the clusters of oils which were the most similar to each other in terms of the analyzed parameter. The sample numbers (sample ID, Table 2) for which the manufacturer’s information on the viscosity level was not found were also included in the chart containing the manufacturers’ declared parameter values. Samples circled in red showed a difference of more than 5%, while samples marked with a black dotted circle at a level of 3–5%.
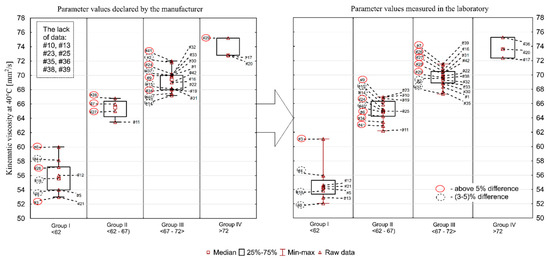
Figure 1.
Kinematic viscosity at 40 °C.

Figure 2.
Kinematic viscosity at 100 °C.

Figure 3.
The viscosity index of the engine oil samples tested.

Figure 4.
Kinematic viscosity of the engine oil samples tested at −20 °C.
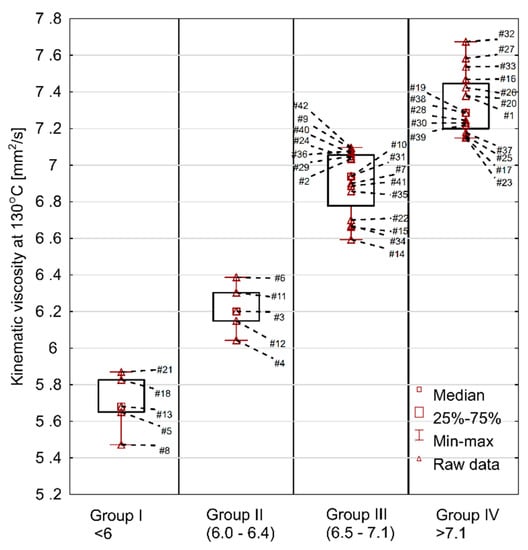
Figure 5.
Kinematic viscosity of fresh engine oils, measured at 130 °C.
Kinematic viscosity at 40 °C (declared by manufacturer/measured in the laboratory) was in the range of 53.0–75.2/52.0–75.3 mm2/s. The average value was 65.6/65.7 mm2/s, while the median was 68.0/67.1 mm2/s. The standard deviation was 6.45/6.04 mm2/s and the coefficient of variation was 9.8/9.2%. According to the current SAE J300_2015 standard, there is no min/max indication for kinematic viscosity at 40 °C. However, the majority of manufacturers declare viscosity values for this temperature in their safety data sheets. The summary of data declared by the manufacturers and the values determined in the laboratory tests are presented in Figure 1. A significant number of oils deviates from the values declared by the manufacturers. Thirteen oil samples had a higher value than the one declared, whereas 21 had a lower value (more details are given below). In eight cases the manufacturer’s declaration could not be found. Discrepancies at the level of up to 20% found between individual oils mean that the engine oil selected by a consumer may not fulfil the expected functions.
The aforementioned SAE J300 classification contains, however, guidelines (nominal range) for kinematic viscosity measured at 100 °C, and for oils of class 5W-30 it is a range of 9.3–12.5 mm2/s. It should be stated that all results of the laboratory testing fell within this range, because the min-max (declared by manufacturer/measured in the laboratory) range was 9.5–12.3/9.3–12.3 mm2/s. The average value was 11.4 mm2/s (for both), median 11.7 mm2/s (for both), standard deviation 0.9 mm2/s (for both), while the coefficient of variation was at 8%/7%. Similar to viscosity at 40 °C, a significant number of manufacturers declare viscosity at 100 °C in their product data sheets (only in five cases there was no such information available). A comparison of manufacturers’ declarations and the measured values in the laboratory is shown in Figure 2. As in the case of viscosity at 40 °C, the summary shows that a significant number of oils deviated from the values declared by the manufacturers: 18 oils had a higher value than the declared one, and 19 had a lower value (exact percentage difference are given below).
The largest discrepancies for kinematic viscosity at 100 °C were found for the following samples: #26 (measured value was 19% higher than the declared value), #27 (11% difference), #3 (10%), #7 (6%), #6 (4.7%), and #41 (4.3%). The situation was similar with regard to the discrepancies in kinematic viscosity measured at 40 °C. These were: #26 (24%), #27 (9%), #3 (15%), #7 (8%), #6 (7%), and #41 (13%), respectively. Viscosity may increase or decrease during use. An increase in viscosity is associated with progressive oxidation processes at elevated temperatures, and a decrease can be a consequence of oil dilution with fuel and/or shear polymers being added as oil viscosity modifiers. This means that a consumer choosing an oil from group I (#5, #8, #12, #13, #18, #21) may have to face its rapid exceedance in recommended viscosity grade, especially if a decrease in oil viscosity is observed during the engine operation. The situation is similar with oils from group IV, whose values are close to the upper limit value of 12.5 mm2/s. They may exceed the limit as a result of an increase in engine oil viscosity, e.g., due to oxidation processes. As it was shown by [27], the kinematic viscosity of engine oils used in “harsh” conditions increases by an average of about 10% after being in operation for 10,000 km. It was also indicated that the nature of viscosity changes depends on the oil formulation, i.e., the composition and technology used by the manufacturer.
The viscosity index (VI) is a dimensionless quantity characterizing the variability of oil viscosity changes as a function of temperature changes. The viscosity indexes of modern lubricating oils fall between 85 and 250. High numbers mean smaller changes in viscosity, whereas low values mean relatively large changes, which are not favorable for engine operation. The VI can be increased by adding special additives (high-molecular polymers) to oils. In recent years, the following polymers have been used most frequently: polymethacrylates, polyalkylstyrenes and polyisobutylenes. During operation, an increase or decrease in the VI may occur. The reduction of the oil viscosity index is the result of the shear of viscositors, oxidation or degradation under the influence of water, while the increase is connected to the progressive oxidation processes at elevated temperature. The comparison of manufacturers’ declarations (no information for seven oils) and the values measured in laboratory tests are shown in Figure 3. The range of obtained VI values was relatively wide. The minimum declared/measured value was 157 (in both), whereas the maximum was 175/182, the average (166/170) and median (164/171) were at different level. The coefficient of variation was 3.1%/2.8%, while the standard deviation was 5.2/4.7. Among all oils tested, 24 had a higher value than declared and 11 had lower. Different conclusions than in the case of the KV 40 and KV 100 were obtained for the VI. Here, the largest discrepancies were found in samples #37 and #41 (10%), #34 and #27 (7%), #24 (6%), and in #29, #2, #11 (5%).
3.2. Kinematic Viscosity at −20 °C and 130 °C
In addition to the comparison of the viscosity parameters provided by the manufacturers or resulting from the SAE J300 standard with the values from laboratory tests, it was also decided to explore the KV behavior at the sub-zero and above 100 °C. The kinematic viscosity measured at −20 °C is indirectly related to another very important parameter—structural viscosity (measured in the CCS apparatus—Cold Cranking Simulator), which determines engine starting ability at low temperatures [16,28]. A lower value of such viscosity corresponds to an easier start of the engine at low temperatures and means less load being put on the car battery.
The results of the test at −20 °C are shown in Figure 4. The oil samples tested were divided into four groups—nine oils in group I (<3000 mm2/s), 26 oils in group II (3000–4000 mm2/s) and four oils (#16, #28, #17, #11) in group III (>4000 mm2/s) and in group IV—oils were characterized by surprisingly high kinematic viscosity values (#3, #5 and #36) of 5049, 6513 and 13,931 mm2/s, respectively. A very large dispersion of the measurements was found mainly due to the sample #36 (the spread was on the level of 11,804 mm2/s). The second most extreme oil had a significantly lower viscosity readout (6513 mm2/s). The probability of selecting samples #3, #5 or #36 at random is 7%, nevertheless it is non-zero and may take place in practice causing problems for the user of such oil when starting the engine at extremely low temperatures. At the same time, it is worth to mention the oil #13 which was characterized by relatively low viscosity. Considering these two outlying oils, #13 and #36, it can be stated that when buying oil of the same viscosity grade, consumers may be faced with completely different oil behavior at low temperatures.
Another parameter that is not declared by manufacturers, although an important one from the point of view of engine operation, is the kinematic viscosity at 130 °C. The measurements at 130 °C are useful for the description of oil viscosity behavior at high temperatures. Preferably the change in viscosity when going from 100 °C to 130 °C should be small as this indicates oils with good performance properties.
The results of the test at 130 °C are shown in Figure 5. The min–max range was 5.5–7.7 mm2/s. The average value was 6.8 mm2/s, median 7.0 mm2/s, standard deviation 0.6 mm2/s, and the coefficient of variation was at 8.4%. Comparing the viscosity at 130 °C to the viscosity at 100 °C, it was discovered that the oils showed a decrease in their kinematic viscosity of 37–44% (average 40%). The lowest change was recorded for oil #32 and the highest for oil #22. At the same time, it should be stated that in the group of oils with the lowest viscosity change there were both low and high viscosity oils at 100 °C, which means that high viscosity at 100 °C does not necessarily entail that the oil will maintain high viscosity at 130 °C. This indicates the differences in the formulation of individual oils and the content of viscosity modifiers.
For two extreme results (#21 and #32) additional HTHS measurements (temperature ~150 °C and shear rate ~106 s−1) were performed. The lowest result was obtained for sample 8, while the volume of the oil sample necessary to perform the HTHS analysis resulted in sample 21 being analyzed, of which there was sufficient amount (all additional analyses absorbed large amounts of test material) to perform the analysis. The results were as follows: sample 21—3.02 mPa·s and sample 32—3.52 mPa·s. In his study [29], Wolak gives HTHS results of five different fresh engine oils and none of them were as low (3.02)/high (3.52) as those selected as bottom (extreme lowest value) and top (extreme highest value) oils in the current work. In the quoted article, the minimum HTHS was 3.1, while the maximum HTHS was 3.48. This means that with a high degree of probability the selected oils, despite the relatively high HTHS range, meet the requirements of SAE J300, which is defined as minimum 2.6 mPa·s. Interestingly enough, oil samples with the highest VI (oils #37 and #25) were not found in the group of oils with the lowest viscosity change in the temperature range 100–130 °C, obtaining a value of 40%. At the same time, the oil with the highest change of 44% (oil #32) had a value of VI = 170. These results show that the information on the viscosity index alone does not give complete information about the change in oil viscosity above 100 °C. It should also be considered that modern cars come with the ever-smaller capacities of the oil system, which reduces the possibility of heat dissipation. With high long-term engine loads the oil temperature may increase, which might cause excessive reduction of viscosity and the loss of proper lubrication.
Figure 6 presents the results of the KV by ACEA performance class. A vast majority (31 samples) meet the ACEA C3 performance class and constitute one reference group. All other samples that belong to a different performance class than C3 were included in the second group.
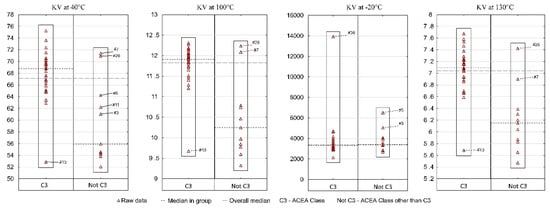
Figure 6.
Kinematic viscosity of fresh engine oils in the aspect of ACEA Class.
The analysis of kinematic viscosity at positive temperatures indicates that in each of the three cases (40 °C, 100 °C, 130 °C) the situation was similar. The median KV for group I (ACEA C3) is significantly higher than for group II (ACEA class other than C3). On the other hand, in both groups at least one sample can be indicated which differs significantly from the others in terms of KV values—for group I it is sample #13 and for group II—samples #7 and #26. Therefore, in the same viscosity class and in the same performance class, a consumer can, with little, yet not zero probability, find an oil which will differ significantly from most other oils. A different situation occurred for KV at a temperature lower than 0—the median in both groups was at a similar level, while three samples (#36, #3, #5) were indicated as significantly different from the remaining oils. The result for sample #36 is particularly worrying. The research carried out by the authors previously [16] showed that in −30 °C, too high kinematic viscosities may indicate not meeting the requirements of SAE J300 classification in sub-zero temperature parameters (CCS). As a result, it was decided that CCS measurements should be performed for two extreme samples (#13 and #36). The results were as follows: sample #13—CCS 3470 mPa·s, sample #36—CCS 11,000 mPa·s (the range of results was 7530 mPa·s). It may be recalled that KV at −20 °C was 2127 mm2/s and 13,931 mm2/s, respectively (the spread was on the level of 11,804 mm2/s). Thus, as a result of a temperature decrease of −10 °C (CCS was measured at −30 °C) and the introduction of the shear rate, the gap between the highest and lowest viscosity values decreased, but still was large. This also confirmed that sample #36 did not meet the requirements of SAE J300, which assumes a maximum structural viscosity value of 6600 mPa·s.
In the paper all fluids tested met the SAE J300 100C viscosity specifications for SAE 5W-30 oils. However, when marketers blend oils to meet the SAE J300 5W-30 specifications they also must meet viscosity specifications at −30 °C and high shear rates and 150 °C and high shear rates. The viscosity measurements made by the authors at low temperature (−20 °C) and high temperature (130 °C) are at low shear rates. This difference in shear rates is significant since the 5W-30 oils contain polymers. The differences between the viscosities of the 5W-30 oils at high shear rates would be more critical than the low shear rate viscosities. Oils are not developed based on the low shear rate viscosities at −20 °C and 130 °C so there is no expectation that the 5W-30 oils should have similar viscosities at these temperatures and low shear rates. Partial testing, which was to verify the relationship between the viscosities measured at different shear rates is not a perfect solution, however, it is able to satisfactorily confirm the relationships that occur between the tested oils.
3.3. Viscosity Curves in the Temperature Range from −20 °C to 130 °C
The combined results of the performed measurements were summarized in one chart (Figure 7). This made it possible to assess the operational performance of all tested oils. For operational reasons, considering the specificity of the climate in which a car is used, the optimal solution is to use engine oils demonstrating the smallest variation in viscosity in the temperature range from −20 °C to 130 °C, and at the same time having the lowest possible viscosity at −20 °C.
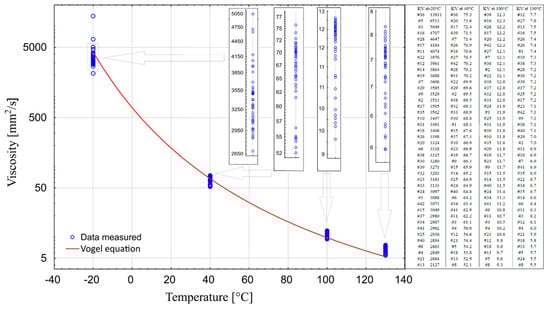
Figure 7.
Viscosity curves in the temperature range from −20 °C to 130 °C.
To illustrate the course of kinematic viscosity curves from temperature, the Vogel equation was used in the form:
where:
η—dynamic viscosity,
a, b, c—constant values,
t0—temperature.
The empirical values of coefficients were taken from [30] for Group IV oil—PAO—(a—0.04839, b—1193.38, c—−124.72). Based on the obtained values, the value of kinematic viscosity was calculated assuming a linear variation of density with temperature.
It is worth noting that sample #16 is the only one that can be found at each measured temperature in the group of 10 oils with the highest values. The samples #17 and #36 could also be put on this list, if viscosity measurements at 130 °C were not included. On the other hand, samples #4, #8, #13, and #21 can be found in the group of 10 oils with the lowest viscosity values at each of the four temperatures. In temperatures above zero, sample #5 is one of the three samples with the lowest viscosity, whereas in temperatures below zero (−20 °C) it is the sample with the second highest viscosity level. The situation is similar in case of sample #3. These two samples are very different from sample #36, which exhibits one of the highest levels of viscosity over the entire temperature range. Sample #12 should also be distinguished as having one of the lowest viscosity values at temperatures above zero, and one of the highest at temperatures below zero.
An attempt was made to discover potential outliers based on all collected data. The standard MD (Mahalanobis Distance) was placed on the horizontal axis and the robust MD was placed on the vertical axis (Figure 8). The vertical and horizontal lines around 3.5 are a square root of 97.5% quantile of the chi-square distribution with five degrees of freedom. Robust Mahalanobis distances identified 16 outliers as oils above horizontal line can be considered as such. These were the following oils (ordered from the largest to the smallest MD): #36, 21, 4, 13, 3, 5, 6, 18, 8, 20, 12, 11, 25, 41, 17 and 34. The MD revealed similar samples that had been also flagged in the previous paragraphs. Oil samples #4, #21, #13, #8 are outliers due to their small KV values, as described earlier. Sample #6 is outlying due to the lowest VI value. In turn, sample #25 because of the highest VI value. Sample #3 has been discussed before (high viscosity values at temperatures below zero and low viscosity values at temperatures above zero). However, for samples #11 and #41 it is not clear why they were flagged as potential outliers.

Figure 8.
Mahalanobis distance-distance plot.
3.4. Results of FTIR Analysis
In order to explain the obtained differences in viscosities of individual oils, their FTIR spectra were measured [15,31,32]. It was found that the carbonyl stretching vibration band C=O (~1700–1800 cm−1) in the hydrocarbon fraction is relatively low. In turn, the absorption bands of various additives in the same region, e.g., antioxidants, water, soot, etc. are quite intense. The fact that a stretching band can be observed in this region (1700–1800 cm−1) in the hydrocarbon fraction of engine oils may also indicate the presence of various types of oxidation products (such as aldehydes, ketones, carboxylic acids) or even some oxidation inhibitors (such as imides). Oftentimes, poor absorption of some oils in the regions of ~1750 cm−1 wavenumber can be attributed to the presence of small amounts (usually less than 1%) of depressants (such as polymers with carbonyl groups). The spectra were measured for all of the oils tested. However, to simplify the analysis, only those oils were selected for further study whose viscosity was significantly different from other oil samples (e.g., #8, #21, #36) or represented average values (such as oil sample #6). All of the spectra were normalized at a maximum of about 1377 cm−1 in order to facilitate the analysis (Figure 9).
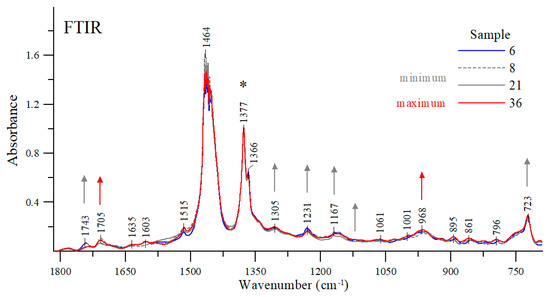
Figure 9.
Exemplary FTIR spectra of the oil samples in the spectral range of 1815-690 cm−1. *The asterisk indicates the band at which the spectra presented were normalized. -> Arrows of the same color mark those bands that increase the intensity of vibrations, and which decrease as the viscosity changes.
At the wavenumber of 1743 cm−1 (and 1705 cm−1), carbonyl stretching vibration bands C=O can be detected [33,34]. Depending on the engine oil, the intensity ratio of these bands varies considerably. For example, the stretching bands of the samples #8, #6 or #21 had their maxima at a higher wavenumber; whereas for sample #36 the stretching band with a maximum at about 1743 cm−1 lost its intensity in favor of a sharp increase in the band with a maximum at about 1705 cm−1. As shown earlier, oil samples #8 and #21 have the lowest viscosity while sample #36 has the highest viscosity among the samples tested. For comparison purposes, sample #6 exhibits one of the average viscosity values as measured in the study. Vibrations with a maximum at about 1705 cm−1 can be attributed to the formation of a hydrogen bond between the groups C=O⋯H-O- [33,34,35]. In the case of the samples tested, a decrease in the intensity of this band in favor of an increase in the intensity of the band with a maximum at about 1743 cm−1 is clearly associated with changes in the viscosity of the oils tested. The more exact regions of these two bands are shown in Figure 10.

Figure 10.
FTIR spectra of selected samples in the spectral range 1815–1610 cm−1.
Along with the changes in band intensity at around 1743 cm−1 and 1705 cm−1 (Figure 9 and Figure 10), additional ones are observed for selected samples in other spectral ranges, also interpreted in the context of changes in their viscosity [33,34,35]. The region with a maximum at about 968 cm−1 represents various stretching vibrations such as ν(C-H)s or ν(C-C), increasing their intensity as the intensity of the band goes up to a maximum at about 1705 cm−1. Considering this band together with the detected changes in the intensity of the previously discussed regions in which the samples exhibited a higher viscosity value leads to an obvious conclusion that an increase in its intensity is yet another factor confirming earlier observations. However, as the bands go up with a maximum at around 1743 cm−1, the other ones in the following regions: 1305, 1231, 1167 and 1109 and 723 cm−1 also increase in intensity (Figure 9), perfectly matching the samples for which the lowest viscosity values were observed.
3.5. The Chromatographic Analysis
The rheological properties at temperatures above and below zero largely depend on the type of base oils used, which make up from 85% to 90% of the engine oil composition in total. Following the manufacturers’ declarations, the group of oils tested should contain base oils obtained by polymerization, polycondensation, chemical synthesis or catalytic hydrocracking. One of the methods to assess the composition of engine oil is the analysis of true boiling points, determined by gas chromatography with the use of an SIMDIS apparatus [36]. The analysis of the results of rheological property tests made it possible to select two samples marked #21 (representing low-viscosity samples at −20 °C) and #36 (representing high-viscosity samples at −20 °C) from a group of 42 oils. The results of chromatographic tests are depicted in Figure 11, showing chromatograms of the samples tested in the characteristics of “retention time—signal size.”

Figure 11.
Chromatographic analysis.
Visible differences in the obtained chromatograms have led to the assumption that the compositions of the base oils used in the manufacturing of the engine oils tested visibly vary. A symmetrical shape of the curve representing sample #21 indicates the use of a thermal hydrocracking oil. This sample also contains fewer ingredients with high boiling points. In turn, sample #36 may contain admixtures of various types of base oils (Group II and Group III—API base oil) in its composition. This is especially visible through clear peaks corresponding to components (poly-alpha-olefins—PAOs) of a different chemical nature in comparison to other components [36,37,38]. A different slope of the graphs in terms of signal to retention time observed in the range from 15 to 20 min (sample #36), and a much higher signal level (sample #36) in the retention time range from 15 to 25 min, confirm that there are significant differences in the composition of the engine oils tested [39]. The base oils used to compose the final product have a discernible impact on the rheological properties of engine oils, especially at subzero temperatures. Extra-normative results were obtained for sample #36 in structural viscosity at −30 °C, which might have been caused by incorporating into its composition some mineral base oils with much worse properties and which have higher boiling points, as can be observed in the analyzed chromatogram.
3.6. Oil’s Energy Efficiency
Out of 42 studied oils, a significant group (eight oils, 19%) was marked by the manufacturers as the energy-saving oils (Among the 42 oils, the sample #14 has an indication ILSAC GF- 5, the samples #5 and #8 have ILSAC GF-4, while the samples #11, #12, #18, #21, #42 have a manufacturer’s designation as “fuel economy”). An energy-saving motor oil is an oil with a reduced HTHS (High Temperature High Shear-rate viscosity), usually below 3.5 mPa·s. One of the results of energy-saving is the reduction in fuel consumption. This is the cost most affecting the total cost of car operation. Reducing fuel consumption also significantly reduces atmospheric pollution. As this is an important engine oil segment, additional details are provided.
The collected results for this group of oils indicate that in five cases (#5, #8, #12, #18, #21), manufacturers achieved the energy efficiency by reducing viscosity at high temperatures (KV 100 < 10 mm2/s, both declared and measured). Another three samples (#11, #14, #42) have this viscosity above 10 mm2/s. Especially, samples #14 and #42 do not clearly differ from the remaining oils with regard to viscosity. In their case, the energy efficiency is most likely ensured in a different way other than minimizing the viscosity of the oil. Surprisingly, samples #5 and #11 had high viscosity at −20 °C (6513 and 4074 mm2/s, respectively), even though sample #5 was one of the two samples with the overall lowest KV 100. Sample’s #11 viscosity index (Figure 3) declared by the manufacturer was noticeably different from the measured one. Oil #8 was in the group of 10 oils with the lowest viscosity at each of the four analyzed temperatures. Samples #18 and #21, at each of the four measured viscosity temperatures, can be found in the group of 10 oils with the lowest viscosity.
Taking the oil market perspective, the ongoing trends, reinforced by the numerous studies in this area, are driving the market towards higher performance and more fuel-efficient lubricants. It is believed that in a not-so-distant future, lower viscosity SAE 5W-30 and 5W-40 engine lubricants will be superseded by more efficient SAE 0W-20 and 0W-16 viscosity grades. The market introduction of SAE 0W-16 and 5W-16 has opened up an opportunity to improve engine oil fuel economy even further. Both of them were included in the revision of API Publication 1509 in the API SN category in 2014, but the fuel economy criteria were not provided there due to a lack of sufficient data. The improvements in fuel economy that result from the use of low friction engine oils are well known within the industry, and can be obtained mainly by reduction in oil viscosity [40,41,42,43] (through the addition of specialty chemicals like, e.g., friction modifiers). Based on the ILSAC (In 1994, the ILSAC (International Lubricant Standardization and Approval Committee) was established in the USA to introduce a new classification of energy-saving and fuel-saving oils into the scientific and information circulation, and to determine how to test and certify such products. ILSAC was created as a result of an agreement between AAM (Alliance of Automobile Manufactures) and JAMA (Japanese Automobile Manufacturers Association)). ILSAC has developed test and research procedures to identify the most fuel-saving oils. In this general sphere other organizations also exist. For example, API (American Petroleum Institute) is responsible for identifying the standards that a motor oil should meet. The API is a consensus specification voted on by all involved automotive organizations. To receive the API seal of approval, the motor oil has to comply with the SAE (Society of Automotive Engineers) oil viscosity standards. ILSAC differs from API because it also measures fuel economy, while API does not. GF-4 (Starting from 1 May 2020, ILSAC GF-6A and GF-6B will be the standard. If a car previously required ILSAC GF 1-5, it is safe to use oils formulated with the new ILSAC GF-6A standard. ILSAC GF-6B can be used to meet SAE 0W-16 recommendations.) economy classification (linked to the API SM classification), in which the same 5W-30 synthetic oil is the reference point, the following minimum fuel savings can be expected: 1.8% in SAE 0W-30 and 5W-30, 2.3% in SAE 0W-20 and 5W-20 viscosity grades. Ishikava experimentally obtained 2.8% savings for the FEI (Fuel Economy Improvement) indicator and 1.3% for the FEI2 indicator when using SAE 0W-16 oil based on readily available market GF-5 technologies [44]. Mo confirmed that at the same viscosity grade, the vehicle fuel economy of Dexos1 engine oil is 0.36% higher than the one of API SN engine oil. The vehicle fuel economy was highly correlated with engine friction loss. Five-point-five percent engine friction loss reduction was approximately equivalent to 1% vehicle fuel economy improvement. They noted that special additives of engine oil formulation technology has further potential for fuel economy improvement [45]. Therefore, if the car manufacturer allows the use of oils with different viscosities, then from an economic and environmental point of view it is recommended to use oils with low viscosity type 0W-30, 5W-30 because such oils save more fuel than 5W-40, 10W-40 or 15W-40. Thanks to the above classifications, it can be concluded that the use of oil, e.g., 5W30 (such is the subject of analysis in the article), which underwent ILSAC testing and received GF-4 class or higher, will bring potential consumers savings in the form of reduced fuel consumption, even if compared to a similar reference synthetic oil SAE 5W-30, by at least 1.8%. To illustrate the potential upper limit of direct monetary savings for the drivers a simple hypothetical scenario was constructed. The scenario does not consider the additional cost of fuel-saving technologies. It is assumed that the price of gasoline is 1.5 Euro per liter, yearly mileage of a typical passenger car is 12,000 km and the expected reduction of gasoline consumption from baseline due to the energy efficient engine oil is equal to 1.8%. Under this scenario, Figure 12 shows the total savings in millions of Euro per year as a function of the total number of identically utilized cars (in thousands) and the average gasoline consumption per 100 km (in liters).

Figure 12.
The total monetary savings in millions of Euro per year for energy-saving engine oil use case.
4. Conclusions
There is a lack of studies that compare the viscosity profiles of commercial engine oils belonging to the same viscosity class. The viscosity tests of fresh oil samples meeting the requirements of the SAE 5W-30 viscosity class showed that all tested samples were within the classification requirements for viscosity at 100 °C. The study draws attention to largely differing temperature-related viscosity profiles of engine oils. The results imply limited but possibly noticeable consequences for typical engine oil users having limited technical knowledge. Depending on the oil manufacturer when purchasing, guided only by the viscosity grade and performance categories, may result in buying an oil with either low or high viscosity which, under extreme operating conditions, can lead to engine damage. However, in practice this situation is expected to occur infrequently. The differences between oil manufacturers’ declarations (in 8/5 cases viscosity declarations for 40/100 °C were missing) and the results obtained in laboratory tests are also worth mentioning. This means that even experienced users, who refer to the catalog parameters, may purchase a product that does not meet their expectations.
With reference to the analysis of kinematic viscosity at 40 °C, it was observed that a significant number of oil samples (13 oils had a higher value and 21 had a lower value) deviated from the values declared by the manufacturers. In the case of kinematic viscosity at 100 °C, 18 oils had a higher value than declared and 19 had a lower value. The largest discrepancy in KV 100 measurements was 19% and the differences noticed in the next four samples were between 11–5%. The maximum discrepancy in KV 40 results was at the level of 24%. The next five samples were between 15–7%. When looking at the VI, the largest discrepancies were found at the level of 10%. Interestingly enough, there was no correlation between the recorded discrepancies and oils’ retail prices. A very large dispersion of results (11,804 mm2/s) was observed for measured kinematic viscosity at −20 °C. In this case nine oils had KV −20 °C below 3000 mm2/s, 26 between 3000–4000 mm2/s and four closely above 4000 mm2/s, but there were additional three samples characterized by the surprisingly high kinematic viscosity values—values of 5049 mm2/s, 6512 mm2/s and 13,931 mm2/s, respectively. Viscosity measurements were also carried out at 130 °C, and an important conclusion was reached that high viscosity at 100 °C does not mean that an oil will also maintain high viscosity at 130 °C. Comparing the changes in viscosity at 130 °C to the viscosity at 100 °C, it was shown that kinematic viscosity of the analyzed oils fell around 37–44%.
The viscosity curve showed which samples were characterized by a different (compared to most samples) pattern of viscosity changes at the four analyzed temperatures. Atypical patterns were found for three samples (#5, #36, #12). Three oils (#36, #5, #20) were noticeably outlying from the other tested oils. Four oil samples (#4, #21, #13, #8) were outlying because of their minimum values in individual parameters. One sample (#6) outlies because of the lowest VI value. In turn, also one sample (#25) outlies because of the highest VI value. Finally, one oil sample (#3) outlies because of high viscosity values at temperatures below zero and low viscosity values at temperatures above zero. CCS measurement for the most outlying oil sample (#36) confirmed that sample did not meet the requirements of SAE J300, which assumes a maximum structural viscosity value of 6600 mPa·s.
The applied FTIR infrared spectra measurements are an additional explanation for the obtained differences in kinematic viscosity. The analysis of band changes in specific regions of the FTIR spectra showed the existence of marker bands whose changes in absorption intensity correspond to higher or lower viscosity of a given oil. It was noted that the simultaneous increase in band intensity from a maximum of about 1705 (also quite noticeable for the band with a maximum at 968 cm−1) corresponds to samples for which higher viscosities were detected. At the same time, the decrease in the intensity of these bands and a very noticeable increase in the intensity of the bands at a maximum of about 1743, 1231, 1167, 1109 and 723 cm−1, match the samples for which the viscosity was lower.
4.1. Limitations
This study included approximately 15% of all available domestic oils in the selected viscosity grade. The robust MD was employed to find outliers. It is possible that if the whole engine oil population was analyzed more atypical oils would be discovered. However, as pointed out by [46], for small sample sizes (below 50) the method may be moderately overfitting and caution is advised. Therefore, it is also possible that fewer outliers would be found in the population study.
4.2. Future Research
An interesting direction of future research would be to validate the repeatability of the study results as a limited number of samples from each manufacturer were investigated. Perhaps a batch effect also exists as another source of random variability.
Author Contributions
Conceptualization: A.W., G.Z., K.F., P.J.; methodology: A.W., G.Z., K.F., P.J.; validation: A.W., G.Z., P.J.; formal analysis: A.W., K.F.; investigation: A.W., G.Z., K.F.; resources: A.W., G.Z.; data curation: A.W., G.Z., K.F.; writing—original draft preparation: A.W., G.Z., K.F., P.J., A.M.; writing—review and editing: A.W., G.Z., K.F.; visualization: A.W., G.Z., K.F., A.M.; supervision: A.W.; project administration: A.W.; funding acquisition: A.W., G.Z. All authors have read and agreed to the published version of the manuscript.
Funding
The APC was funded from the ’Excellent science’ program of the Ministry of Science and Higher Education as a part of the contract no. DNK/SP/465641/2020 “The role of the agricultural engineering and environmental engineering in the sustainable agriculture development”.
Conflicts of Interest
The authors declare no conflict of interest.
References
- Guan, L.; Feng, X.L.; Xiong, G. Engine lubricating oil classification by SAE grade and source based on dielectric spectroscopy data. Anal. Chim. Acta 2008, 628, 117–120. [Google Scholar] [CrossRef]
- Wakiru, J.M.; Pintelon, L.; Muchiri, P.N.; Chemweno, P.K. A review on lubricant condition monitoring information analysis for maintenance decision support Mechanical Systems and Signal Processing. Mech. Syst. Signal Process. 2019, 118, 108–132. [Google Scholar] [CrossRef]
- Zhu, J.; He, D.; Bechhoefer, E. Survey of Lubrication Oil Condition Monitoring, Diagnostics, and Prognostics Techniques and Systems. J. Chem. Sci. Technol. 2013, 2, 100–115. [Google Scholar]
- Torbacke, M.; Rudolphi, A.K.; Kassfeldt, E. Lubricants: Introduction to Properties and Performance; Wiley: Hoboken, NJ, USA, 2014; ISBN 978-1-118-79974-1. [Google Scholar]
- Taylor, R.I.; Mainwaring, R.; Mortier, R.M. Engine Lubricant Trends Since 1990. Proc. Inst. Mech. Eng. Part J. J. Eng. Tribol. 2005, 219, 331–346. [Google Scholar] [CrossRef]
- Nedić, B.; Perić, S.; Vuruna, M. Monitoring physical and chemical characteristics oil for lubrication. Tribol. Ind. 2009, 31, 59–66. [Google Scholar]
- Oil Industry and Trade Annual Report 2017; Polish Oil Industry and Trade Organisation (POPiHN): Warsaw, Poland, 2018.
- Zhu, X.; Zhong, C.; Zhe, J. Tribology International Lubricating oil conditioning sensors for online machine health monitoring—A review. Tribiology Int. 2017, 109, 473–484. [Google Scholar] [CrossRef]
- Du, Y.; Wu, T.; Cheng, J. Age detection of lubricating oil with on-line sensors. In Proceedings of the 2015 IEEE SENSORS—Proceedings, Busan, Korea, 1–4 November 2015. [Google Scholar]
- Martini, A.; Ramasamy, U.S.; Len, M. Review of Viscosity Modifier Lubricant Additives. Tribol. Lett. 2018, 66, 58. [Google Scholar] [CrossRef]
- Smith, O.; Sutton, M. Fuel economy in heavy duty diesel engines. Part 1: Measurement of oil film thickness on an operating engine. Proc. Inst. Mech. Eng. Part J. J. Eng. Tribol. 2011, 225, 313–324. [Google Scholar] [CrossRef]
- Du, Y.; Wu, T.; Makis, V. Parameter estimation and remaining useful life prediction of lubricating oil with HMM. In Proceedings of the 21st International Conference on Wear of Materials, Long Beach, CA, USA, 26–30 March 2017; Volume 376–377, pp. 1227–1233. [Google Scholar] [CrossRef]
- de Paula Pedroza, R.H.; Nicácio, J.T.N.; dos Santos, B.S.; de Lima, K.M.G. Determining the Kinematic Viscosity of Lubricant Oils for Gear Motors by Using the Near Infrared Spectroscopy (NIRS) and the Wavelength Selection. Anal. Lett. 2013, 46, 1145–1154. [Google Scholar] [CrossRef]
- 14 Robertson, W.S. Types and Properties of Lubricants. In Lubrication in Practice; Robertson, W.S., Ed.; Macmillan Education: London, UK, 1983; pp. 14–27. ISBN 978-1-349-06731-2. [Google Scholar]
- Braga, J.W.B.; dos Santos Junior, A.A.; Martins, I.S. Determination of viscosity index in lubricant oils by infrared spectroscopy and PLSR. Fuel 2014, 120, 171–178. [Google Scholar] [CrossRef]
- Wolak, A.; Zając, G. Cold cranking viscosit of used synthetic oils originating from vehicles operated under similar driving conditions. Adv. Mech. Eng. 2018, 10, 1–12. [Google Scholar] [CrossRef]
- Kral, J., Jr.; Konecny, B.; Kral, J.; Madac, K.; Fedorko, G.; Molnar, V. Degradation and chemical change of longlife oils following intensive use in automobile engines. Measurement 2014, 50, 34–42. [Google Scholar] [CrossRef]
- Sejkorová, M.; Hurtová, I.; Glos, J.; Pokorný, J. Definition of a Motor Oil Change Interval for High-Volume Diesel Engines Based on its Current Characteristics Assessment. Acta Univ. Agric. Silvic. Mendel. Brun. 2017, 65, 481–490. [Google Scholar] [CrossRef]
- Wang, S.S. A Physical Model for the Engine Oil Condition Sensor. Tribol. Trans. 2001, 44, 411–416. [Google Scholar] [CrossRef]
- Howard, K. Advanced engine oils to improve the performance of modern internal combustion engines. Altern. Fuels Adv. Veh. Technol. Improv. Environ. Perform. 2014, 138–164. [Google Scholar] [CrossRef]
- Kumbar, V.; Votava, J. Differences in engine oil degradation in spark-ignition and compression-ignition engine. Eksploat. Niezawodn. – Maint. Reliab. 2014, 16, 622–628. [Google Scholar]
- Sariyerli, G.S.; Sakarya, O.; Akcadag, U.Y. Comparison tests for the determination of the viscosity values of reference liquids by capillary viscometers and stabinger viscometer SVM 3001. Int. J. Metrol. Qual. Eng. 2018, 9. [Google Scholar] [CrossRef]
- Okuyama, Y.; Shimokoji, D.; Sakurai, T.; Maruyama, M. Study of low-viscosity engine oil on fuel economy and engine reliability. SAE Tech. Pap. 2011, 9–10. [Google Scholar] [CrossRef]
- Souza de Carvalho, M.J.; Rudolf Seidl, P.; Pereira Belchior, C.R.; Ricardo Sodré, J. Lubricant viscosity and viscosity improver additive effects on diesel fuel economy. Tribol. Int. 2010, 43, 2298–2302. [Google Scholar] [CrossRef]
- Canter, N. Special report: additive challenges in meeting new automotive engine specifications. Tribol. Lubr. Technol. 2006, 62, 10–19. [Google Scholar]
- R Core Team. R: A Language and Environment for Statistical Computing; R Foundation for Statistical Computing: Vienna, Austria, 2019; Available online: https://www.R-project.org/ (accessed on 10 January 2020).
- Wolak, A.; Zając, G. The kinetics of changes in kinematic viscosity of engine oils under similar operating conditions. Eksploat. Niezawodn. – Maint. Reliab. 2017, 19, 260–267. [Google Scholar] [CrossRef]
- Cameron, G.L.; Pettit, C.W.; Rowls, G.A. Cold Cranking Team: Battery, Cables, Cranking Motor, Engine Oil. In The Role of Engine Oil Viscosity in Low Temperature Cranking and Starting; Pergamon: Oxford, UK, 1966; pp. 20–29. ISBN 978-0-08-012502-2. [Google Scholar]
- Wolak, A. Statistical Analysis of HTHS Viscosity Rating of Present-Day Engine Oils. Tribol. Trans. 2019, 62, 34–41. [Google Scholar] [CrossRef]
- Marx, N.; Fernández, L.; Barceló, F.; Spikes, H. Shear Thinning and Hydrodynamic Friction of Viscosity Modifier-Containing Oils. Part I: Shear Thinning Behaviour. Tribol. Lett. 2018, 66, 92. [Google Scholar] [CrossRef]
- Al-Ghouti, M.A.; Al-Degs, Y.S.; Amer, M. Application of chemometrics and FTIR for determination of viscosity index and base number of motor oils. Talanta 2010, 81, 1096–1101. [Google Scholar] [CrossRef]
- Bassbasi, M.; Hafid, A.; Platikanov, S.; Tauler, R.; Oussama, A. Study of motor oil adulteration by infrared spectroscopy and chemometrics methods. Fuel 2013, 104, 798–804. [Google Scholar] [CrossRef]
- Abu-Elella, R.; Ossman, M.; Farouq, R.; Abd-Elfatah, M. Used motor oil treatment: turning waste oil into valuable products. Int. J. Chem. Biochem. Sci. 2015, 7, 57–67. [Google Scholar]
- Zhang, W.; Yuan, W.; Zhang, X.; Coronado, M. Predicting the dynamic and kinematic viscosities of biodiesel–diesel blends using mid-and near-infrared spectroscopy. Appl. Energy 2012, 98, 122–127. [Google Scholar] [CrossRef]
- Feng, F.; Wu, Q.; Zeng, L. Rapid analysis of diesel fuel properties by near infrared reflectance spectra. Spectrochim. Acta. A. Mol. Biomol. Spectrosc. 2015, 149, 271–278. [Google Scholar] [CrossRef]
- Voelkel, A.; Fall, J. Wykorzystanie metod chromatograficznych w badaniu syntetycznych olejów silnikowych. Przem. Chem. 2001, 80, 102–108. [Google Scholar]
- Fall, J.; Voelkel, A. Inverse gas chromatography and other chromatographic techniques in the examination of engine oils. J. Chromatogr. A 2002, 969, 181–191. [Google Scholar] [CrossRef]
- Voelkel, A.; Fall, J. Chromatographic and non-chromatographic characterization of poly-α-olefins. J. Synth. Lubr. 2007, 24, 91–100. [Google Scholar] [CrossRef]
- Fall, J.; Voelkel, A. Badanie olejów silnikowych klas lepkości 10W, 15W, 20W. Przem. Chem. 2002, 81, 25–31. [Google Scholar]
- Kenbeek, D.; Buenemann, T.; Rieffe, H. Review of Organic Friction Modifiers—Contribution to Fuel Efficiency? In Proceedings of the CEC/SAE Spring Fuels & Lubricants Meeting & Exposition, Paris, France, 21 June 2000. [Google Scholar]
- Park, S.; Cho, Y.; Sung, K.; Han, N. The Effect of Viscosity and Friction Modifier on Fuel Economy and the Relationship Between Fuel Economy and Friction. SAE Int. J. Fuels Lubr. 2010, 2, 72–80. [Google Scholar] [CrossRef]
- Dohner, B.; Umehara, H.; Kaneko, T.; Yamashita, M. Development of Novel Friction Modifier Technology Part 2: Vehicle Testing. SAE Tech. Pap. 2011. [Google Scholar] [CrossRef]
- Kocsis, M.C.; Morgan, P.; Michlberger, A.; Delbridge, E.E.; Smith, O. Optimizing Engine Oils for Fuel Economy with Advanced Test Methods. SAE Int. J. Fuels Lubr. 2017, 10, 848–856. [Google Scholar] [CrossRef]
- Ishikawa, M.; Yamamori, K.; Hirano, S.; Kowalski, T.; Linden, J. Introduction of Fuel Economy Engine Oil Performance Target with New SAE Viscosity Grade. SAE Int. J. Fuels Lubr. 2016, 9, 374–383. [Google Scholar] [CrossRef]
- Mo, Y.; Wang, J.; Wang, J.; Zhou, W.; Dong, T. Experimental Research on the Impact of Engine oils on Vehicle Fuel Economy. In Proceedings of the 5th International Conference on Advanced Design and Manufacturing Engineering, Shenzhen, China, 19–20 September 2015; pp. 1114–1120. [Google Scholar]
- Cerioli, A.; Riani, M.; Atkinson, A.C. Controlling the size of multivariate outlier tests with the MCD estimator of scatter. Stat. Comput. 2009, 19, 341. [Google Scholar] [CrossRef]


© 2020 by the authors. Licensee MDPI, Basel, Switzerland. This article is an open access article distributed under the terms and conditions of the Creative Commons Attribution (CC BY) license (http://creativecommons.org/licenses/by/4.0/).