1. Introduction
In recent years, with the increasingly serious global environmental pollution, renewable energy has gradually gained considerable attention and is one of the fastest developing industries in the global economy. Meanwhile, the enthusiasm of investors in the renewable energy industry’s capital markets has been aroused by the strengthening of environmental protection consciousness and the increasing awareness of reducing fossil energy use for the shortage of fossil energy sources.
Many factors can affect renewable energy stocks. These include fossil energy prices [
1,
2,
3,
4,
5,
6], the stock market index, volatility index (VIX), and bonds [
7,
8,
9,
10,
11,
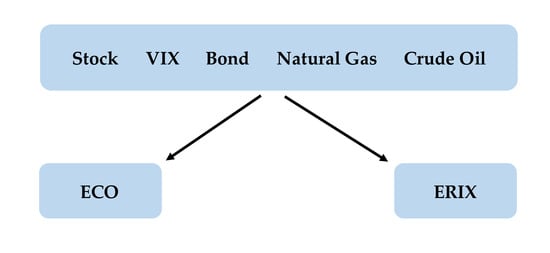
12]. Fossil energies such as natural gas and crude oil are related to renewable energy returns and renewable energy investment in capital markets. Investors have fewer incentives to invest in renewable energy development projects when fossil energies prices are low, which causes lower stock prices of renewable energy companies. Inversely, investors have more incentives when the prices of fossil energies are high, which leads to higher renewable energy stock prices. On the other hand, the development of renewable energy is inseparable from the traditional financial market, especially the stock market. Renewable energy assets can play an important role in stock portfolio diversification to alleviate portfolio risk. On the contrary, a steady flow of financial support can be provided by stock markets for the development of renewable energy. As the renewable energy index is a subset of the stock market, the fluctuations (i.e., returns and volatilities) of the whole stock market can impose a strong influence on renewable energy stocks. Moreover, in the US and many European countries, state or local bond finance is a helpful tool but has not been fully used for investment in renewable energy, and the nations’ state and local infrastructure finance agencies are increasingly willing to finance renewable energy projects. Thus, the aim of this paper is to investigate the directional spillovers of returns and volatility from fossil energy prices (crude oil, natural gas) and financial variables (stock market index, bond yield, and the VIX) to renewable energy stocks in the time and frequency domains.
According to the Global Trends in Renewable Energy Investment 2019 [
13] report, the US ranks second among the top twenty countries with renewable energy capacity investments from 2010 to the first half of 2019, with a total invested amount of
$356 billion, 14% of the global total. On the other hand, the same top twenty list contains eight European countries. Europe, overall, has an investment in renewable energy capacity of about
$698 billion, accounting for approximately 28% of the global total. To achieve the target of “facilitate the diversification of electricity generation mixes, increase renewable energy deployment, reduce state reliance on fossil fuels, help renewable energy sources become cost-competitive with conventional energy sources, reduce carbon emissions, or various combinations thereof” (Carley [
14], p. 3072), in the US, numbers of policies and financial incentives are implemented by federal and state governments, such as the Production Tax Credit (PTC) implemented by federal governments, and Renewable Portfolio Standard (RPS) legislation and the Feed-In Tariff (FIT) by state governments. On the other hand, in Europe, a binding target was endorsed by the European Council in 2007 of a 20% share of renewable energies in the overall consumption of EU energy by 2020 and a 10% share of biofuels in overall consumption of EU transport petrol and diesel. To achieve the target and develop energy infrastructure, the Member States (MS) had to prepare National Renewable Energy Action Plans (NREAPs). Due to the difference in the renewable energy policy of the US and Europe, we also examine whether the spillover effects on renewable energy stocks in the two regions differ.
We adopt two empirical methods: the Diebold–Yilmaz [
15] approach and the Barunik and Krehlik [
16] methodology in the time and frequency domain, respectively. The Diebold and Yilmaz approach can allow us to examine the spillover effect in a fixed investment horizon, which is based on the forecast error variance decomposition [
15,
17,
18]. There are many advantages of the Diebold and Yilmaz approach over traditional econometric models, such as it being easy to calculate and allowing to quantify the strength and direction of spillover effects, which some traditional econometric models (i.e., generalized autoregressive conditional heteroscedasticity (GARCH) type models, Copula models) cannot do. Importantly, due to differences in economic agents’ beliefs, risk tolerances, preferences, levels of information assimilation, and aims, agents operate in the market at different investment horizons (represented by frequencies), ranging from seconds to several years. Consequently, shocks transmit through markets, producing heterogeneous frequency responses, and generating links with different degrees of persistence [
16,
19,
20,
21]. Thus, by extending the Diebold–Yilmaz approach, the Barunik and Krehlik [
16] method can obtain the spillovers at different frequencies by decomposing the Diebold–Yilmaz spillover index into different frequencies.
Our empirical findings are as follows. Firstly, our study finds that the total return spillover effects from the fossil energy markets and financial variables to the Wilder Hill Clean Energy Index (ECO) in the US are slightly higher than those from the fossil energies and financial variables to the European Renewable Energy Index (ERIX) in Europe. Moreover, stock markets transmit the highest return spillovers to renewable energy stocks in both the US and Europe, which far exceed the spillover from fossil energies (crude oil, natural gas) to renewable energy stocks. Second, we find that the total volatility spillover from fossil energy markets and financial variables to ECO in the US are also higher than the total spillover effect of the volatility of fossil energy markets and financial variables on ERIX in Europe. Interestingly, stock markets in the US explain most of the changes in the volatilities of the stocks of renewable energy, which is even larger than the self-explanation power of renewable energy stocks. Third, the spillovers of return and volatility from fossil energies (natural gas, crude oil), the stock index, VIX, and bond yields to renewable energy stocks increase during extreme events, such as financial turmoil. Some extreme events such as the Brexit referendum in 2016 mainly affected the European market. Finally, we find that the spillovers of return and volatility are contingent on the frequency. Return spillovers are concentrated mostly at the high frequency (1 to 5 days), while most of volatility spillovers are concentrated at the low frequency (over 21 days).
Our research has four contributions to the extant empirical literature. First, this study evaluates spillover effects from fossil energy prices (natural gas, crude oil) and several key financial variables (stock market index, VIX, and bond yields) to renewable energy stocks, not only in returns but also in volatilities. Second, this study decomposes the spillover effects into frequency domains to explore the spillovers in short-, medium-, and long-term horizons. Third, to better understand and capture the dynamic spillovers, this study sheds light on dynamic spillovers to renewable energy stock returns and volatilities based on the moving window method. Fourth, a comparative analysis is conducted for the US and Europe to examine whether the spillover effects in these two regions are different or not. In addition, investors may get several important implications from the empirical results of this study, since the spillover effects from fossil fuels and financial variables to renewable energy stocks increase during financial turmoil, when in extreme cases, the interaction between them should receive more attention from investors. Moreover, in most cases, the turning points in dynamic return spillovers are roughly equivalent to renewable energy stock market highs, while turning points in dynamic volatility spillovers are roughly equivalent to market lows. Hence, the turning points in dynamic return spillovers can be considered as the selling signals, while turning points in dynamic volatility spillover can be taken as the buying signal. In addition, the results may provide effective insights for risk management, portfolio diversification, and hedging strategies for investors with different investment horizons in the US and Europe. For short-term investors, such as day traders or hedge funds, constructing well-diversified portfolios consisting of renewable energy stocks, fossil energy futures, stocks, the VIX, and 10-year government bonds is complex, especially during periods of financial turmoil. For long-term investors, they would benefit from including fossil energy assets in portfolios composed primarily of renewable energy stocks and traditional financial assets to obtain long-term benefits of diversification.
The remainder of this paper proceeds as follows.
Section 2 introduces the empirical method, while
Section 3 describes the data and preliminary analysis.
Section 4 explains and analyzes the empirical results, and
Section 5 presents the conclusions.
2. Literature Review
Previous research has investigated the dependence and correlation between the prices of fossil energies and renewable energy stocks. Most of the literature concentrates on the interrelationship between crude oil prices and renewable energy stocks, and suggests that crude oil has a significant impact on renewable energy stocks. For instance, Reboredo [
22] applies copulas and the conditional value-at-risk (CoVaR) to study the systemic risk and dependence between renewable energy stocks and crude oil markets. The results show that the price of crude oil significantly contributes to the systemic risk for renewable energy stocks. Kumar et al. [
23] analyze the relationship between alternate clean energy stocks and crude oil prices by applying a lag-augmented vector autoregression (VAR) model, and find that clean energy stock prices could be affected by prices of crude oil.
Except for crude oil, the interdependencies between renewable energy stocks and other fossil energies, such as coal and natural gas, are also widely discussed in the literature. For example, Reboredo and Ugolini [
5] analyze the dependence between fossil energy markets (coal, natural gas, and crude oil), electricity markets, and clean energy stocks in the US and EU using a multivariate vine-copula approach. They find that crude oil and electricity have significant contributions to the returns of clean energy stocks in the US and EU, respectively. Base on the Divisia price synthesis method, Sun et al. [
6] explore the influence of fossil energy prices on the new energy stocks’ prices and find that fossil energy prices have relatively little effect on the prices of new energy stocks, while the prices of new energy stocks are more susceptible to lagged values. By using a connectedness network model, Xia et al. [
24] consider the influence of fossil fuels and related products’ (natural gas, carbon, crude oil, electricity, and coal) price changes on the returns of renewable energy stock. The results in their study indicate that each fossil energy has a significantly different contribution to the renewable energy stock. Coal and crude oil contribute the most to the renewable energy stock changes. However, the contribution of natural gas to renewable energy stock is far less than that of coal and crude oil.
Since the development of renewable energy is inseparable from the traditional financial market, some studies also analyze the link between renewable energy stocks and many financial variables, such as the stock market index, bonds, and the VIX. Through the cross-quantilogram (CQ) approach, Uddin et al. [
10] analyze the dependence of renewable energy stock returns on aggregate stock returns, crude oil, exchange rates, and gold, finding that aggregate stock returns have a significant impact on returns of renewable energy stock. Additionally, using the copulas approach, Ji et al. [
11] consider the dynamic dependence between clean energy prices and three measures of uncertainty: economic policy uncertainty (EPU), VIX, and the crude oil volatility index (OVX). They show that financial uncertainty (VIX) influences clean energy stocks more strongly than EPU does. By applying multivariate generalized autoregressive conditional heteroskedasticity (M-GARCH) models, Ahmad et al. [
12] investigate the usefulness of VIX, bonds, gold, OVX, oil, and European carbon prices to hedge clean energy investments, and find that the VIX provides the most effective hedge for the prices of clean energy stock. Especially, some researchers declared that the linkage of renewable energy stocks with the stock market is even higher than with fossil fuels. For instance, Inchauspe et al. [
25] examine the dynamic returns of the Wilder Hill New Energy Global Innovation Index (NEX), concluding that the Morgan Stanley Capital International (MSCI) World index mainly affects the NEX returns, while crude oil has a relatively minor impact on the NEX returns. As another example, by using multivariate GARCH models, Sadorsky [
26] investigates the volatility spillovers and correlations between clean energy stocks, oil prices, and technology stocks, and their results reflect that the prices of clean energy stocks have more high correlation with technology stock prices than with prices of crude oil.
In this paper, we apply the new empirical time-frequency domain frameworks introduced by Diebold and Yilmaz [
15] and Barunik and Krehlik [
16] to examine the spillovers of return and volatility transmitted from fossil fuel energies (natural gas and crude oil) and several important financial variables (stock market index, bonds, and the volatility index) to renewable stock markets in the US and Europe. The Diebold–Yilmaz approach and Barunik and Krehlik methodology have been applied by various studies. For instance, Awartani and Maghyereh [
27] analyze the return and volatility spillovers between crude oil and the stock market indices in the Gulf Cooperation Council countries with the Diebold–Yilmaz approach. Using the same method, Mensi et al. [
28] measure the spillovers of volatility among the Standard & Poor’s 500 Stock Index (S&P 500 index), STOXX Europe 600 Index (Stoxx 600 index), Dow Jones Asia/Pacific Index (P1DOW index), Morgan Stanley Capital International world index (MSCI world index), and Greece, Ireland, Portugal, Spain, and Italy (GIPSI) stock markets. Kang et al. [
29] consider the spillover effects among West Texas Intermediate (WTI) crude oil, precious metals (gold and silver), and agricultural staples (rice, wheat, and corn). Trabels [
30] uses the Diebold–Yilmaz approach and Barunik and Krehlik methodology to study the connectedness among cryptocurrency markets, the Bitcoin index, traditional currencies, stock markets, gold, and crude oil. Liu et al. [
31] examine the spillovers of return and volatility from fossil fuel energies (crude oil, coal, natural gas) to electricity spot and three electricity futures in Europe using the same time-frequency domain frameworks. Tiwari et al. [
32] examine the volatility spillovers among four global assets, including currency, credit default swaps, sovereign bonds, and stocks, using the Diebold–Yilmaz approach and Barunik and Krehlik method.
3. Methods
To estimate the return and volatility spillovers from fossil energy prices (natural gas, crude oil), the stock market index, VIX, and 10-year government bond yields to renewable energy stocks in the time domain, we adopted the Diebold–Yilmaz approach proposed in 2009 and developed in 2012 and 2014. The Diebold–Yilmaz approach is built on the notion of forecast error variance decomposition (FEVD) within the generalized vector autoregression (VAR) framework.
We have the following VAR(p) model:
where
denotes an
N × 1 vector of observed variables at time
t,
is the
N ×
N coefficient matrix, and the error vector
, with covariance matrix
, is possibly non-diagonal.
Assuming covariance stationarity, we can also represent the VAR(p) process as the following moving average representation:
where
is an
N ×
N coefficient matrix of infinite-lag polynomials that can be calculated recursively. By using the generalized VAR framework proposed by Koop et al. [
33] and Pesaran and Shin [
34], it can make the variance decomposition independent of the ordering of variables in the VAR system.
Under this framework, we can write the H-step-ahead generalized FEVD (GFEVD) as follows:
where
stands for an
N ×
N coefficient matrix of polynomials at lag
h, and
denotes the contribution of the
k-th variable of the model to the variance of the forecast error of the
j-th variable at the selected forecast horizon
H.
We normalized each entry by the row sum in order to make the sum of the elements in each row of the GFEVD be one, as follows:
Here,
provides a measure of the pairwise spillover from the
k-th variable to the
j-th variable at horizon
H in the time domain. Moreover, we measured the total spillover from all variables to the renewable energy stock market by introducing directional spillovers (from),
which measures the spillovers received by the
k-th variable from all other variables at horizon
H.
Analogously, to estimate the return and volatility spillovers from fossil energy prices (crude oil and natural gas), the stock market index, VIX, and 10-year government bond yields to renewable energy stocks in the frequency domain, we used the Barunik and Krehlik methodology, which is an extension to the frequency domain of the Diebold–Yilmaz spillover index.
Following Barunik and Krehlik [
16], we considered a frequency response function obtained as a Fourier transform of the coefficients
:
=,
where
i =
We can define the generalized causation spectrum over frequencies
as
where
indicates the portion of the spectrum of the
j-th variable at a given frequency
due to shocks in the
k-th variable. The denominator holds the spectrum of the
j-th variable at a given frequency
, and thus Equation (6) can be seen as the quantity within the frequency causation. To obtain the generalized decomposition of the variance decompositions to frequencies, we weighted
by the frequency share of the variance of the
j-th variable. This weighting function is defined by
Equation (7) shows the power of the
j-th variable at a given frequency, which sums through frequencies to a constant value of 2
. The Fourier transform of the impulse is a complex number, however, the generalized factor spectrum is composed of the squared coefficients of the weighted complex numbers, and thus a real number. We set the frequency band
d = (
a,
b):
a,
b , for
a <
b. The GFEVD under the frequency band
d is
We took the normalized value, and defined the scaled GFEVD on the frequency band
d = (
a,
b):
a,
b, for
a <
b, as
Here, is the pairwise spillover from the k-th variable to the j-th variable on a given frequency band d.
Similarly, we measured the total spillover from all variables to the renewable energy stock market on the given frequency band
d by introducing directional spillovers (from) in the frequency domain as follows:
4. Data and Preliminary Analysis
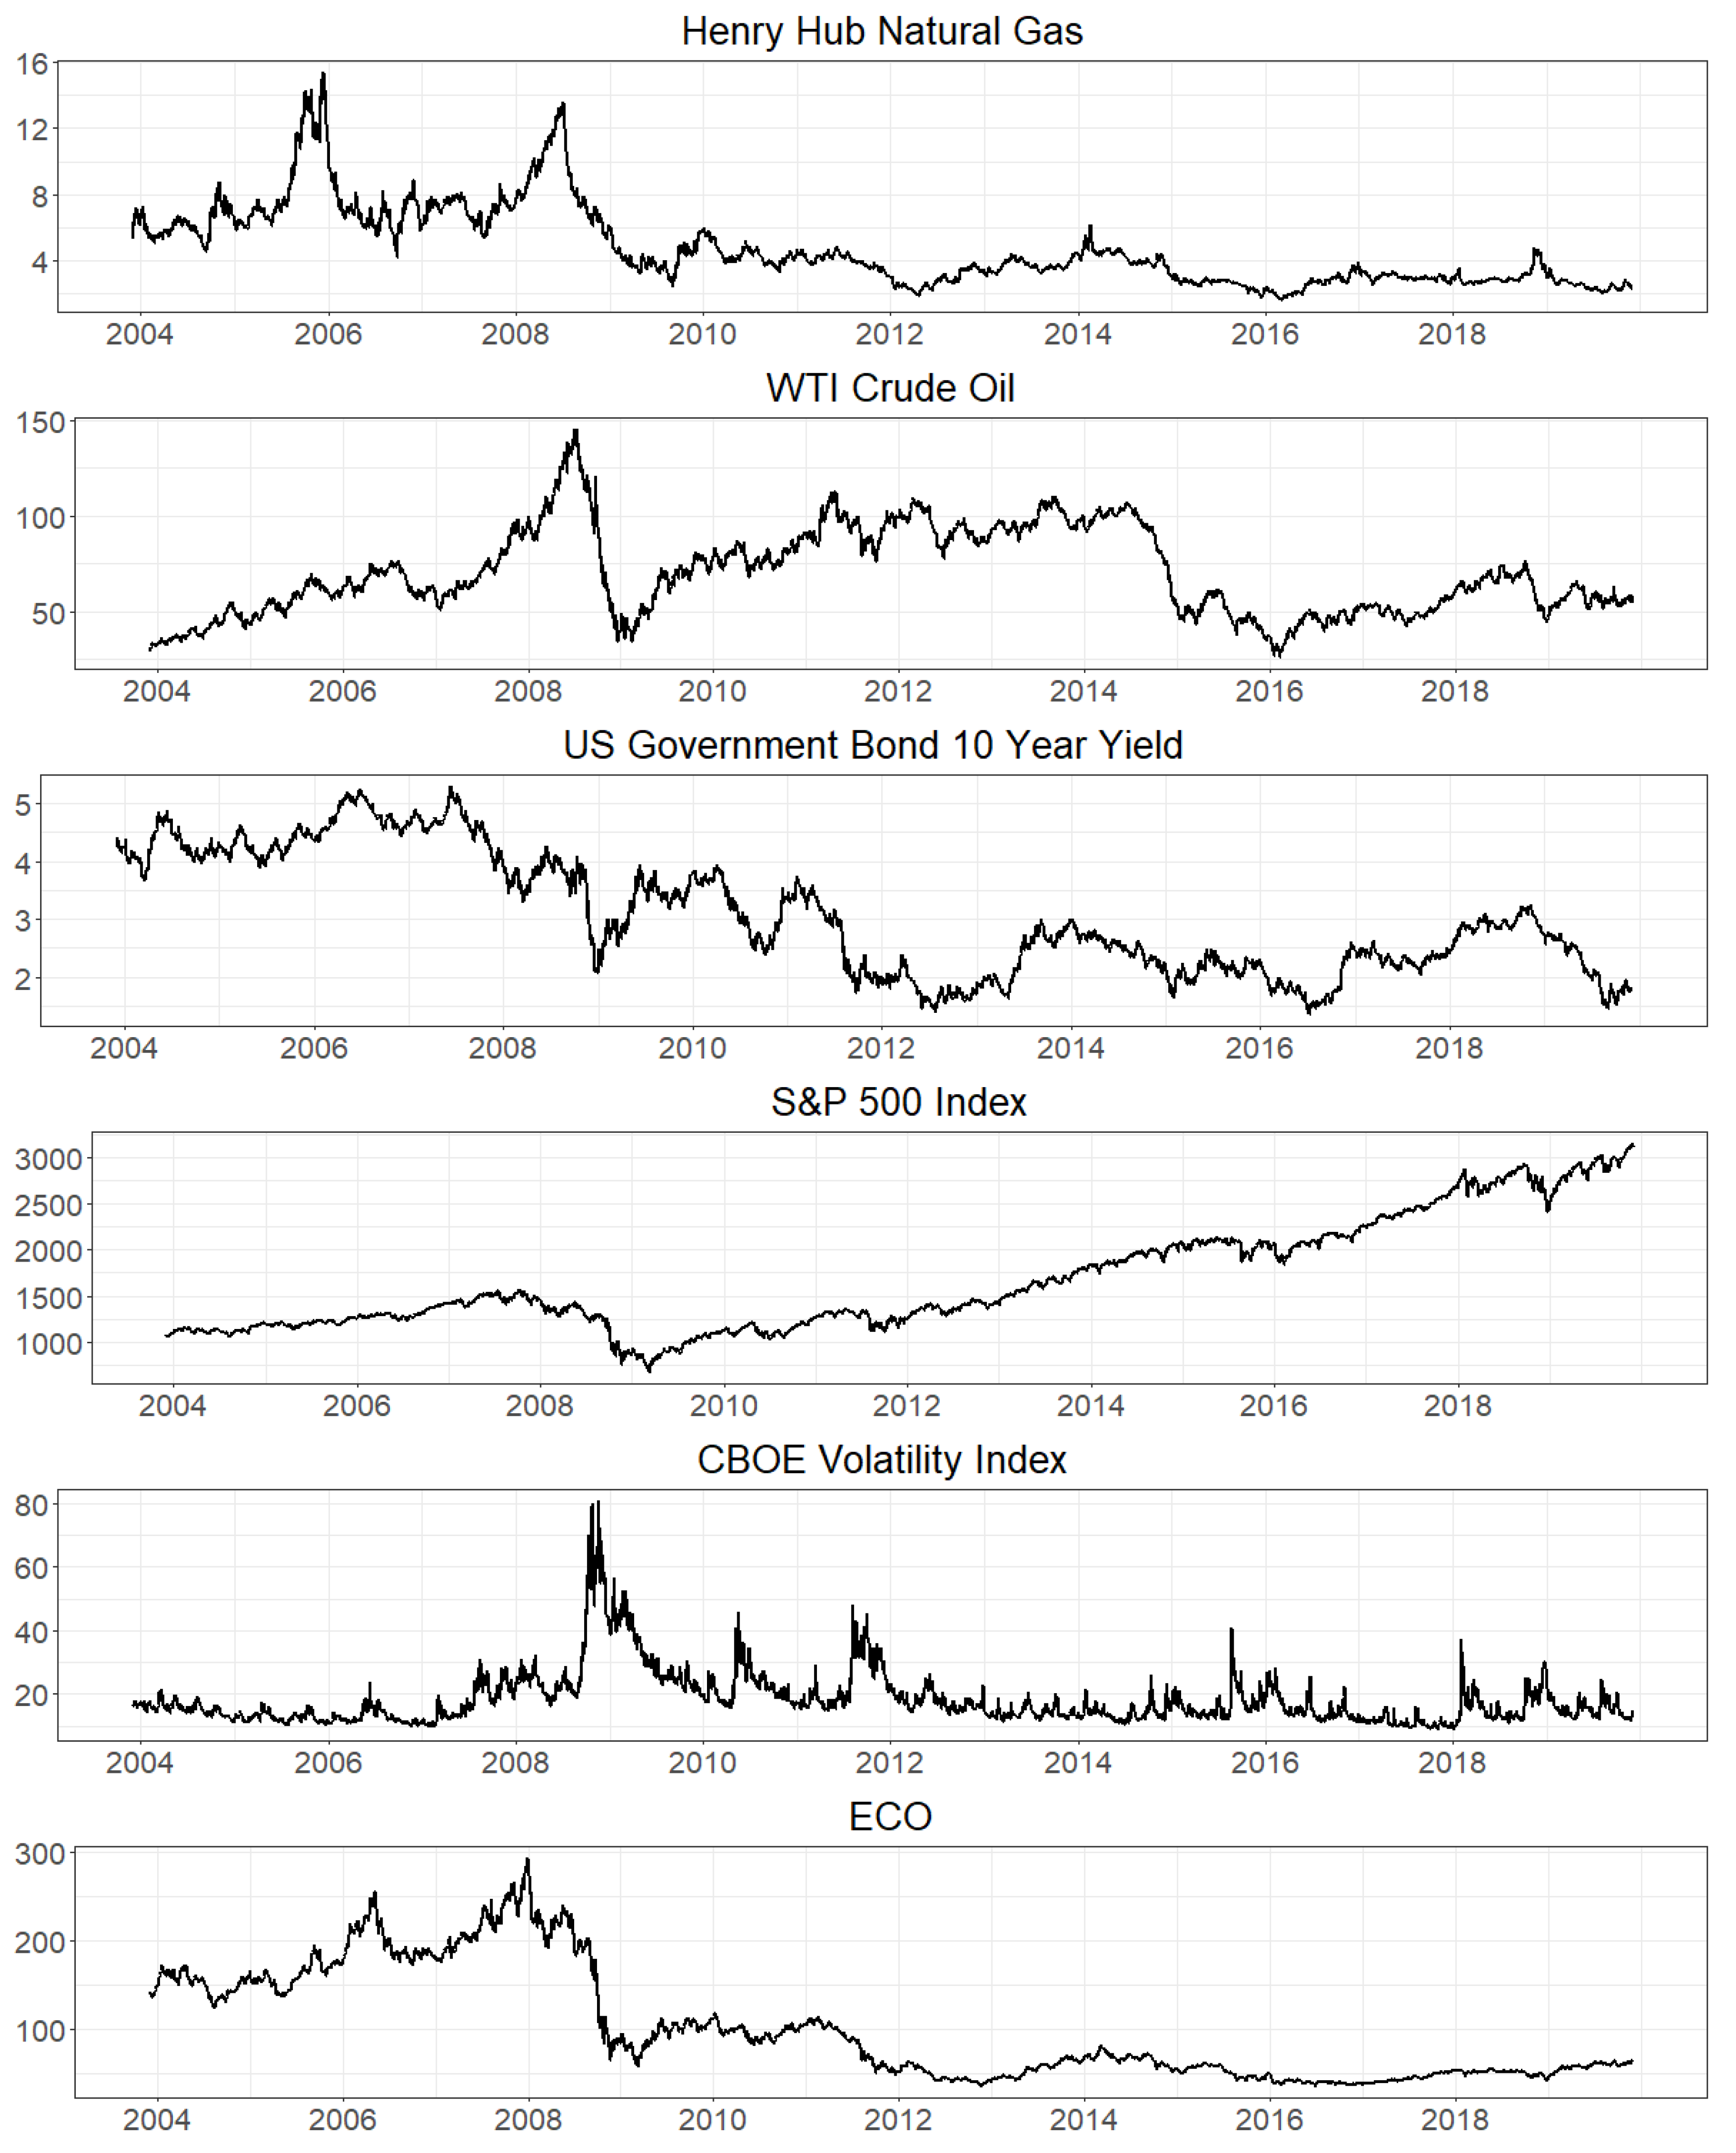
We investigated the spillovers from energy and traditional financial markets to renewable energy stocks via a comparative analysis between the US and Europe. For the energy markets, we used crude oil and natural gas futures, specifically WTI crude oil futures and Henry Hub natural gas futures for the US, and Brent crude oil futures and the UK National Balancing Point (NBP) natural gas futures for Europe. WTI crude oil is the benchmark for the United States and other North American regions, while Brent crude oil is an indicator of oil prices in African, European, and Middle Eastern. Henry Hub natural gas is the benchmark for North American natural gas prices, in which futures contracts are traded in New York Mercantile Exchange (NYMEX). The NBP natural gas market is used widely as a leading benchmark in Europe’s natural gas market.
For financial markets, we analyzed the stock markets, financial uncertainty indices, and government bonds for both regions. In the US, we used the S&P 500 index, the Chicago Board Options Exchange (CBOE) volatility index (CBOE VIX), and the 10-year US government bond (US Bond), and we used the EURO STOXX 50 Index, EURO STOXX 50 Volatility Index (EURO VIX), and the 10-year UK government bond (EU Bond) for Europe. The S&P 500 index tracks 500 large companies’ stocks in the US, which represents the performance of the whole stock market. The Euro STOXX 50 Index comprises the stocks of 50 corporations in the Euro Area, which covers many stocks from different European countries. CBOE VIX is a volatility index that reflects the uncertainty in the stock market in the US, computed from the S&P 500 option price. Likewise, EURO VIX is also a volatility index that could reflect the European stock market uncertainty, and it is calculated based on the EURO STOXX 50 options.
For clean energy stocks, we used the Wilder Hill Clean Energy Index (ECO) and the European Renewable Energy Index (ERIX) in the US and Europe, respectively. In the US, the ECO is an index that consists of approximately 40 companies whose businesses center on renewable energy processes and renewable energy technologies. The ERIX includes the largest European renewable energy companies involved in water, solar, biomass, wind, geothermal, and marine energy generation.
We employed daily data for the sample period covering 2 December 2003 to 2 December 2019 and including 3896 observations. We converted the local currencies into dollars at the daily exchange rate.
Table 1 lists the variables and sources for the variables used in this study.
Figure 1 and
Figure 2 describe the temporal dynamics prices of fossil energy markets, financial markets, and renewable energy prices in the US and Europe, respectively.
The returns are calculated by the first-order lagged differences in prices and the conditional variance series are extracted by fitting the autoregressive-generalized autoregressive conditional heteroscedasticity (AR-GARCH) model as the volatilities. It is generally known that the GARCH family is the most popular and famous volatility modeling approach. We chose conditional volatilities extracted using the fitted GARCH model because it is flexible, convenient to estimate, and has success when modeling many of the stylized facts about financial returns, especially the presence of clusters of volatility.
Table 2 and
Table 3 provide the descriptive statistics for the returns and volatilities of the variables in the US and Europe, respectively.
As
Table 2 shows, the mean returns for WTI and the S&P 500 are positive, while the remaining variables for the US are negative. On the other hand,
Table 3 shows that the mean returns for all variables in Europe are positive, except for the returns on NBP, EU Bond, and EURO VIX.
Table 2 and
Table 3 show that the S&P 500 has the highest mean returns in the US and the ERIX has the highest mean returns in Europe. In terms of skewness, the returns of US Bonds and the S&P 500 are left-skewed, while the returns of the other US variables are right-skewed. Moreover, the returns of Brent, the STOXX 50, and the ERIX are left-skewed, while the returns of other European variables are right-skewed. The returns of all variables in the US and Europe are leptokurtic. On the other hand, in the US, the CBOE VIX is the most volatile, while the EURO VIX is the most volatile in Europe. Additionally, the volatility of all variables in the US and Europe are right-skewed and leptokurtic. From
Table 2 and
Table 3, the Jarque–Bera (JB) test results show that the returns and volatilities of all variables in the US and Europe are non-normality at the 1% significance level. The Augmented Dickey-Fuller (ADF) unit root test and the Philips and Perron (PP) unit root test results indicate that all variables are stationary at the 1% or 5% significance level in the US and Europe.
5. Empirical Results and Discussion
5.1. Full-Sample Spillover Analysis
We estimated four six-variable VAR models (with returns and volatility sets) for the US and Europe and selected the lag length of the VAR model by the Schwarz criterion (SC). Following the Diebold–Yilmaz approach, the VAR models and generalized variance decomposition were applied in this paper to analyze the full-sample return and volatility spillover effects from the energy and financial markets to renewable energy stocks in the US and Europe. Subsequently, we applied the methods of Barunik and Krehik and Toyoshima and Hamori [
38] and decomposed the results of the Diebold–Yilmaz spillover indices into three different frequencies: “Frequency H” refers to high frequency, which corresponds roughly to 1 to 5 days, “Frequency M” refers to the medium frequency, which corresponds roughly to 5 to 21 days, and “Frequency L” refers to the low frequency, which corresponds roughly to 21 days to infinity. Based on Barunik and Krehik [
16], the length of forecasting horizon requires no more than 100 days, otherwise the methodology will not work. Thus, we chose a forecasting horizon (H) of 100 days ahead (for contrast, we also analyzed the forecasting horizon (H) of 150, 200, and 300 days in
Appendix A and show the similar results).
Table 4 illustrates the return spillover effects from fossil energy prices (crude oil, natural gas), the stock market index, VIX, and 10-year government bond yields to renewable energy stocks in the US and Europe based on the Diebold–Yilmaz approach (the full version of return spillover tables are presented in
Appendix B,
Table A3 and
Table A4). In
Table 4, the values in the third and sixth rows show the strength of the return spillover from natural gas, crude oil, bonds, stocks, and the VIX to renewable energy stocks in the US and Europe, respectively. The last column of the table, “Directional Spillover (From)” represents the total return spillover effects of the ECO and ERIX received by all the other data series (crude oil, natural gas, bonds, stocks, and the VIX).
The main findings are as follows. First, the total return spillovers from the fossil energy markets and financial variables to ECO (9.22%) in the US are slightly higher than those from fossil energy markets and financial variables to the ERIX (8.19%) in Europe.
Second, the stock markets transmit the highest return spillovers to renewable energy stocks, both in the US (28.62%) and Europe (30.11%), which far exceed the spillovers from fossil energies (natural gas and crude oil) to renewable energy stocks. This result implies that stocks influence renewable energy stock returns the most in the US and Europe. Because the renewable energy index is a subset of the stock market, it is not surprising that the movement of the overall market is likely to affect it. The results are consistent with Inchauspe et al. [
25], who analyzed the role of energy prices and stock market indices as explanatory factors for the excess returns of the NEX through a multi-factor asset pricing model with time-varying coefficients. They found a strong influence of the MSCI World Index and a weak influence of changes in the crude oil price. Thus, they state that stock market indices such as the MSCI are the significant pricing factor for renewable energy stocks.
Third, the return spillovers of renewable energy stocks to the VIX in the US and Europe are 16.03% and 11.23%, respectively. Therefore, the VIX has a significant influence on renewable energy stocks and a greater effect on renewable energy stocks in the US as well. The VIX can be used to measure financial uncertainty and shows the market’s expectations of future volatility. The CBOE VIX and EURO VIX are common benchmarks for the volatility of the US and European stock market, respectively. Lundgren et al. [
8] studied the behavior of renewable energy in response to uncertainty variables such as the VIX and the financial stress (FS) index by using linear and non-linear Granger causality tests and found a direct relationship between them. Their result implies that the prices of renewable energy stocks will reflect uncertainty, highlighting investors’ perception of the importance of considering uncertainty. Dutta [
39] also used a volatility index to measure uncertainty in international crude oil markets and found that clean energy stock returns are influenced significantly by volatility index.
Fourth, the bond markets transmit return spillovers to renewable energy stocks in the US of 5.41%, and in Europe of 2.15%, which indicates that government bonds influence the investment in renewable energy stocks in the US and Europe, but not as much as the stock markets do.
Finally, both the returns of crude oil and natural gas transmit only limited spillovers to renewable energy stocks, while crude oil transmits higher return spillovers to renewable energy stocks than does natural gas (4.98% and 0.27% in the US, 4.99% and 0.68% in Europe). Song et al. [
40] also suggest strong return spillovers to the renewable energy stock market transmitted from the crude oil market, while other fossil energy markets such as coal and gas transmit weaker return spillovers to the renewable energy stocks.
Table 5 reports the results of return spillover under the Barunik and Krehilk methodology, which decomposes the Diebold–Yilmaz spillover indexes in
Table 4 into three different frequencies. The return spillovers from fossil energy prices (natural gas, crude oil), the stock market index, VIX, and 10-year government bond yields to renewable energy stocks in the US and Europe are the highest at high frequencies, followed by the medium and low frequencies. The result denotes that return shocks are transmitted from the energy and financial markets to renewable energy stocks within only one week. Ferrer et al. [
19] investigated the connectedness between the stock prices of US clean energy companies, crude oil, and many financial variables in the frequency domain based on the frequency connectedness approach. Their results also suggest that most of the return connectedness is generated in the very short term.
Similarly,
Table 6 shows the volatility spillover from fossil energy prices (natural gas, crude oil), the stock market index, VIX, and 10-year Government Bond Yields to renewable energy stocks in the US and Europe (the full version of volatility spillover tables are presented in
Appendix B,
Table A5 and
Table A6).
Similar to return spillover, the total volatility spillover effects from the fossil energy markets and financial variables to ECO (10.24%) in the US are also higher than the total volatility spillover of the ERIX (7.19%) to the variables in Europe. This finding implies that the volatilities of renewable energy stocks are more susceptible to the volatility of natural gas, crude oil prices, and financial variables in the US than in Europe.
In the US, the volatility spillover from stock markets is the highest (46.38%), followed by crude oil (6.70%), the VIX (5.90%), bonds (2.32%), and natural gas (0.12%). In Europe, the volatility spillover from the stock market is also the highest (32.15%), followed by the VIX (7.56%), crude oil (1.58%), natural gas (1.57%), and bonds (0.27%).
Additionally, it is worth noting that the stock market in the US can explain most of the changes in the volatilities of renewable energy stocks (46.38%), which is even higher than the self-explanatory power of renewable energy stocks.
Table 7 presents the results of volatility spillover in the frequency domain. As opposed to the results in
Table 5, the total volatility spillover is higher at low frequencies, followed by the medium and high frequencies. The result reveals that the transmission of volatility shocks from the fossil energy and financial markets to renewable energy stocks in the US and Europe is slower than that of return spillovers. The transmitted shocks have long-lasting effects on the volatility of renewable energy stocks.
5.2. Time-Varying Spillover Analysis
Lastly, since only focusing on spillovers in the whole sample would be insufficient, we used the rolling-window method to calculate the time-frequency dynamics of spillovers. For the rolling window, we also made the length of forecast horizon to keep 100 trading days and set the 500 trading days window size, which ensures the stationarity of the series and a sample size that is large enough in each VAR estimation.
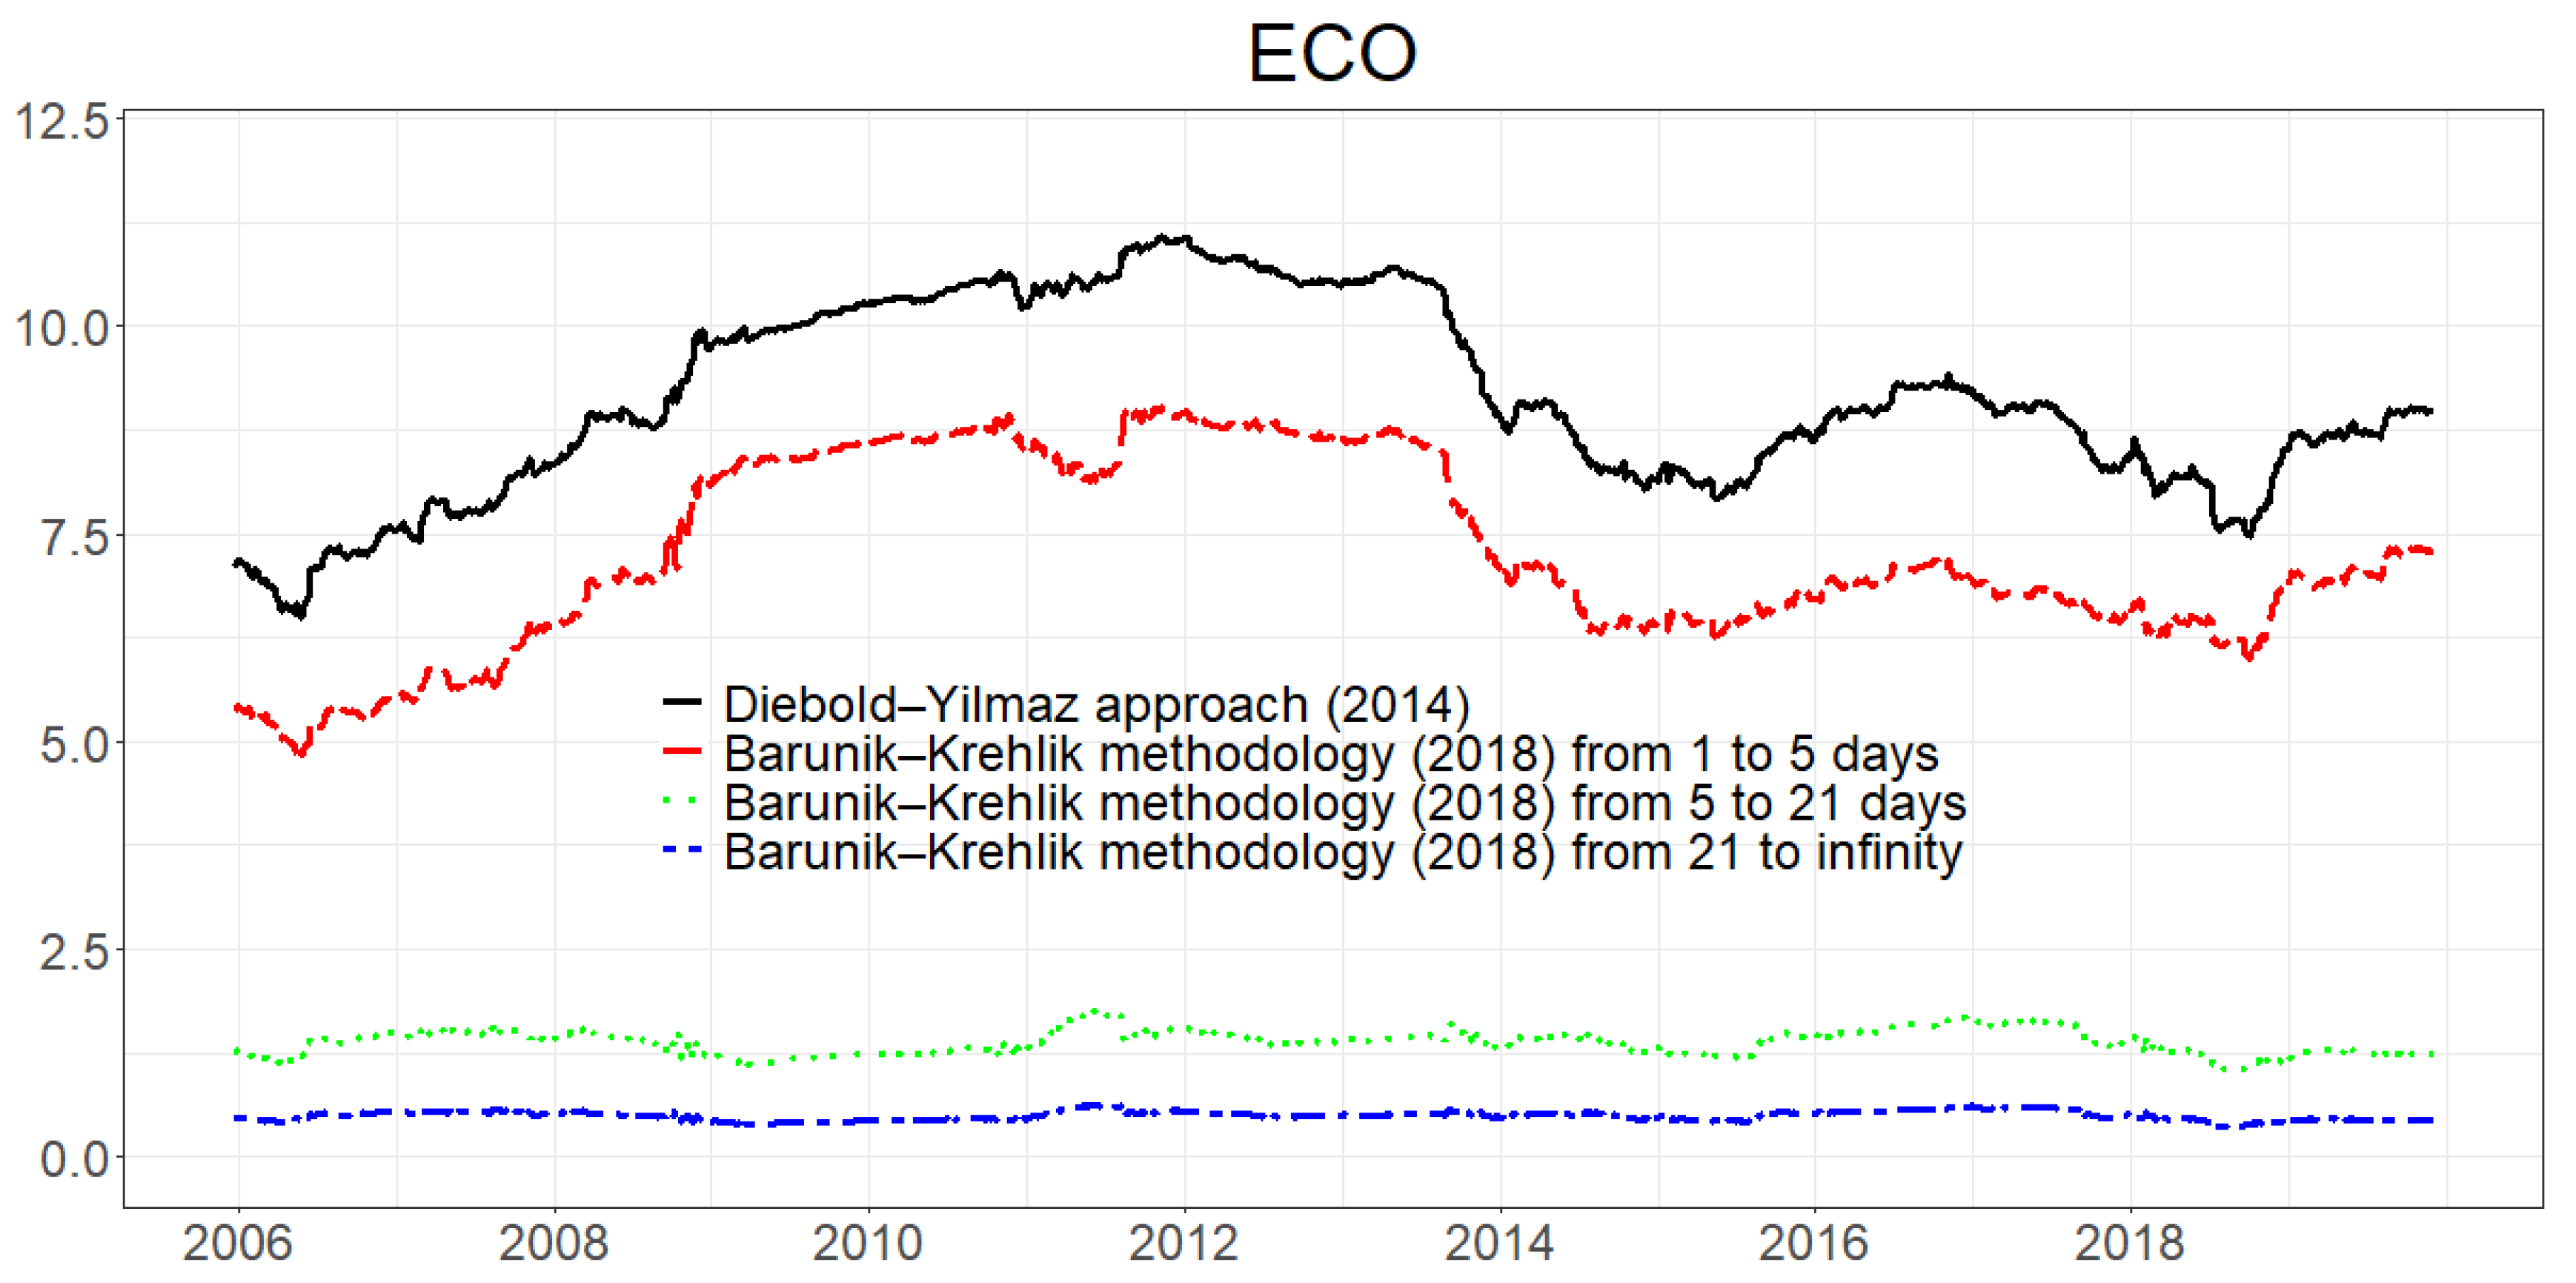
Figure 3 and
Figure 4 reveal the time dynamics of the directional return spillovers (from) of renewable energy stocks in the US and Europe, respectively. There are many parallels between the changes in spillovers in the two regions. The return spillovers from all energy markets and financial variables to renewable energy stocks in both the US and Europe increased steadily during the 2008 global financial crisis and reached a peak during the European debt crisis. This result supports the view that a link between the commodity and financial markets would increase during periods of financial turmoil [
41,
42]. According to Ferrer et al. [
19], we can interpret the increased spillover via uncertainty. Market participants review and process any positive or negative information more thoroughly during a period of high uncertainty, thus stimulating a rapid increase in spillovers to renewable energy stocks. After the global financial crisis and the European debt crisis, the decrease in uncertainty during the global recovery period caused a short, temporary decrease in spillovers before 2015. However, in November 2014, the Organization of Petroleum Exporting Countries (OPEC) announced that it would maintain production despite the declining price. The uncertain market dynamics under the new OPEC supply strategy generated larger spillovers from the crude oil market to renewable energy stocks. This is why the return spillovers to renewable energy stocks in both regions increased drastically after 2015. Also, the last sharp increases in return spillovers in the two regions may be tied to the 2018 China–US trade war, which led to stock and bond market instability. Additionally, for investors, the turning points in return spillover correspond to renewable energy stock markets’ highs in most cases, which can be considered as the selling signals.
Additionally, in
Figure 3 and
Figure 4, we also decomposed the dynamics of the directional return spillovers into three different frequency domains using the Barunik and Krehlik methodology. The long-dashed (red) line refers to the high-frequency (1–5 days) spillover, the dotted (green) line refers to the medium-frequency (5–21 days) spillover, and the two-dash (blue) line refers to the low-frequency (over 21 days) spillover. The return spillovers are most concentrated in the highest frequency band (1–5 days). This result implies that shocks to any market are transmitted to renewable energy stocks for one week because of the high information processing speed in the markets. Importantly, it is worth noting that only the dynamic spillovers at the high frequency (1–5 days) are very similar to those from the Diebold–Yilmaz approach. However, the dynamic spillovers at lower frequencies are quite different. For example, at the end of 2008, the global financial crisis possibly increased the high-frequency (1–5 days) spillovers, which is similar to that from the Diebold–Yilmaz approach (black line). However, it reduced spillovers at lower frequencies. The results may help to clarify how extreme events affect spillovers at different frequencies and may remind investors to consider the different length of the investment horizon when making their financial decisions, especially during the financial turmoil.
On the other hand,
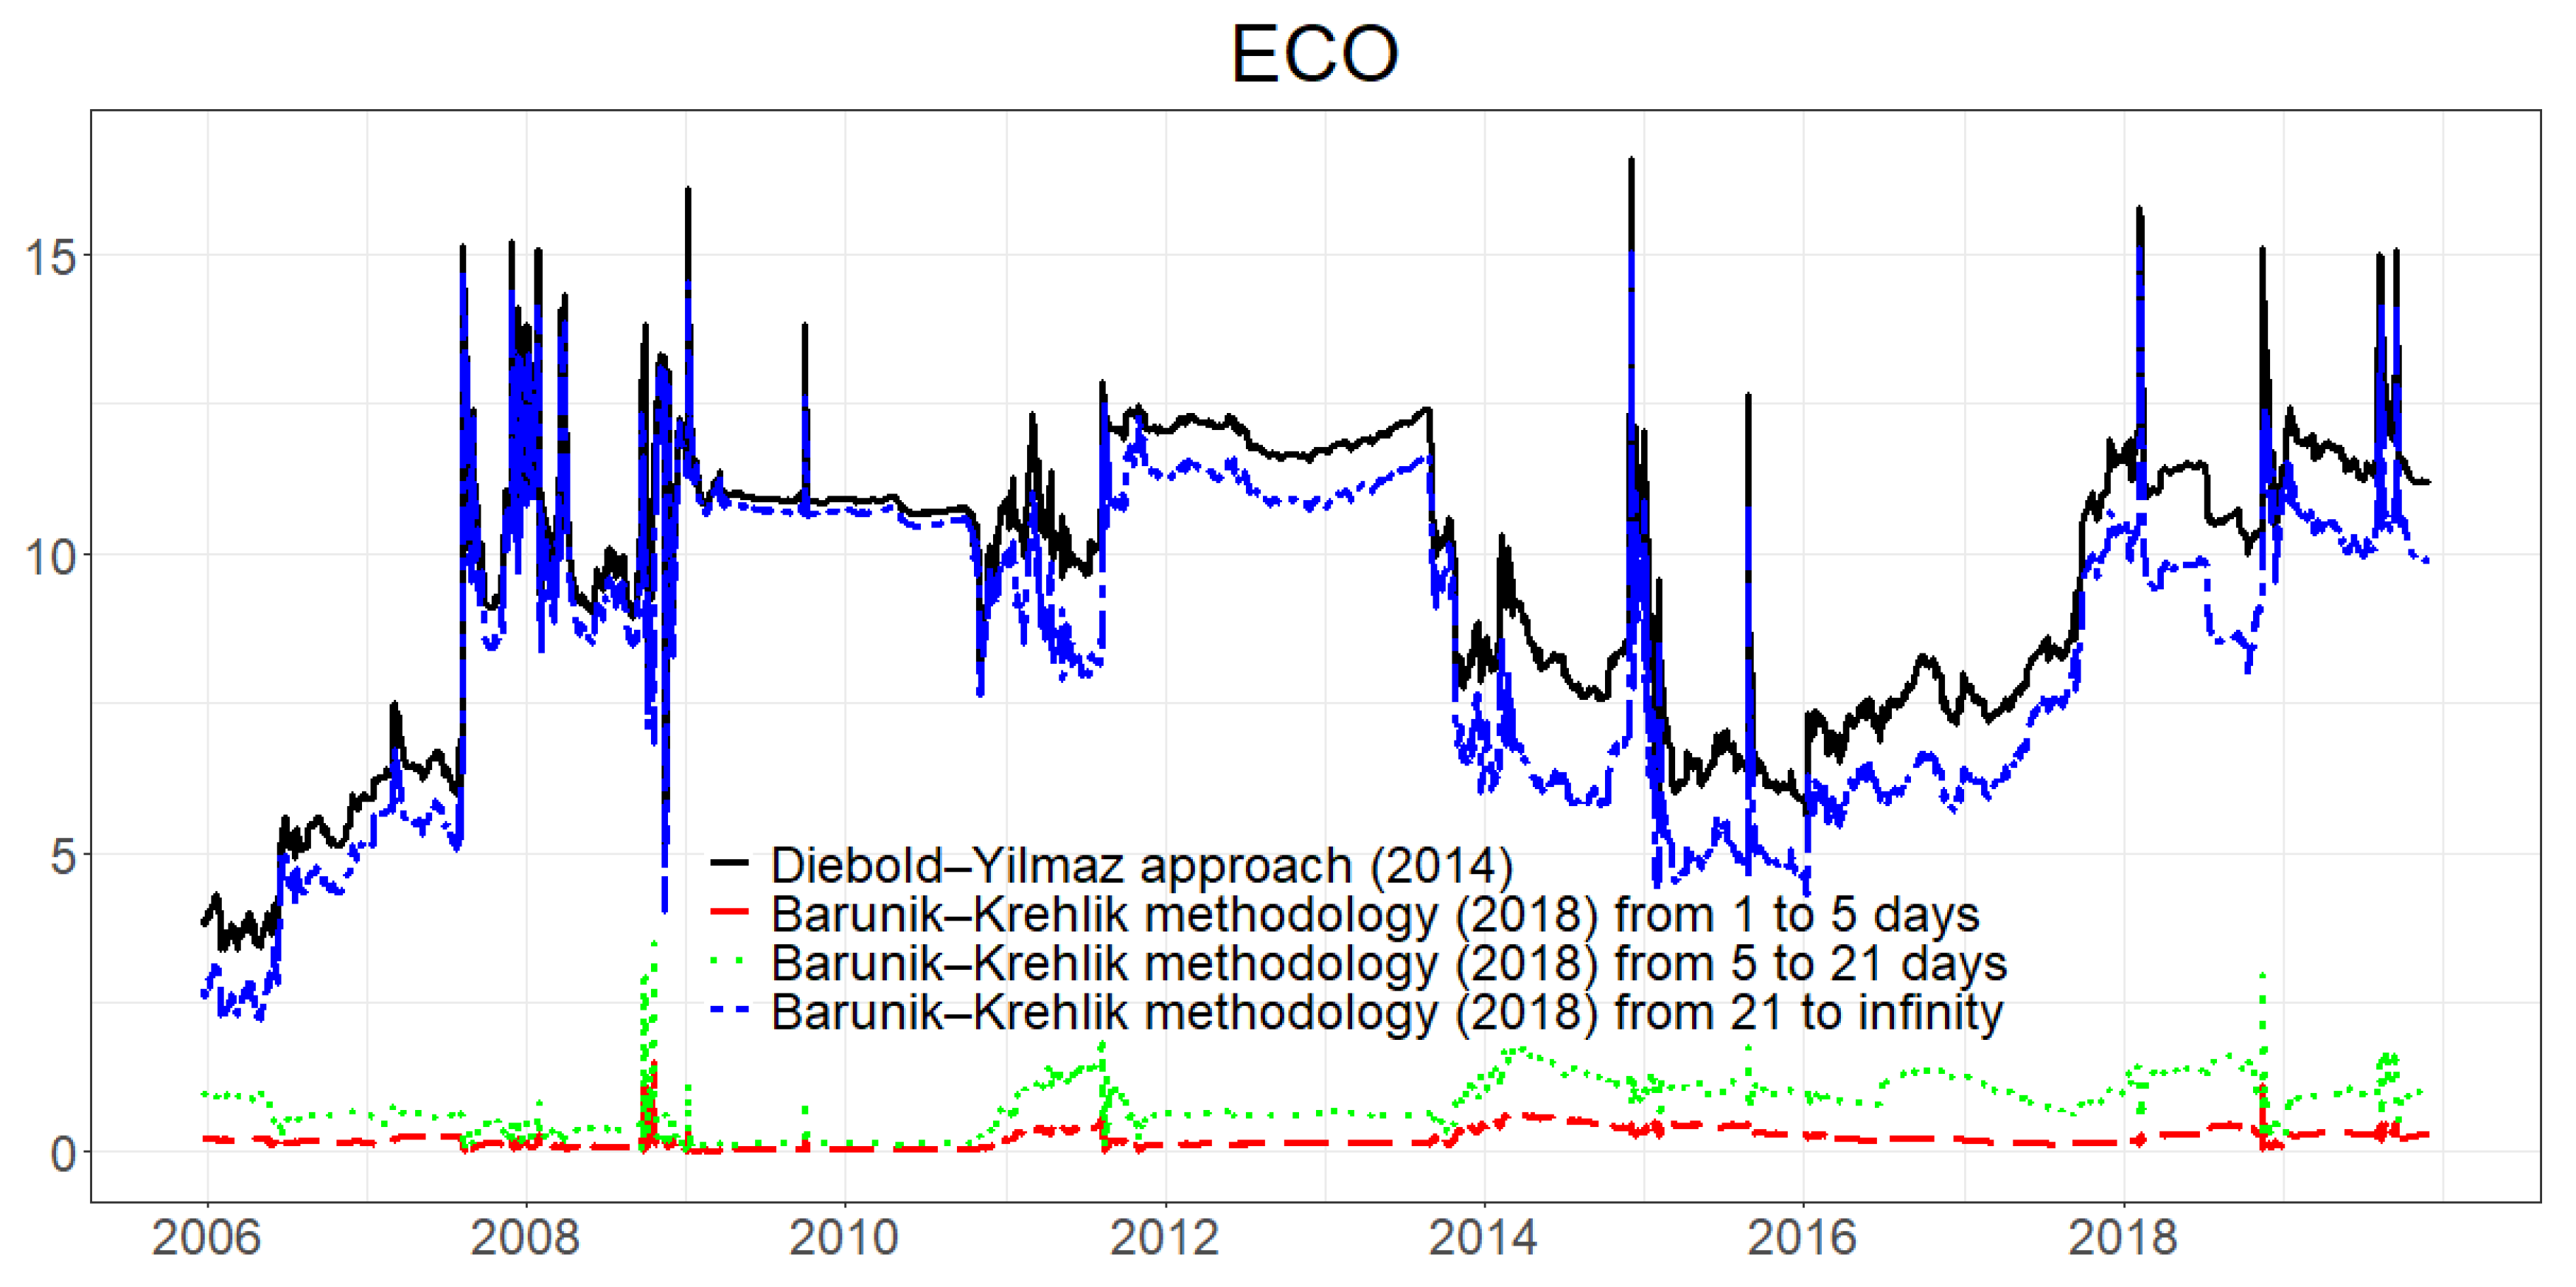
Figure 5 and
Figure 6 show the time dynamics of the directional volatility spillovers (from) of renewable energy stocks in the US and Europe, respectively. Unlike the relative smoothness of return spillovers, volatility spillovers change more rapidly, especially when extreme market events erupt. This result further implies that the total volatility spillover is more sensitive to extreme events. For instance, in both regions, we see fluctuations during the 2008 global financial crisis and the 2011 European debt crisis, sharp increases after OPEC’s announcement in 2014, and the China–US trade war in 2018. However, in 2016, we see a sharp increase in Europe, but not in the US. One explanation could be Brexit; that is, the withdrawal of the UK from the EU. In June 2016, the UK voted to leave the EU by 51.89% (for leave) to 48.11% (for remain). The Brexit referendum result led to stock and bond market instability in the UK and Europe, and in turn, generated higher risk spillovers to the ERIX. On the other hand, for investors, the turning points in volatility spillover are always corresponding to the market lows, which can be taken as the buying signals.
Similarly,
Figure 5 and
Figure 6 also decompose the dynamics of directional volatility spillover into three different frequency domains based on the Barunik and Krehlik methodology. Unlike the spillovers of return, the spillovers of volatility are mostly concentrated in the lowest frequency (over 21 days) in both regions. As He et al. [
41] state, volatility shocks to any market will not be transmitted to other markets immediately, which implies that transmitted shocks show long-lasting (long memory) effects on other market volatilities.
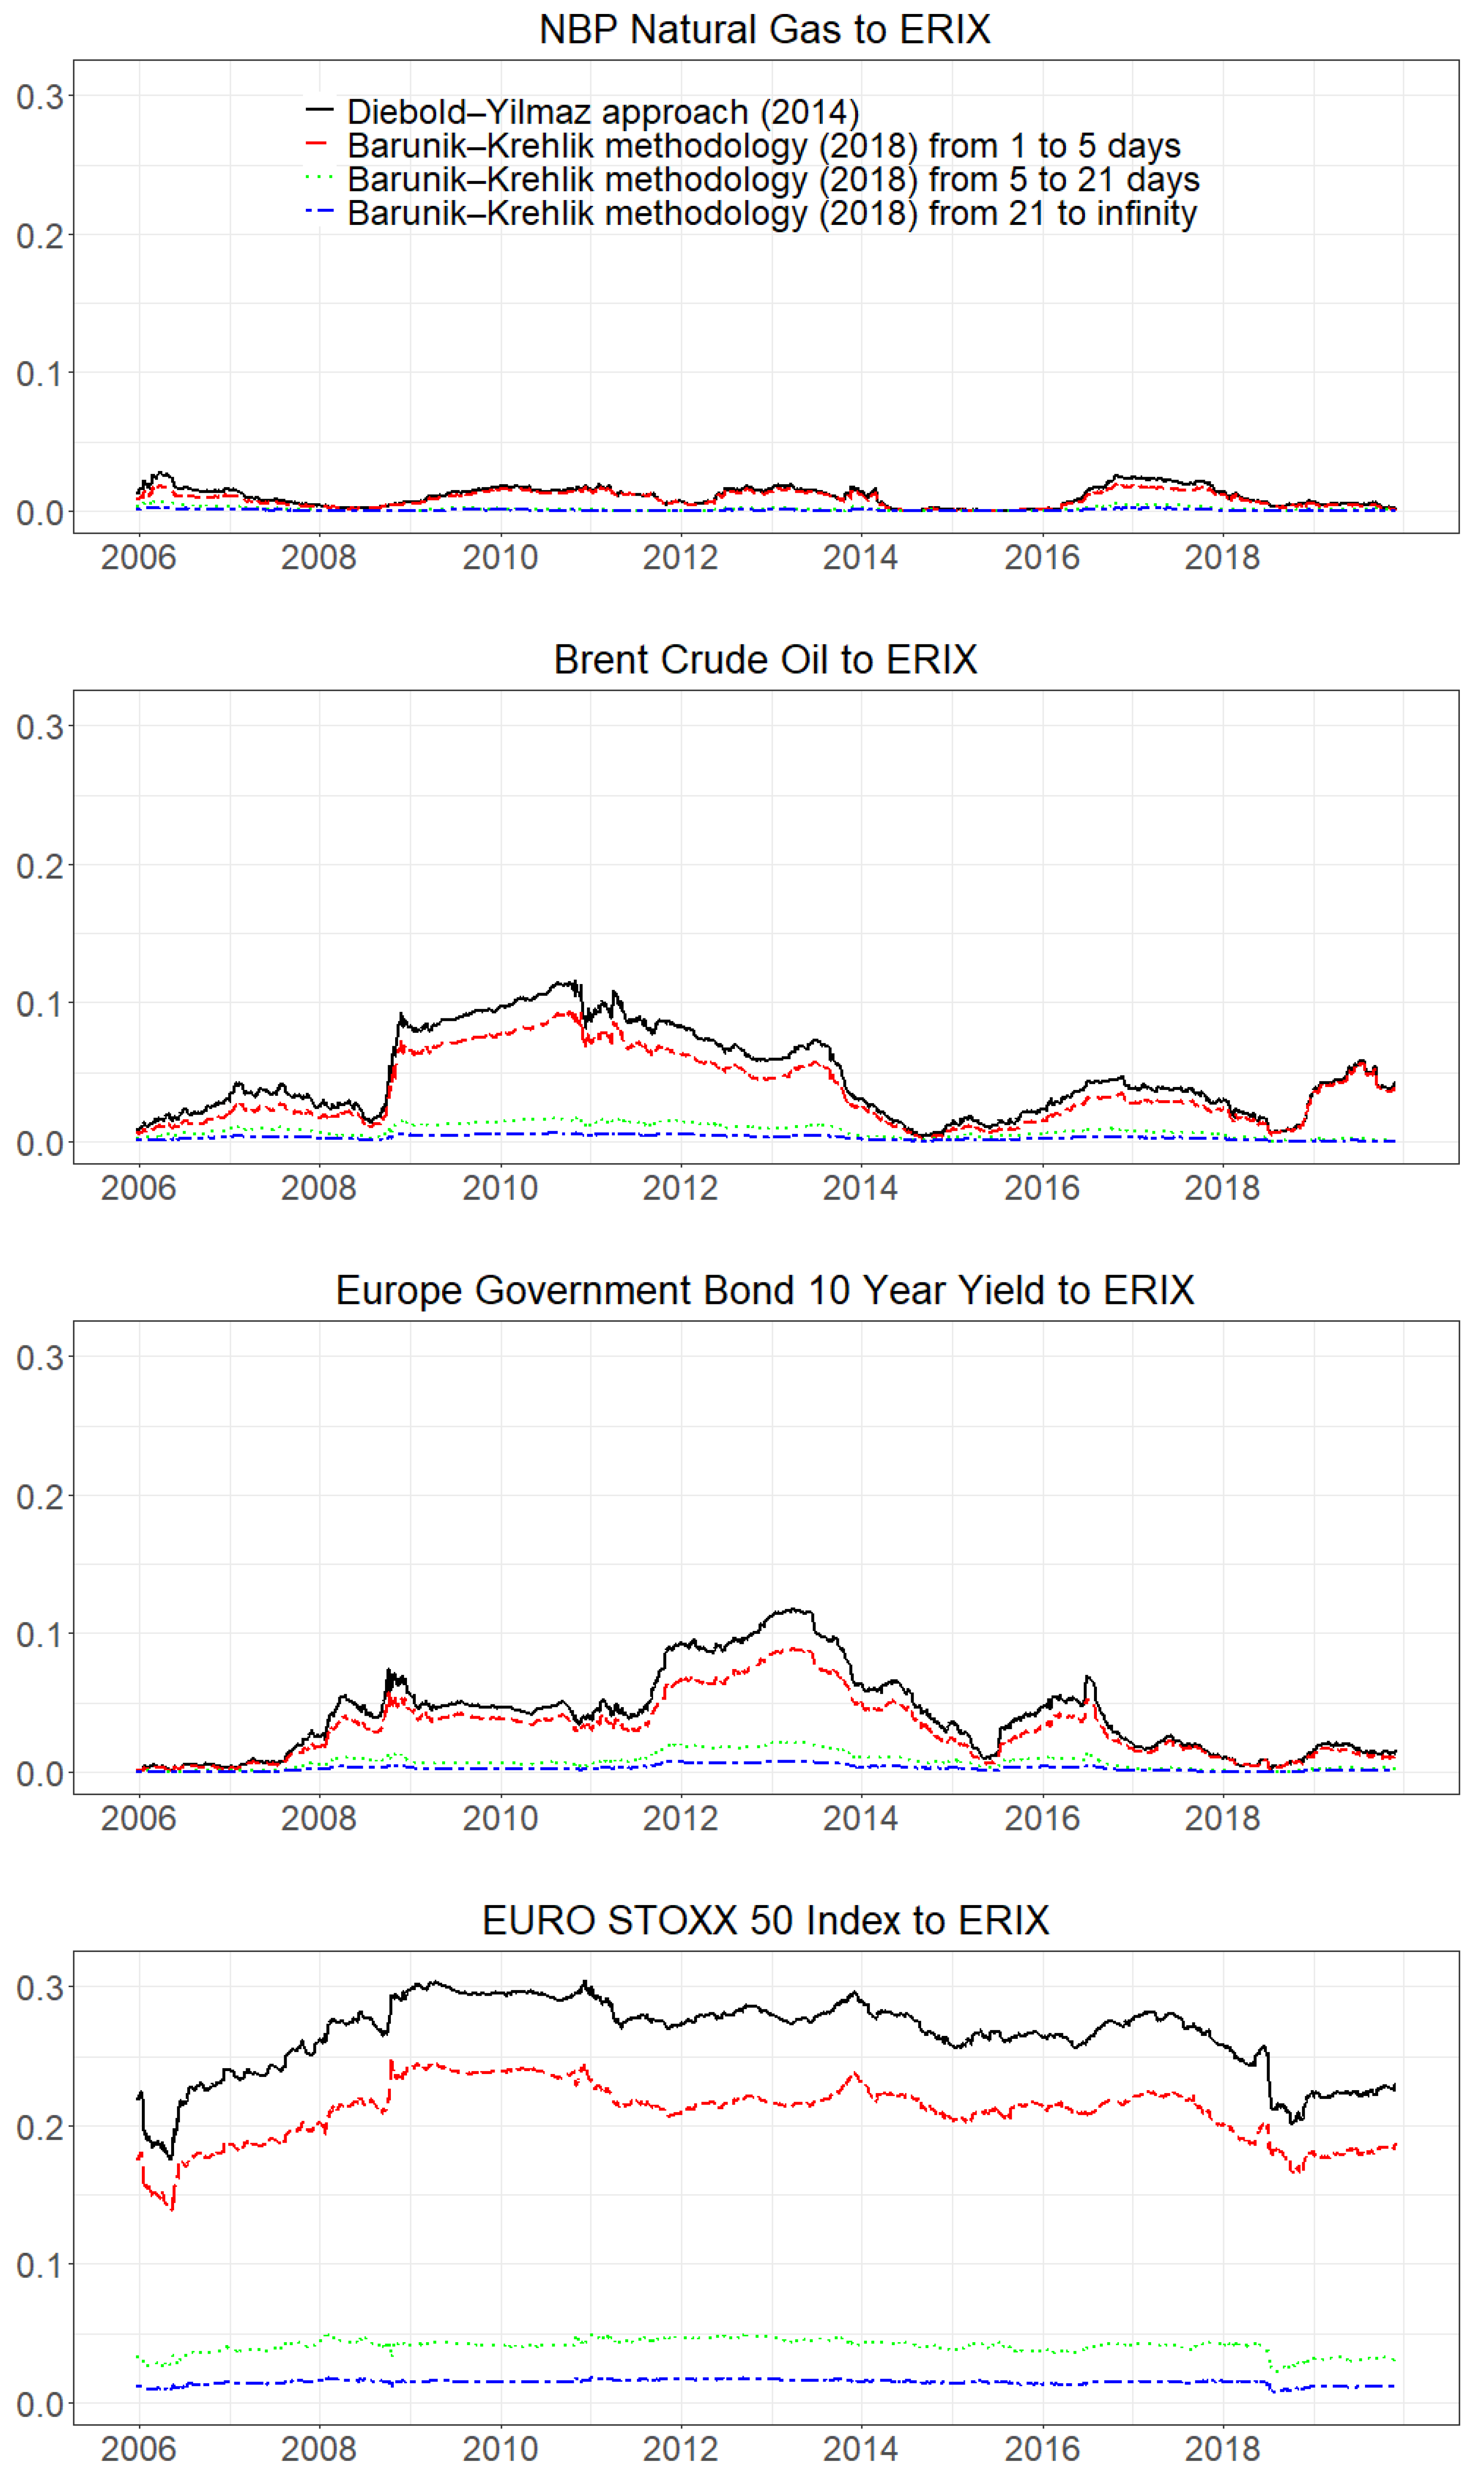
Figure 7 and
Figure 8 show the time dynamic pairwise return spillovers from fossil energy prices (natural gas and crude oil), the stock market index, the VIX, and 10-year government bond yields to renewable energy stocks in the US and Europe, respectively.
The return spillovers from crude oil to ECO are similar to the spillover to the ERIX. Both are possibly influenced by the global financial crisis in 2008, the European debt crisis in 2011, and OPEC’s 2014 announcement. On the other hand, between natural gas and renewable energy stocks, due to the collapse of natural gas prices at the end of 2005 and the global financial crisis in 2008, both the return spillovers from the natural gas market to the ECO and ERIX increased drastically during these periods. However, from 2012 to 2014 and from 2016 to 2017, we see two increases that also appear in the spillover from the natural gas market to the ERIX but not in that to ECO. The two increases may be tied to the European debt crisis and the Brexit referendum. Inadequate pipeline infrastructure and limited liquefied natural gas transport capacity caused a lack of liquidity in natural gas markets. Thus, natural gas markets are fragmented and region-centric, which is different to the integration of world crude oil markets. Thus, the European debt crisis and Brexit referendum mainly affected the spillover from NBP natural gas to the ERIX. The return spillover from the bond market to ECO is similar to the spillover to the ERIX. Both are possibly influenced by the global financial crisis in 2008, the European debt crisis in 2011, and OPEC’s 2014 announcement. Also, in both the US and Europe, we see a similar pattern in the return spillovers of renewable energy to the stock index and VIX. This result indicates that the two stock market financial indexes may have a similar impact on the renewable energy returns.
On the other hand,
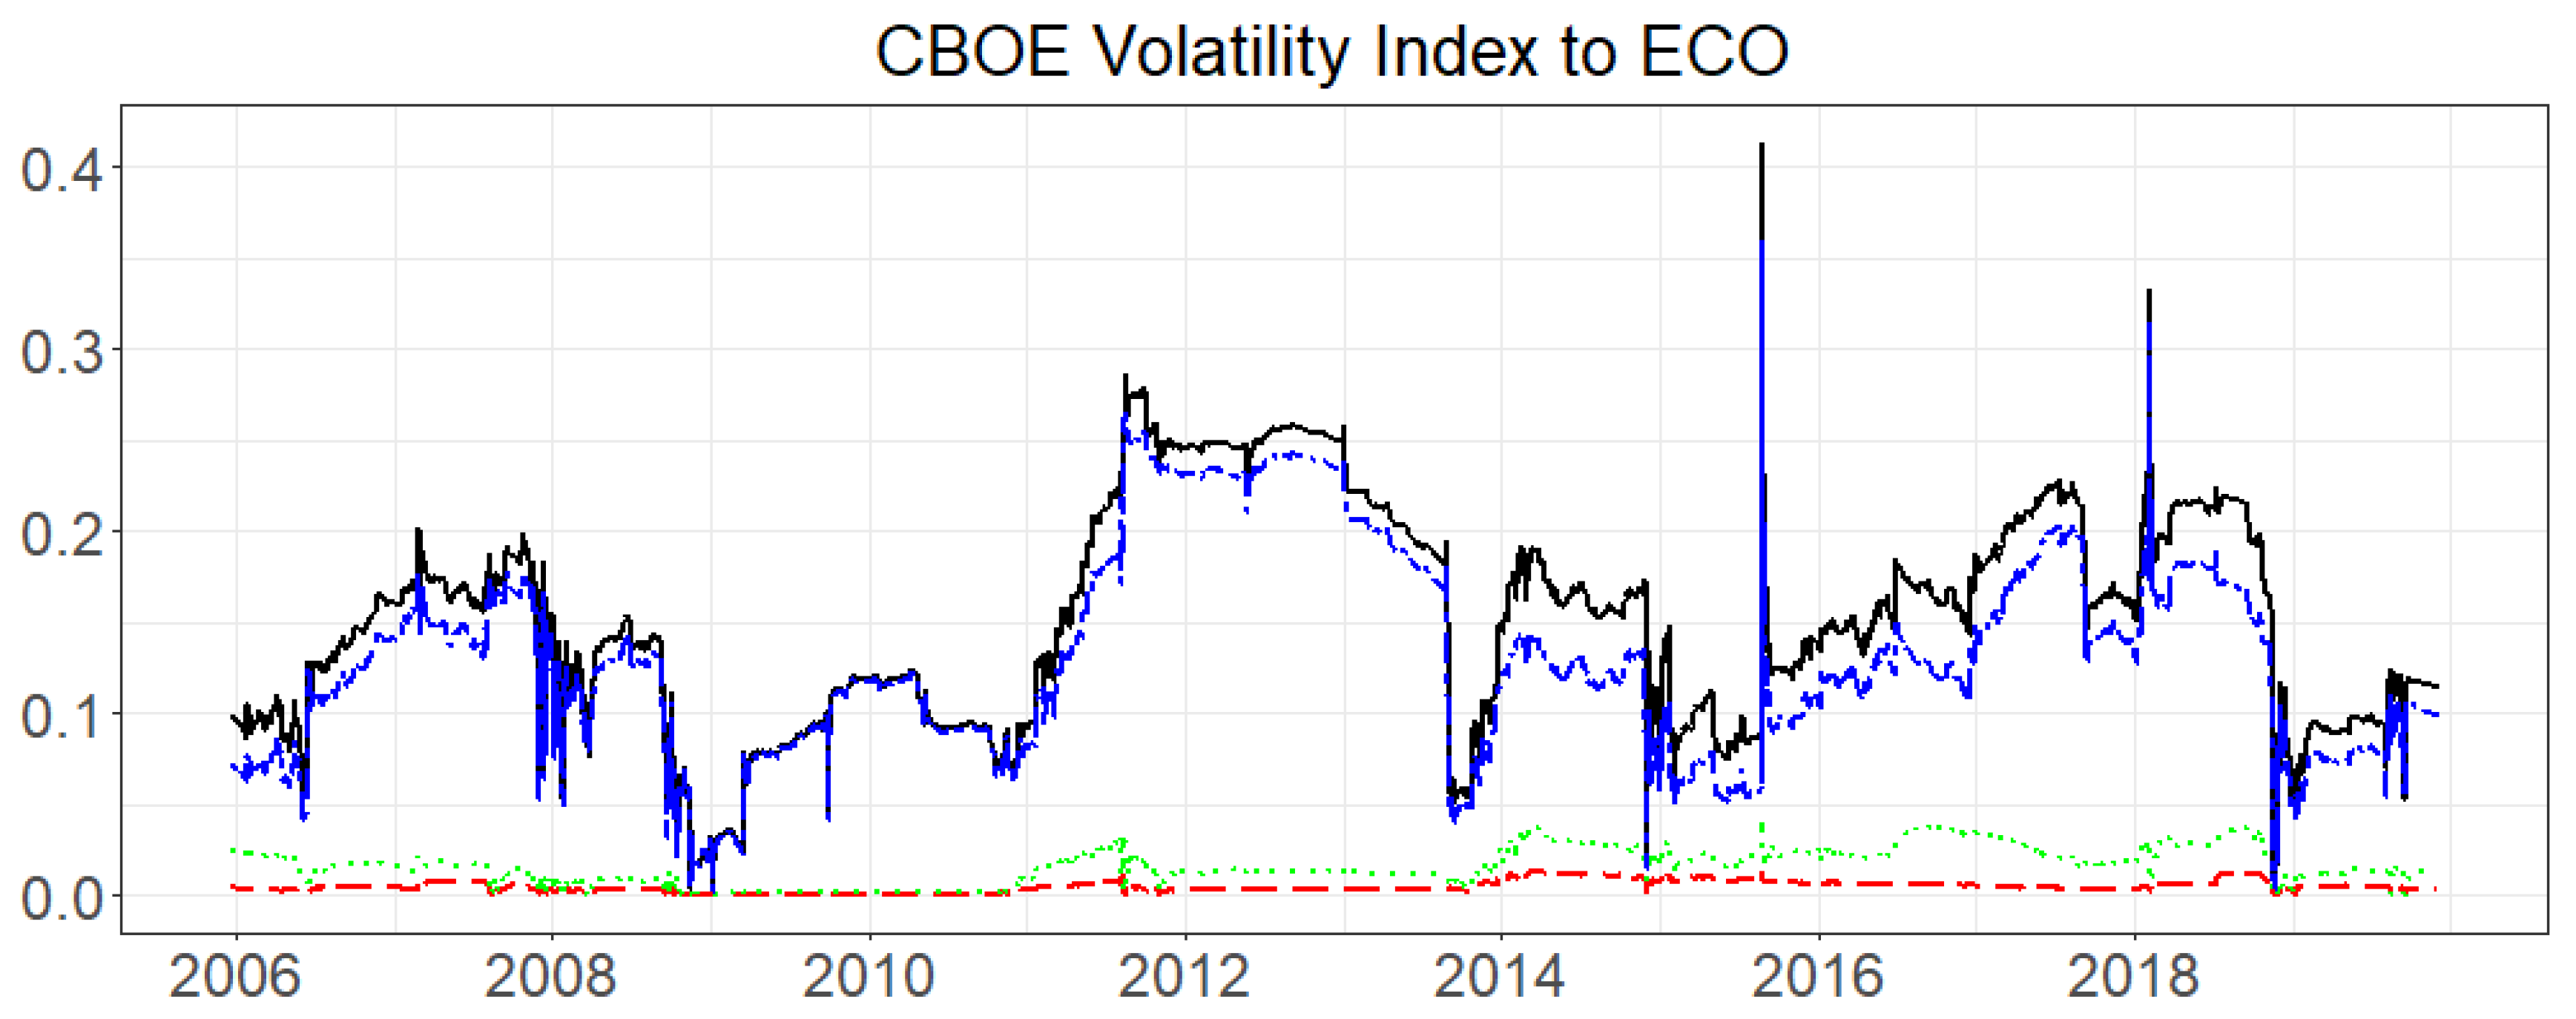
Figure 9 and
Figure 10 represent the time dynamic pairwise volatility spillovers from all variables to renewable energy stocks in the US and Europe, respectively. As we mentioned previously, in contrast to the relative smoothness of return spillovers, volatility spillovers change more rapidly, especially when extreme market events erupt. The result further implies that the total volatility spillover is more sensitive to extreme events. In
Figure 9 and
Figure 10, we see that volatility spillovers from crude oil to renewable energy stocks increase drastically during extreme events, such as the 2008 global financial crisis, the 2011 European debt crisis, and OPEC’s 2014 announcement. In particular, the influence of the China–US trade war in 2018 exclusively increased the volatility spillover from WTI crude oil to ECO. As another fossil fuel, the volatility spillover from Henry Hub natural gas to ECO remained at a relatively low level and increased sharply only when some extreme events occurred, which is different from Europe. On the other hand, the volatility spillovers from the bond market to renewable energy stocks in the US and Europe were both significantly influenced by the 2008 global financial crisis. We see wild fluctuations in both regions during that period. Also, in Europe, due to the Brexit referendum in June 2016, we found a sharp rise in the spillovers of the ERIX to the bond and stock markets. The Brexit referendum first affected these markets, then the shocks propagated through the markets and finally impacted renewable energy stocks. Interestingly, unlike the return spillovers, the time dynamic volatility spillovers of renewable energy to the stock index and VIX are quite different. For instance, at the end of 2010, volatility spillovers from the S&P 500 to ECO decreased, while spillovers from the VIX to ECO increased.
6. Conclusions
With the increasing global environmental pollution and energy crisis, investment in renewable energy has become a concern for investors in recent years. In this study, we investigated the return and volatility spillovers transmitted from fossil energy prices (crude oil and natural gas) and several key financial variables (the stock market, VIX, bond yields) to renewable energy stocks in the time and frequency domain with two empirical methods introduced by Diebold and Yilmaz [
15,
17,
18] and Barunik and Krehlik [
16]. As the top country (region) with renewable energy capacity investments, the US and Europe are frequently taken as the objects of academic research, i.e., see References [
2,
19,
24,
26]. However, due to the different policies in the US and Europe, it is necessary to do a comparative analysis to examine whether the spillover effects on renewable energy stocks (the ECO and ERIX) in the US and Europe differ.
Finally, we found some differences between the US and Europe in the full-sample spillovers as follows.
First, the total return and volatility spillovers from fossil energy markets and financial variables to ECO in the US are higher than those from fossil energy markets and financial variables to the ERIX in Europe. This result implies that investors in the US should pay more attention to the propagation of shocks across markets, especially during financial turmoil.
Second, in the US, the volatility spillover from the stock market is highest, followed by crude oil, the VIX, bonds, and natural gas. However, in Europe, the volatility spillover from stock markets is also the highest, but followed by the VIX, crude oil, natural gas, and bonds. Notably, the volatility spillovers from the stock market to renewable energy stocks are larger than those from renewable energy stocks to their own in the US. This result implies that the composition of investments in a portfolio hedge for clean energy stock prices can be quite different in two regions and reminds local investors of the need to adjust hedging strategies to local conditions.
Certainly, there are also some similarities between the US and Europe.
First, in both regions, the stock market transmits the highest return spillovers to renewable energy stocks, which far exceed the spillovers from fossil energies (natural gas, crude oil) to renewable energy stocks. This result implies that, overall, performance of the stock market has the most impact on renewable energy stock returns in the US and Europe, which is also consistent with previous research, such as that by Ferrer et al. [
19], Inchauspe et al. [
25], and Sadorsky [
26].
Second, in both regions, we found that the spillovers of return and volatility are contingent on frequency. Meanwhile most of the return spillovers concentrate in the highest frequency (1 to 5 days), while most of volatility spillovers concentrate in the lowest frequency (over 21 days), which indicates that the return shocks transmitted from fossil energy and financial variables to renewable energy stock will not exceed one week, while the volatility shocks have long-lasting effects on the renewable energy stocks’ volatilities.
On the other hand, since it would be insufficient to consider only spillovers in the whole sample, by using the rolling-window method, we also compared the dynamic spillovers in the US and Europe.
First, our results revealed that the return spillovers from all energy markets and financial variables to renewable energy stocks in both the US and Europe increased steadily during the 2008 global financial crisis and reached a peak during the European debt crisis period. Thereafter, the return spillovers to renewable energy stocks in both regions increased drastically after 2015 and 2018 because of the OPEC’s 2014 announcement that it would maintain production despite declining prices, and the China–US trade war, which led to stock and bond market instability from 2018. He et al. [
41] and Bhardwaj et al. [
42] also stated that the links between commodity and financial markets would increase during periods of financial turmoil. A plausible explanation is that market participants review and process any positive or negative information more thoroughly during a period of high uncertainty, thus stimulating an increase in spillovers to renewable energy stocks.
Second, in contrast to the relative smoothness of return spillovers, volatility spillovers change more rapidly, especially when extreme market events erupt. This finding further implies that the total volatility spillover is more sensitive to extreme events. Hence, in order to reduce risk spillovers when confronted with market crises, fundamental measures should be taken by policy-makers. Meanwhile, we found that many extreme market events, such as the 2008 global financial crisis, the 2011 European debt crisis, OPEC’s 2014 announcement, and the 2018 China–US trade war, caused fluctuations or sharp increases in volatility spillovers in both the US and Europe. However, there are also some extreme events, such as the Brexit referendum in 2016, that influenced volatility spillovers, mostly across European markets.
Amid the profound changes unfolding in global financial markets, our findings may provide useful insights into the risk management, portfolio diversification of investment, and hedging strategies for renewable energy investors with different investment horizons in the US and Europe. Also, there are still some problems that need to be resolved in the future. For instance, we can investigate the reason why the time-varying spillover effects exist during the sample period. This could be a future study direction.


