Article

Study on Characteristic and Energy of Argillaceous Weakly Cemented Rock under Dynamic Loading by Hopkinson Bar Experiment

1
State Key Laboratory for Geomechanics and Deep Underground Engineering, China University of Mining and Technology, Xuzhou 221116, China
2
School of Mechanics and Civil Engineering, China University of Mining and Technology, Xuzhou 221116, China
*
Author to whom correspondence should be addressed.
Energies 2020, 13(12), 3215; https://doi.org/10.3390/en13123215
Submission received: 24 May 2020 / Revised: 16 June 2020 / Accepted: 18 June 2020 / Published: 20 June 2020

Abstract

:
To study the mechanical properties of argillaceous weakly cemented rock under dynamic loading, a sample reconstituted and graded loading scheme is firstly designed, and then the reorganization rock sample is used as the research object. Using a Hopkinson pressure bar test, the responses of an argillaceous weakly cemented rock mass under different reorganization loads and different impact velocities is studied, and changes in specimen shape after impact are also analyzed. The study found that with increased of the recombination load, the amplitude of the transmitted wave increases. With increasing impact velocity, the rate of the increase in the incident wave amplitude is much larger than that of the transmission wave amplitude. The dynamic stress–strain curve can be divided into a compaction stage, an approximate linear elastic stage, a microcrack growth stage and a strain softening stage. The larger the reorganization load is, the less obvious the compression stage of the stress–strain curve is, and the greater the elastic modulus is. The peak strength and elastic modulus increase with increasing strain rate before 500 s−1. When the reorganization load is increased, the deformation decreases, and its impact resistance increases. With increasing impact velocity, the deformation of the specimen increases.

1. Introduction

Due to the exploitation of coal resources, the main coal producing areas in China are gradually shifting to Inner Mongolia in the north, Xinjiang in the northwest and other areas with rich coal reserves [1,2]. Argillaceous weakly cemented rock is common in these mining areas [3] and has characteristics such as low strength, poor cementation, and a tendency for weathering. As a unique type of rock, argillaceous weakly cemented rock has a tendency to lose water and weathering in low humidity conditions, as well as to absorb water and sliming under high humidity conditions, and it has characteristics of soft rock and hard soil [4,5]. When the moisture content of argillaceous weakly cemented rock is low, it has brittle mechanical properties. In contrast, when the moisture content is high, argillaceous weakly cemented rock exhibits plasticity similar to that of soil [6]. The stability of such rock is extremely poor. After the excavation of rock roadways, due to the load disturbance [7,8], the internal cracks in the rock expand and penetrate the rock, and the mechanical properties markedly deteriorate. Due to the complex physical and mechanical properties of an argillaceous weakly consolidated rock mass, tunnel construction, safety maintenance and experimental research are difficult to conduct.
From the theoretical and experimental research perspective, this kind of soft rock exhibits unstable mechanical properties, and the constitutive relationship is very complex. Argillaceous weakly cemented rock has the basic material characteristics of rock. Primary fissures and joints are undeveloped and are similar to those of rock in a dry or natural anhydrous state. The rock readily disintegrates upon contact with water. With increasing water content, the rock gradually develops less solid characteristics and readily exhibits a mud and sand composition when saturated. Moreover, testing of this type of rock is difficult because of its low strength, cohesion between rock particles and core integrity [9,10].
At present, domestic and international scholars have conducted much scientific research and many industrial experiments on the mechanical properties [11,12,13], deformation, failure characteristics and mechanism [14,15], and theory and technology of soft rock roadways and surrounding rock control [16,17]. Little research has been performed on argillaceous weakly cemented rock [18,19], and even less work has been conducted to analyze the dynamic characteristics of such rock under dynamic loads.
Many articles and experimental studies have shown that the mechanical properties and constitutive relationships of rock under dynamic load are quite different from those under a static load [20,21,22,23,24]. However, further theoretical research and experimental verification are needed. In this paper, the problem of supporting argillaceous weakly cemented rock is examined based on theoretical analysis and dynamic impact testing, and the dynamic response of such rock is revealed. The effects of strength characteristics of this type of rock mass under dynamic impact are analyzed, and the effects of deformation and the strength characteristics of this type of rock after dynamic impact are analyzed through strength compression tests.

2. Materials and Methods

2.1. Materials

The specimens are obtained from the return air tunnel of Xiyi Coal Mine, Wujianfang Coalfield, Inner Mongolia. The sampling depth is approximately 300 m. The regional stratum mainly includes Cretaceous mudstone with poor cementation in a tertiary clay stratum [25,26,27]. The mechanical properties of this type of rock are very poor, and it exhibits severe water disintegration and weathering [28]. The sampled rock mass can be divided into black mudstone and grey mudstone according to its colour. The specimens used in this paper consist of grey mudstone, as shown in Figure 1.
X-ray diffraction (XRD) is a common method to measure rock composition at present [29,30]. According to the XRD analysis of grey mudstone, the main non-clay minerals are quartz, plagioclase, microcline and clay mineral, accounting for 58% of the total content, and the samples include microcline (5%) and clay mineral content (33%), mainly including illite, kaolinite, montmorillonite and illite-montmorillonite mixtures. Kaolinite accounts for the largest proportion, including more than 50% of the clay composition. The analysis of rock specimens shows that the density is 1.13 g·cm−3, the loose density is 0.73 g·cm−3, the liquid limit is 34.5%, and the plastic limit is 27.1%.
The mechanical properties of this rock type provide the basis for studying the mechanical properties, constitutive relationships and stability analysis of surrounding rocks after excavation of underground coal and rock strata [31,32,33]. If experimental studies of the mechanical properties are conducted by drilling argillaceous weakly cemented rock masses in primary formations, because of the unique physical and mechanical characteristics of this type of rock mass as well as other factors, the coring rate is abnormally low. However, the cementation method of argillaceous rock mass is studied in this paper. When the water content in argillaceous weakly cemented rock mass reaches a certain value, the rock mass exhibits plasticity, and structural reorganization occurs due to the mechanical environment. Therefore, to study the mechanisms of structural reorganization and evolution and the mechanical properties of a fractured argillaceous rock mass, the step loading method can be used to simulate the structural reorganization and evolution mechanisms under different supporting forces and disturbing stresses of the surrounding rock, and the corresponding argillaceous adhesion under a stress environment can be determined. Based on mechanical tests of the reconstructed rock mass, the evolution of the mechanical properties of the reconstructed argillaceous weakly cemented rock mass under stress state can be revealed according to the support force.
The reorganization device applied to the argillaceous weakly cemented rock mass structure consists of a loading system, die and data acquisition system, as shown in Figure 2. The reorganization device used in this experiment is self-developed. The loading system is mainly composed of two parts: a pressure device and a consolidation platform. The mold is welded at the cylinder wall and base. A symmetrical stiffening rib plate is present on the outer side of the cylinder wall. The data acquisition system is mainly composed of a displacement sensor, pressure box and DH3816 data acquisition instrument (developed and produced by Jiangsu Donghua Testing Technology Co., Ltd).
In this paper, grey mudstone with a high clay mineral content is selected, and the reorganization test scheme is formulated as follows. After crushing, drying and sieving, a specimen powder with a particle diameter less than 2 mm is obtained and used as the basic material for restructuring of argillaceous weakly cemented rock. A sprinkling pot method is adopted to add water to each layer so that the weakly cemented abrasive particles penetrate the structure, resulting in sufficient water contact with the particles. Basic materials with a moisture content of 15%, 20% or 25% are obtained using this method. The test sample shows that when the water content of the rock mass is 15%, the prepared sample meets the test requirements. Before filling the material, a release agent is coated on the inner wall of the mold to facilitate release. The rock mass particles, weighing approximately 800 g, are added several times and evenly compacted. The final filling height is approximately 150 mm.
This experiment examines the effect of the applied load on the strength and dynamic impact characteristics of argillaceous weakly cemented rock mass. The scheme for applying a graded load is designed according to standard geotechnical testing methods. The axial loads are set to 5 MPa, 10 MPa and 15 MPa and are loaded using a lever system. The scheme used to apply graded loads is shown in Table 1.
When the specimen is reorganized, a jack and reaction frame are used to demold it. After removing the specimens, they were numbered and wrapped with film to maintain freshness. The specimens were placed into a storage box and stored at room temperature in a dry environment until use.
The standard specimens required in this test are 50 mm in diameter and 50 mm in height, and the end surface is flat. The reconstructed samples of the argillaceous weakly cemented rock mass are 50 mm in diameter, have different heights and have an uneven end face. Therefore, the reconstructed samples are reprocessed. The specimens were cut to a height of 51 mm and then polished to a height of 50 mm with two end grinders. The reorganized specimens of argillaceous weakly cemented rock are shown in Figure 3.

2.2. Methods

The mechanical properties of argillaceous weakly cemented rock under dynamic impact are studied, and the influence of different recombination loads and impact velocities are examined.
The dynamic mechanical properties of argillaceous weakly cemented rock were studied by drop hammer and hydraulic servo, and a split Hopkinson pressure bar (SHPB) is used to analyse the mechanical properties of materials under different impact loads. In 1914, B. Hopkinson first used the principle of bar impact to realize the stress wave loading of materials, forming the prototype of SHPB test system. Kolsky separated the test rods and generated the SHPB test system that is widely used in modern studies. Since then, the SHPB test system has gradually become an experimental device for testing the dynamic mechanical properties of materials [34,35,36].
The conventional SHPB device is shown in Figure 4. This device consists of a transmitting cavity, a punch, an incident rod, a transmission rod, an energy absorption device and a data acquisition system.
In this paper, the SHPB system of the State Key Laboratory for Geotechnical and Deep Underground Engineering of China University of Mining and Technology is used. Layout of the SHPB experiment specimens was shown in Figure 5. The incident rod and transmission rod used in the SHPB experiment are 50 mm in diameter and 2000 mm in length, and the bullet is 50 mm in diameter and 400 mm in length. Steel is used to construct the bullets, incident rods and transmission rods and has a modulus of elasticity of 206 GPa and density of 7800 kg/m3. The trigger level is 0.3125 V, and the trigger mode is an inner trigger in the rising edge. During the experiment, 100 million data points were collected per second. The sampling frequency was set to 10 MHz, the sampling length was set to 10 K, and the sampling delay was set to −3 K.
The dynamic impact mechanical properties of argillaceous weakly cemented rock under different reorganization loads and different impact velocities are studied in this experiment. The experimental scheme is as follows. The reorganization loads of the specimens are 5 MPa, 10 MPa and 15 MPa. The water content of the specimen is maintained 15%, and the impact pressure is maintained at 0.5 MPa. According to the different reorganization loads, the tests were divided into three groups, and each group included three samples. The sample characteristics and impact pressure parameters are shown in Table 2.
The velocity of a neutron bomb is measured in the SHPB test by a photoelectric speed relay. Different impact velocities can be controlled by varying the impact pressure. The shock pressure P is set to 0.30 MPa, 0.40 MPa, 0.5 MPa and 0.6 MPa. To ensure the accuracy of each group of experiments, three shock experiments were conducted under each shock pressure condition. The impact load is changed by adjusting the external load pressure. The velocity of the impact rod under different impact loads was measured by a tachometer. The characteristic and impact pressure parameters of each group of specimens are shown in Table 3.
During the experiment, the velocity of the punch is recorded in the velocimeter, and the strain signal of the rod is recorded in the acquisition instrument. The traditional strain gauge data acquisition method is adopted in this experiment. The position of the strain gauge of the incident rod is 850 mm from the interface end of the incident rod and 580 mm from the interface end of the transmission rod and the interface end of the transmission rod.

3. Results

The data acquisition system of this test adopts the two-channel DH3816 ultra dynamic signal acquisition instrument. First, the basic parameters of the bar and sample are input into the configuration window. Second, the incident and transmitted data are imported into the system, and the horizontal datum is selected; the starting point of three waveforms is selected again to complete wave matching. Finally, the characteristic data required for the experiment are selected as the output. In this experiment, the stress–time, strain–time, strain rate–time and stress–strain data were obtained by data processing.

3.1. Waveform Analysis under Different Reorganization Loads

When the incident wave arrives at the contact section between the incident rod and the rock specimen, a part of the wave shape is reflected at the interface of the incident wave, and a portion of the transmission wave is produced at the same time. This part of the wave is transmitted to the transmission rod through the rock specimen. The amplitude of the transmitted wave is obviously smaller than that of the incident wave propagating in the incident rod, which is mainly caused by the energy consumed by the impact extrusion and specimen deformation of the argillaceous weakly cemented rock when the incident wave passes through the rock specimen. The strain waveforms of incident rod and transmission rod under different reorganization loads are shown in Figure 6, and the amplitudes of transmission wave under different reorganization loads are shown in Figure 7.
In this experiment, the reorganization load of the argillaceous weakly cemented rock is the only variable. The impact pressure is 0.5 MPa, and the moisture content is 15%. Figure 6 and Figure 7 show that the amplitudes of the incident and reflected waves of the specimens under different reorganization loads are similar, and the transmission wave increases with increasing reorganization loads. When the applied load is 5 MPa, the transmitted wave amplitude is 327.43 µm; when the applied load is 10 MPa, the transmitted wave amplitude is 415.95 µm; and when the applied load is 15 MPa, the transmitted wave amplitude is 574.19 µm. Regarding the energy, a greater recombination load resulted in a greater amount of energy entering the transmission rod from the incident rod through the specimen. That is, the larger the restructuring load is, the smaller the energy being absorbed by the specimen. When the stress wave acts on the specimen under dynamic impact, the energy loss of the specimen can be attributed to the compaction and deformation of the specimen. When the recombination load is small, more energy is absorbed during dynamic impact, which resulted in compaction and deformation of specimens. This shows the larger the reorganization load is, the lower the porosity is, which leads to smaller the energy loss in the process of impact and plasticity of such specimens. In contrast, the higher the porosity is, the greater the plasticity is.

3.2. Waveform of Specimen under Different Impact Velocities

The strain waveforms of incident rod and transmission rod at different impact velocities are shown in Figure 8.
Figure 8 shows that when a bullet impacts the incident rod, the strain waveform generated by the incident rod is similar to that of a rectangular wave, and the amplitudes of the incident wave and the transmitted wave increase with increasing impact velocity. When the impact velocity is 11.25 m·s−1, the strain amplitude of incident wave is 692 µm, and the transmission wave amplitude is 261 µm. When the impact velocity is 14.18 m·s−1, the strain amplitude of the incident wave is 965 µm, and the transmission wave amplitude is 273 µm. When the impact velocity is 16.23 m·s−1, the strain amplitude of the incident wave is 1128 µm, and the transmission wave amplitude is 292 µm. When the impact velocity is 18.99 m·s−1, the strain amplitude of the incident wave is 1393 µm, and the transmission wave amplitude is 301 µm.
When the incident wave arrives at the contact section between the incident rod and the rock specimen, a part of the wave shape is reflected at the interface of the incident wave, and a part of the transmission wave is produced at the same time. The part of the wave is transmitted to the transmission rod through the rock specimen. The amplitude of the transmitted wave is obviously smaller than that of the incident wave propagating in the incident rod. This phenomenon is mainly because when the incident wave passes through the rock specimen, part of the energy is consumed by impact extrusion of the weakly cemented rock mass and deformation of the specimen.
The maximum amplitudes of incident and transmitted waves at different impact velocities are shown in Figure 9.
As shown in Figure 9, when the impact velocity increases, the amplitudes of both the incident and transmitted waves propagating in the rod increase linearly. When the impact velocity increases from 11.25 to 18.99 m·s−1, the incident wave increases from 692 to 1393 µm with an increase rate of 101.3%, and the transmitted wave increases from 261 to 375 µm, with an increase rate of 43.68%. The rate of increase in the incident wave amplitude is faster than that of the transmission wave, and the increase in the transmission wave amplitude is slower with increasing impact velocity. This phenomenon mainly occurs because the plasticity of the argillaceous weakly cemented rock mass is increased under high water content conditions. When the incident wave passes through the argillaceous weakly cemented rock mass, the impact energy is absorbed by extrusion and deformation of the rock mass. The greater the impact velocity is, the more severe the rock is extruded and the more energy is lost. Therefore, the increase in the stress wave entering the transmission rod through the argillaceous weakly cemented rock mass was small.

3.3. Analysis of Constitutive Curve under Dynamic Loading

3.3.1. Stress–Strain Curve Analysis under Different Reorganization Loads

Stress–strain curves of argillaceous weakly cemented rock mass under different reorganization loads are shown in Figure 10.
Figure 10 shows that under the same strain rate and water content, the elastic modulus of argillaceous weakly cemented rock specimens increases with increasing recombination load, and the peak stress is independent of the magnitude of the recombination load. The stress–strain curve can be divided into three stages. In the first stage, the strain increases nearly linearly with the increase in stress, during which the specimen is compacted. The growth rate of specimens prepared under different loading conditions is different. According to the fitting results of the test data, the slope corresponding to the recombination load of 5 MP, 10 MPa and 15 MPa is 680, 861 and 1617, respectively. In this stage, the larger the recombination load is, the larger the slope is, and the elastic modulus reaches the peak value first. The maximum stress values corresponding to the three groups of tests are 70.738 MPa, 76.008 MPa and 77.48 MPa, respectively. In the second stage, with the increase in strain, the stress is maintained at a relatively stable level. In the third stage, the strain decreases linearly with the increase in stress. The rate of reduction of the three groups of specimens is almost the same, about 169.
When a specimen of argillaceous weakly cemented rock is reconstituted, it will have a greater reorganization load, more compact specimen pressure, and lower porosity. Under the opposite conditions, the specimen will have larger porosity. When a dynamic impact occurs, the specimen will have a larger recombination load and a smaller proportion of the compaction stage on the curve. When the recombination load is greater than 15 MPa, the stress–strain curve of the rock has almost no compaction stage, and it directly enters the approximate linear elastic stage. When the restructuring load is less than 10 MPa, the stress–strain curve has a distinct compaction stage; in the strain softening stage, a greater restructuring load results in greater residual strength.

3.3.2. Stress–Strain Curve Analysis under Different Impact Velocities

Stress–strain curves of argillaceous weakly cemented rock at different strain rates are shown in Figure 11.
Figure 11 shows that the dynamic elastic modulus and peak stress of argillaceous weakly cemented rock exhibit an obvious strain rate effect, and the dynamic elastic modulus and peak stress show an increasing trend with an increasing strain rate. Stress–strain curves of argillaceous weakly cemented rock at different strain rate masses can be divided into four stages. The first stage is close to the linear rapid growth stage. According to the data fitting results, the growth rates corresponding to strain rates of 267 s−1, 337 s−1, 432 s−1 and 503 s−1 are 3842, 4138, 7073 and 10810, respectively. In the second stage, the growth rate gradually decreased to zero. In the third stage, the elastic modulus decreases at a gradually increasing rate. In the fourth stage, it decreases at a small stable rate.
The figure shows that the stress–strain curves of such rock under different strain rates are also different. The larger the strain rate is, i.e., the greater the impact velocity is, the greater the amount of energy will be obtained at the beginning of stress at high strain rate. There is almost no compression time of the original crack at the time of reorganization, which makes the crack grow instantaneously, but the energy cannot cause further expansion of the crack. At low a strain rate, argillaceous weakly cemented rock will decrease in the initial stage. Regarding the energy, the original cracks and voids of the specimen shrink slowly under dynamic impact; therefore, the compaction stage is prolonged. The graph shows that when the strain rate is greater than 500 s−1, the stress amplitude of such rock exhibits a great decrease and then enters the plastic deformation stage. With increasing deformation, the stress decreases gradually because the strain rate is too large. And the impact destroys the internal structure of such rock when the strain rate is less than 500 s−1. At the same time, the stress amplitude of argillaceous weakly cemented rock exhibits no obvious decrease, but the specimen approximates the ideal plastic deformation.
The peak stress is the ultimate stress of rock material before reaching failure, and it is an important parameter for characterizing the bearing capacity of rock. In material mechanics, the peak stress of uniaxial compression of rock is also called the compressive strength. In mining engineering, the rock peak stress can provide a reference for the determination of engineering parameters such as the blasting material dosage, blasting angle and blasting volume.
Figure 12 shows that with increasing strain rate, the peak stress of argillaceous weakly cemented rock gradually increases. The whole change can be divided into two stages: the slow increase in the stress peak value and the fast increase in the stress peak value. At a low strain rate, when the strain rate increases, the increase in the stress peak value is small. The strain rate varies from 267 to 389 s−1, and the peak stress range is 7.35 to 24.4 MPa. At a high strain rate, the peak stress increases with an increasing strain rate, the peak stress rate is 432 to 562 s−1, and the peak stress range is 32.51 to 61.01 MPa. The plasticity and strength of the specimens increase with the increase of strain rate. Because there are more microcracks in the specimens when the impact load is larger, the failure mode is gradually transferred from a relatively complete large block to a small or even comminuted state. With the increase in deformation and energy absorption of the specimen, the load that the specimens can bear increases, which means the strength increases.

3.4. Analysis of Morphological Characteristics

Studying the morphological characteristics of argillaceous weakly cemented rock after impact can deepen the understanding of the impact process and of the dynamic mechanical characteristics of the influence of the restructuring load and impact speed on the process. In this section, the height and diameter of argillaceous weakly cemented rock specimens are analysed after impact.

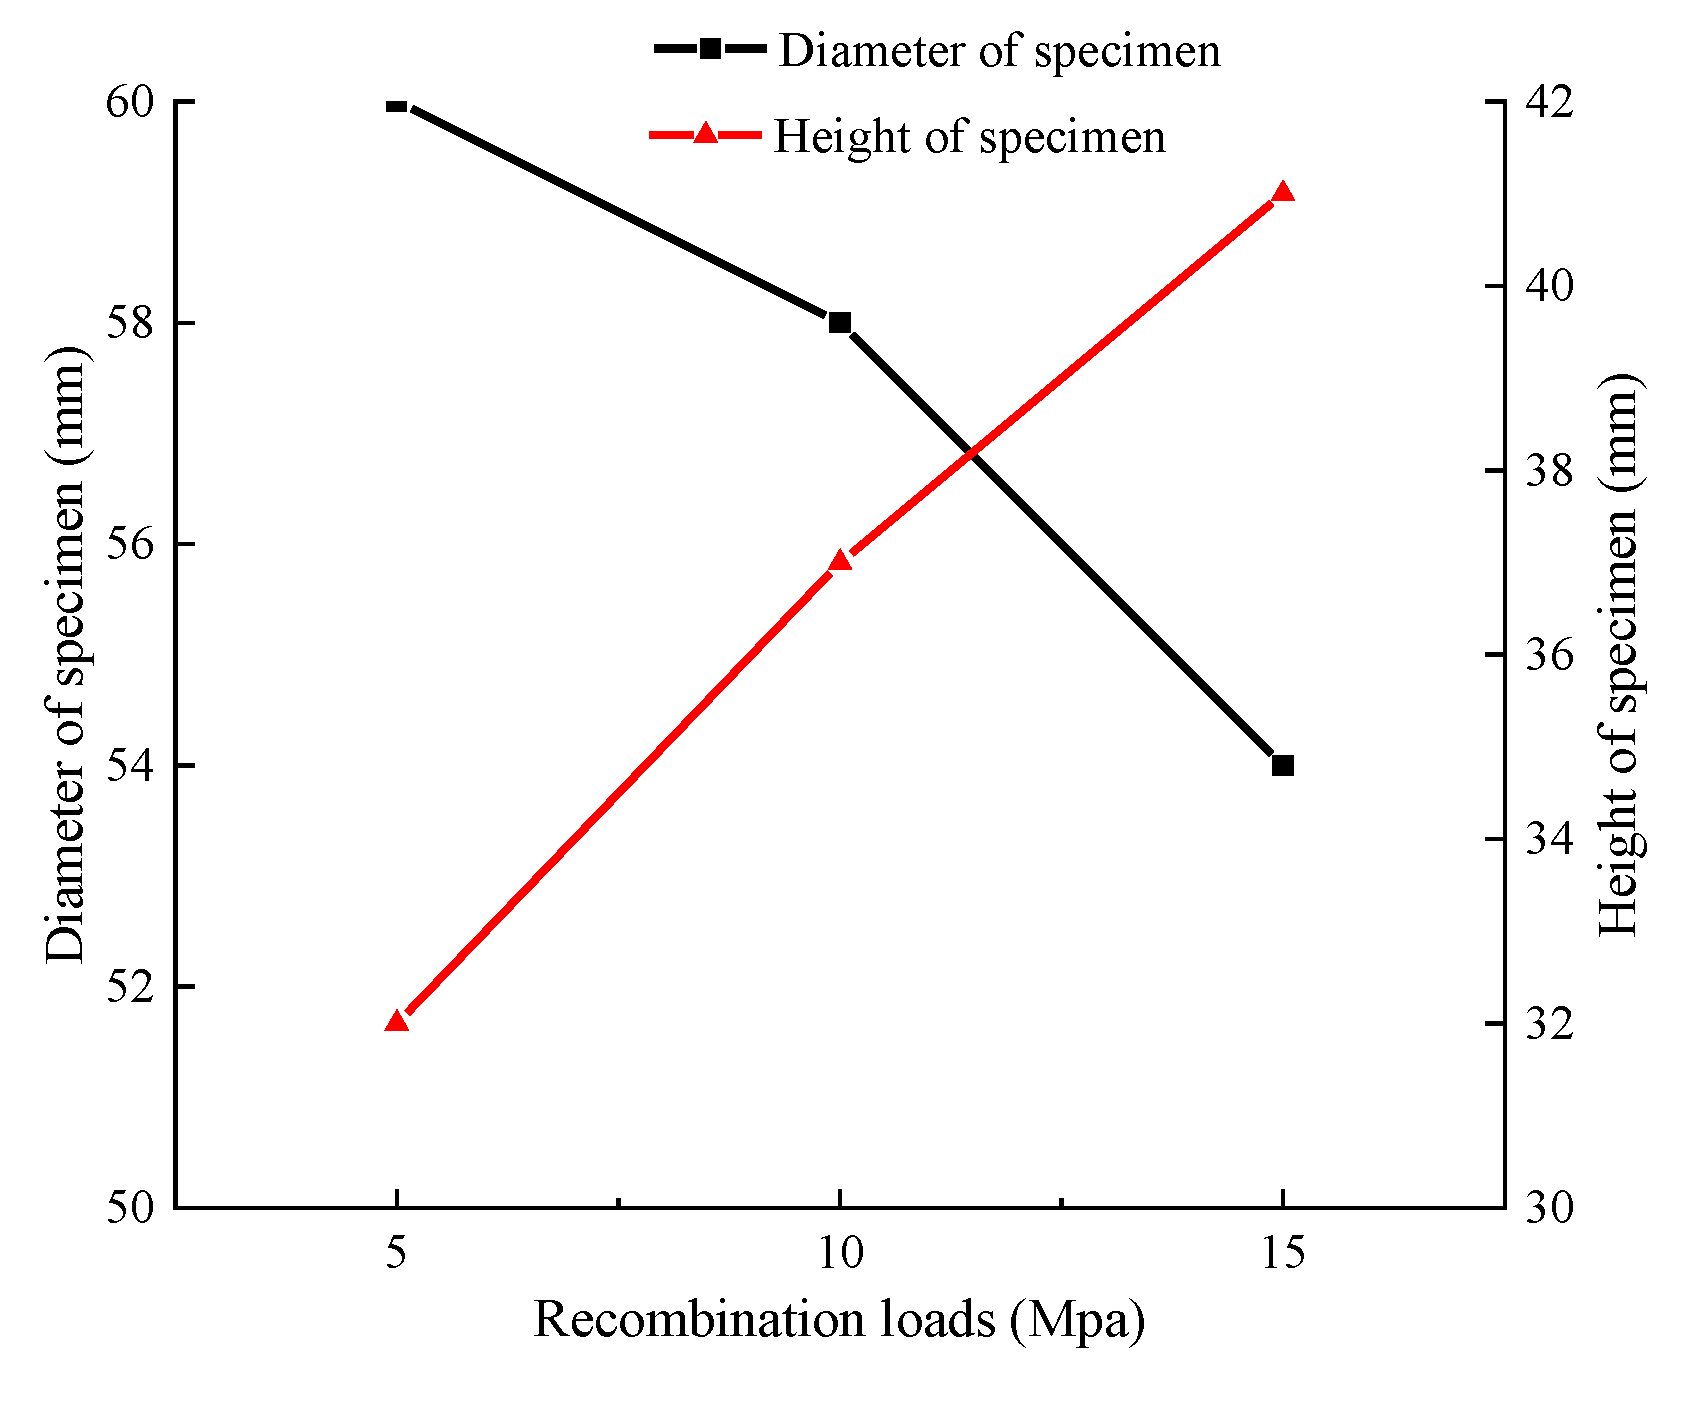
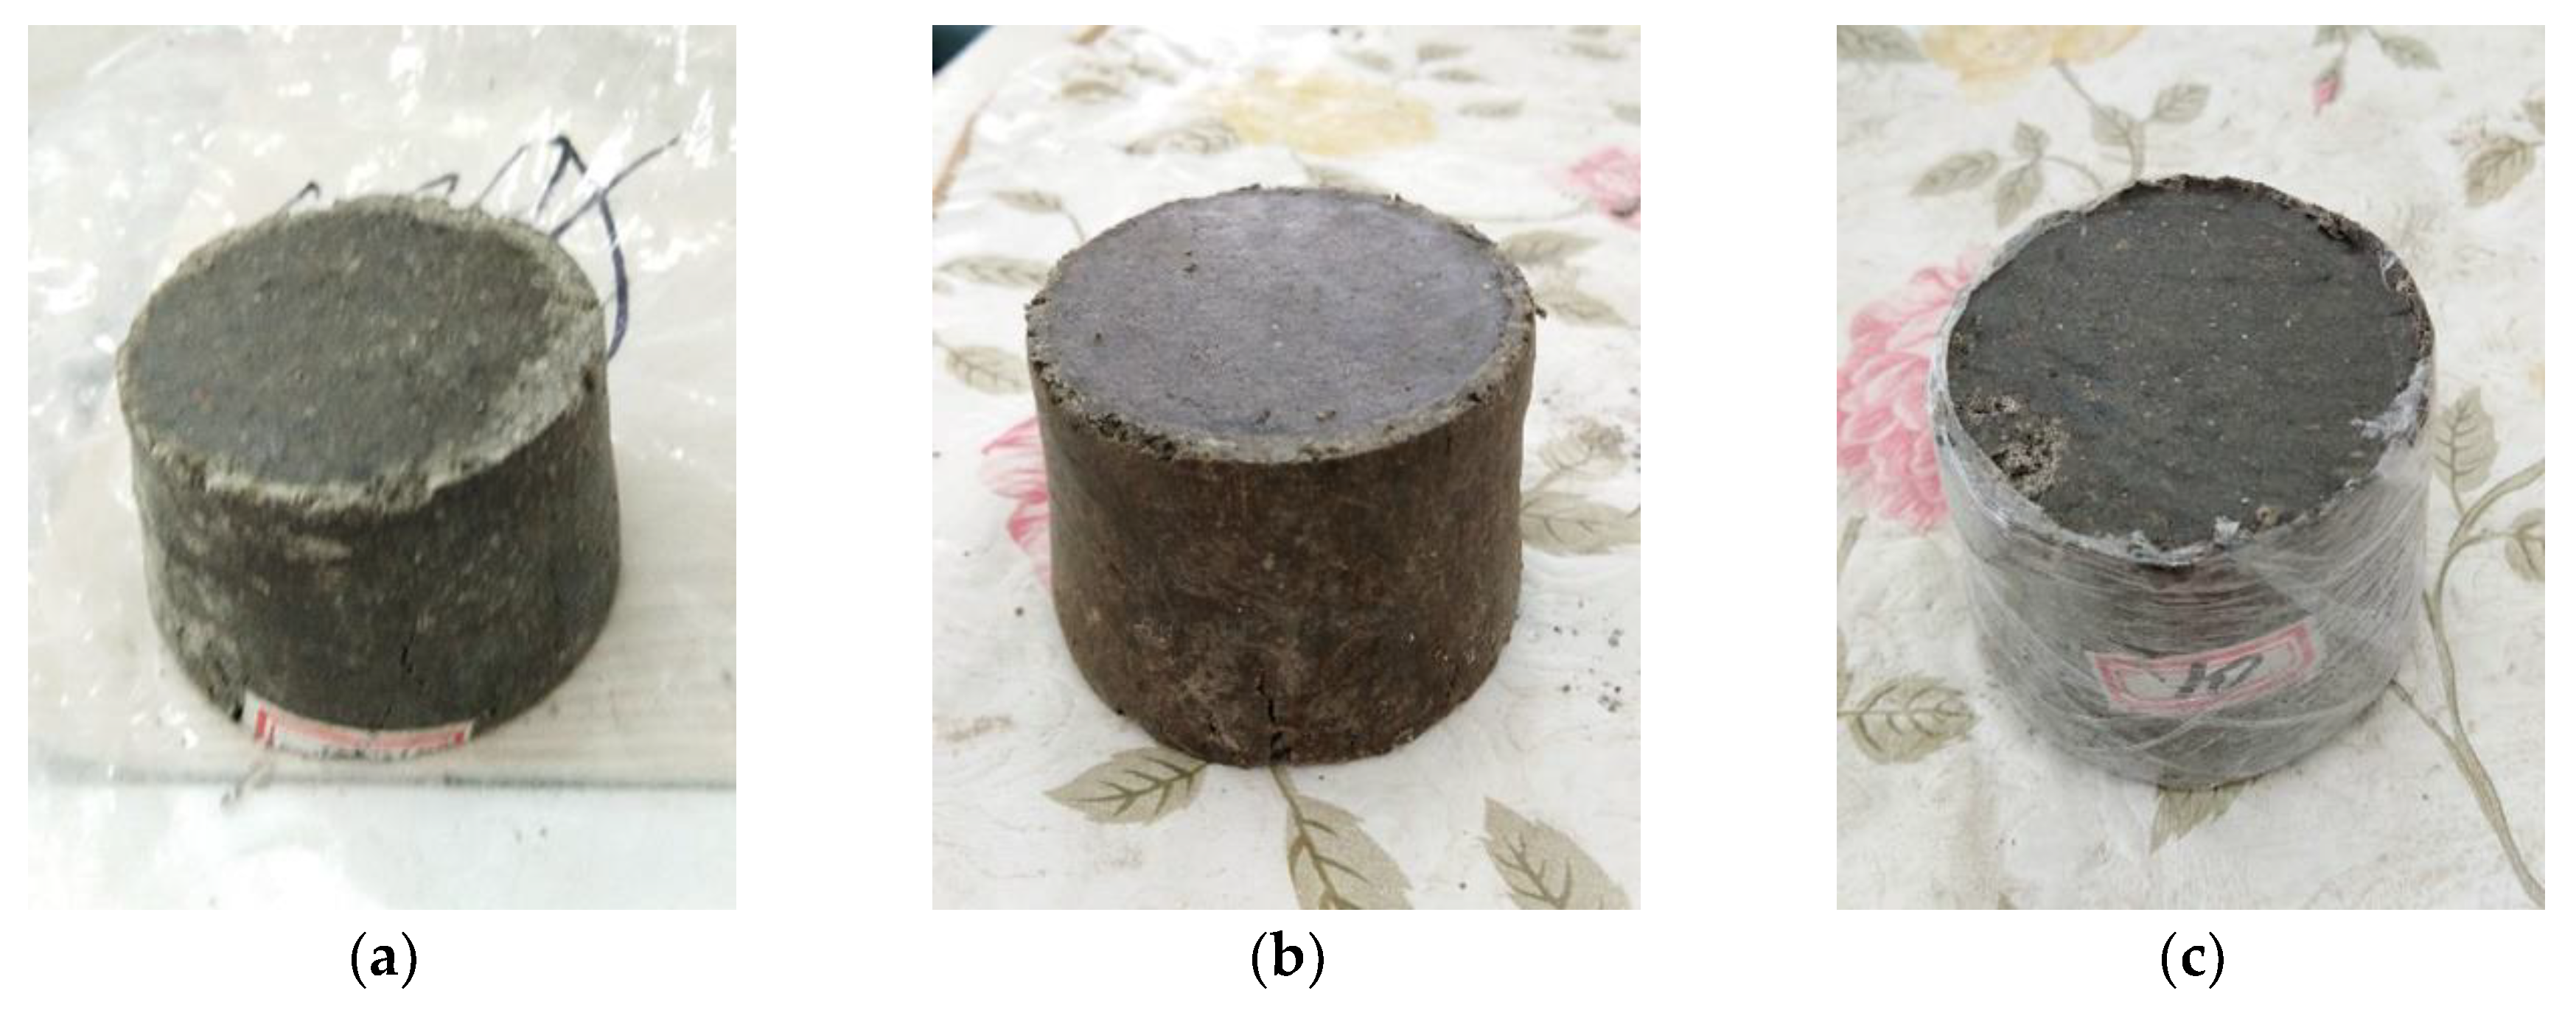
3.4.1. Characteristic Analysis of Impact Morphology of Argillaceous Weak Cemented Rock Mass under Different Reorganization Loads

The impact experiments on argillaceous weakly cemented rock explore the influence of different reorganization loads on the rock mass. The experiments are divided into three groups. The reorganization loads are 5 MPa, 10 MPa and 15 MPa. The impact pressure is maintained at 0.5 MPa, and the moisture content of samples is maintained at 15%. To ensure effective testing of each group, at least three specimens in each group are subjected to the same impact. To reduce the dispersion of rock samples after impact, the average diameter and height of samples are measured for each group of tests. The morphological parameters of specimens under different reorganization loads after dynamic impact are shown in Table 4.
Figure 13 shows that with increasing recombination load, after dynamic impact, the diameter of the specimen decreases, and the height increases. This phenomenon occurred because the greater the recombination load resulted in the lower porosity, the better internal structure cementation, and the higher compressive strength. After dynamic impact, the greater the recombination load is, the smaller the plastic deformation of the specimen is.
The physical sketch of argillaceous weakly cemented rock mass specimens subjected to dynamic impact under different reorganization loads is shown in Figure 14.

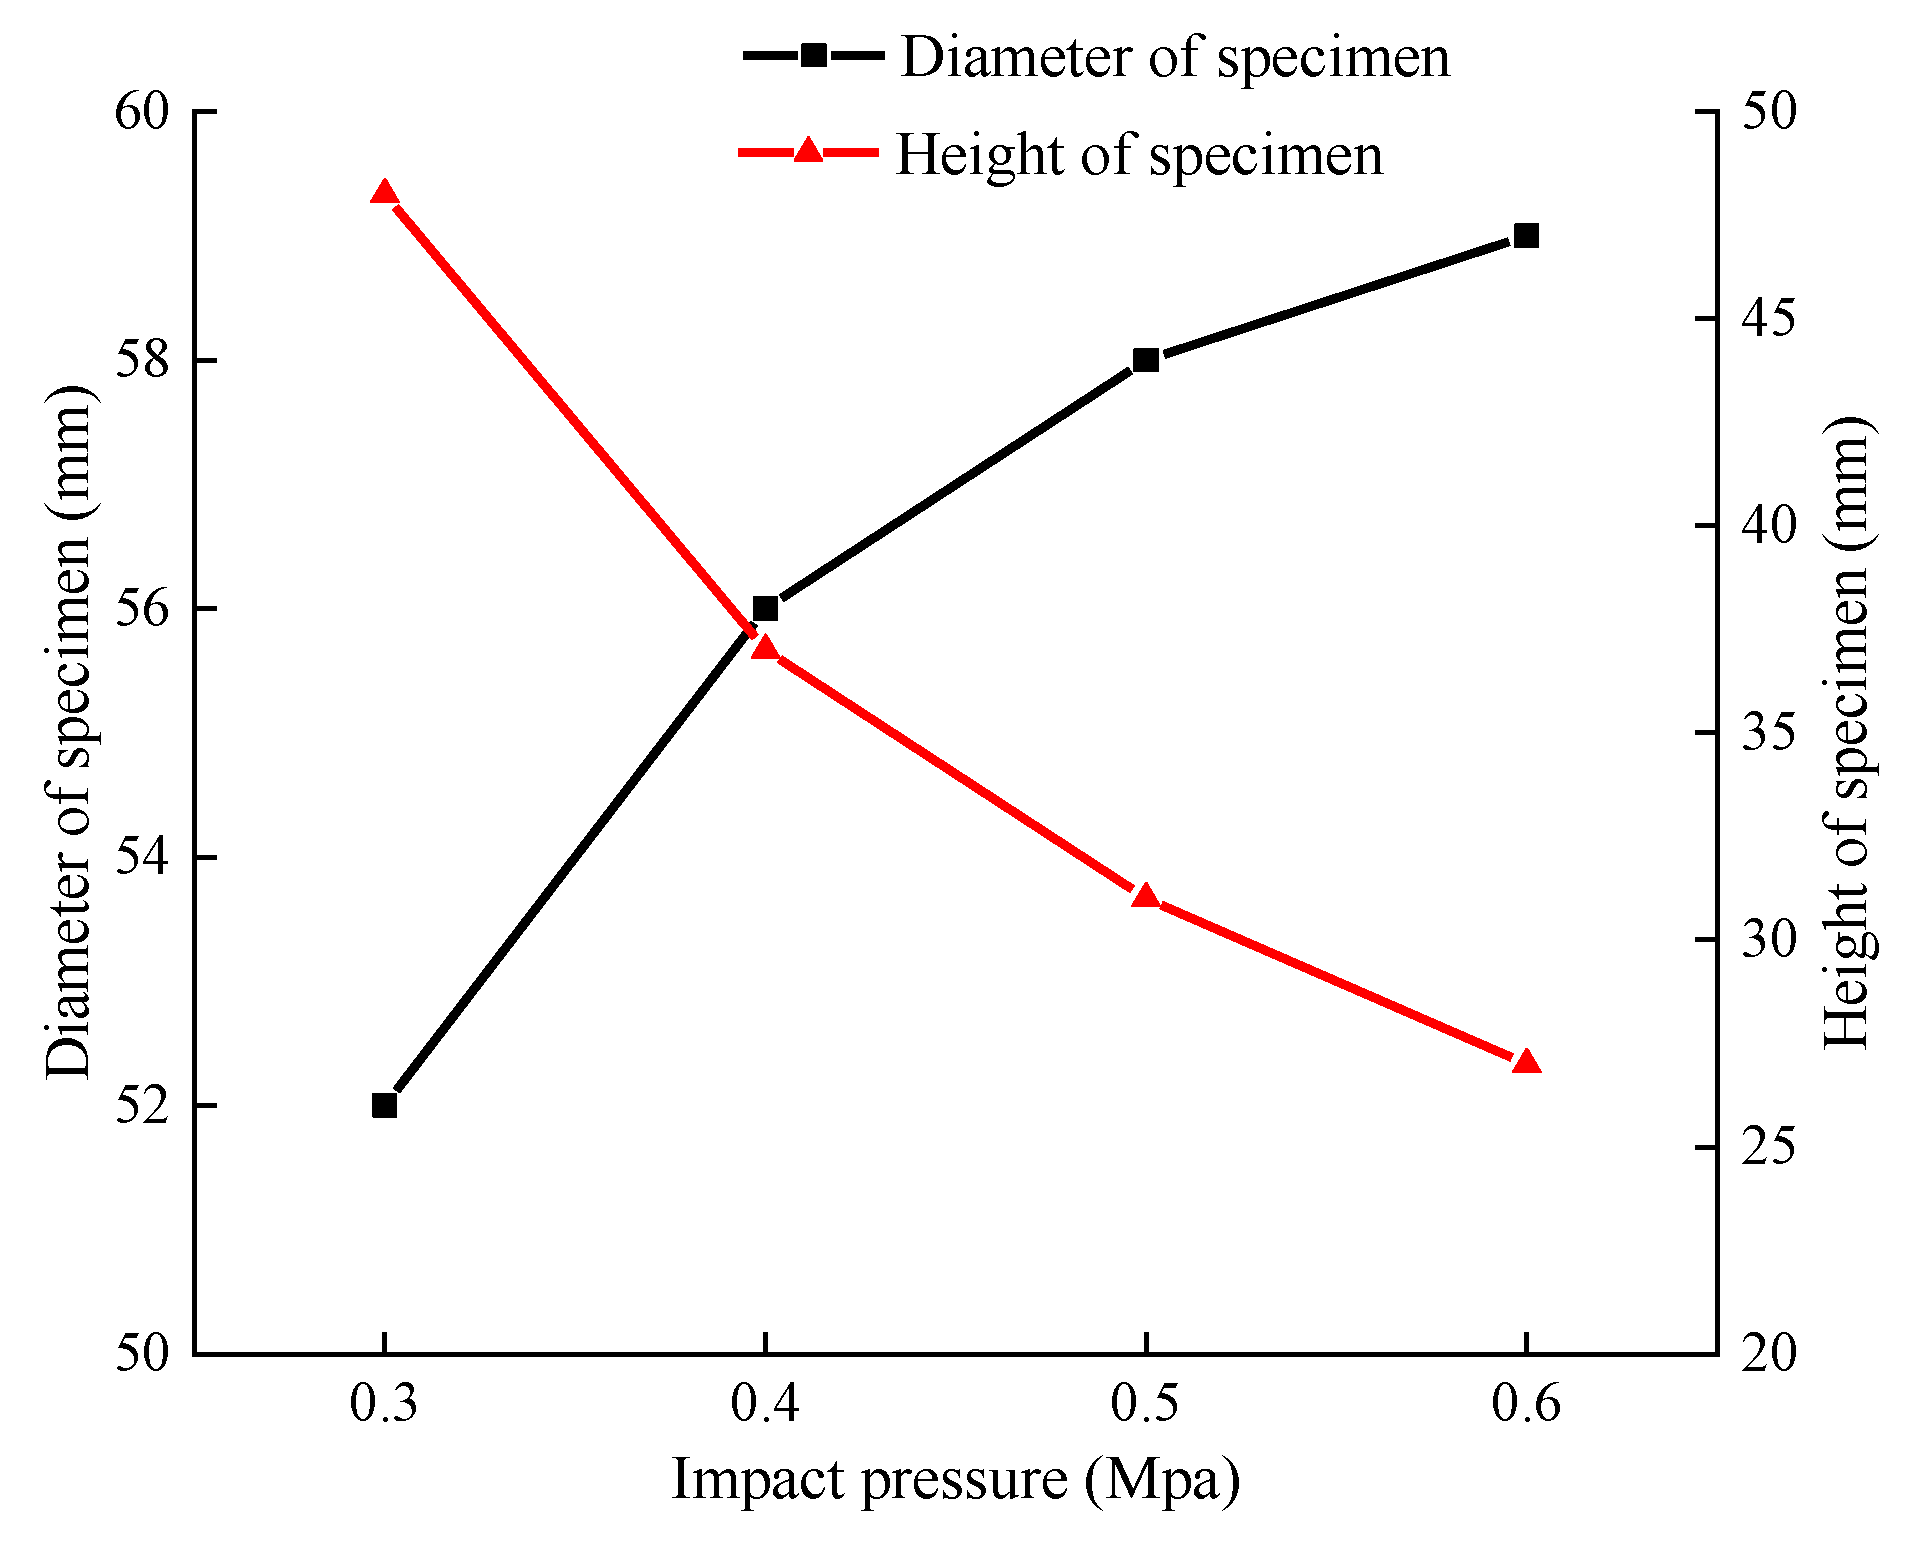
3.4.2. Characteristic Analysis of Impact Morphology under Different Impact Velocities

Argillaceous weakly cemented rock exhibits high plasticity under high water content conditions. The water content of the rock is controlled at 15%, and the results shows regular deformation under different impact velocities. As shown in Table 5, the variation of specimen diameter and height under different impact velocities reflects the morphological characteristics of the rock under dynamic impact.
The impact test of argillaceous weakly cemented rock explores the influence of different impact velocity loads on this type of rock. The test is divided into four groups. The impact velocity of each group is controlled by air pressure to 0.3 MPa, 0.4 MPa, 0.5 MPa or 0.6 MPa. To ensure effective testing of each group, at least three samples are subjected to the same impact velocity in each group. Table 5 shows that under the same pressure impact load, the impact velocity exhibits discrete differences, but the difference in impact velocity is very small; therefore, the diameter and height of the sample under the same pressure impact also exhibit some discrete differences. To reduce the discrete differences in the sample shape parameters, each group of argillaceous weakly cemented rock masses is tested, and the average size of the sample after impact is recorded. When the impact pressure is 0.3 MPa, the average diameter and height of the samples are 52 mm and 48 mm, respectively. When the impact pressure is 0.4 MPa, the average diameter and height of the samples are 56 mm and 37 mm, respectively. When the impact pressure is 0.5 MPa, the average diameter and height of the samples are 58 mm and 31 mm, respectively. When the impact pressure is 0.5 MPa, the average height of the weakly cemented rock samples is 31 mm. When the pressure is 0.6 MPa, the average diameter and height of the samples are 59 mm and 27 mm, respectively.
The variations in the diameter and height of argillaceous weakly cemented rock specimens under different dynamic impact loads are shown in Figure 15.
Figure 15 shows that the diameter of specimens increases, and the height of specimens decreases, with increasing impact velocity. The size change curve of argillaceous weakly cemented rock can be divided into approximately two stages: a rapid change stage and a slow change stage. When the impact pressure is less than 0.5 MPa, the size of specimens varies greatly with increasing impact velocity. When the impact pressure increases from 0.3 to 0.4 MPa, the diameter of the specimens increases by 4 mm, and the height of the specimens decreases by 11 mm. When the impact pressure is greater than 0.5 MPa, the change range of specimen size decreases gradually. When the impact pressure increases from 0.5 to 0.6 MPa, the diameter of the specimens increases by 1 mm, and the height of specimens decreases by 4 mm. When the impact pressure increases from 0.6 to 0.8 MPa, the diameter of the sample increases by 1 mm, and the height of the sample decreases by 3 mm.
The physical sketch of samples of argillaceous weakly cemented rock subjected to dynamic impact under different impact loads is shown in Figure 16.

4. Discussion

In this paper, a method similar to the stress–strain curve in static compression test is used to divide the argillaceous weak cemented rock mass under dynamic load into the following stages:
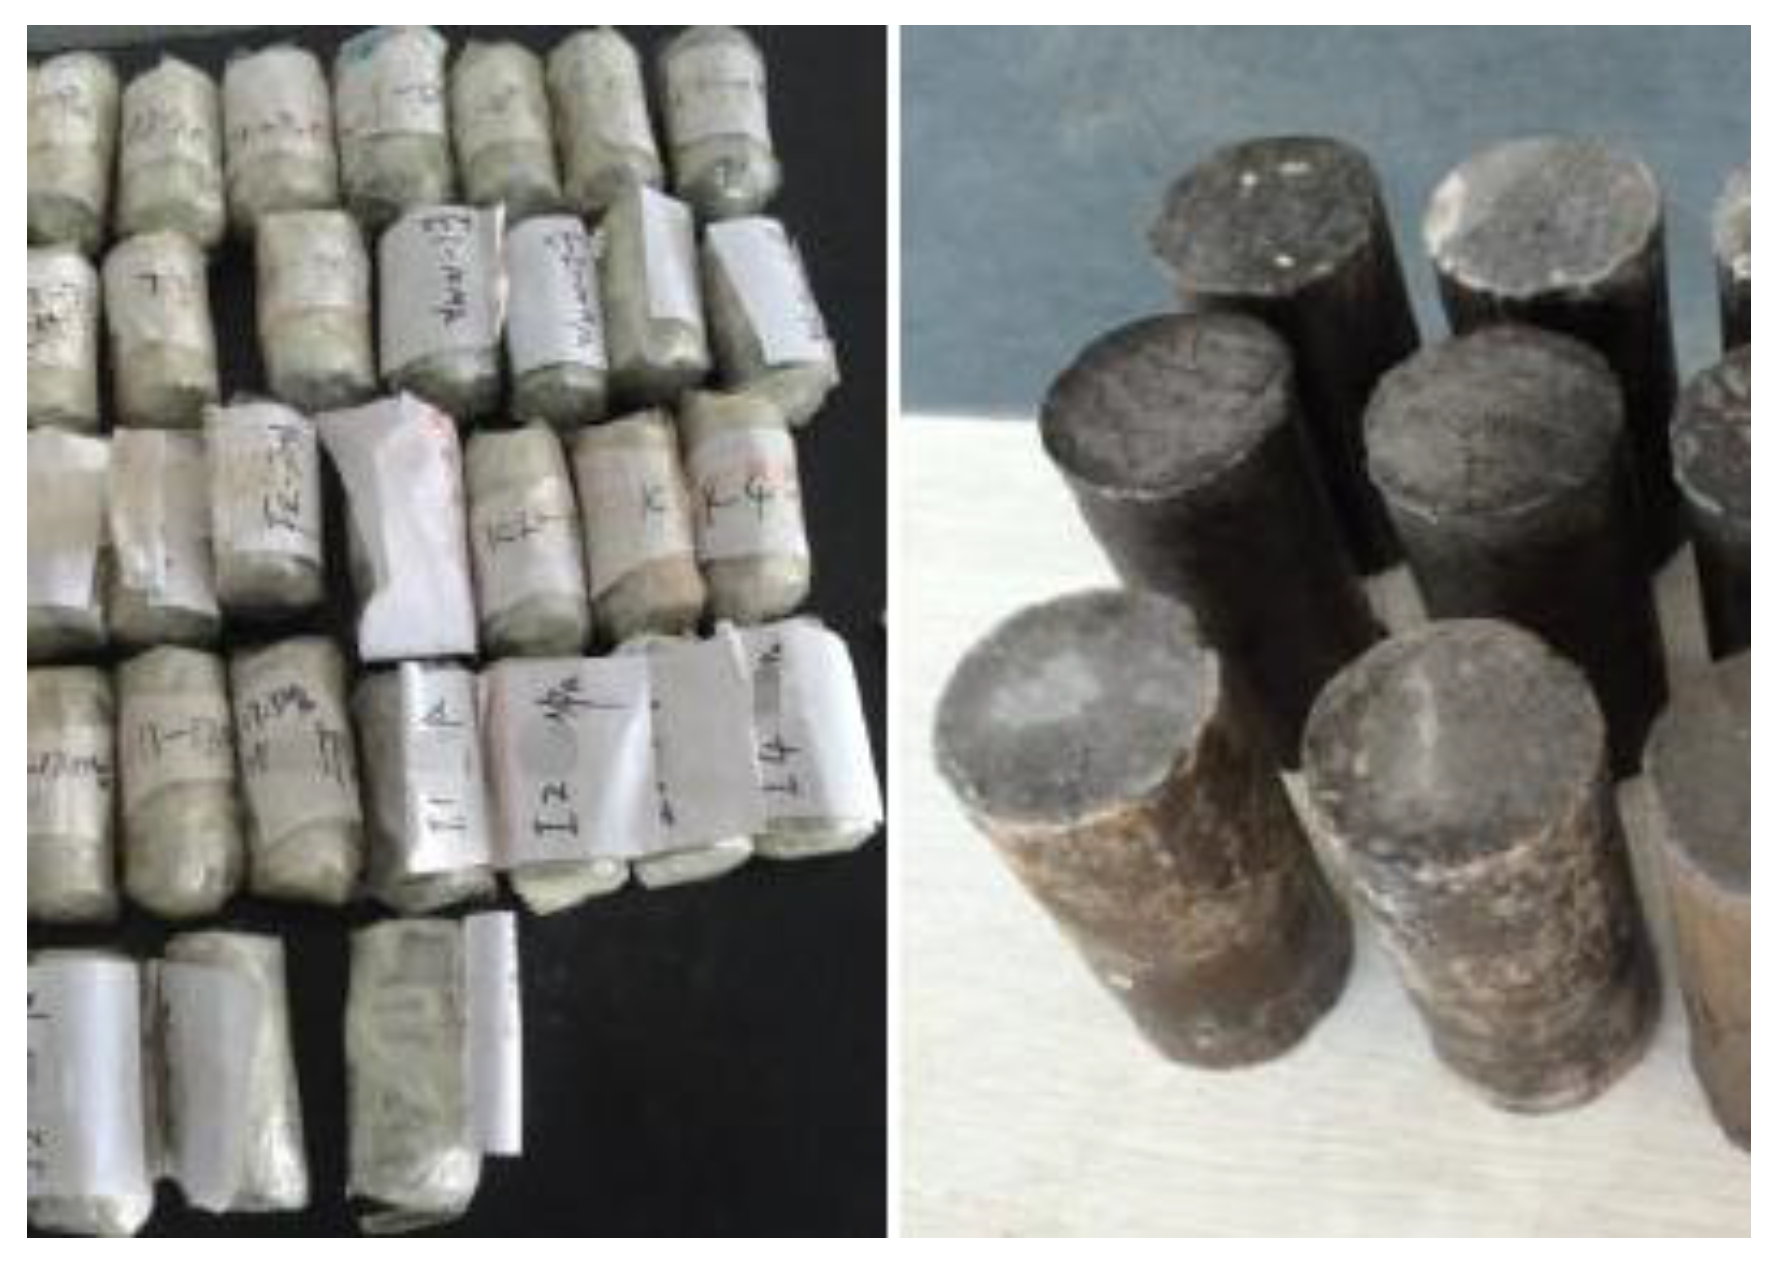
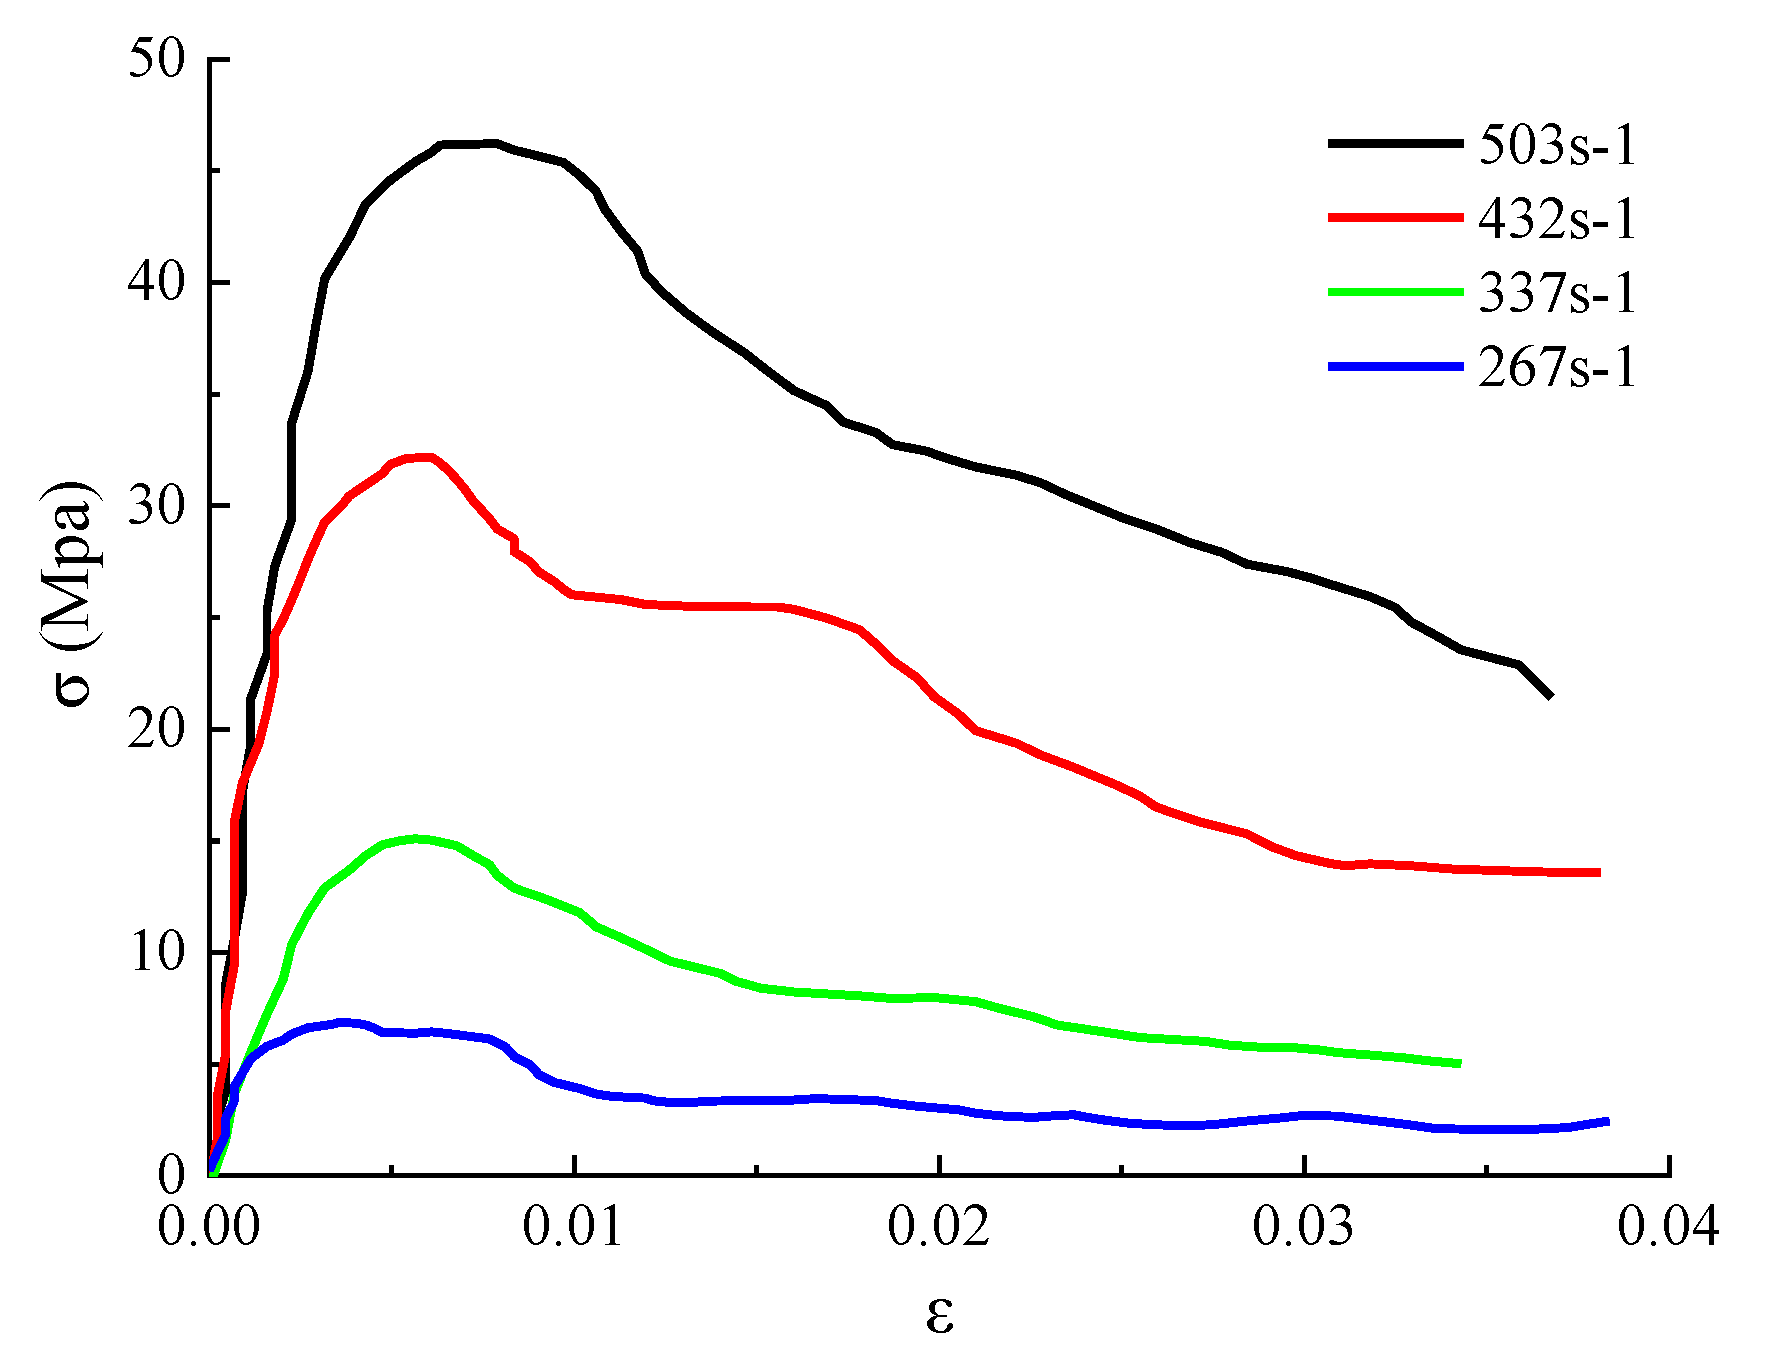
  • Compaction stage. At this stage, the stress–strain curves show the characteristics of concave change. There are two reasons for this feature: the first is compression bar gradually compacted with the specimen. In the test, the specimen is clamped between the incident rod and the projection rod. Because the surface of the specimen is coated with lubricant, the contact between the compression rod and the specimen is not completely dense. Therefore, there will be a compaction transition period between the compression rod and the specimen in the initial stage of the test; the second is the closure of micro-cracks in the argillaceous weakly cemented rock mass. The material composition of the sample of argillaceous weak cemented rock mass is complex. There are a lot of joints and micro-cracks in the original state. Under the action of axial stress, the internal micro-cracks will close gradually, and the defects such as micro-pore will shrink gradually. Because of the above two reasons, the macro-deformation resistance of the specimens is increasing.
  • Approximate linear elastic stage. At this stage, the stress–strain curve basically shows a straight-line upward variation. The stress wave is reflected repeatedly in the sample to achieve uniform stress and strain. In this stage, the external loads are not enough to make the crack grow and evolve or produce new cracks in the sample, only to make the deformation of the original crack stable, or to produce small amplitude changes. The elastic energy accumulates continuously, and the elastic deformation state of the sample does not change qualitatively. At this stage, the slope of the curve basically remains unchanged.
  • Microcrack propagation stage. At this stage, the stress increases slowly with the increase in strain, and the curve is convex. Due to the continuous increase in stress acting on the specimen, the old crack of the specimen expands and a new crack occurs; the argillaceous weakly cemented rock has higher plastic deformation under the condition of higher water content, at this time plastic deformation gradually becomes the dominant deformation of the specimen. At the end of this stage, the stress of the specimen reaches its maximum value, and the slope of the curve tends to zero. At this time, the stress value is the peak stress, and the corresponding strain value is the peak strain.
  • Strain softening stage. At this stage, the stress–strain curve decreases at a certain slope, and after the peak stress, the bearing capacity of the specimen decreases. Because of the plastic deformation of the specimen, the specimen maintains a certain integrity and enters the plastic deformation stage.

5. Conclusions

According to the characteristic that the structure of argillaceous weakly cemented rock mass can be restructured under certain external environment, the restructuring test of argillaceous weakly cemented rock mass is carried out based on the improved experimental restructuring device. Using SHPB test system, the uniaxial compression tests of samples under different reorganization loads and impact velocities are carried out respectively. The main conclusions are as follows:
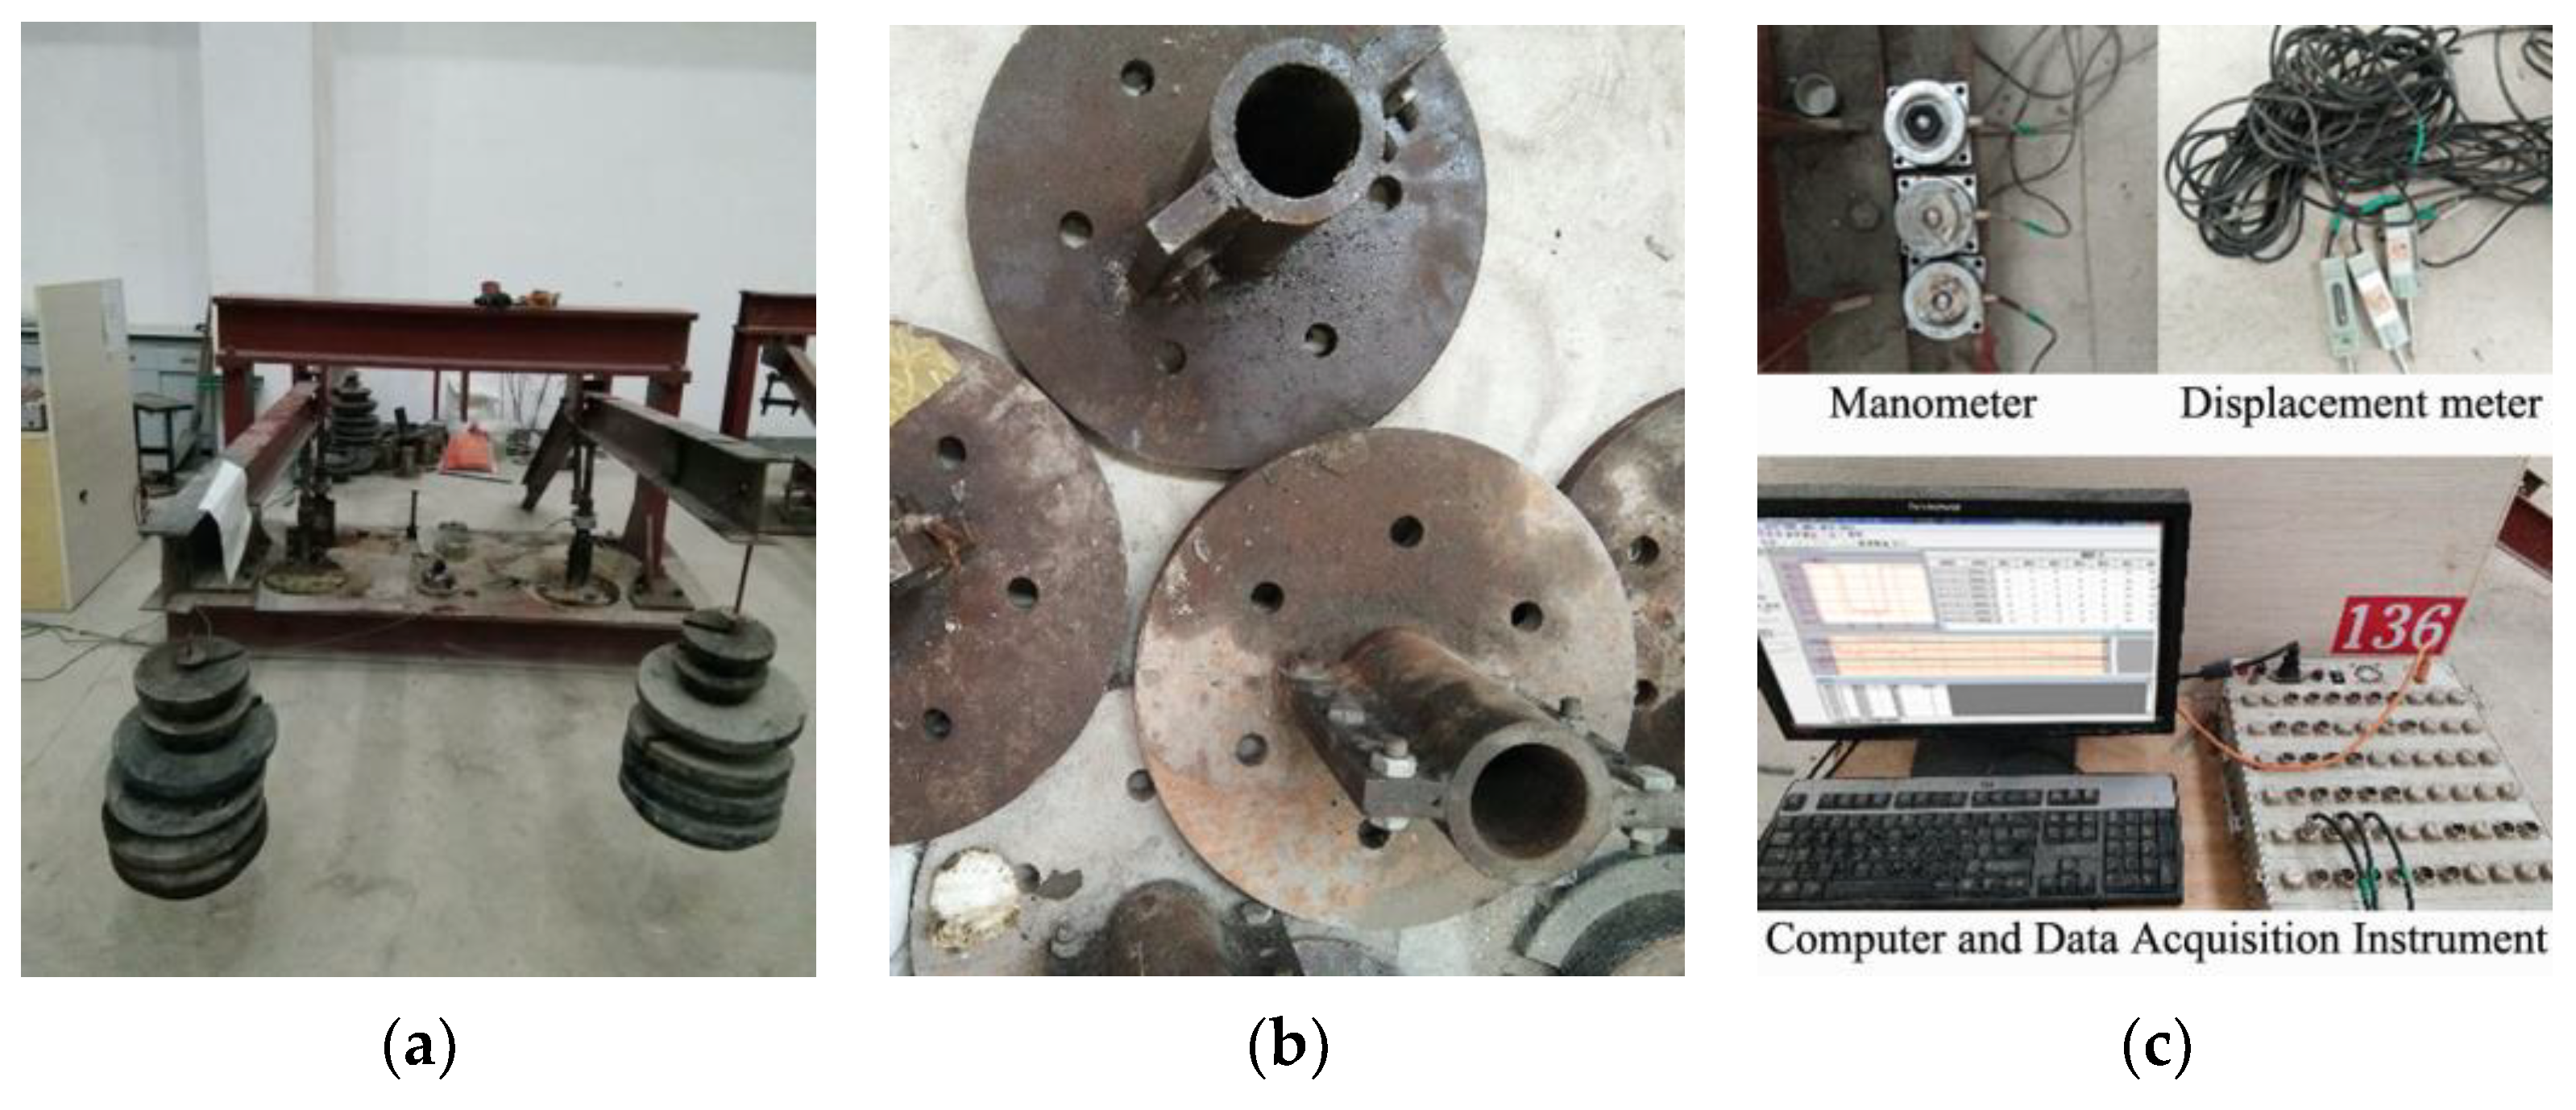
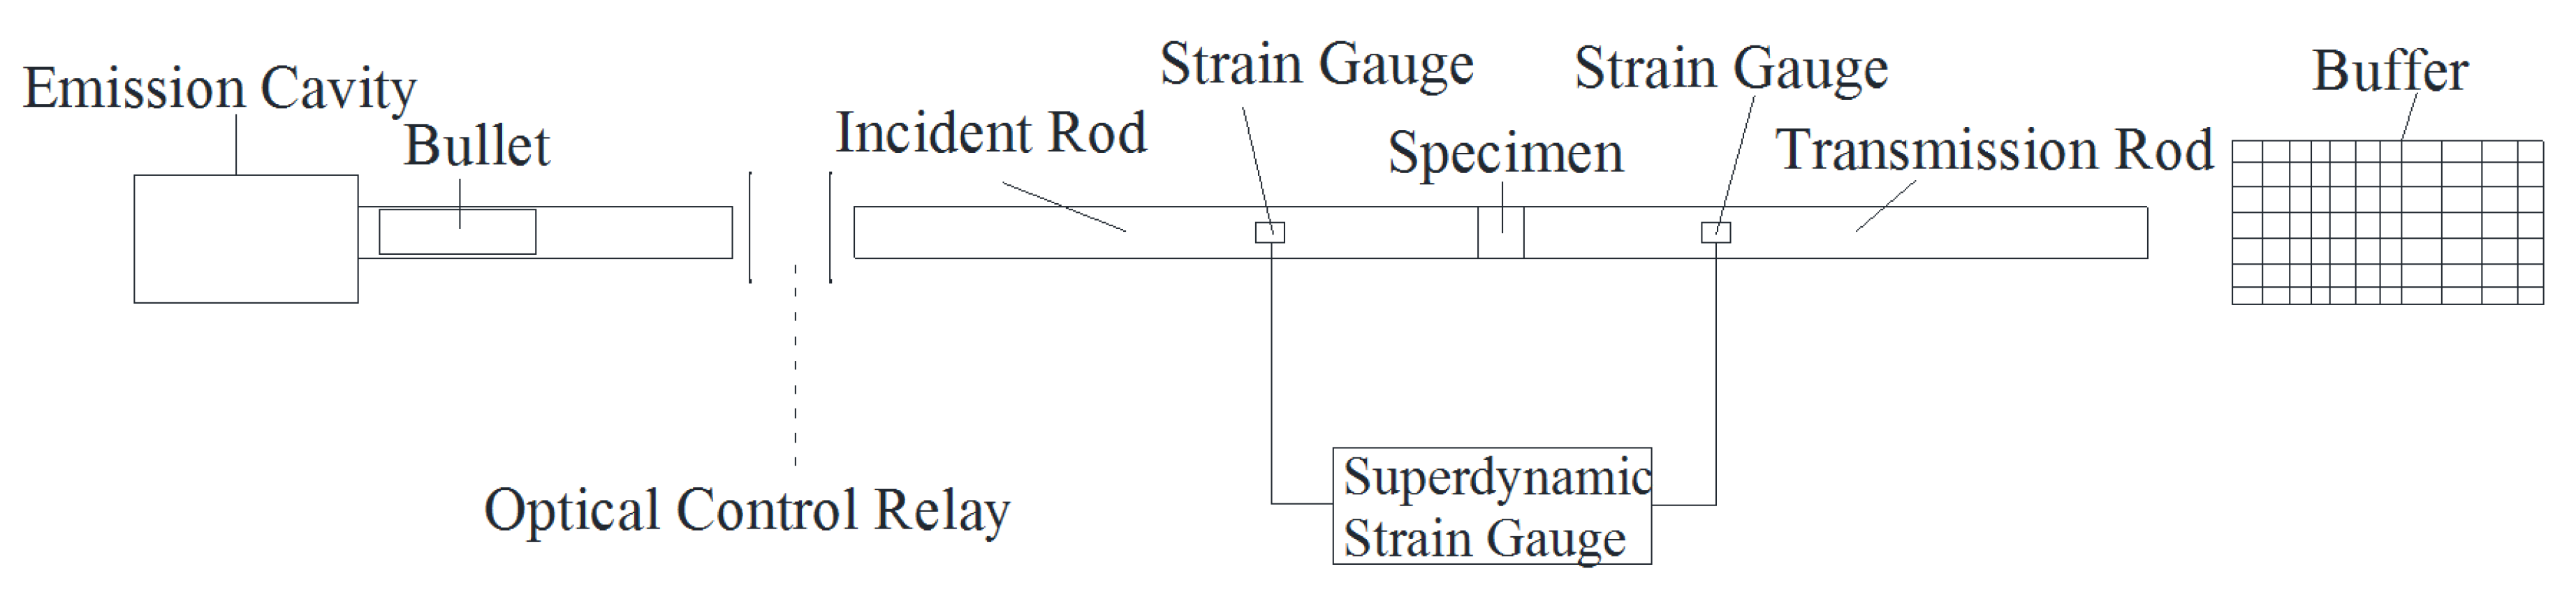
  • Separate Hopkinson pressure bar test system is the most widely used system in rock dynamic mechanics test. Two-channel DH3816 super-dynamic signal acquisition instrument is selected as the data acquisition system for this test. Its signal acquisition frequency can reach 10 M, which meets the test requirements.
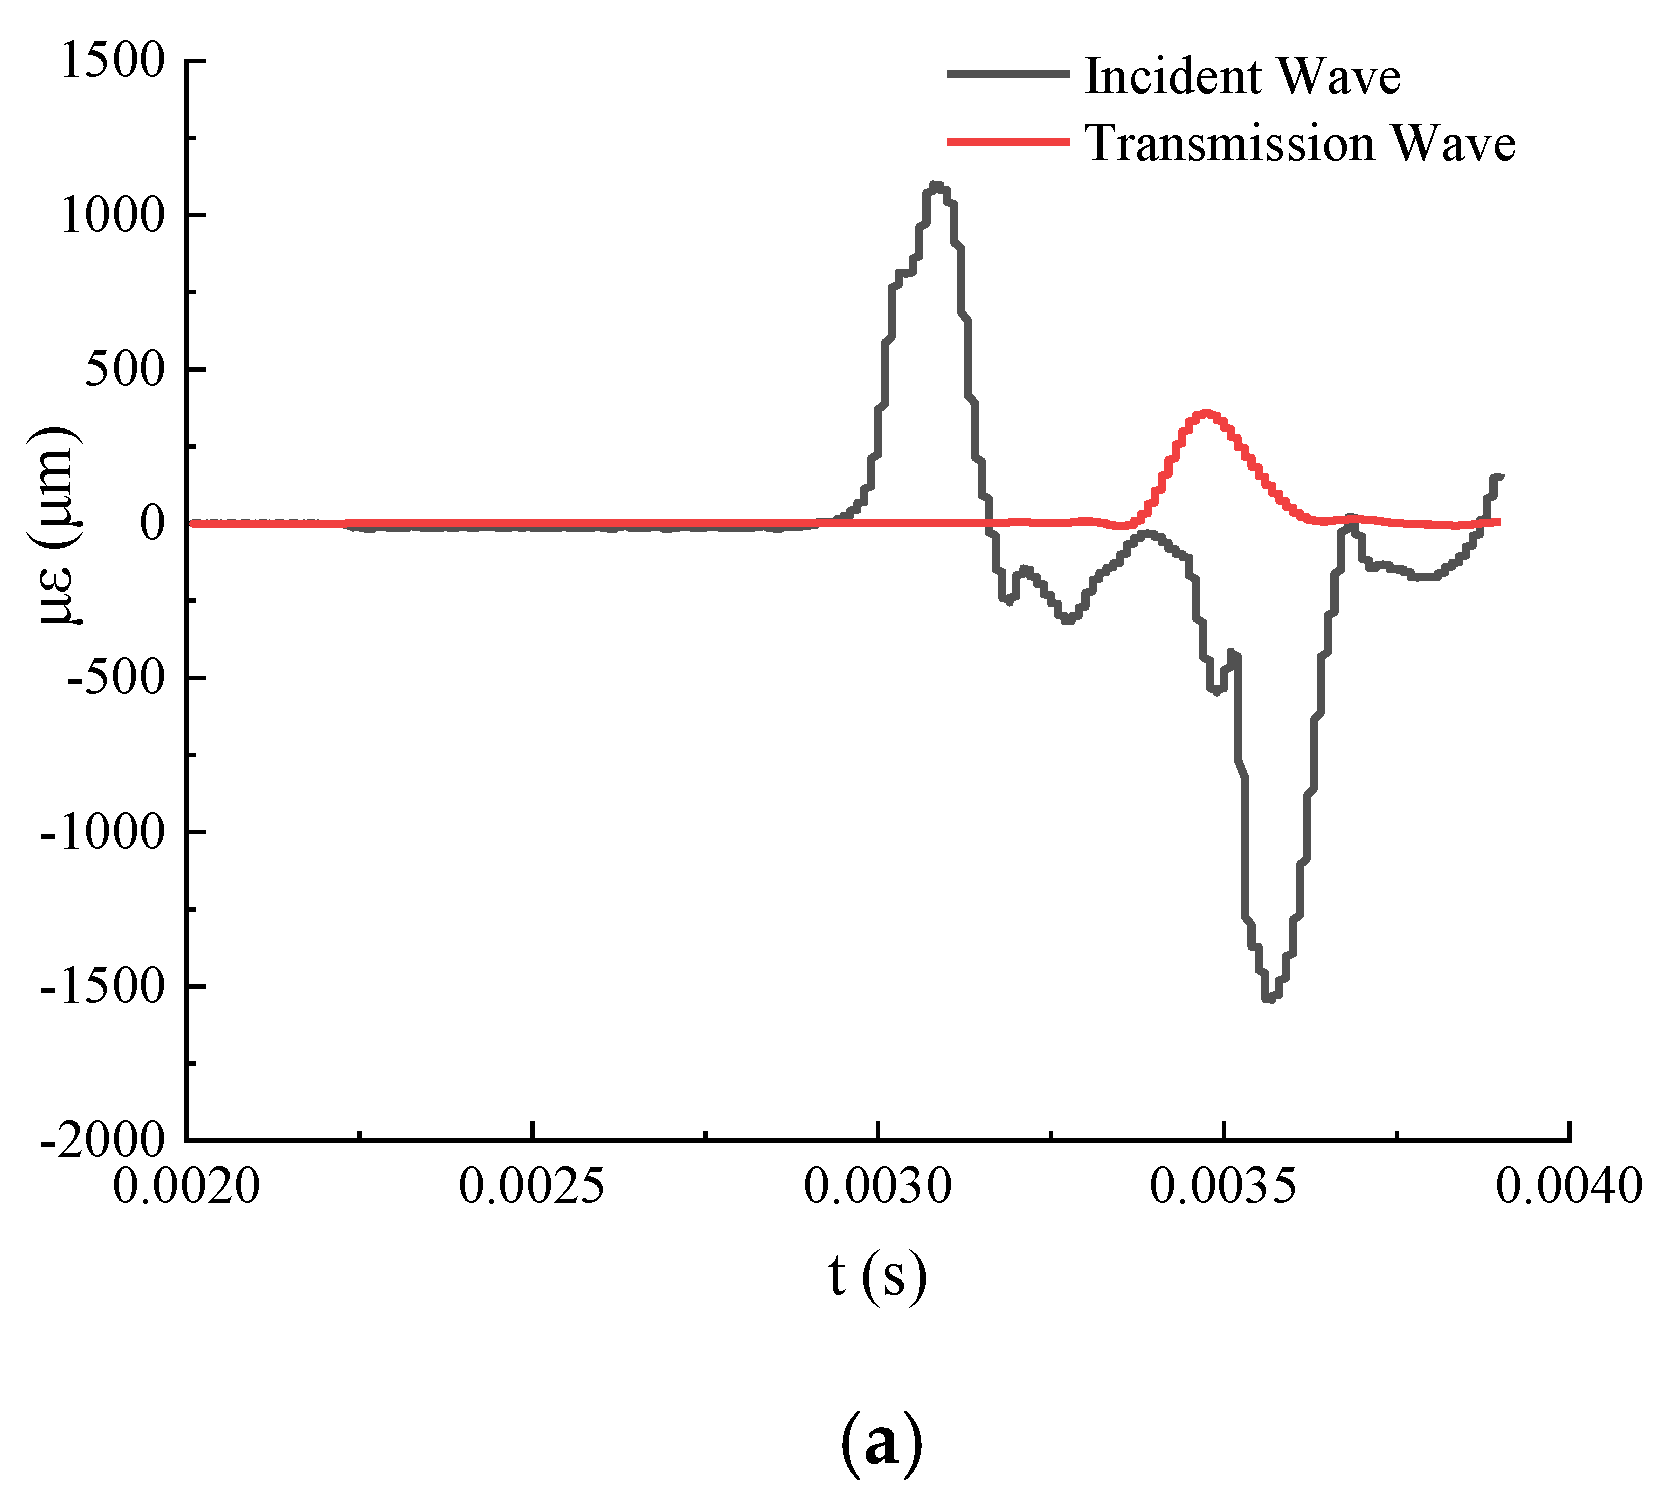
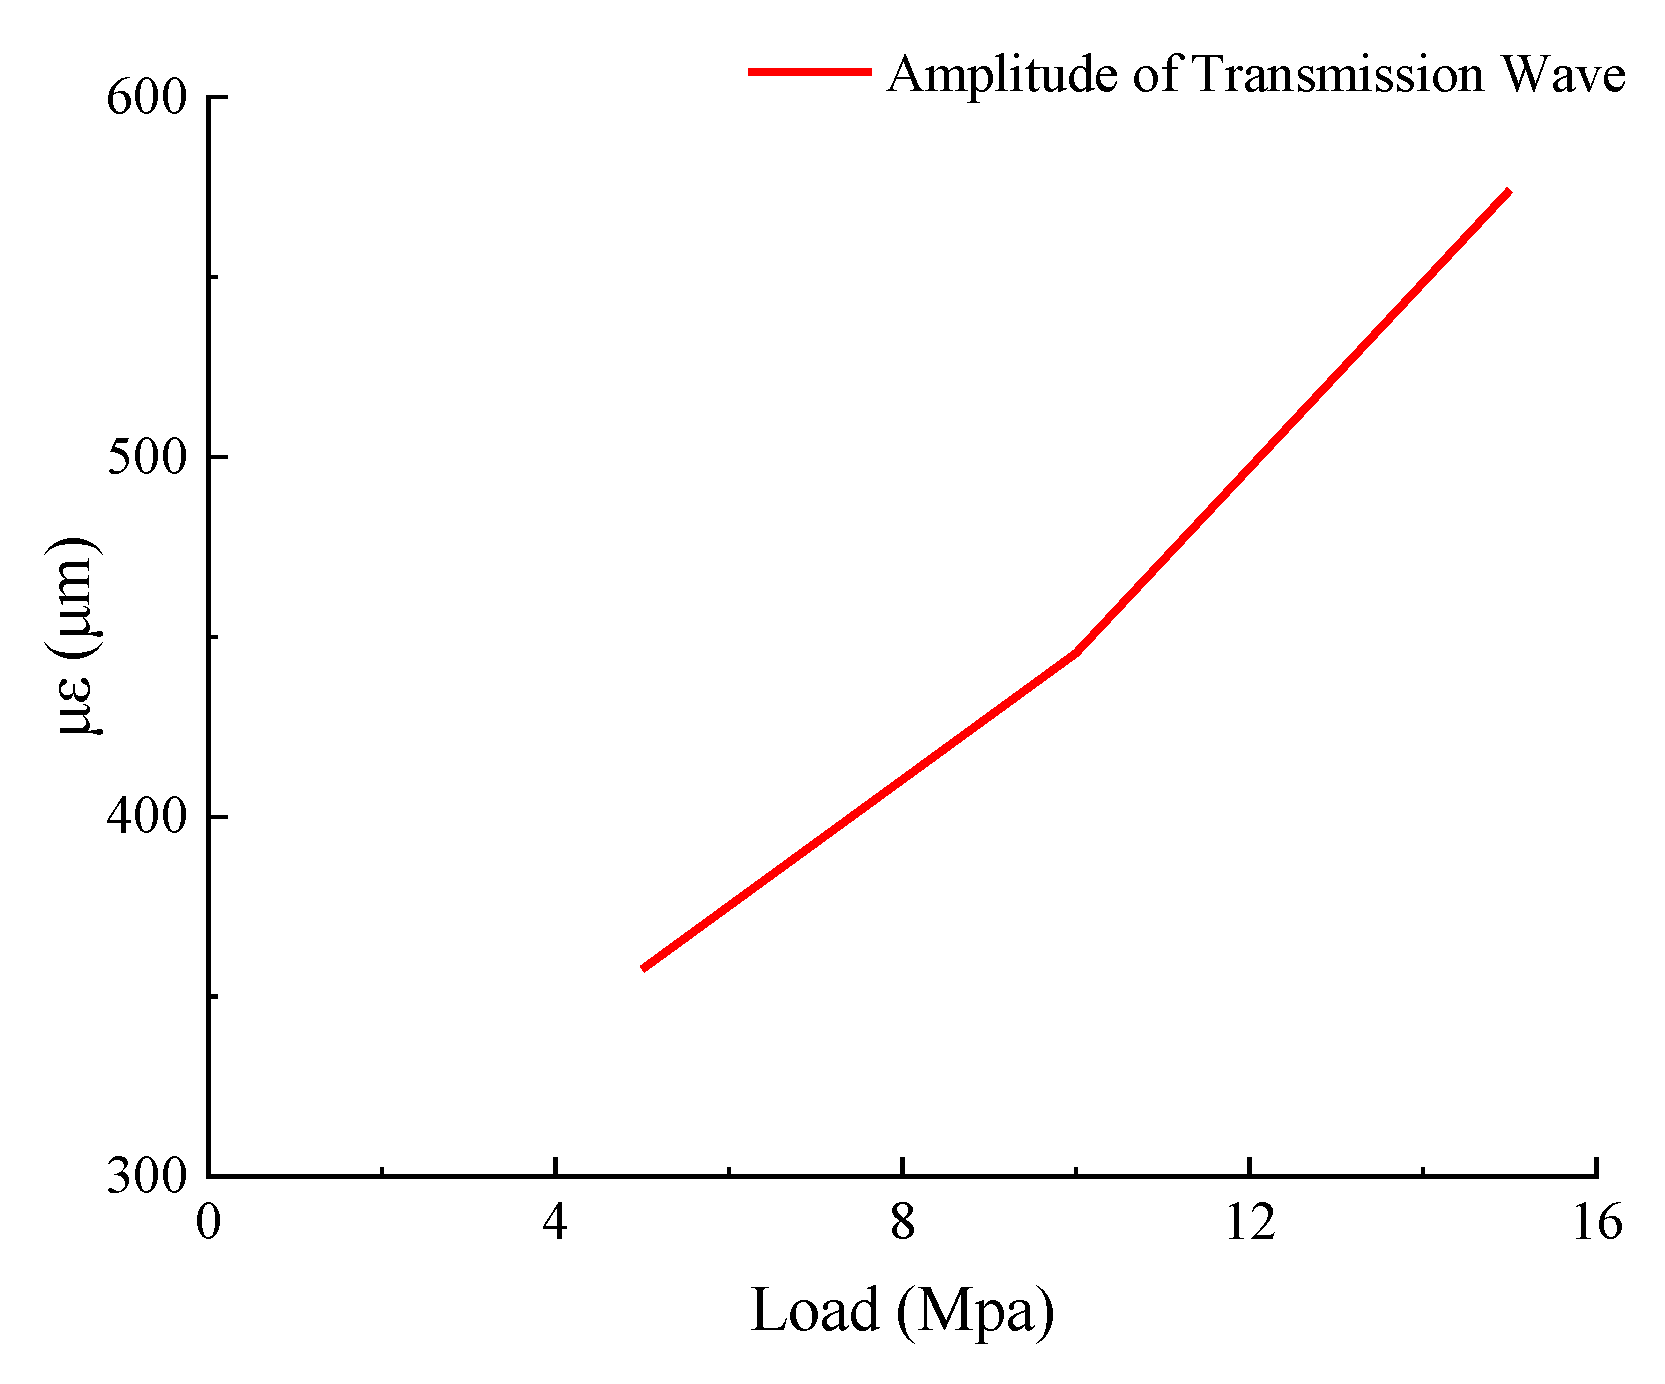
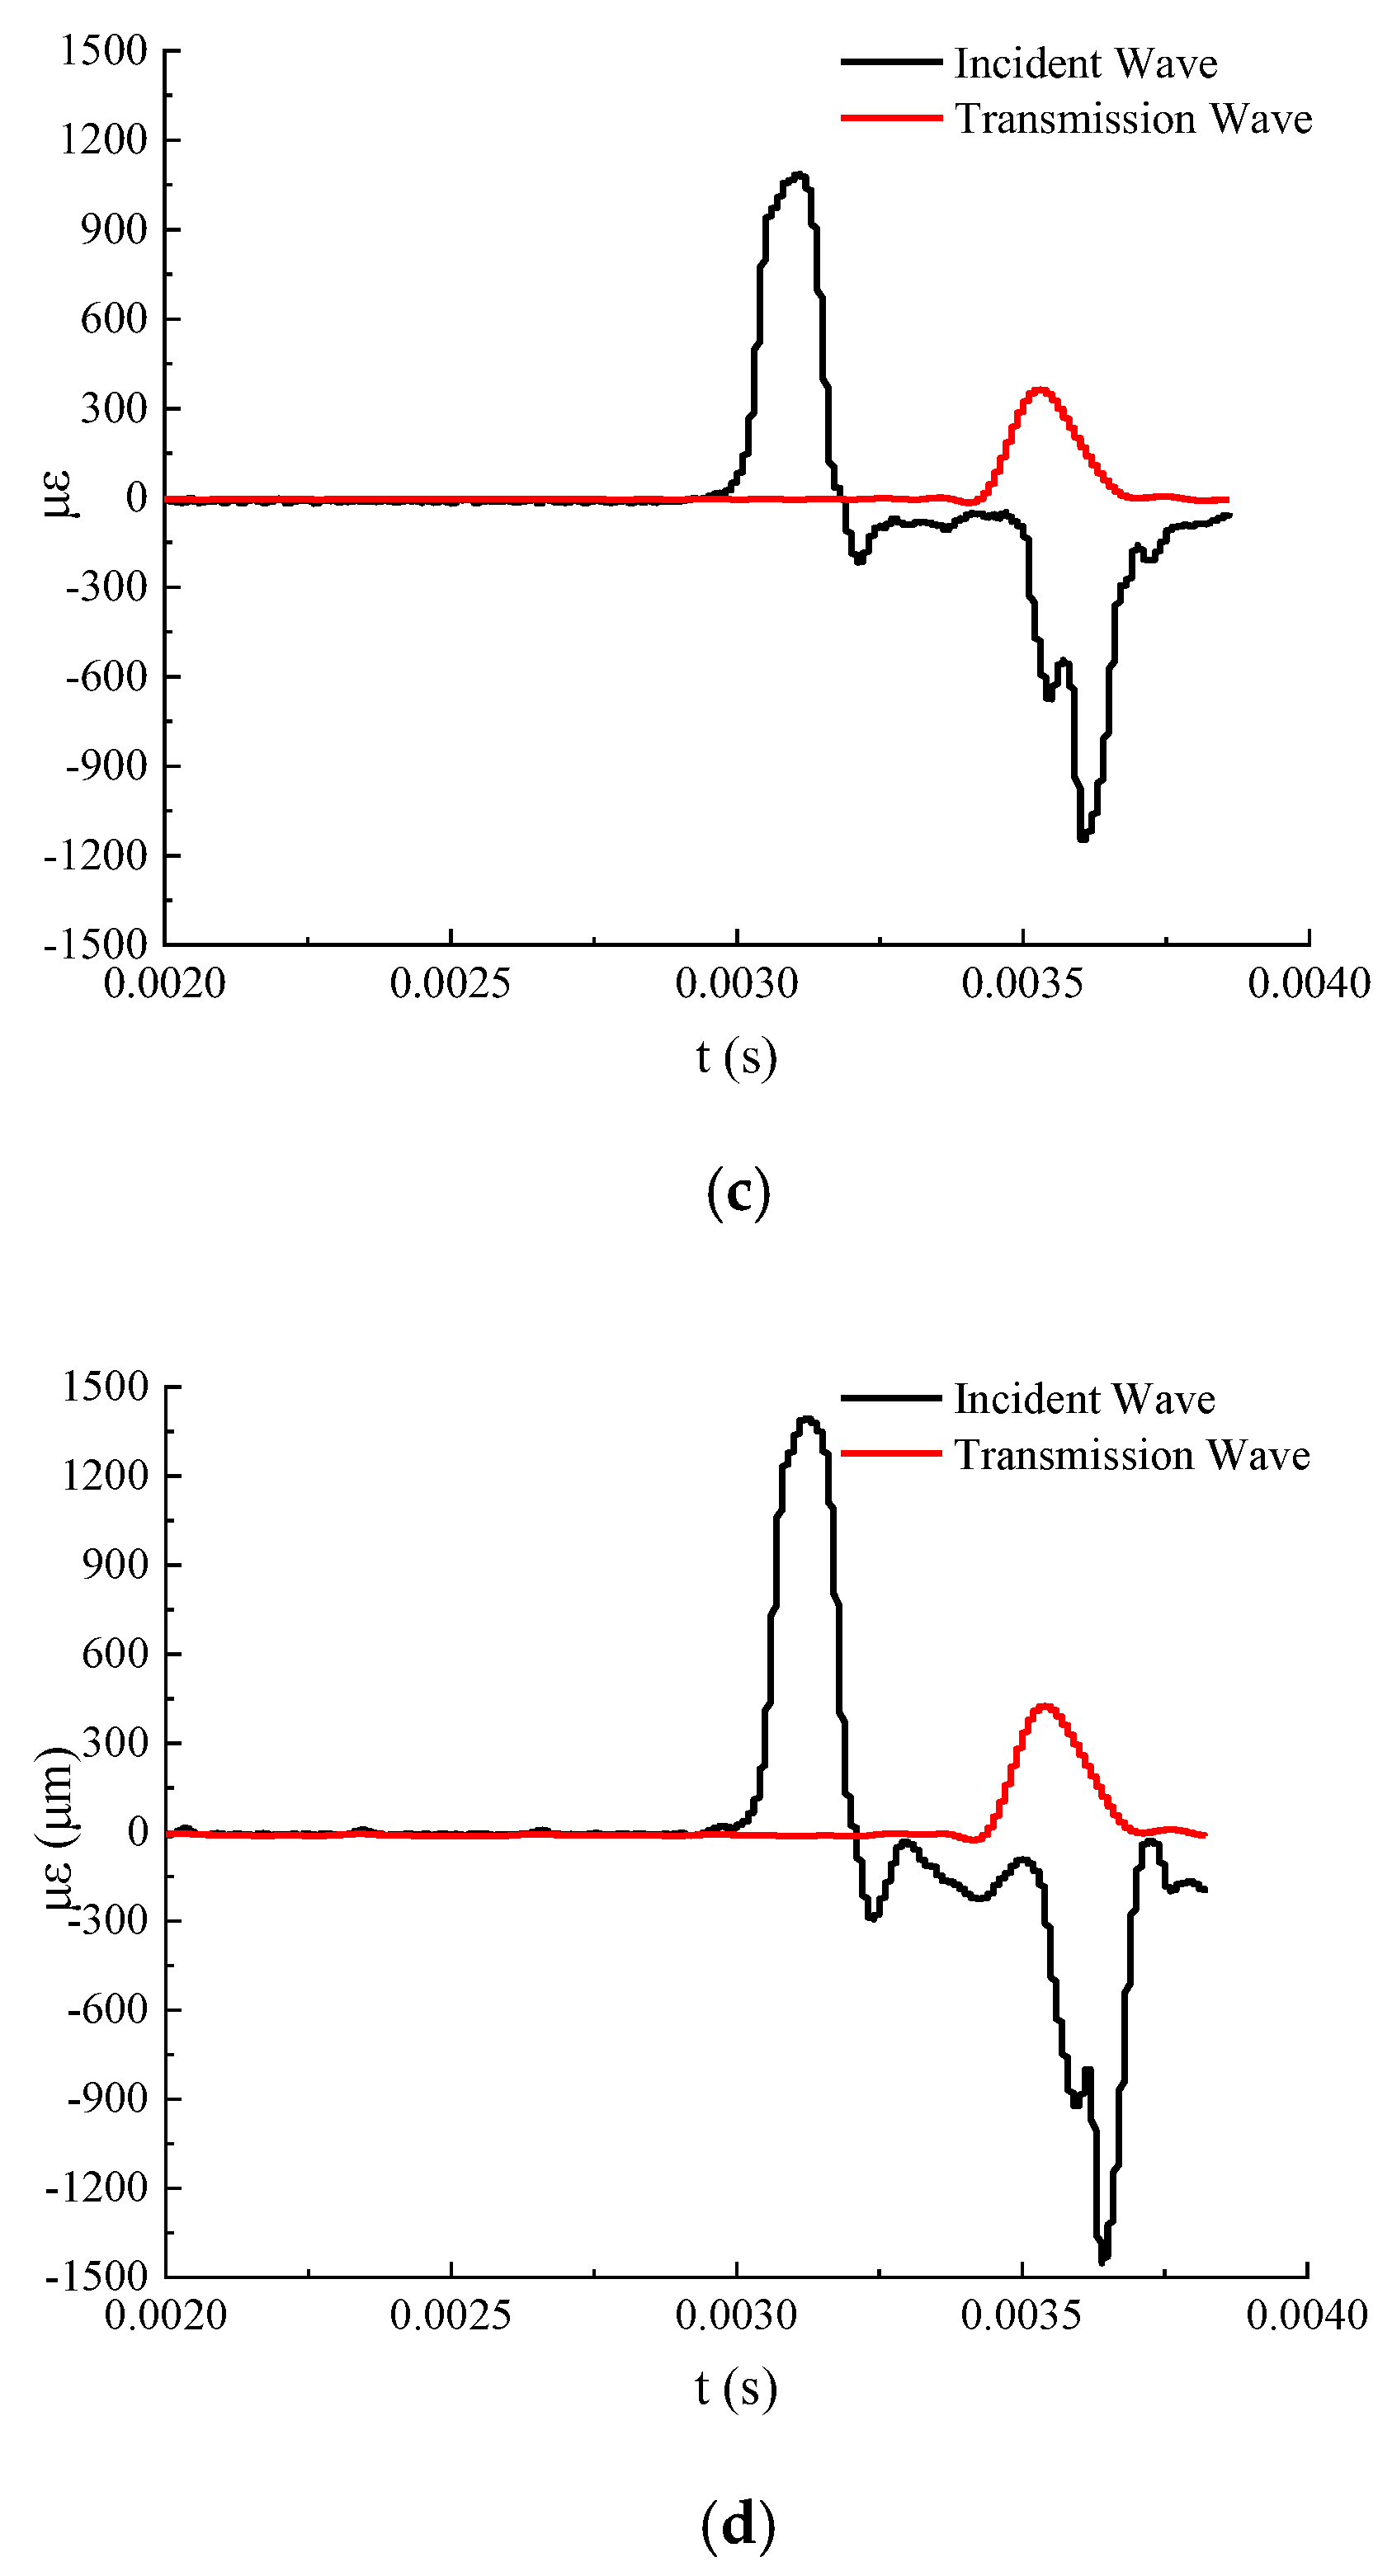
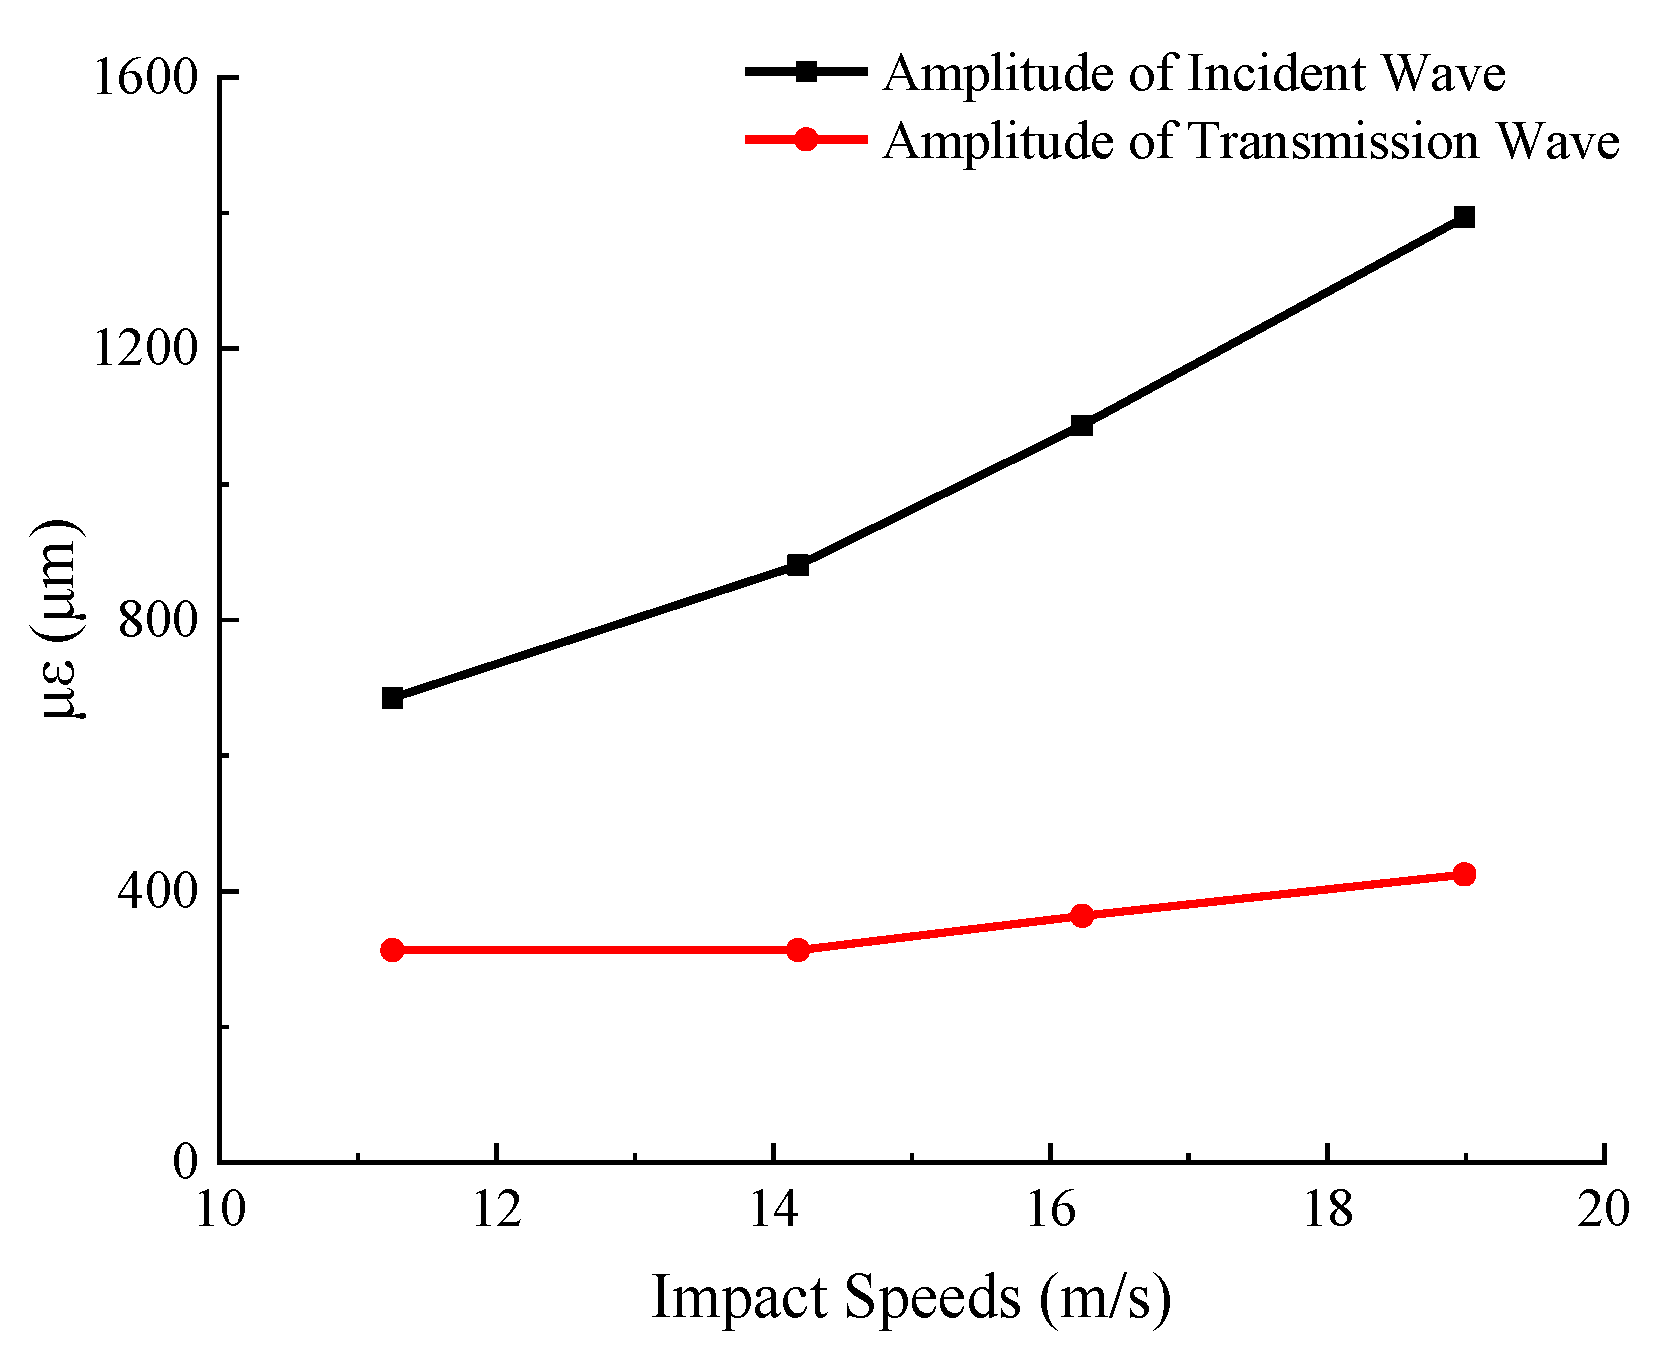
  • Dynamic impact uniaxial tests of reconstituted argillaceous weakly cemented rock mass specimens were carried out by using split Hopkinson pressure bar device. The strain waveform curves corresponding to different reorganization loads and different impact velocities were obtained. From the strain curve, it can be seen that the amplitude of transmission wave increases with the increase in recombination load, which indicates that the less energy absorbed by the specimen for extrusion deformation, the smaller the deformation and the lower the plasticity of the specimen with the increase in recombination load.
  • The stages of dynamic stress–strain curves of argillaceous weakly cemented rock mass can be divided into compaction stage, approximate linear elastic stage, microcrack growth stage and strain softening stage, which are similar to those of the quasi-static compression test.
  • From the stress–strain curves, it can be seen that the greater the restructuring load of the specimen of argillaceous weakly cemented rock mass is, the less obvious the compression stage of the stress–strain curve is, and the greater the elastic modulus is. The peak strength and modulus of elasticity of argillaceous weakly cemented rock samples are correlated with strain rate. The peak strength and modulus of elasticity increase with the increase in strain rate. When the strain rate is greater than 500 s−1, the strain softening stage has a significant downward trend, which indicates that the impact velocity causes certain damage to the internal cementation structure of the specimen.
  • The analysis of specimens after impact shows that the deformation of argillaceous weakly cemented rock mass decreases with the increase in restructuring load, and its impact resistance increases; the deformation of specimens increases with the increase in impact speed.

Author Contributions

Conceptualization, methodology, validation, data curation, visualization, writing—original draft preparation, L.M. and L.H.; investigation, Q.M., K.L., M.T., and H.Z.; formal analysis writing—review and editing, all authors; supervision, project administration, funding acquisition, L.H. All authors have read andagreed to the published version of the manuscript.

Funding

This study was supported by the National Natural Science Foundation of China (NSFC) (Grant No. 51574223, No.51704280).

Acknowledgments

The first author is grateful to all the co-authors for providing innovative ideas, the State Key Laboratory for Geomechanics and Deep Underground Engineering, China University of Mining and Technology, for providing instruments to conduct the research, and Xiyi Coal Mine, subordinated by China Resources Power Holdings Company Limited, for providing geological data and rock cores.

Conflicts of Interest

The authors declare no conflict of interest. The funders had no role in the design of the study; in the collection, analyses, or interpretation of data; in the writing of the manuscript, and in the decision to publish the results.

References

  1. Cao, D.Y.; Lin, Z.Y.; Zheng, Z.H.; Tan, J.Q. Coalfield Structures and Potential Evaluation of Coal Resources in China. Adv. Mater. Res. 2011, 356, 2937–2940. [Google Scholar] [CrossRef]
  2. He, M.-C.; Fang, Z.-J.; Zhang, P. Theoretical Studies on the Extrinsic Defects of Montmorillonite in Soft Rock. Mod. Phys. Lett. B 2011, 23, 2933–2941. [Google Scholar] [CrossRef]
  3. Corkum, A.G.; Martin, C.D. The mechanical behaviour of weak mudstone (Opalinus Clay) at low stresses. Int. J. Rock Mech. Min. Sci. 2007, 44, 196–209. [Google Scholar] [CrossRef]
  4. Yang, Y.-C.; Zhou, J.-W.; Xu, F.-G.; Xing, H.-G. An Experimental Study on the Water-Induced Strength Reduction in Zigong Argillaceous Siltstone with Different Degree of Weathering. Adv. Mater. Sci. Eng. 2016, 2016, 1–12. [Google Scholar] [CrossRef] [Green Version]
  5. Yilmaz, E.; Belem, T.; Bussière, B.; Benzaazoua, M. Relationships between microstructural properties and compressive strength of consolidated and unconsolidated cemented paste backfills. Cem. Concr. Comp. 2011, 33, 702–715. [Google Scholar] [CrossRef]
  6. Wang, H.; Jiang, Y.; Xue, S.; Shen, B.; Wang, C.; Lv, J.; Yang, T. Assessment of excavation damaged zone around roadways under dynamic pressure induced by an active mining process. Int. J. Rock Mech. Min. Sci. 2015, 77, 265–277. [Google Scholar] [CrossRef]
  7. Deng, H.F.; Zhou, M.L.; Li, J.L.; Sun, X.S.; Huang, Y.L. Creep degradation mechanism by water-rock interaction in the red-layer soft rock. Arab. J. Geosci. 2016, 9, 601. [Google Scholar] [CrossRef]
  8. Martin, C.D.; Lanyon, G.W. Measurement of in-situ stress in weak rocks at Mont Terri Rock Laboratory, Switzerland. Int. J. Rock Mech. Min. Sci. 2003, 40, 1077–1088. [Google Scholar] [CrossRef]
  9. Koralegedara, N.H.; Maynard, J.B. Chemical, mineralogical and textural properties of the Kope Formation mudstones: How they affect its durability. Eng. Geol. 2017, 228, 312–322. [Google Scholar] [CrossRef] [Green Version]
  10. Bizjak, K.F.; Petkovšek, B. Displacement analysis of tunnel support in soft rock around a shallow highway tunnel at Golovec. Eng. Geol. 2004, 75, 89–106. [Google Scholar] [CrossRef]
  11. Li, H.X.; Wang, Y.W.; Tang, B.X. Soft Rock Roadway Mesh Shell Lining Experimental Study of the Mechanical Properties. Adv. Mater. Res. 2013, 671, 774–777. [Google Scholar] [CrossRef]
  12. Sasaoka, T.; Shimada, H.; Lin, N.Z.; Takamoto, H.; Matsui, K.; Kramadibrata, S.; Sulistianto, B. Geotechnical issues in the application of rock bolting technology for the development of underground coal mines in Indonesia. Int. J. Min. Reclam. Environ. 2013, 28, 150–172. [Google Scholar] [CrossRef]
  13. Janas, P. Dimensioning of roadway supports in conditions of the Ostrava-Karvina coal field. Int. J. Rock Mech. Min. Sci. Geomech. Abs. 1991, 28, 374. [Google Scholar] [CrossRef]
  14. Su, X.; Li, Y.; Yang, Y. A Research into Extra-thick compound mudstone roof roadway failure mechanism and security control. Proc. Eng. 2011, 26, 516–523. [Google Scholar]
  15. Jiang, P.F. Simulation Analysis of the Soft Rock Inclined Shaft Surrounding Rock Control with Different Bolt Support Patterns. Adv. Mater. Res. 2014, 988, 377–382. [Google Scholar] [CrossRef]
  16. Yadav, S.; Saldana, C.; Murthy, T.G. Experimental investigations on deformation of soft rock during cutting. Int. J. Rock Mech. Min. Sci. 2018, 105, 123–132. [Google Scholar] [CrossRef]
  17. Arnould, M. Discontinuity networks in mudstones: A geological approach. Bull. Eng. Geol. Environ. 2006, 65, 413–422. [Google Scholar] [CrossRef]
  18. Fan, G.; Chen, M.; Zhang, D.; Wang, Z.; Zhang, S.; Zhang, C.; Li, Q.; Cao, B. Experimental Study on the Permeability of Weakly Cemented Rock under Different Stress States in Triaxial Compression Tests. Geofluids 2018, 2018, 1–9. [Google Scholar] [CrossRef]
  19. Taylor, L.M.; Chen, E.-P.; Kuszmaul, J.S. Microcrack-induced damage accumulation in brittle rock under dynamic loading. Comp. Methods Appl. Mech. Eng. 1986, 55, 301–320. [Google Scholar] [CrossRef]
  20. Bagde, M.N.; Petroš, V. The Effect of Machine Behaviour and Mechanical Properties of Intact Sandstone Under Static and Dynamic Uniaxial Cyclic Loading. Rock Mech. Rock Eng. 2004, 38, 59–67. [Google Scholar] [CrossRef]
  21. Li, H.B.; Feng, H.P.; Liu, B.; Li, J.R. Experimental Studies on Mechanical Properties of Rock Joints under Dynamic Loading. Key Eng. Mater. 2006, 326, 1709–1712. [Google Scholar] [CrossRef]
  22. Liu, E.; He, S. Effects of cyclic dynamic loading on the mechanical properties of intact rock samples under confining pressure conditions. Eng. Geol. 2012, 125, 81–91. [Google Scholar] [CrossRef]
  23. Gong, F.; Ye, H.; Luo, Y. The Effect of High Loading Rate on the Behaviour and Mechanical Properties of Coal-Rock Combined Body. Shock Vibr. 2018, 2018, 1–9. [Google Scholar] [CrossRef] [Green Version]
  24. Murrell, S.A.F.; Ismail, I.A.H. The effect of decomposition of hydrous minerals on the mechanical properties of rocks at high pressures and temperatures. Tectonophysics 1976, 31, 207–258. [Google Scholar] [CrossRef]
  25. Van Itterbeeck, J.; Horne, D.J.; Bultynck, P.; Vandenberghe, N. Stratigraphy and palaeoenvironment of the dinosaur-bearing Upper Cretaceous Iren Dabasu Formation, Inner Mongolia, People’s Republic of China. Cretac. Res. 2005, 26, 699–725. [Google Scholar] [CrossRef]
  26. Vaniman, D.T.; Bish, D.L.; Ming, D.W.; Bristow, T.F.; Morris, R.V.; Blake, D.F.; Chipera, S.J.; Morrison, S.M.; Treiman, A.H.; Rampe, E.B.; et al. Mineralogy of a mudstone at Yellowknife Bay, Gale crater, Mars. Science 2014, 343, 1243480. [Google Scholar] [CrossRef]
  27. Wang, S.; Han, L.; Meng, Q.; Jin, Y.; Zhao, W. Investigation of Pore Structure and Water Imbibition Behavior of Weakly Cemented Silty Mudstone. Adv. Civ. Eng. 2019, 2019, 1–13. [Google Scholar] [CrossRef] [Green Version]
  28. Lenoir, N.; Bornert, M.; Desrues, J.; Bésuelle, P.; Viggiani, G. Volumetric Digital Image Correlation Applied to X-ray Microtomography Images from Triaxial Compression Tests on Argillaceous Rock. Strain 2007, 43, 193–205. [Google Scholar] [CrossRef]
  29. Pujiyanto, E.; Widyo Laksono, P.; Triyono, J. Synthesis and Characterization of Hydroxyapatite Powder from Natural Gypsum Rock. Adv. Mater. Res. 2014, 893, 56–59. [Google Scholar] [CrossRef]
  30. Kılıç, A.; Teymen, A. Determination of mechanical properties of rocks using simple methods. Bull. Eng. Geol. Environ. 2008, 67, 237–244. [Google Scholar] [CrossRef]
  31. Hassanzadeh, M. Fracture Mechanical Properties of Rocks and Mortar/Rock Interfaces. MRS Proc. 2011, 370. [Google Scholar] [CrossRef]
  32. Wang, J.; Liu, X.; Zhao, B.; Song, Z.; Lai, J. Experimental investigation and constitutive model for lime mudstone. Springerplus 2016, 5, 1–14. [Google Scholar] [CrossRef] [PubMed] [Green Version]
  33. Chen, W.; Zhang, B.; Forrestal, M.J. A split Hopkinson bar technique for low-impedance materials. Exp. Mech. 1999, 39, 81–85. [Google Scholar] [CrossRef]
  34. Gama, B.A.; Lopatnikov, S.L.; Gillespie, J.W. Hopkinson bar experimental technique: A critical review. Appl. Mech. Rev. 2004, 57, 223–250. [Google Scholar] [CrossRef]
  35. Zwiessler, R.; Kenkmann, T.; Poelchau, M.H.; Nau, S.; Hess, S. On the use of a split Hopkinson pressure bar in structural geology: High strain rate deformation of Seeberger sandstone and Carrara marble under uniaxial compression. J. Struct. Geol. 2017, 97, 225–236. [Google Scholar] [CrossRef]
  36. Shi, X.; Jing, H.; Yin, Q.; Zhao, Z.; Han, G.; Gao, Y. Investigation on physical and mechanical properties of bedded sandstone after high-temperature exposure. Bull. Eng. Geol. Environ. 2020. [Google Scholar] [CrossRef]
Figure 1. Primary specimens of grey mudstone.
Energies 13 03215 g001
Figure 2. The structural reorganization device of argillaceous weakly cemented rock. (a) Loading device; (b) recombination mold; (c) the data acquisition and recording system.
Energies 13 03215 g002
Figure 3. The reorganized specimens of argillaceous weakly cemented rock.
Energies 13 03215 g003
Figure 4. Split Hopkinson pressure bar experimental facility.
Energies 13 03215 g004
Figure 5. Layout of the SHPB experiment specimens.
Energies 13 03215 g005
Figure 6. Strain waveforms of incident bars and transmissive bars under different reorganization loads. (a) 5Mpa; (b) 10MPa; (c) 15MPa.
Energies 13 03215 g006aEnergies 13 03215 g006b
Figure 7. Transmission wave amplitudes under different reorganization loads.
Energies 13 03215 g007
Figure 8. Strain waveforms of incident bars and transmissive bars at different impact speeds. (a) 0.3 MPa, 11.25 m/s; (b) 0.4 MPa, 14.18 m/s; (c) 0.5 MPa, 16.23 m/s; (d) 0.6 MPa, 18.99 m/s.
Energies 13 03215 g008aEnergies 13 03215 g008b
Figure 9. Maximum amplitude of incident and transmitted waves at different impact speeds.
Energies 13 03215 g009
Figure 10. Stress–strain curves of argillaceous weakly cemented rock under different reorganization loads.
Energies 13 03215 g010
Figure 11. Stress–strain curves of argillaceous weakly cemented rock at different strain rates masses.
Energies 13 03215 g011
Figure 12. Peak stress–strain rate curve of argillaceous weakly cemented rock.
Energies 13 03215 g012
Figure 13. Dynamic impact specimen dimension curve of argillaceous weakly cemented rock under different reorganization loads.
Energies 13 03215 g013
Figure 14. Specimens after impact under different reorganization loads. (a) 5MPa; (b) 10 MPa; (c) 15 MPa.
Energies 13 03215 g014
Figure 15. Change of specimen size under different impact pressure.
Energies 13 03215 g015
Figure 16. Specimens after impact under different impact loads. (a) 0.3 MPa; (b) 0.4 MPa; (c) 0.5 MPa; (d) 0.6 MPa.
Energies 13 03215 g016
Table 1. The gradient applied load reorganization plan for argillaceous weakly cemented rock mass.
Axial Loads/MPaLoad Classification
52.55
102.557.510
152.557.51012.515
Table 2. Control parameters for different reorganization loads of specimens.
IdentifierRecombination Load/MPaImpact Pressure/MPaWater Content
Sel2-1~350.515%
Sel2-4~6100.515%
Sel2-7~9150.515%
Table 3. Control parameters under different impact pressures.
IdentifierRecombination Load/MPaImpact Pressure/MPaWater Content
Sel3-1~3100.315%
Sel3-4~6100.415%
Sel3-7~9100.515%
Sel3-10~12100.615%
Table 4. Speciation change parameters of specimens under different reorganization loads.
IdentifierReorganization Loads/MPaAverage Diameter/mmAverage Height/mm
Sel2-1~356032
Sel2-4~6105837
Sel2-7~9155441
Table 5. Change of morphological parameters of argillaceous weakly cemented rock specimen under different impact velocity loads.
IdentifierImpact Pressure/MPaImpact Speed/m/sAverage Diameter/mmAverage Height/mm
Sel3-1~30.311.755248
Sel3-7~90.414.185637
Sel3-13~150.516.015831
Sel3-19~210.618.995927

