Article

Evaluation of Illuminance Measurement Data through Integrated Automated Blinds and LED Dimming Controls in a Full-Scale Mock-Up

1
Energy ICT Convergence Research Department, Korea Institute of Energy Research, 140 Yuseong-daero, 1312 beon-gil, Yuseong-gu, Daejeon 34101, Korea
2
Department of Architecture, College of Engineering, Korea University, 145 Anam-ro, Seongbuk-gu, Seoul 02841, Korea
*
Author to whom correspondence should be addressed.
Energies 2020, 13(12), 3238; https://doi.org/10.3390/en13123238
Submission received: 13 May 2020 / Revised: 12 June 2020 / Accepted: 17 June 2020 / Published: 22 June 2020
(This article belongs to the Section D1: Advanced Energy Materials)

Abstract

:
In this study, the indoor illuminance of a full-scale mock-up with LED system and external automated blinds was quantitatively evaluated by performing experiments involving integrated blinds and LED dimming controls. Actual illuminance experimental data were constructed and analyzed using commercialized blind control logic. The results revealed changes in the LED dimming ratio (turning-off ratio), and that the indoor illuminance required for the indoor space of 500 ± 30 lx could be secured in all cases when daylight was introduced according to weather conditions. It was found that because the angle and vertical position (VP) were fixed, manual blind controls could not efficiently use daylight, even though they could cut off solar radiation. When the blinds were automatically controlled in three-steps based on the exterior vertical illuminance under clear sky, the dimming rates of Zones A and B were found to be 68 and 50%, respectively. When the blinds were automatically controlled in four-steps, the dimming rates of Zone A (1.5 m from the window) and Zone B (4.5 m from the window) were found to be at 70% and 52%, respectively. If the VP and slat angle could be adjusted without lowering all the blinds, it would be possible to secure work plane illuminance, because the inflow of daylight increases, without the direct impact of direct sunlight and glare. These results indicate that integrated blinds and LED dimming controls can contribute to maintaining standard illuminance and saving lighting energy using daylight.

Graphical Abstract

1. Introduction

1.1. Background and Purpose

The purpose of indoor lighting is to provide a suitable environment for the visual work of users. In general, the lighting energy of a building accounts for approximately 20–30% of the total building energy consumption [1,2,3]. In the recently revised building energy savings design criteria of South Korea (November 2018), the criteria and score ranges of LED lighting items were expanded to reduce lighting energy [4]. Such efforts and concern for reducing lighting energy have developed LED lighting technology, and it is expected that LED lighting will replace existing light sources, in view of its high efficiency and eco-friendly characteristics, which are attracting attention. Moreover, among the LED lighting control methods, dimming controls that save lighting energy using daylight are continuously being developed. LED dimming control is a technology that maintains constant indoor illuminance regardless of the external weather conditions, by automatically operating artificial LED lighting when the brightness of daylight is lower than the illuminance set by the user. However, excessive daylight only for reducing lighting energy may cause an unpleasant thermal environment in indoor spaces. To address this problem, systems for integrated blinds and LED dimming controls capable of cutting off solar heat have been developed. Such systems provide benefits in terms of economic efficiency, and can be highly utilized by managers and occupants, because they do not require expensive systems [5]. Moreover, the need for integrated blinds and LED dimming controls is increasing, because if appropriate control methods are applied in response to the continuously changing external environment, it has the benefit of maximizing energy reduction [6,7,8,9,10,11]. To maximize the lighting energy reduction and to efficiently operate LED lighting integrated with blinds, empirical studies on dimming controls based on the relationships between daylight and artificial lighting under different sky conditions are required.
Many studies have been conducted on integrated blinds and LED controls based on detailed theories, such as fuzzy control, genetic algorithms, and neural networks, but the cases in which automatic control logic is actually applied to buildings are scarce, due to weather conditions that are difficult to predict, and complicated control variables [12,13]. Therefore, in this study, a focus was given to the visual environment and lighting energy reduction, and the integrated control of an external automated venetian blind and a high-efficiency LED system was conducted. Actual illuminance experimental data were constructed and analyzed using the commercialized blind control logic of the French company S (Paris, France). The purpose of this study is to provide detailed measurement data to practically upgrade the logic for integrated automated blinds and LED dimming controls, which are commercially available.

1.2. Literature Review

This literature review begins with a discussion on LED dimming control. Integrated daylighting systems with auto-dimming lighting are emerging as an effective green building technology with high potential for energy saving and visual comfort. If the predicted illuminance of the work plane exceeds the set target illuminance, the luminaire is turned off; conversely, if it does not meet the target illuminance, the luminaire is turned on and dimmed to match the insufficient illuminance. Studies in various climates have shown that when the daylighting is sufficient, auto-dimming systems achieve significant lighting-energy savings.
After reviewing more than 80 papers, Williams et al. [14] calculated the average energy savings enabled by various lighting controls. On average, occupancy-based controls in real installations saved approximately 24–38% of the baseline light energy. Galasiu et al. [15] conducted field measurements in Ottawa (ON, Canada). When the lights were fully on from 6 a.m. to 6 p.m., they found that a lighting auto-dimming system under a clear sky reduced the energy consumption by 50–60%. Fernandes et al. [16] found that integrating daylighting-based dimming controls with illuminance set-point tuning of the working plane conserves 28% of the lighting energy of day-lit zones in the New York Times headquarters building (New York, NY, USA); this figure is based on the recommended 12 W/m2 lighting power density in ASHRAE 90.1-2007. Richman et al. [17] evaluated LED and T8 fluorescent lamp in the Pacific Northwest National Laboratory (PNNL, USA). They found that LED products consume 3–24% less lighting energy than T8 fluorescent lamps.
Al-Ashwal and Budaiwi [18] investigated the energy performance of office buildings that integrate daylight and artificial lighting in hot climates. They studied the effects of window design (window area, height, and glazing type) on the energy-saving performance. The results revealed up to 35% reduction in the lighting-energy consumption, after integrating daylight and artificial lighting. The method of Caicedo et al. [19] achieves the target illuminance in the workspace plane based on illuminance measurements from light sensors situated in the ceiling, and additional prior information from a sensor calibration. The proposed control method consumed 10% less lighting power than when the light sensors were located at the workspace plane.
Using lighting simulation software, Yoo et al. [20] calculated the distribution of daylight illumination in an office, and the dimming ratios for individual control of LED lights. They found that the power consumption of electrical lighting could be reduced by 40–70%, depending on the season and weather conditions. In addition, Parise and Martirano [21] suggested a criterion for evaluating the yearly daylight impact on the energy saving of internal lighting. Adopting the daylight lumen method, they considered the daylight availability, the lighting system layout, and the control system arrangement. Gentile and Dubois [22] simulated the effectiveness of lighting control systems in an office. Their simulations, which were based on actual occupancy data, achieved lighting energy savings from 30 to 55% in extreme cases. Among four different lighting control systems monitored by Gentile et al. [23], the daylight-linked lighting control saved 79% of the lighting energy. Nagy et al. [24] investigated the energy savings of a double-blind occupancy system. The lighting energy savings ranged 37.9 to 73.2% relative to the baseline consumption to relative to the worst-case scenario.
Blind control has also been investigated in previous studies. Gagne et al. [25] evaluated the indoor illuminance levels in a room with blinds, and assessed indoor visual qualities, such as the glare index, uniformity ratio, and occupant satisfaction. Gagne et al. [25] developed an interactive expert system tool for designing daylighting scenarios. The system targets user-defined glare and illuminance goals in a three-dimensional model. In case studies, the expert system found designs with improved performance for a variety of initial geometries and daylighting performance goals. To control shading on a building, Tzempelikos et al. [26] constructed a device that operates the blind when the solar radiation on the window exceeds 20 W/m2. Conversely, when the indoor illuminance exceeds 500 lx, the device automatically switches off the artificial lighting. The simulation results indicate that an integrated approach, which combines the automatic control of motorized shading with controllable electric lighting systems, substantially reduces the energy demand of cooling and lighting in perimeter spaces. The actual energy reduction depends on the climatic conditions and orientation. Olbina et al. [27] analyzed the total energy consumption of a building under the control of indoor energy gain and solar radiation. They adopted a five-step dimming system depending on the illuminance level of the indoor daylighting. The reference illuminance was 500 lx, and the blind system operated when the illuminance exceeded 2000 lx.
Chan and Tzempelikos [28] adopted the typical blind-control strategy, which avoids direct illuminance, and considers the profile angle variations in the blind geometry. Specifically, the cutoff angle is calculated from the solar profile angle, and rotated to observe the variations. Chan and Tzempelikos [29] developed new strategies for venetian blind control, and demonstrated that their strategies achieve the correct balance between accuracy (for slats with specular properties) and computational time. Control methods for light redirection and glare protection promise to overcome the problems with traditional cutoff angle control. Such methods have been developed for different material characteristics and selected set points, and are available as model-based or model-predictive controls. The practical issues and advantages/disadvantages of each method were discussed, along with the annual daylighting metrics, temporal glare graphs, and the resulting tilt angles. The strategy of Koo et al. [30] controls both the tilt angle and blind position of multiple blind products. Using the model-based predictor EnergyPlus, Kim and Park [31] predicted the optimal slat angles within a 24 h time horizon. However, their approach is computationally expensive.
The dependence of daylight availability on the energy-saving potential of auto-dimming and automated shading systems has also been confirmed in numerical studies. Mettananta and Chaiwiwatworakul [6] reported that more than 24% of the lighting energy can be saved by a system consisting of auto-dimming lighting and automatic vertical blinds, relative to the base case with full artificial lighting. Their tests were performed in a laboratory with a north-west facing façade in Thailand. Chaiwiwatworakul et al. [7] indicated that 80% of the lighting energy in a Thailand office building can be conserved by an automated blind system and an auto-dimming ballast lighting system. Judging from these previous studies, the lighting-energy savings enabled by daylight-responsive auto-dimming and automated blind systems largely depend on the daylight availability, which itself depends on the location and orientation of the building.
In a simulation study, Bodart et al. [8] modeled several façade configurations, considering the four main orientations with three combinations of internal wall reflection coefficients. These simulations revealed the main parameters affecting lighting consumption. We learned that daylighting can reduce the artificial lighting consumption by 50–80%.
Shen et al. [9] proposed integrated blind and LED control systems for maximum energy efficiency and user comfort. They quantitatively compared seven control strategies on a co-simulation platform consisting of BCVTB, EnergyPlus, and Matlab. A reference office building was simulated in three climate zones (Baltimore, London, and Abu-Dhabi), installed with two types of blinds (interior and exterior) and two window-to-wall ratios of 66 and 100%.
The simulation algorithm of Reinhart et al. [10] predicts the lighting energy performance of manually and automatically controlled electric lighting and blind systems in private and two-person offices. They applied their algorithm to a private office with a southern façade. Depending on the user, the electric-lighting energy demand of the manually controlled system ranged 10 to 39 kWh/m2. The predicted mean energy savings of installing a switch-off occupancy sensor in the example office was 20%. Babu et al. [11] studied the performances of automated blinds and auto-dimming lighting systems in a rotatable testbed facility located in tropical Singapore. As the performance measures, they considered the lighting-energy savings and occupant visual comfort. They reported that LED lamps consume approximately 24% less energy than non-dimmable T5 lighting. Auto-dimming technology improved the energy savings to 46%. When coupled to LED lamps, the auto-dimming conserved an impressive 80% of the baseline lighting energy.

2. Materials and Methods

2.1. Study Methods

This study performed experiments on integrated blind and LED dimming control using a full-scale mock-up with LED lighting equipment and an external automated blind. Geometric relationships between buildings and the sun, the calculation process, and theories related to the control of the angles and heights of blinds are discussed. In addition, the sun profile angle is derived by calculating the position of the sun. The indoor illuminance (daylight illuminance + artificial illuminance) of each experimental case is then quantitatively evaluated through LED dimming control (Standard indoor illuminance 500 lx) [32] integrated with blind control based on the exterior vertical illuminance. Figure 1 shows a flow diagram of this study.

2.1.1. Measuring Period #1 (No Blinds + LED Dimming Controls)

Lighting energy can be saved by the use of natural lighting. If lighting systems are continuously used regardless of the changes in the exterior and indoor illuminances, it is not possible to avoid increase in the use of lighting energy. In other words, the dimming control of lighting equipment is important to save lighting energy. Therefore, the standard illuminance was set prior to the integration of blind controls. The basic light environment of the target space was measured by using dimming controls during the measuring period #1 (June to August 2019) under the basic envelope conditions with no blinds and various sky conditions (clear, intermediate, and overcast sky).

2.1.2. Measuring Period #2 (Integrated Automated Blinds and LED Dimming Controls)

Measuring period #2 is the period in which cutting off the solar radiation is necessary, because excessive direct sunlight is introduced to the work plane. In the next step, the manual control of the external automated blinds (angle and height control) and LED dimming controls were conducted at the same time during the measuring period #2 (September to October 2019). In addition, automatic blind controls (cut-off angle control + vertical position (VP) control based on the exterior vertical illuminance) and LED dimming controls were performed simultaneously to measure the light environment (daylight and artificial illuminance) and dimming rate. Overcast sky were excluded from the experiment period, because blind deployment is not necessary under an overcast sky.

2.2. Theories

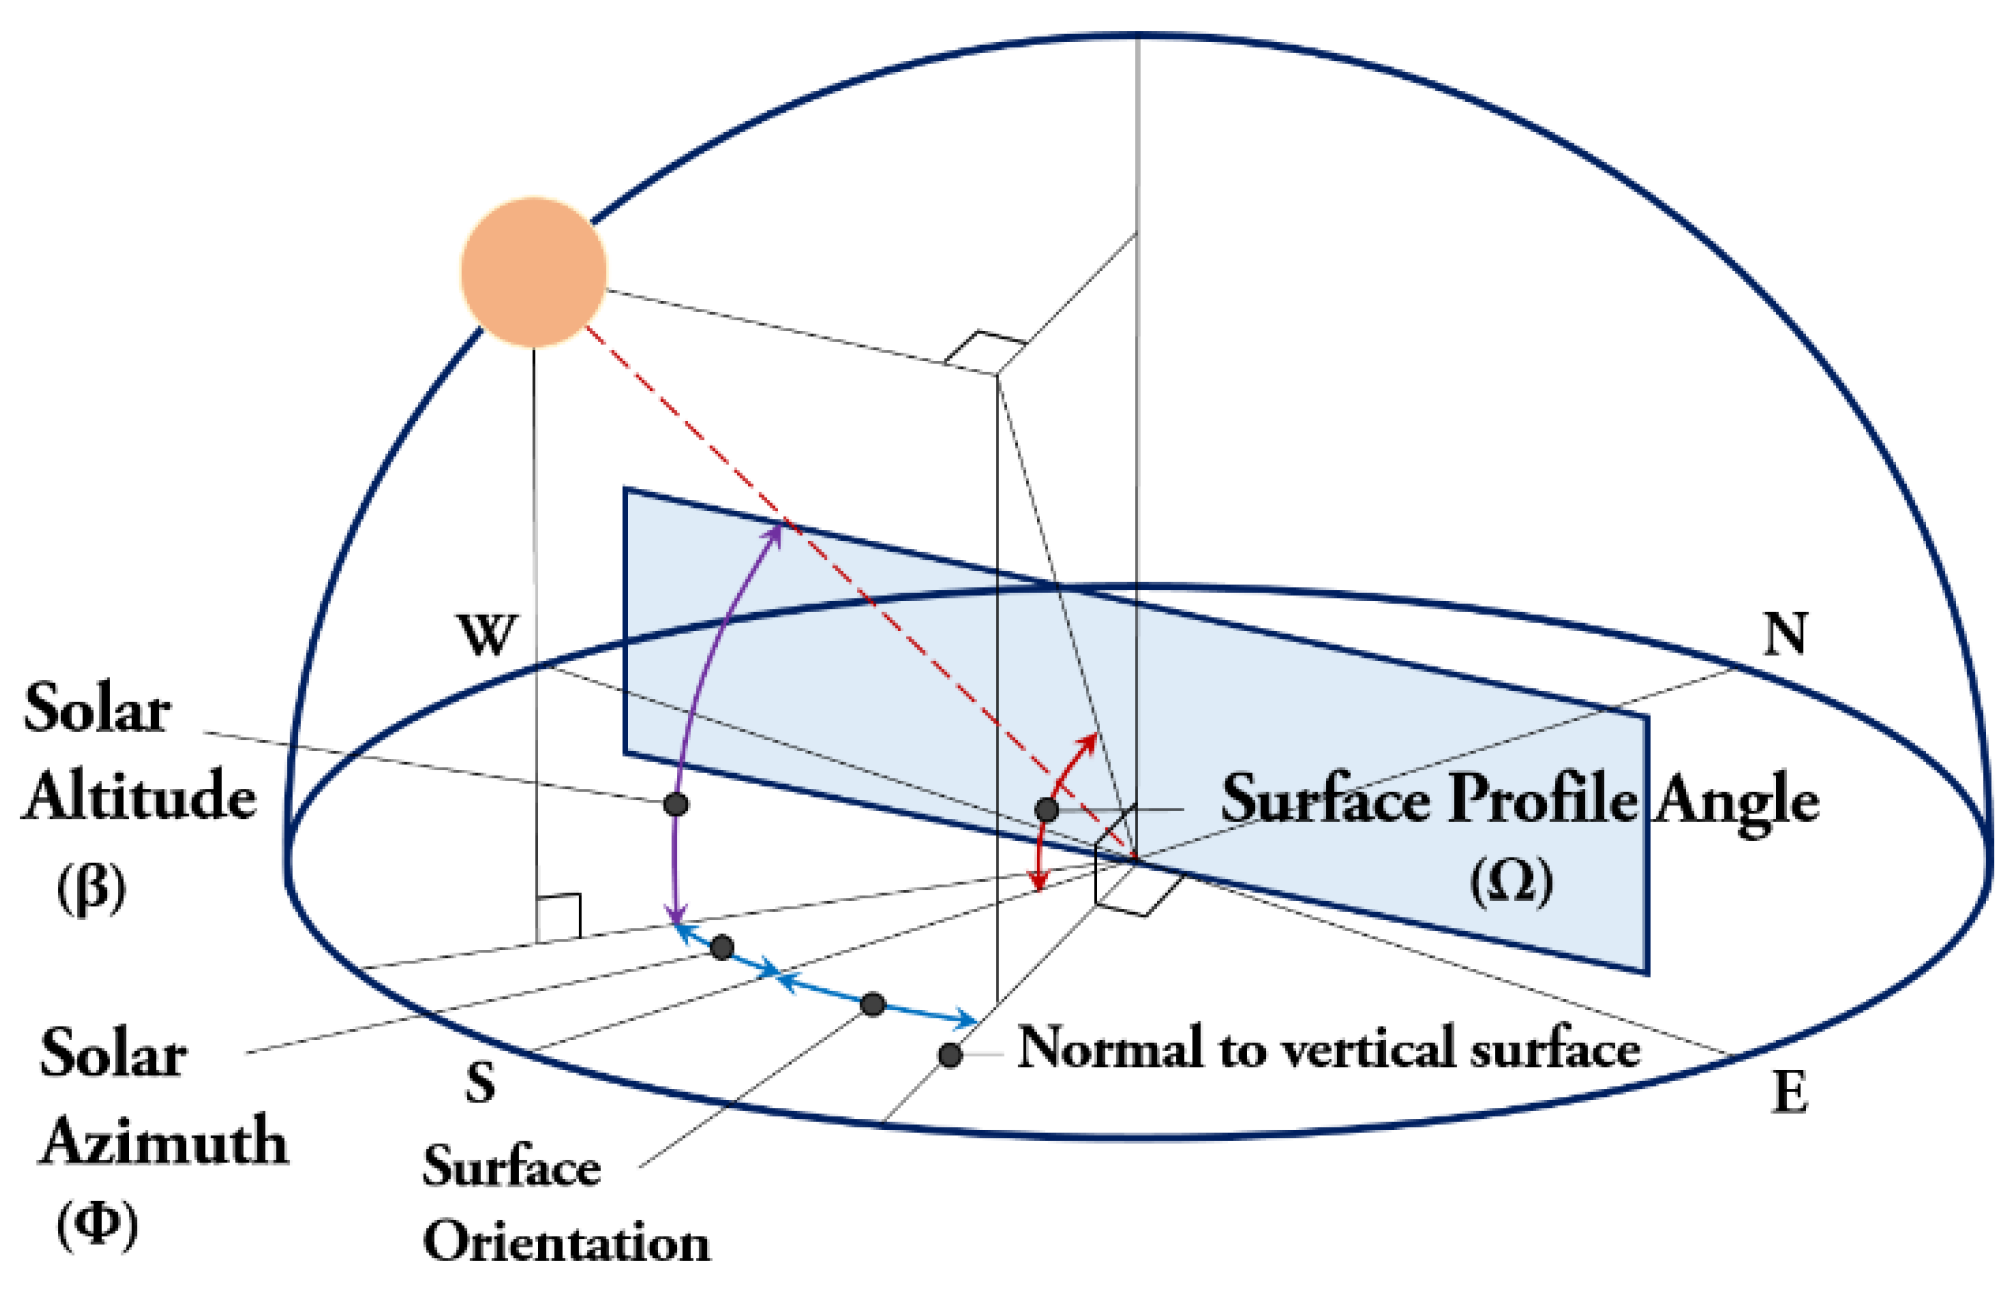
2.2.1. Solar Altitude and Azimuth

To calculate the profile angle and cut-off angle, which are the major variables in basic calculations of the sun position and analysis of blinds, the solar altitude and azimuth must be calculated. Figure 2 shows that the solar altitude is the angle between the horizon and the sun. It can be obtained from the following Equation (1) [33], using the latitude of the observation point and the hour angle:
sin β = cos L × cos δ × cos H + sin L × sin δ
where, β = solar altitude (°), L = latitude (cd/m2), δ = ecliptic, solar declination, H = hour angle.
To obtain the solar altitude, the solar declination and hour angle must be calculated. The solar declination means that the earth’s axis of rotation is tilted at an angle of 23.5° to the normal of the plane passing through the Sun and the Equator. The solar declination and hour angle can be obtained using the following Equations (2)–(5) [33]:
δ = 23.45   sin   ( 360 284 + n 365 )
where δ = ecliptic, solar declination, n = day number (January 1 = day 1).
A S T = L S T + E T + ( L 135 ° ) / 15 °
where, AST = apparent Solar Time, LST = local standard time, ET = equation of time, L = latitude.
The equation of time (ET) is calculated using the following equation:
ET = 229.2 ( 0.00000075 + 0.001808 cos B 0.032077 sin B 0.014615 cos 2 B 0.04089 sin 2 B )
B   = ( n 1 ) × ( 360 / 365 ) ,
The solar azimuth refers to the clockwise horizontal angle between true north and the position of the sun. It can be obtained using the following Equation (6) [33]:
cos = sin β × sin L × sin δ cos β × cos L
where, β = solar altitude (°), L = latitude (cd/m2), δ = ecliptic, solar declination, Ø = solar azimuth.

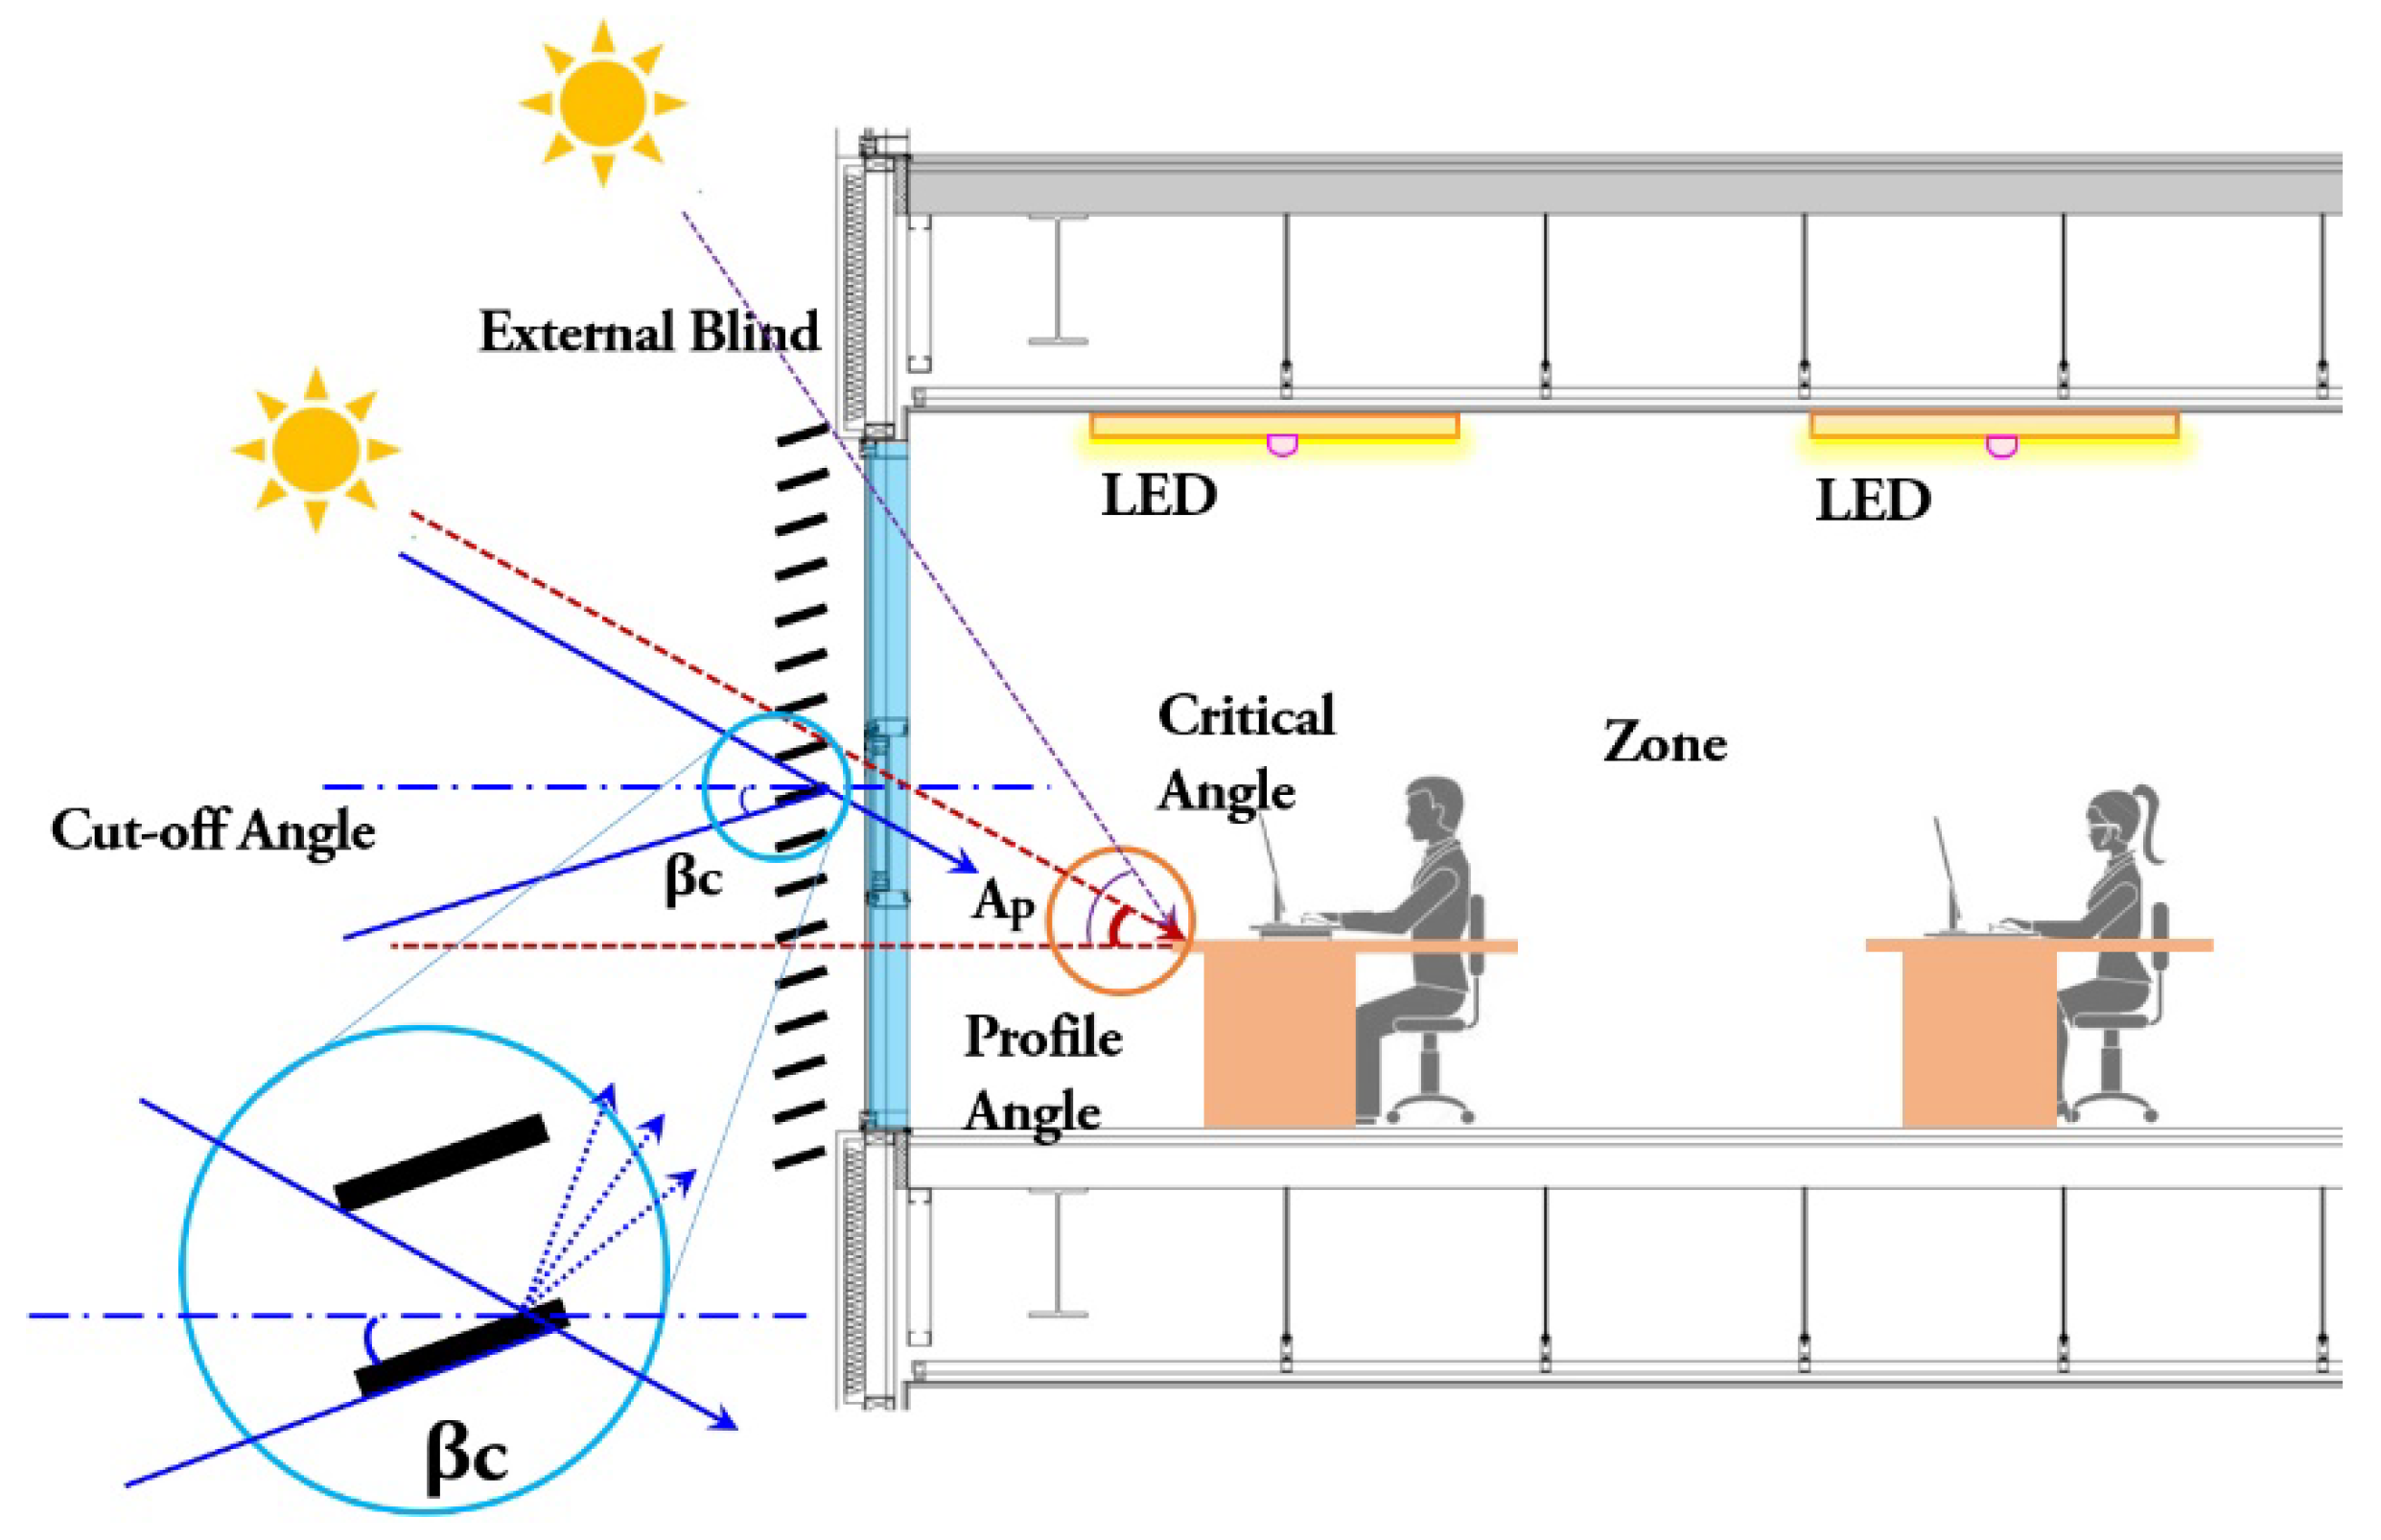
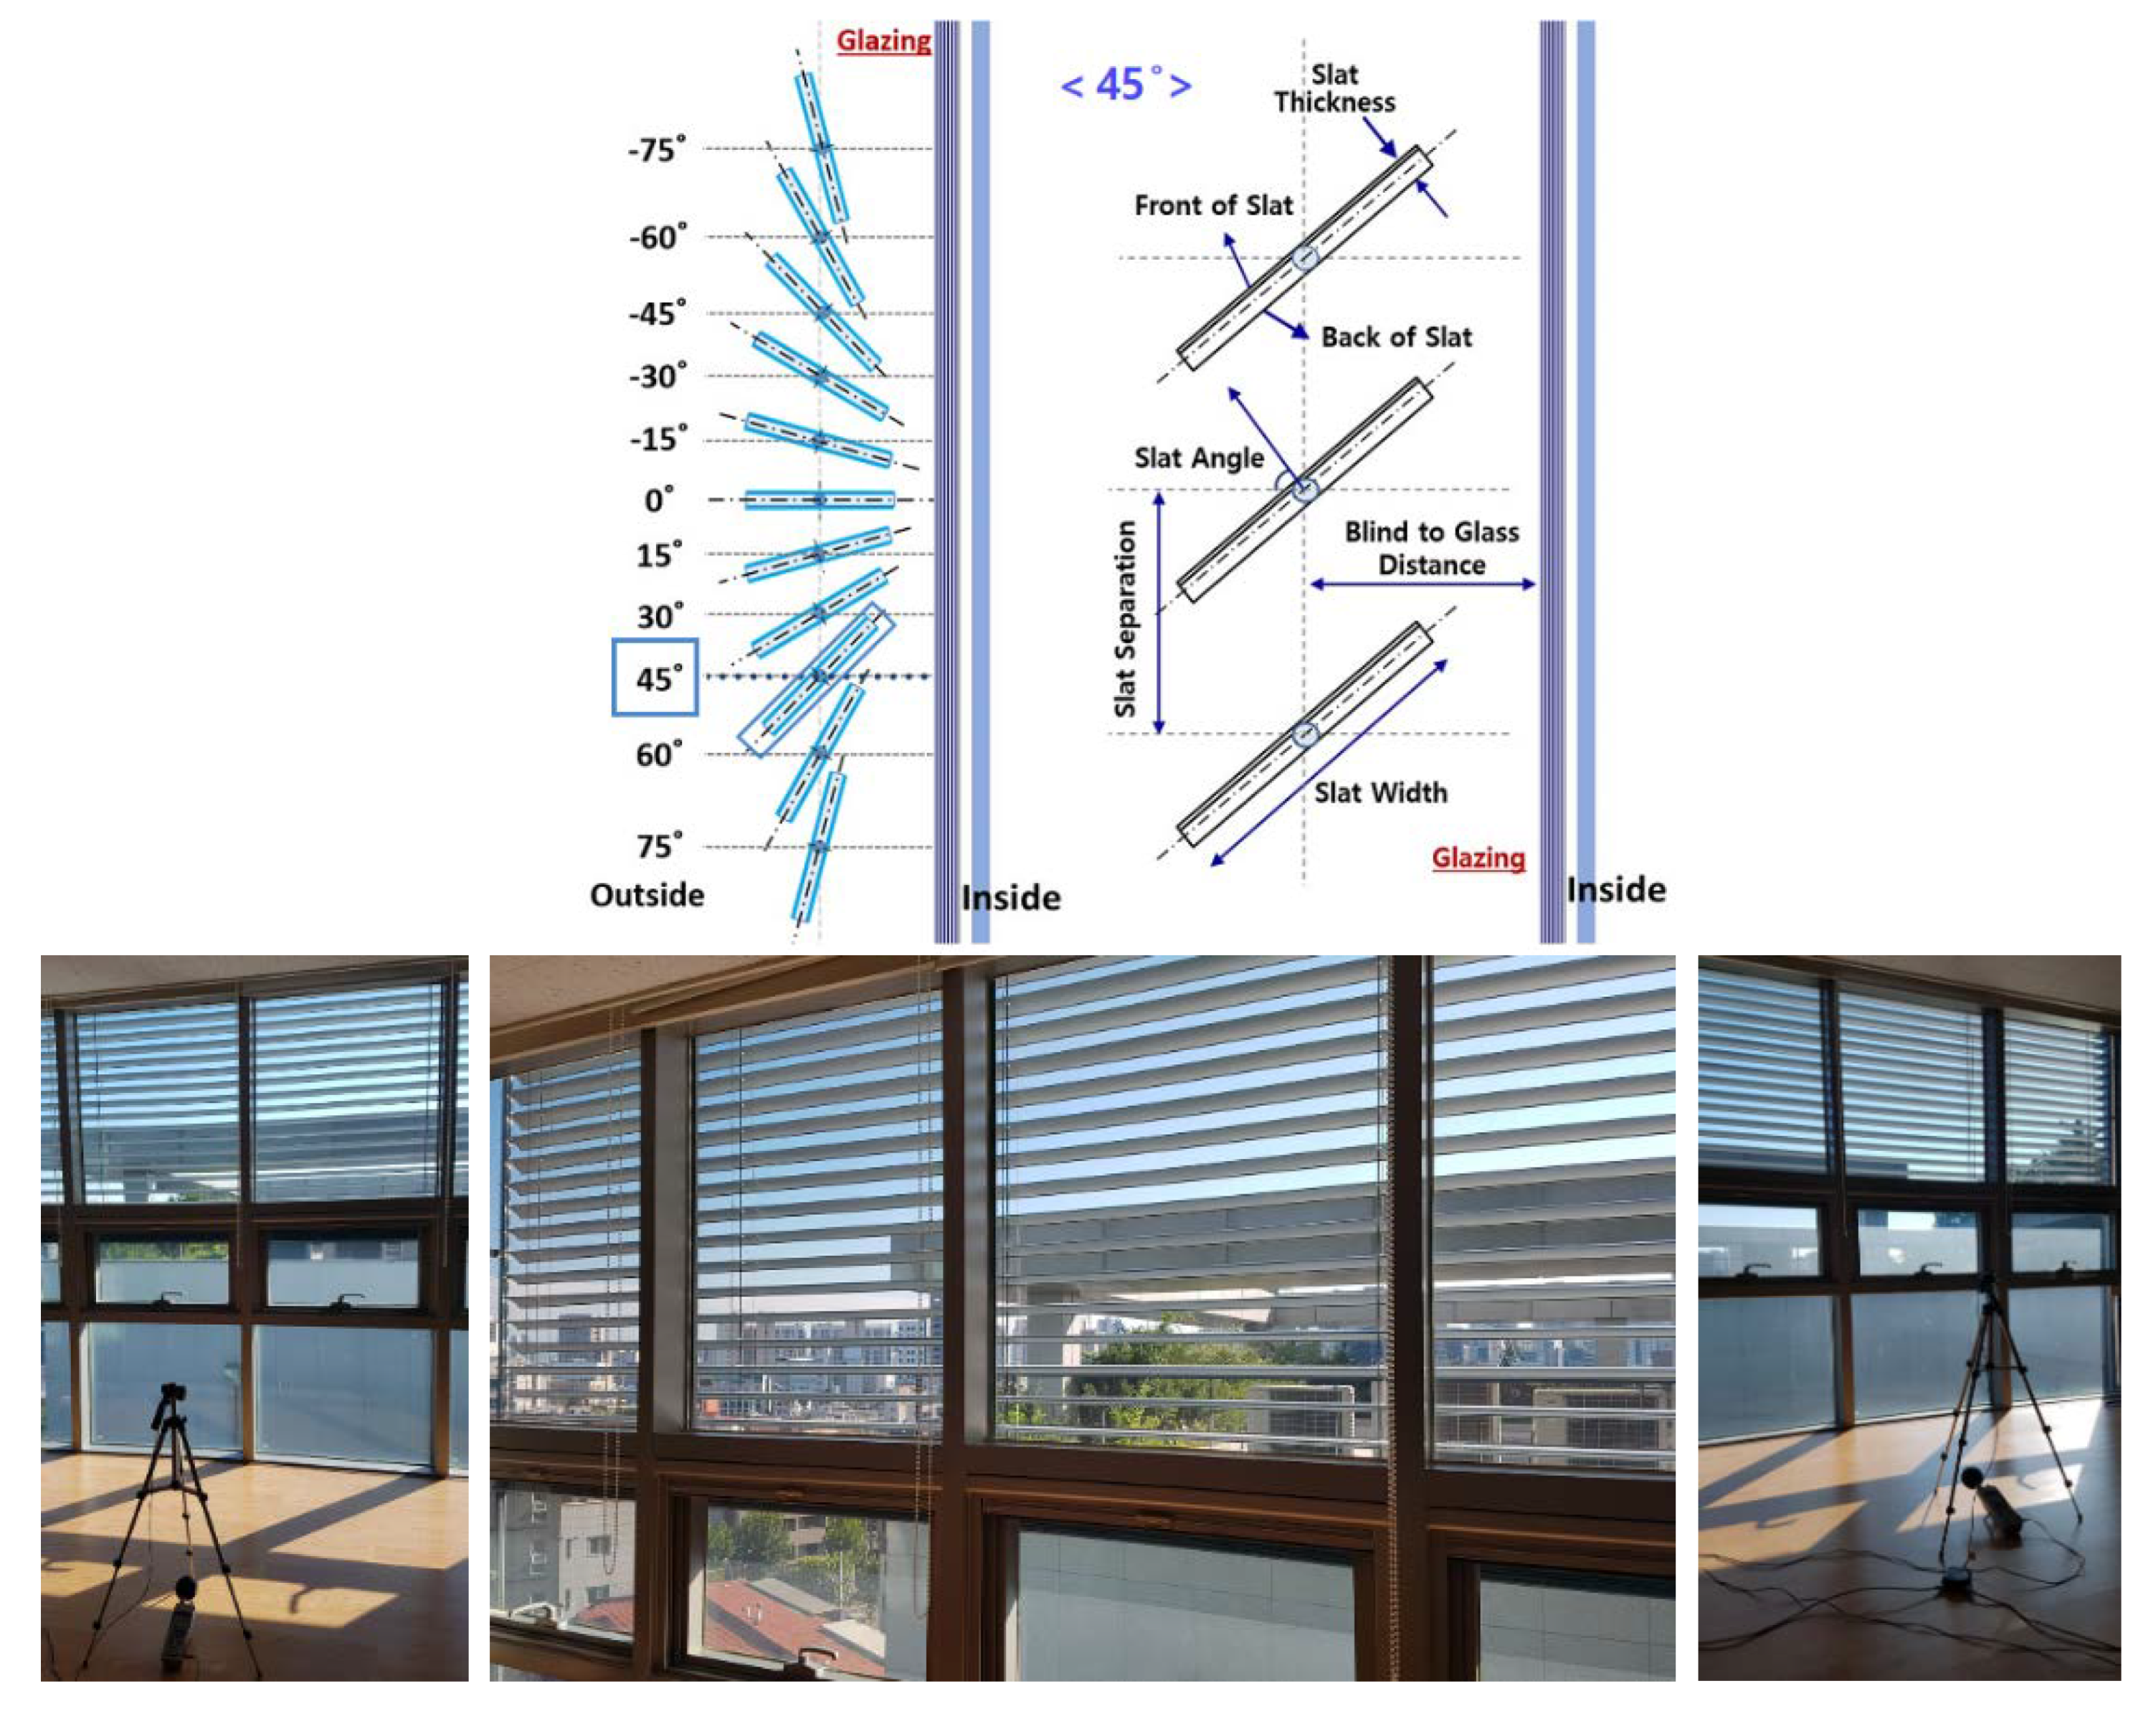
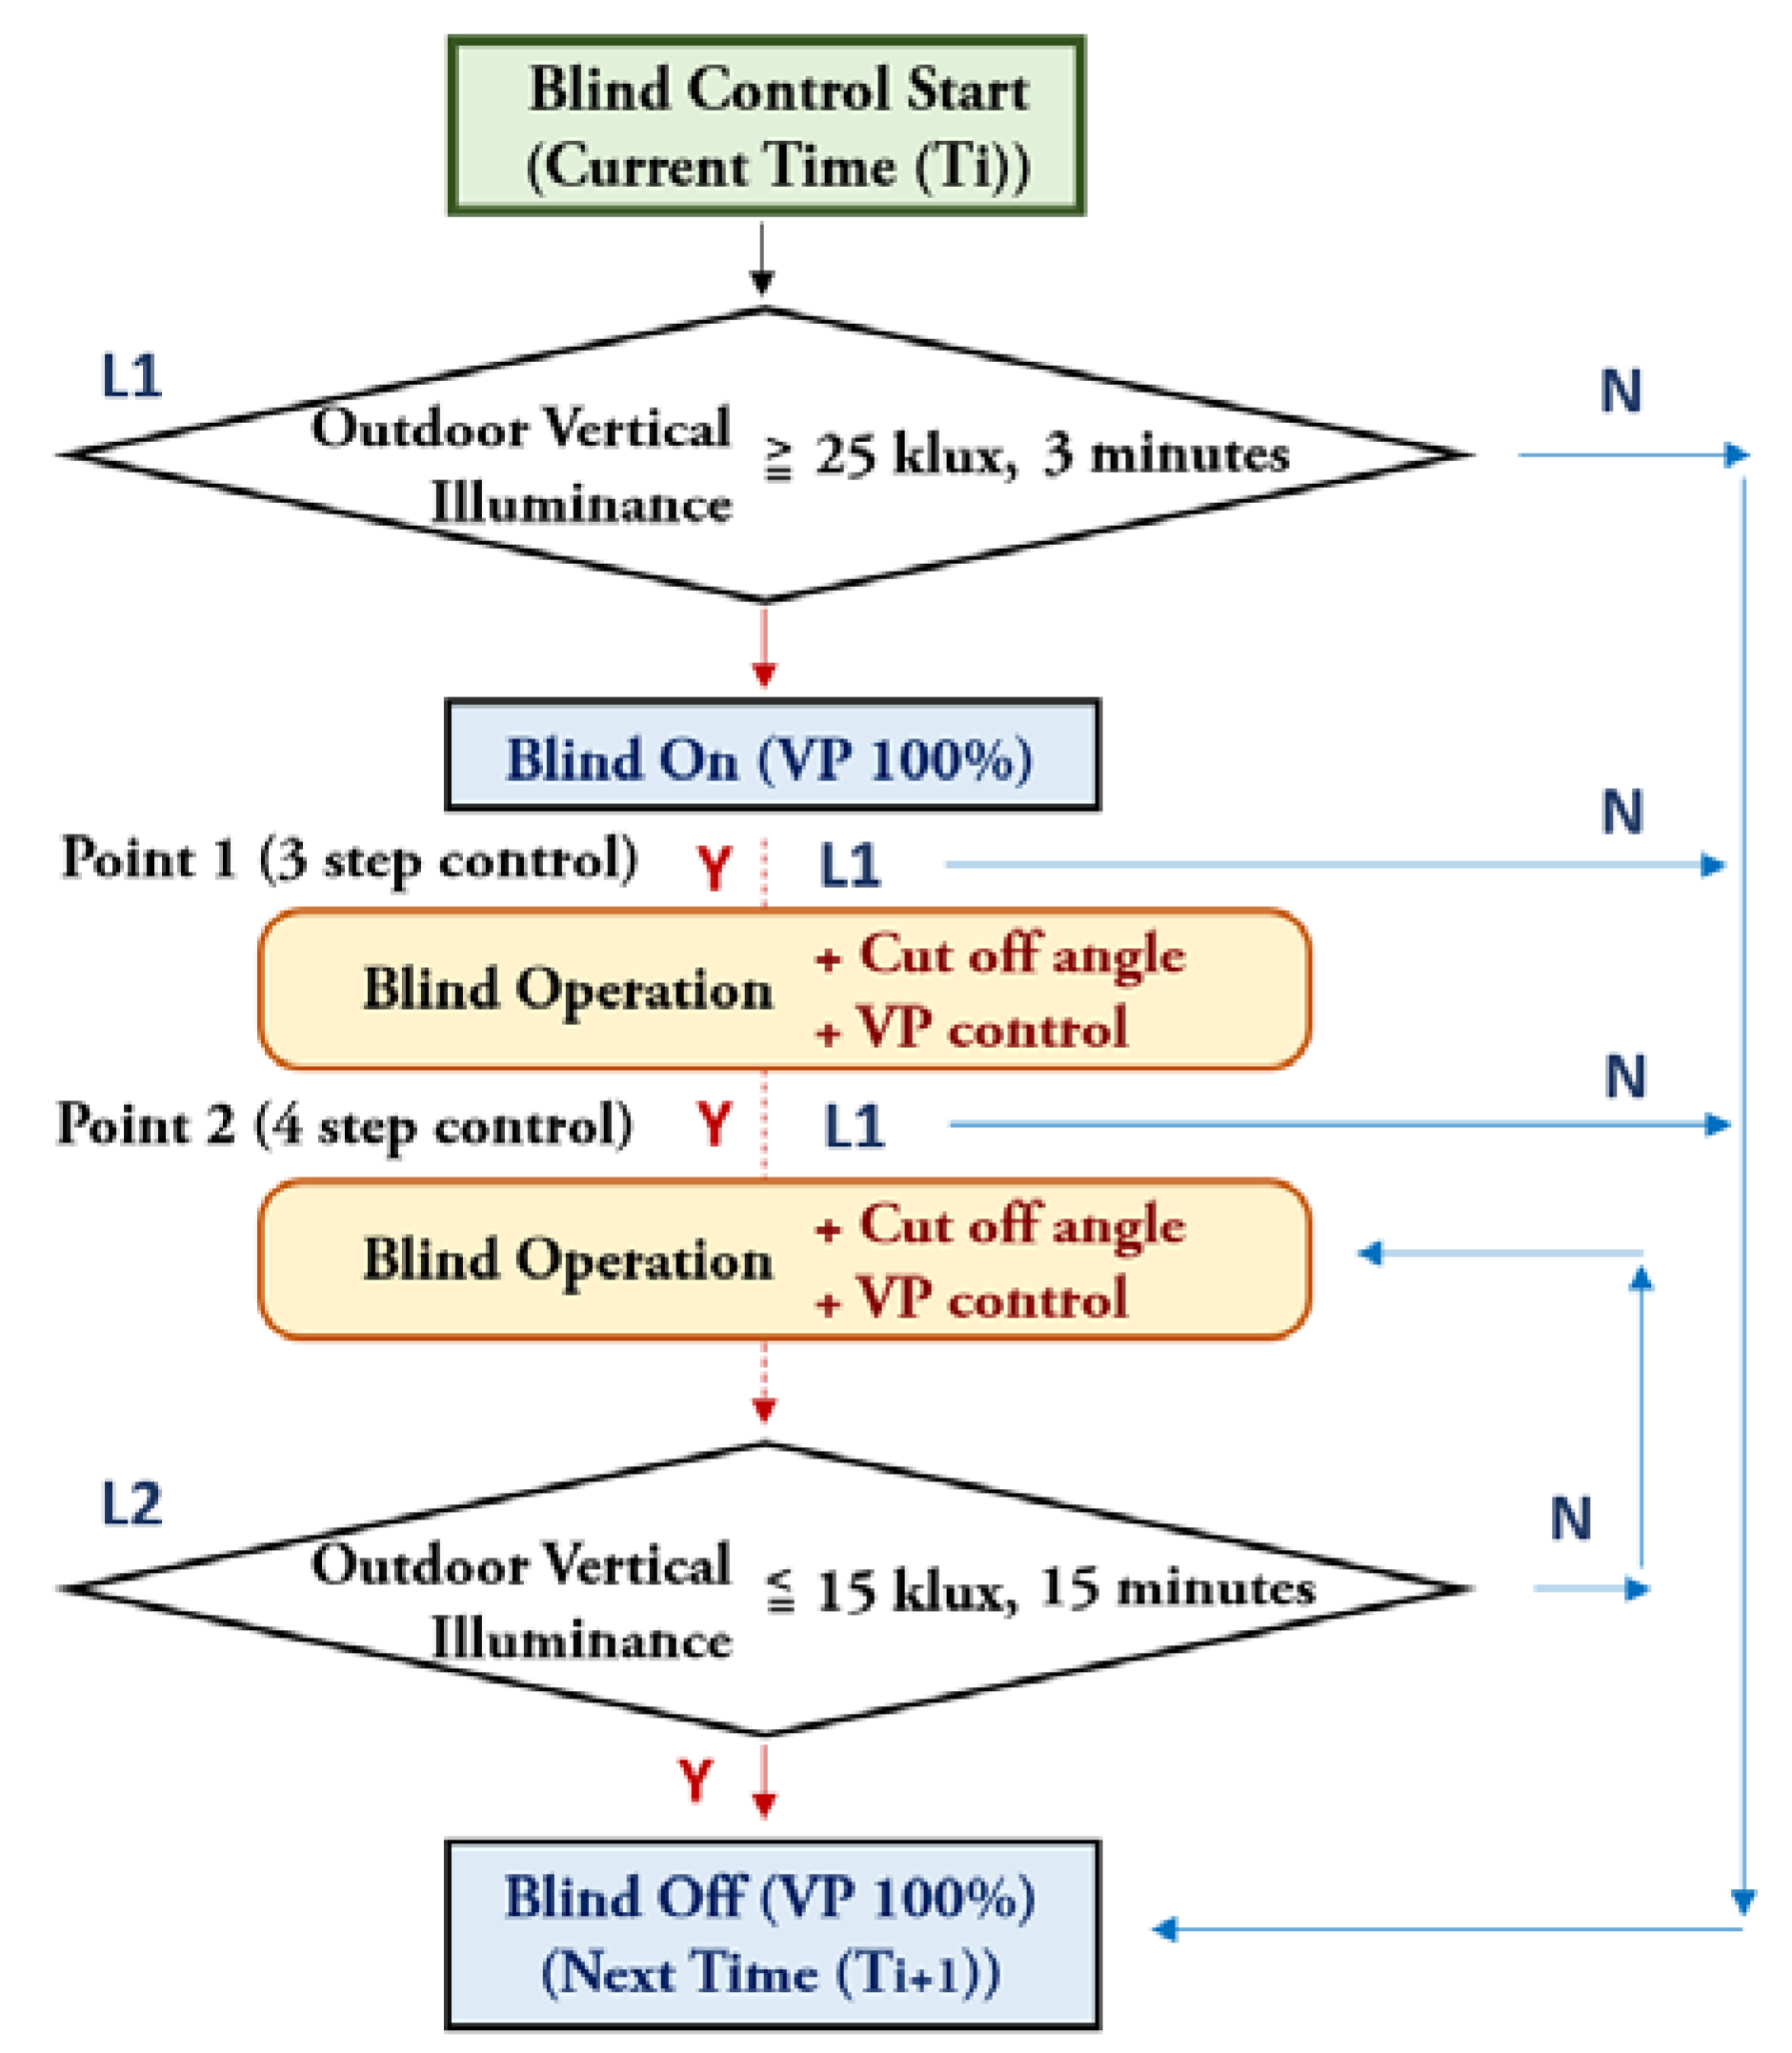
2.2.2. Blind Slat Angle and Vertical Position (VP) Control

Figure 3 shows the concepts of the cut-off angle and profile angle. It is important to calculate the profile angle and cut-off angle to evaluate the indoor environment and energy through angle control.
The profile angle is a function of the solar altitude, solar azimuth, and surface orientation. It represents the solar altitude from a building considering the direction of the building. The profile angle can be calculated using Equation (7) [33,34]:
d = arctan ( tan β cos ( γ ) )
where, d = solar profile angle, β = solar altitude angle, Φ = solar latitude angle, γ = azimuth angle of surface.
The cut-off angle is the angle devised to cut off the introduction of direct sunlight through windows. It is the slat angle at which the cut-off of direct sunlight begins, taking into consideration the slat width and spacing of blinds. The slat reflection components of direct sunlight and the diffused light are introduced to enable natural lighting. The cut-off angle can be calculated from Equation (8) [33,34] using the profile angle, as well as the slat width and spacing of blinds, as variables.
β c = arcsin ( cos ( d ) × ω s )
where, βc = cut-off angle (°), d = solar profile angle (°), ω = slat width(mm), s = slat separation(mm).
V b = H c S o H ω H
Vertical   Position ( VP ) = ( V b V m b ) × 100
where, Hc = ceiling height(m), Hw = workplane height(m), So = vertical separation, Vb = blocking length, Vmb = Max blocking length, D = reference depth, Din = installation depth.
Figure 4 shows the concept of VP control [34]. This study considered not only the angle of the blinds, but also height control. The VP can be calculated from Equations (9) and (10) [33,34] using the variables of ceiling height, workplane height and vertical separation. The VP when the blinds are completely raised is 0%, and when they are completely lowered, 100%. It is defined as the relative ratio of the vertical length of the bottom of the blinds to that of the completely lowered blinds, regardless of the slat angle. A method of defining the position of the actual work plane as a reference position and controlling the blinds so that direct sunlight cannot reach the reference position can be considered. If the VP can be adjusted considering the reference position without completely lowering the blinds, the occupants can have more external views and a better sense of openness. Moreover, if the inflow of daylight increases without the direct impact of direct sunlight and glare, the work plane illuminance can be effectively secured. An equation capable of calculating the VP, considering the geometric characteristics of the building and the work plane reference depth, was derived. The equation used minimum input variables, and it could be applied to typical office buildings. The critical angle at which direct sunlight does not reach the indoor work plane was defined as the profile angle. Through this angle, the VP of the blinds at any particular moment can be obtained.
It is possible to obtain the profile angles and cut-off angles 24 h a day for each month, considering the critical cut-off angle, and using the solar altitude, solar azimuth, slat length, slat spacing, and surface orientation. The obtained results can be applied to automatic blind controls. Next, the VP that can maximize natural lighting to the work plane and prevent glare using the calculated profile angles, and by applying the ceiling height of the full-scale mock-up, vertical offsets of the blinds, reference position height, installation depth of the blinds, cut-off length of the blinds, and reference axis cut-off length. The hourly, daily, and monthly VP values can be obtained and applied to automatic blind controls.

3. Experiment Overview

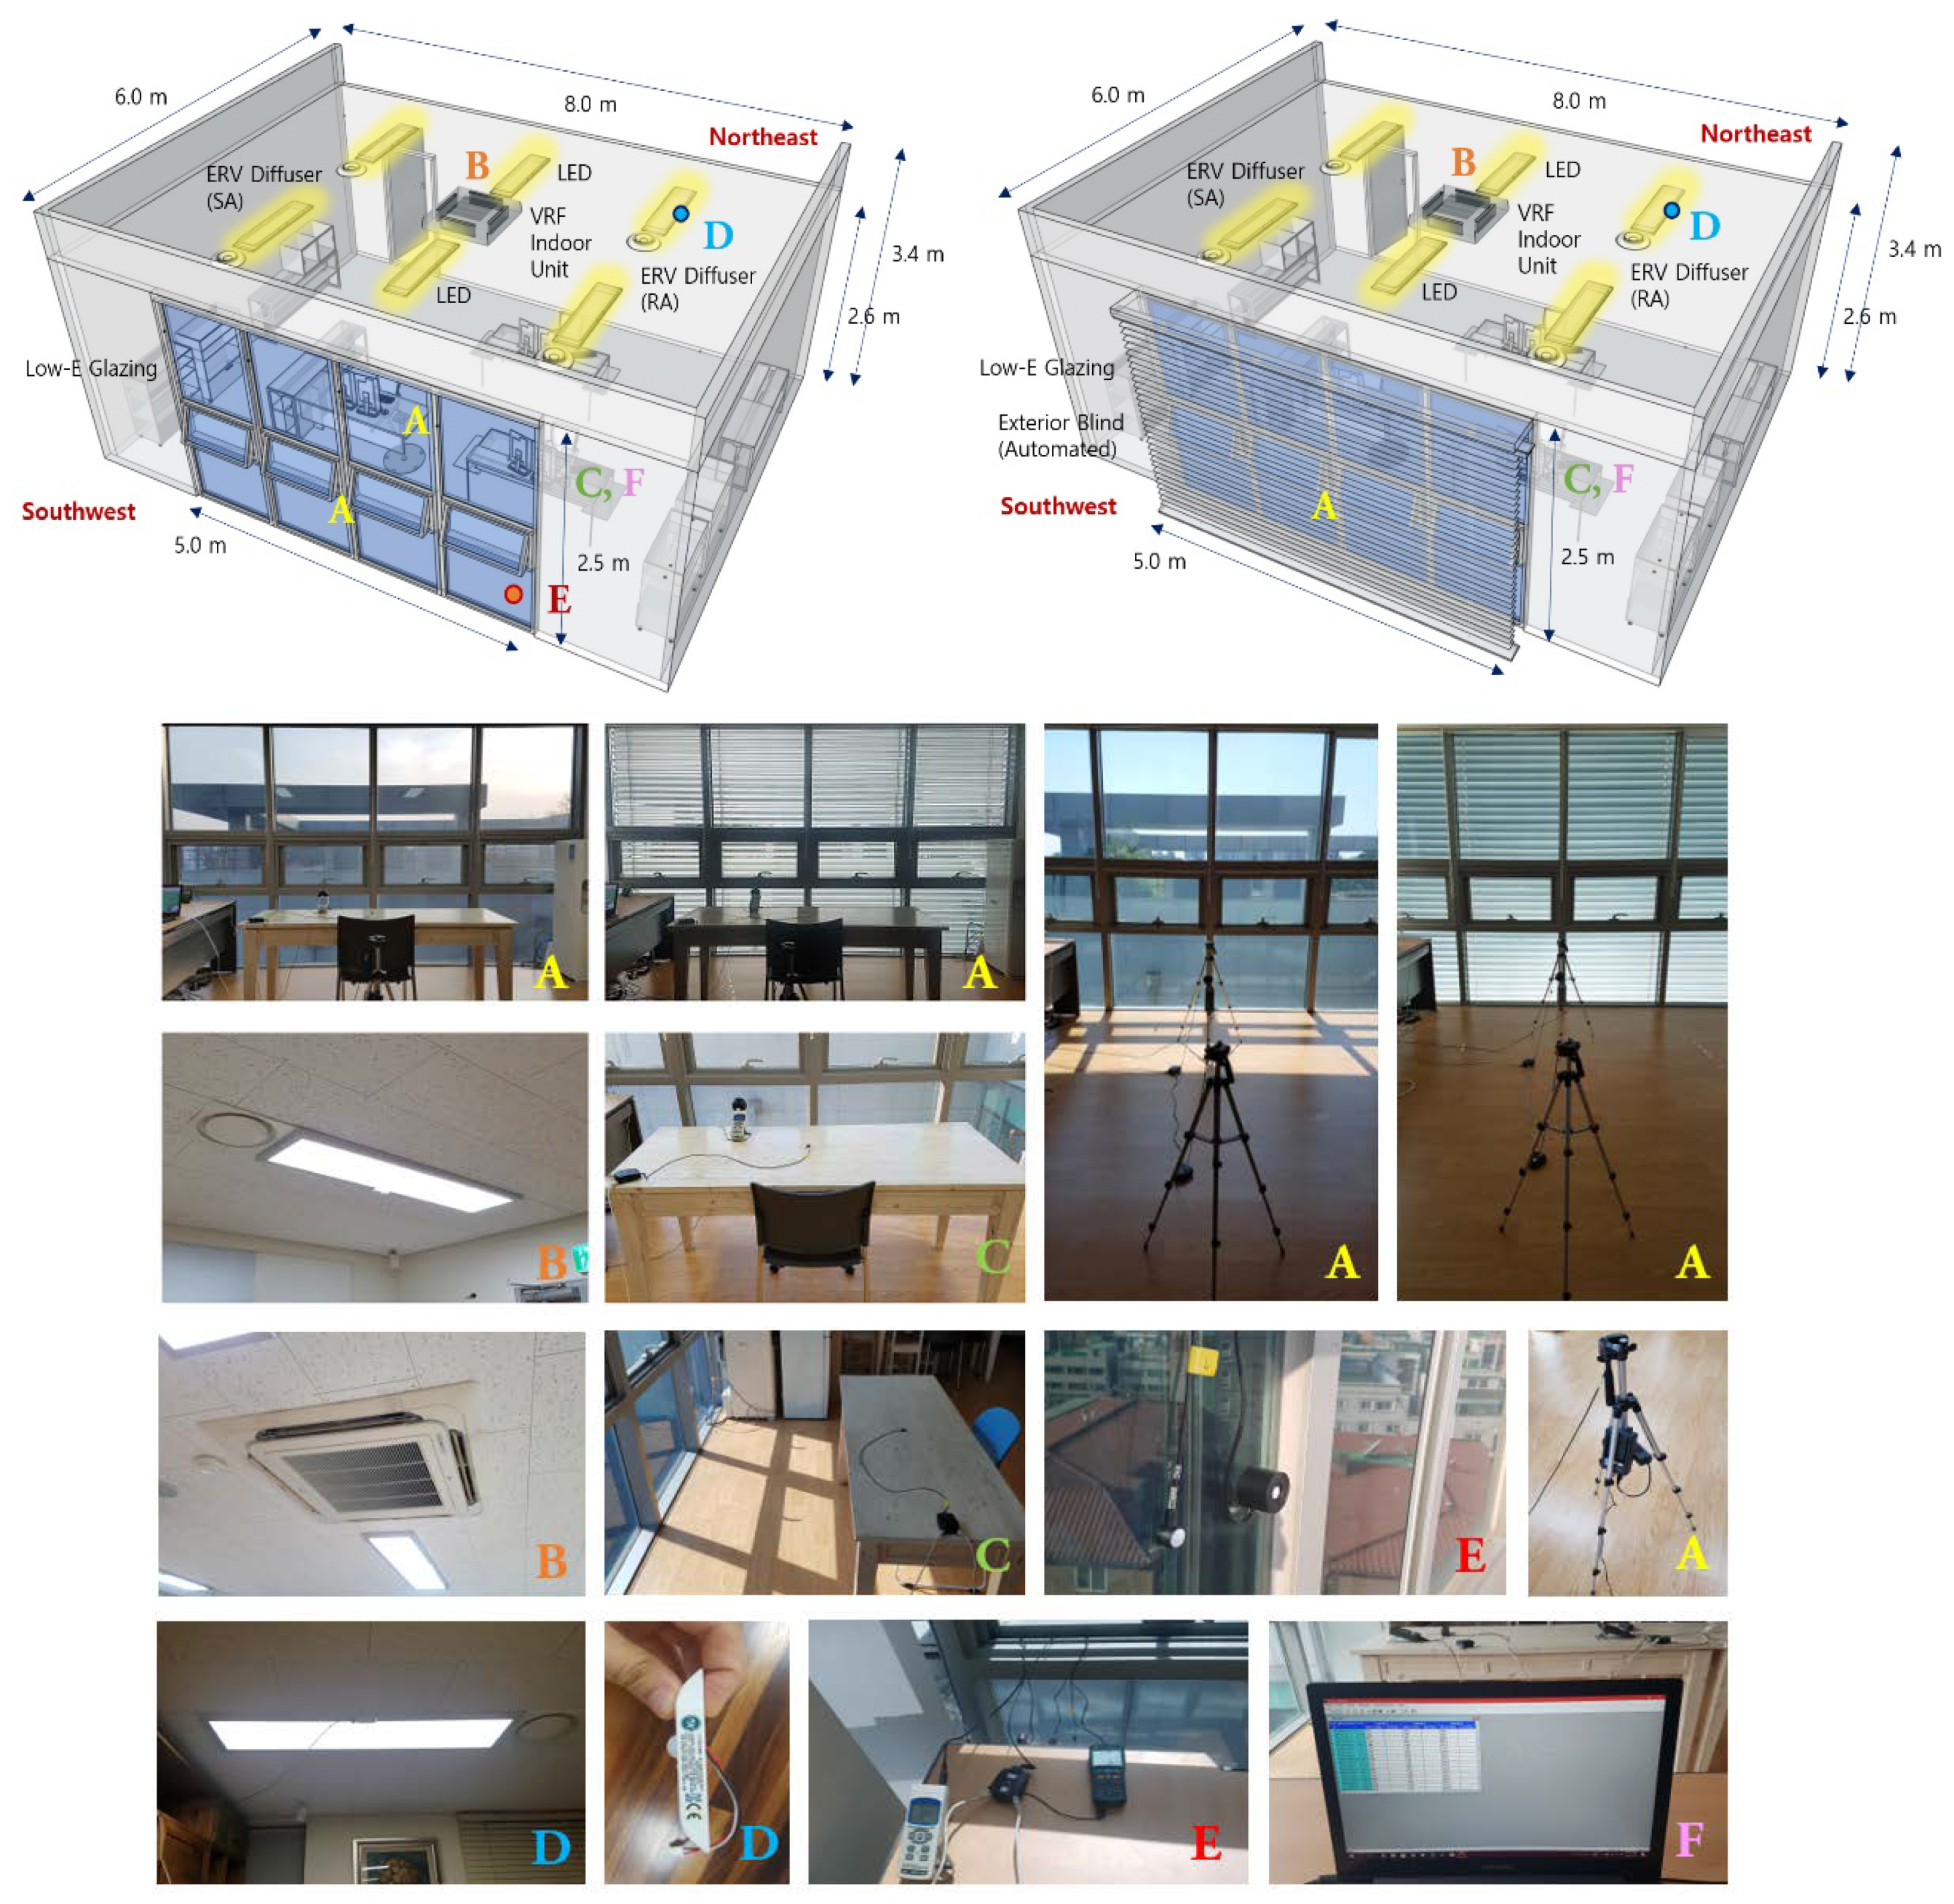
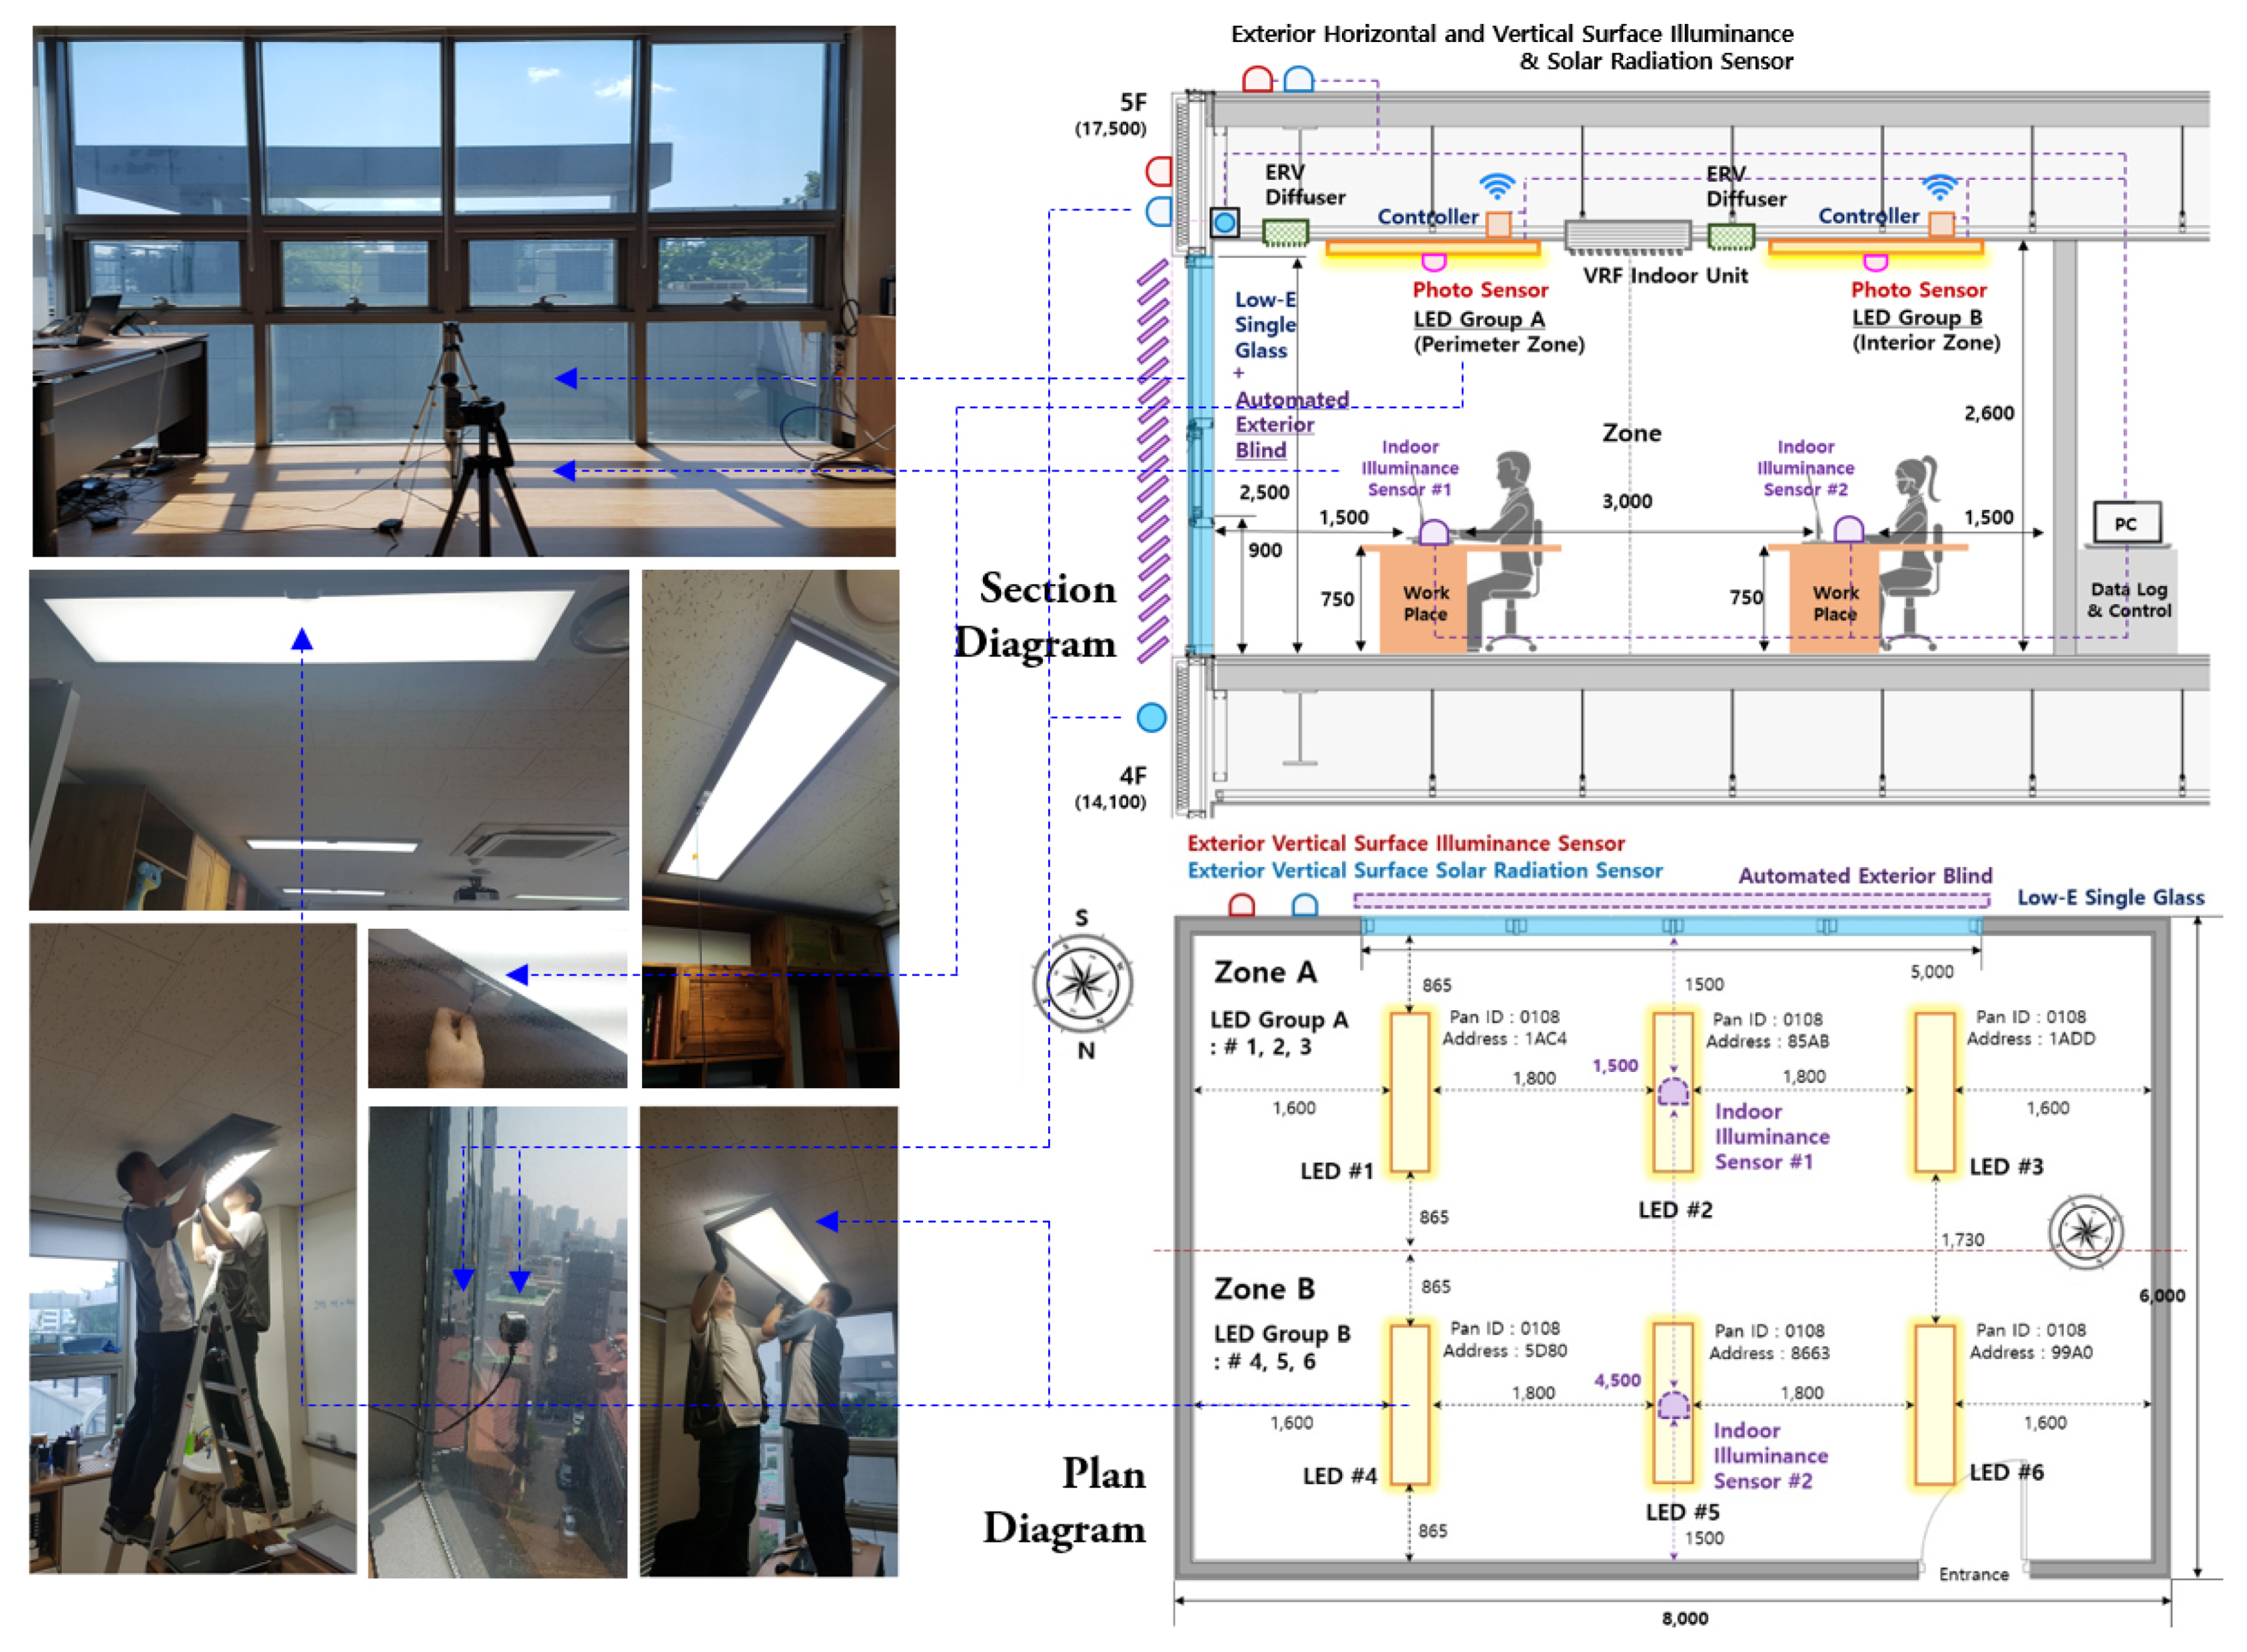
3.1. Target Full-Scale Mock-Up and Experimental Setup

Field experiments were performed in a full-scale mock-up built as a small office space on the fifth floor of a building in Seoul as shown in Figure 5 (latitude 37.58°, longitude 127.03°).
The full-scale mock-up was of 8 m width, 6 m length, and 2.6 m height. At the façade of the space, low-E single glazing of 5 m width and 2.5 m height was installed. The window area ratio was approximately 46%. Natural ventilation was possible, because four project windows (1.2 × 0.6 m) were installed at 8.3 m above the floor. The solar transmittance and illuminance transmittance of the glazing applied to the envelope were 23.8 and 24.3%, respectively. The front of the window was rotated by 20° from the south direction, and headed towards the south-southwest (SSW 200°).
Table 1 provides the finishing material’s mock-up reflection rate, which included the ceiling (85%), wall (55%), floor (20%), and window (5%), with a window transmittance of 78%. Using these values, the average indoor surface reflection rate was estimated to be 54.1%.
For the dimming controls of the full-scale mock-up space, the existing six sets of two 32 W fluorescent lamps (64 W) (127 cm width × 31 cm depth × 4 cm height) were replaced with six sets of 32 W LED lighting devices (127 cm width × 31 cm depth × 4 cm height) from company A [35], which were certified as high-efficiency energy equipment. Table 2 show characteristics of fluorescent lamps and LED lighting. The LEDs had photo sensors, and on–off control was possible. In addition, a dimming controller capable of automatic level adjustment was installed. Moreover, the illuminance of the work plane (height 0.75 m) was maintained at 500 lx, which is the standard lighting design for office buildings. On the outside of the window, automatically controlled aluminum venetian blinds manufactured by company S were installed [36]. The automated external venetian blinds had slat up–down and angle tilting functions. The slat width was 84 mm, and the distance between the slats was 68 mm. The indoor unit of an air conditioner (cooling capacity: 5.6 kW) was installed in the building. At the time of measurement, the system air conditioner controlled the temperature between 25.0 and 26.0 °C, and it was operated from 9 to 16 h through central management. Moreover, an energy recovery ventilator (ERV) was installed.
To maintain the set target illuminance (500 lx), the lighting devices were placed as shown in Figure 6. The distance from the window to the center of the lighting devices was 1.5 m, and the distance between the lighting devices ranged 1.73 to 1.80 m, indicating that they were evenly distributed throughout the entire space. In this study, the space was divided into two areas for lighting control; Figure 6 shows each area. The area 0–3 m separated from the window and significantly affected by daylight was selected as Zone A, while the separated area 3–6 m was selected as Zone B. Measurements were performed every day for five months from June to October 2019. After installing a vertical pyranometer and a vertical illuminometer on the external window of the full-scale mock-up, the external solar radiation and illuminance were measured every minute, to analyze the external environment and sky conditions.
The internal space of the full-scale mock-up was examined in terms of the light environment, and the light environment was measured using the indoor daylight illuminance and the artificial illuminance. First, to evaluate the light environment, the illuminance at the LED photo sensor [35] was measured. Its relationship with the indoor illuminance was examined, and it was used to analyze the change in indoor illuminance. To analyze changes to the daylight introduced to the interior and in the artificial lighting, the work plane illuminance (0.75 m above the floor) was measured at the centers of Zone A and Zone B at 1.5 and 4.5 m away from the window. The illuminance and solar radiation were measured using the illuminometers and pyranometers produced by company M [37] and L [38], respectively. Table 2 and Table 3 show the specifications of the measuring instruments and data recorders, as well as the lighting devices used in the experiment. The LED lighting devices, which replaced the fluorescent lamps of the target building, could be remotely controlled through communication with a PC or a smartphone with control software based on 2.4 GHz low-power wireless communication. Moreover, the luminous flux emitted from the LED lighting devices was 2335.85 lm, and the device efficiency was 61.78% [35].
Automatically controlled aluminum venetian blinds manufactured by company S were installed on the outside of the window. The automated external venetian blinds had the slat up–down and angle tilting functions. Its automatic control was possible by connecting PC automatic control software [36], and manual control was also possible through a remote control. An exterior vertical illuminance sensor was installed on top of the blinds’ head rail cap, and the sensor was the basis of automatic control. The slat width was 84 mm, and the distance between the slats 68 mm. Table 4 and Figure 7 show the values and characteristics of the blinds, as well as on-site images.
Figure 8 shows that the automated blind system from French company S was equipped with other devices, in addition to the blind for automatic control. The user could control the blind through the software installed in a PC, and the PC was connected to the building controller. The building controller corresponds to the brain that stores all the settings of the system performed by the PC. It identifies the exterior vertical illuminance of the building measured through the sensor connected to the sensor box, and determines the control of the blind based on the stored settings.
It also sends this command to the motor controller. Moreover, the user can select manual or automatic control of the blind through the operation software. When manual control is selected, the slat angle and VP can be controlled through the software [36].
Figure 9 shows that when automatic control is selected, the basic logic operates based on the exterior vertical illuminance. If the exterior vertical illuminance exceeds 25 klux for over three min, the blinds are turned on with a specified VP and slat angle. If the exterior vertical illuminance is lower than 15 klux for over 15 min, the blinds are turned off, and completely raised to lift the blinds above the window. The blinds can be operated with a specified VP and slat angle once or twice at the designated time by entering additional scheduled controls.

3.2. Case Selection for Measurement and Simulation

3.2.1. Case Selection for the Measuring Period #1 (June to August 2019) Experiment

If lighting systems are continuously used regardless of the changes in the exterior and indoor illuminances, it is not possible to avoid increase in the use of lighting energy. In other words, the dimming control of lighting equipment is important to save lighting energy. Therefore, a standard illuminance (500 lx) [32] was set for the target space based on the basic envelope conditions (low-E glazing) with no blinds prior to integrated blind control, and dimming control was conducted under different sky conditions. A total of 18 cases from 1-A-1 to 3-B-3 were selected, as shown in Figure 10 and Table 5. In Case 1, the automatic dimming system of company A was applied for control. In Case 2, manual dimming control was conducted five times a day by checking the daylight at 07:00, 09:00, 11:00, 13:00, and 17:00 during the time of occupancy. Case 3 was the switch on–off control, in which the lighting was turned off between 12:00 and 17:00. Clear sky was used from Case 1-A-1 to Case 3-B-1, and intermediate sky was used from Case 1-A-2 to Case 3-B-2. Overcast sky was used from Case 1-A-3 to Case 3-B-3. LED manual and dimming control, as well as switch control, were conducted in the two zones on the window side (A), and on the indoor side (B). In this study, the LED dimming ratio (turning off ratio) is defined as the unused LED current’s mean intensity value over the maximum mean intensity of the LED current. For example, 60% dimming ratio refers to 40% of the intensity of the LED at full light capability.

3.2.2. Case Selection for the Measuring Period #2 (September to October 2019) Experiment

Measuring period #2 is the period in which cutting off the solar radiation is necessary, because excessive direct sunlight is introduced to the work plane. Therefore in this period, the indoor illuminance was measured via integrated blinds and LED dimming controls. Overcast sky were excluded from the experiment period, because blind deployment is not necessary under an overcast sky. In other words, the standard illuminance (500 lx) was set, and dimming control was performed by manually or automatically controlling the blinds under clear and intermediate sky. Experimental cases were determined from 4-A-1 to 10-B-1. Manual blind control was conducted in 16 cases from 4-A-1 to 7-B-2, while automatic blind control was performed in 6 cases from 8-A-1 to 10-B-1.
Table 6 shows that LED dimming control integrated with manual blind control (100% height and 0° angle) was conducted on (A) the window side in 4-A-1 (clear sky) and 4-A-2 (intermediate sky), and on (B) the indoor side in 4-B-1 (clear sky) and 4-B-2 (intermediate sky). Manual blind control (100% height and 45° angle) and LED dimming control were performed in 5-A-1 (clear sky), 5-A-2 (intermediate sky), 5-B-1 (clear sky), and 5-B-2 (intermediate sky). In 6-A-1 and 6-B-1 (clear sky), manual blind control (50% height and 0° angle) was conducted, and dimming control was performed under clear sky. In 6-A-2 and 6-B-2 (intermediate sky), manual blind control (50% height and 0° angle) was conducted, and dimming control was performed under intermediate sky. Finally, dimming controls integrated with manual blind controls (50% height and 45° angle) were used under clear sky in 7-A-1 and 7-B-1 (clear sky), and dimming controls integrated with manual blind controls (50% height and 45° angle) were used under intermediate sky in 7-A-2 and 7-B-2 (intermediate sky).
Table 7 shows that LED dimming controls integrated with automatic blind controls (three-step control based on the exterior vertical illuminance) were conducted on (A) the window side in 8-A-1 (clear sky), and on (B) the indoor side in 8-B-1 (clear sky). LED dimming controls integrated with automatic blind controls that had one more step compared to 8-A-1 and-2 (four-step control based on the exterior vertical illuminance) were conducted on (A) the window side in 9-A-1 (clear sky), and on (B) the indoor side in 9-B-1 (clear sky). Finally, in 9-A-1 (intermediate sky) and 9-B-1 (intermediate sky), automatic blind control based on the exterior vertical illuminance was applied.

4. Experimental Results

4.1. Illuminometer Calibration

Figure 11 shows that in the dimming control software of company A, the illuminance of the LED photo sensor is expressed as Pulse with Modulation (PWM). Therefore, to convert the illuminance to lx, lx was measured by installing an illuminance sensor (Minolta, Osaka, Japan) that measures the work plane illuminance at the same position as that of the LED photo sensor.
The correlations between the illuminance (lx) values of the Minolta sensors (Locations #(1–4)) and the LED photo sensor PWM were derived according to the dimming rate of (0–100)%. The relationships between the LED photo sensor and the illuminance sensors at each position were higher than 0.9 (Location #1_black circle in Figure 11: 0.9936, Location #2_purple circle in Figure 11: 0.9966, and Location #3_red circle in Figure 11: 0.9934), thereby exhibiting close relationships. The same work plane illuminance was measured at the positions of Locations #1 and #3 (the location below the LED). Approximately 80% illuminance was measured at Location #2, and 40% illuminance was measured at Location #4_ green circle in Figure 11 (when the turning-on ratio was 100%: (637–645) lx at photo sensor PWM 1024 #1 and #3/528 lx at #2/256 lx at #4).

4.2. No Blinds + LED Dimming Control (Measuring Period #1)

The space was divided into two areas for the integrated blinds and dimming controls. The area 0–3 m away from the window and significantly affected by daylight was selected as Zone A, and while the area 3–6 m away was Zone B. Figure 12 shows the illuminance data when dimming controls were conducted under clear sky.
In cases 1-A-1 (clear) and 1-B-1 (clear), the work plane illuminance was constantly maintained at (500 ± 30) lx by daylight and LED artificial lighting. When the brightness of daylight exceeded 500 lx, lighting was turned off automatically through dimming control. When automatic control was applied under clear sky, the dimming rates of Zone A and Zone B were 68 and 42%, respectively. In Zone A, the maximum illuminance was found to be 1123 lx and the average illuminance was 421 lx. In Zone B, the maximum illuminance was found to be 407 lx, and the average illuminance was 133 lx. In the case of the manual dimming control of cases 2-A-1 (clear) and 2-B-1 (clear), artificial lighting was also operated to maintain the work plane illuminance in the time zone at 500 lx. The dimming rates of Zone A and Zone B were found to be 70 and 44%, respectively, which were 2% higher than the dimming rates of automatic dimming. In cases 3-A-1 (clear) and 3-B-1 (clear), lighting was turned off from 12:00 to 17:00, and thus only natural lighting was used. The dimming rates were found to be 42% for both cases.
Figure 13 shows the illuminance data when dimming control was conducted under intermediate sky. In cases 1-A-2 (intermediate) and 1-B-2 (intermediate), the work plane illuminance was also constantly maintained at (500 ± 30) lx by daylight and LED artificial lighting.
The dimming rates of Zone A and Zone B were 57 and 31%, respectively. In Zone A, the maximum illuminance was 709 lx, and the average illuminance was 297 lx. In Zone B, the maximum daylight illuminance was 280 lx, and the average illuminance was 150 lx. In the case of the manual dimming control of cases 2-A-2 (intermediate) and 2-B-2 (intermediate), the dimming rates of Zone A and Zone B were found to be 59 and 32%. In cases 3-A-2 (intermediate) and 3-B-2 (intermediate), lighting was turned off from 12:00 to 17:00, and, thus, only natural lighting was used. The dimming rates were found to be 42% in both cases. In case 3-B-2 (intermediate), the work plane standard illuminance of 500 lx could not be met when the lighting was turned off from 12:00 to 17:00.
Figure 14 shows the illuminance data when dimming control was conducted under overcast sky. In cases 1-A-3 (overcast) and 1-B-3 (overcast), the work plane illuminance was also constantly maintained at (500 ± 30) lx by daylight and LED artificial lighting. The dimming rates of Zone A and Zone B were found to be 51 and 23%, respectively. Under overcast sky, the daylight illuminance did not exceed the standard illuminance (500 lx). In Zone A, the maximum daylight illuminance was 493 lx, and the average daylight illuminance was 251 lx. In Zone B, the maximum daylight illuminance was 191 lx, and the average daylight illuminance was 102 lx. Even in the manual dimming control of Cases 2-A-3 (overcast) and 2-B-3 (overcast), artificial lighting was operated to meet 500 lx. In this case, the dimming rates of Zone A and Zone B were found to be 52 and 24%, respectively. In the cases of 3-A-3 (overcast) and 3-B-3 (overcast), lighting was turned off from 12:00 to 17:00; thus, only natural lighting was used. The dimming rates were found to be 42% in both cases. Table 8 shows the dimming rate when dimming control is performed under the basic envelope conditions (low-E glazing) with no blinds under different sky conditions.
Tables S1–S3 of the ‘Supplementary Materials’ provides detailed data for dimming control with no blinds (1-A-1, 1-A-2, 1-A-3, 1-B-1, 1-B-2, 1-B-3 in Figure 12, Figure 13 and Figure 14).

4.3. Blind Manual Controls + LED Dimming Controls (Measuring Period #2)

Excessive daylight only for lighting energy reduction may cause unpleasant thermal and light environments in an indoor space. Figure 15 at right shows that excessive direct sunlight was introduced to the work plane during measuring period #2, so the solar radiation needed to be cut off.
The maximum daylight illuminance was measured to be 2860 lx. To address this problem, blinds were required to cut off solar heat gain. Thus, the dimming control of LED lighting integrated with the blinds was conducted in measuring period #2. Table S4 of the Supplementary Materials provides detailed illuminance and dimming rate data for Figure 15. Figure 16 shows the illuminance data when automatic LED dimming control was performed after the VP of the blind was set to 100% and its slat angle was set to 0° under clear and intermediate sky.
The integrated blinds and LED dimming controls blocked excessive direct sunlight to the work plane. In cases 4-A-1 (clear) and 4-B-1 (clear), the work plane illuminance was constantly maintained at 500 lx (±30 lx) during the experiment by daylight and LED artificial lighting. Under clear sky, the dimming rates of Zone A and Zone B were found to be 59 and 44%, respectively. In Zone A, the maximum daylight illuminance was 382 lx, and the average daylight illuminance was 171 lx. In Zone B, the maximum daylight illuminance was 199 lx, and the average daylight illuminance was 99 lx. Under clear sky, the indoor side (Zone B) exhibited approximately 42% lower daylight illuminance and an approximately 15% lower dimming rate than did the window side (Zone A). In cases 4-A-2 (intermediate) and 4-B-2 (intermediate), automatic dimming control was performed under intermediate sky. The dimming rates of Zone A and Zone B were found to be 50 and 36%, respectively. In Zone A, the maximum daylight illuminance was 344 lx, and the average daylight illuminance was 137 lx. In Zone B, the maximum daylight illuminance was 175 lx, and the average daylight illuminance was 60 lx. The indoor side (Zone B) showed approximately 33% lower daylight illuminance and an approximately 14% lower dimming rate than did the window side (Zone A). It was found that because the daylight illuminance of the intermediate sky was less constant than that of the clear sky, the dimming rate significantly fluctuated. Tables S5–S6 in the ‘Supplementary Materials’ provides detailed data for Figure 16.
Figure 17 shows the illuminance data when LED dimming control was performed after the VP of the blind was set to 100% and its slat angle was set to 45° under clear and intermediate sky. Under clear sky, the dimming rates of Zone A and Zone B were found to be 48 and 37%, respectively. In Zone A, the maximum daylight illuminance was 250 lx, and the average daylight illuminance was 113 lx. In Zone B, the maximum daylight illuminance was 142 lx, and the average daylight illuminance was 62 lx.
When the slat angle changed from 0° to 45° under clear sky, the dimming rates of Zone A and Zone B decreased by 11 and 7%, respectively. In cases 4-A-2 (intermediate) and 4-B-2 (intermediate), automatic dimming control was performed under intermediate sky. The dimming rates of Zone A and Zone B were 43 and 33%, respectively. In Zone A, the maximum daylight illuminance was 210 lx, and the average daylight illuminance was 86 lx. In Zone B, the maximum daylight illuminance was 119 lx, and the average daylight illuminance was 45 lx. When the slat angle changed from 0° to 45° under intermediate sky, the dimming rates of Zone A and Zone B decreased by 7 and 3%, respectively. Tables S7–S8 in the ‘Supplementary Materials’ provides detailed data for Figure 17.
Figure 18 shows the illuminance data when LED dimming control was performed after VP was increased to 50% by raising the blinds and setting the slat to 0° under clear and intermediate sky. Under clear sky, the dimming rates of Zone A and Zone B were found to be 64 and 47%, respectively. In Zone A, the maximum daylight illuminance was 466 lx, and the average daylight illuminance was 197 lx. In Zone B, the maximum daylight illuminance was 277 lx, and the average daylight illuminance was 117 lx. The dimming rates of Zone A and Zone B increased by 5 and 3%, respectively, compared to when the VP was 100% and the slat angle was 0° under clear sky. In cases 4-A-2 (intermediate) and 4-B-2 (intermediate), automatic dimming control was performed under intermediate sky. The dimming rates of Zone A and B were found to be 52 and 40%, respectively. In Zone A, the maximum daylight illuminance was 458 lx, and the average daylight illuminance was 123 lx. In Zone B, the maximum daylight illuminance was 216 lx, and the average daylight illuminance was 79 lx. The dimming rates of Zone A and Zone B increased by 2 and 4%, respectively, compared to when the VP was 100% and the slat angle was 0° under intermediate sky. Tables S9 and S10 in the ‘Supplementary Materials’ provides detailed data for Figure 18.
Figure 19 shows the illuminance data when LED dimming control was performed after the VP of the blind was set to 50% and its slat angle was set to 45° under clear and intermediate sky.
During the experiment, the work plane illuminance was constantly maintained at 500 lx (±30 lx) by daylight and LED artificial lighting. Under clear sky, the dimming rates of Zone A and Zone B were found to be 55 and 40%, respectively. In Zone A, the maximum daylight illuminance was 361 lx, and the average daylight illuminance was 158 lx. In Zone B, the maximum daylight illuminance was 142 lx, and the average daylight illuminance was 62 lx. The dimming rates of Zone A and Zone B decreased by 9 and 7% compared to when the VP was 50% and the slat angle was 0° under clear sky. In cases 4-A-2 (intermediate) and 4-B-2 (intermediate), automatic dimming control was conducted under intermediate sky. The dimming rates of Zone A and B were found to be 48 and 35%, respectively. In Zone A, the maximum daylight illuminance was 210 lx, and the average daylight illuminance was 86 lx. In Zone B, the maximum daylight illuminance was 119 lx, and the average daylight illuminance was 45 lx. The dimming rates of Zone A and Zone B decreased by 4 and 5%, respectively, compared to when the VP was 50% and the slat angle was 0° under intermediate sky. It was found that manual blind control had the effect of cutting off solar radiation, but daylight could not be effectively used because the angle and VP were fixed.
Table 9 shows the dimming rate when dimming control is performed under dimming controls integrated with manual blind controls under clear and intermediate sky conditions (Blind VP 50%, Slat angle 45°). Tables S11 and S12 in the ‘Supplementary Materials’ provides detailed illuminance and dimming rate data for Figure 19.

4.4. Blind Automated Controls + LED Dimming Controls (Measuring Period #2)

Figure 20 shows the indoor illuminance (daylight + artificial lighting) and dimming rate in Zone A and Zone B when the blinds were subjected to three-step automatic control based on the exterior vertical illuminance, and LED dimming control was performed at the same time (clear sky).
The indoor work plane illuminance was constantly maintained at 500 lx (±30 lx) by daylight and artificial lighting. For the blinds from company S, three-step automatic control is basically possible. If the exterior vertical illuminance exceeds 25,000 lx for over three minutes, the VP increases to 100%, and the cut-off angle changes to a designated angle (0°). If it is lower than 15,000 lx for over 15 min, the VP decreases to 0%. One VP and one angle can be designated between these values.
As described, automatic blind control (blind control logic of company S) was performed based on the exterior vertical illuminance. At CP 1(08:42), the exterior vertical illuminance exceeded 25,000 lx for over three minutes, and thus VP increased to 100% and the cut-off angle changed to 0°. At CP 2(12:00), the designated VP (51.4%) and cut-off angle (8°) were applied so that direct sunlight could not reach the work plane while the maximum daylight could be utilized. At CP 3(15:55), the exterior vertical illuminance was lower than 15,000 lx for over 15 min, and thus the blind was raised by decreasing VP to 0% to maximize the use of daylight. When automatic control (3 steps) was applied under clear sky, the dimming rates of Zone A and Zone B were found to be 68 and 50%, respectively. In Zone A, the maximum daylight illuminance was 481 lx and the average daylight illuminance was 216 lx. In Zone B, the maximum daylight illuminance was 295 lx and the average daylight illuminance was 125 lx. The dimming rates were 4 and 3% higher in Zone A and Zone B, respectively, than those of case 6-A-1, which exhibited the highest dimming rate when manual blind control was performed. Table S13 of the ‘Supplementary Materials’ provides detailed illuminance and dimming rate data for Figure 20.
Figure 21 shows the indoor illuminance (daylight + artificial lighting) and dimming rate in Zone A and Zone B when the blinds were subjected to four-step automatic control based on the exterior vertical illuminance, and LED dimming control was performed at the same time under clear sky. During the experiment, the work plane illuminance was constantly maintained at 500 lx (±30 lx) by daylight and artificial lighting. As for the four-step automatic blind control of company S, the VP increases to 100% if the exterior vertical illuminance exceeds 25,000 lx for over three minutes, and if the exterior vertical illuminance is lower than 15,000 lx for over 15 min, it decreases to 0%. Two more steps can be designated between these values. As a result, automatic blind control (the blind control logic of company S) was performed based on the exterior vertical illuminance. At CP 1 (09:15), the exterior vertical illuminance exceeded 25,000 lx for over three minutes, and thus VP increased to 100%, and the cut-off angle changed to 15°. At CP 2 (12:00), the designated VP (70.4%) and cut-off angle (10°) were applied so that direct sunlight could not reach the work plane. At CP 3 (15:00), the designated VP (49.6%) and cut-off angle (5°) were also applied. At CP 4 (15:55), the exterior vertical illuminance was lower than 15,000 lx for over 15 min, and thus the blinds were raised by decreasing the VP to 0% to maximize the use of daylight. When automatic control (4 steps) was applied under clear sky, the dimming rates of Zone A and Zone B were found to be 70 and 52%, respectively. In Zone A, the maximum daylight illuminance was 492 lx, and the average daylight illuminance was 233 lx.
In Zone B, the maximum daylight illuminance was 299 lx, and the average daylight illuminance was 139 lx. The dimming rates in Zone A and Zone B were 2% higher than those of cases 8-A-1 and 8-B-1, in which three-step automatic blind control was performed. Three-step and four-step automatic control based on the exterior vertical illuminance had the benefit of securing more daylight in the morning and evening hours than did the existing manual angle control, but to utilize daylight between CP 1 and CP 2, it is necessary to perform VP control, rather than completely lowering the blinds (100% VP). Table S14 of the Supplementary Materials provides detailed illuminance and dimming rate data for Figure 21. While Figure 20 and Figure 21 show the results under clear sky, Figure 22 shows the indoor illuminance (daylight + artificial lighting) and dimming rates in Zone A and Zone B when automatic blind control was conducted based on the exterior vertical illuminance and LED dimming control was performed at the same time under intermediate sky.
The VP increased to 100% if the exterior vertical illuminance exceeded 25,000 lx for over three minutes, and it decreased to 0% if the exterior vertical illuminance was lower than 15,000 lx for over 15 min. Under intermediate sky, the exterior vertical illuminance irregularly varied due to changes in the amount of clouds.
Therefore, when automatic control based on the exterior vertical illuminance was applied, the blinds were changed six times a day due to the changing exterior vertical illuminance. At CP 1 (09:32), the exterior vertical illuminance exceeded 25,000 lx for over three minutes, and thus VP increased to 100%, and the cut-off angle changed to 7°. At CP 2 (10:06), the blinds were raised by decreasing the VP to 0%, as the external vertical illuminance was lower than 15,000 lx for over 15 min. At CP 3 (10:54), the VP was increased to 100%, as the exterior vertical illuminance was higher than 25,000 lx for over three minutes. At CP 4 (12:00), a pre-designated point, the VP was changed to 50%, and the cut-off angle was changed to 0° to introduce daylight higher than 300 lx while preventing the direct sunlight from reaching the work plane. At CP 5 (13:44), the VP increased to 100%. At CP 6 (14:28), the VP decreased to 0% to secure as much as daylight possible. The dimming rates of Zone A and Zone B were found to be 64 and 43%, respectively. In Zone A, the maximum daylight illuminance was 489 lx, and the average daylight illuminance was 146 lx. In Zone B, the maximum daylight illuminance was 421 lx, and the average daylight illuminance was 99 lx.
Table 10 shows the dimming rate when dimming control is performed under dimming controls integrated with automatic blind controls under clear and intermediate sky conditions. Table S15 in the ‘Supplementary Materials’ provides detailed illuminance and dimming rate data for Figure 22.
Figure 23 summarizes the dimming rates of all the cases selected in this study. Under all sky conditions, when automatic and manual LED dimming control was performed for low-E glazing with no blinds (except on-off controls), the average dimming rate was found to be 69.5% in Zone A (window side) and 50.0% in Zone B (indoor side).
When both manual blind controls with the pre-determined slat angle and the VP of the blinds and automatic LED controls were performed, the average dimming rate was found to be 52.4% in Zone A and 39.0% in Zone B. Finally, when both the automatic blind controls of company S based on the exterior vertical illuminance and automatic LED dimming control were performed, the average dimming rate was 67.3% in Zone A, and 48.3% in Zone B. When LED dimming control integrated with automatic blind control was performed, the average dimming rate was 2.1% lower in Zone A and 1.7% lower in Zone B compared to when automatic and manual LED dimming control were conducted for low-E glazing with no blinds, but excessive solar radiation could be blocked. Moreover, it was possible to use more daylight and thus to reduce lighting energy because the dimming rate was 14.9% higher in Zone A and 9.3% higher in Zone B compared to when manual blind control was performed.
If the VP and slat angle can be adjusted without lowering all blinds considering the work plane reference position, occupants may have more external views and a better sense of openness. In addition, it is possible to secure work plane illuminance because the inflow of daylight increases without the direct impact of direct sunlight and glare.

5. Conclusions

In this study, experiments on integrated blinds and LED dimming controls were performed using a full-scale mock-up with LED lighting equipment and external automated blinds. Actual illuminance experimental data were constructed and analyzed using the commercialized blind control logic of the French company S. The indoor illuminance (daylight + artificial illuminance) of each experimental case was quantitatively evaluated through LED dimming controls integrated with blind controls based on the exterior vertical illuminance. The conclusions that can be drawn from this study are listed below:
(1)
The illuminance of the LED photo sensor was expressed as Pulse with Modulation (PWM) in the dimming control software of company A. To convert this into lx, an illuminance unit, the illuminance (lx) was measured by installing a Minolta illuminance sensor that measures the work plane illuminance at the same position as that of the LED photo sensor. The correlations between the lx values of the Minolta sensors (Locations #1–4) and the LED photo sensor PWM were derived according to the dimming rate 0–100%. The relationships between the LED photo sensor and the illuminance sensors at each position were higher than 0.9 (Location #1: 0.9936, Location #2: 0.9966, Location #3: 0.9934), thereby exhibiting close relationships.
(2)
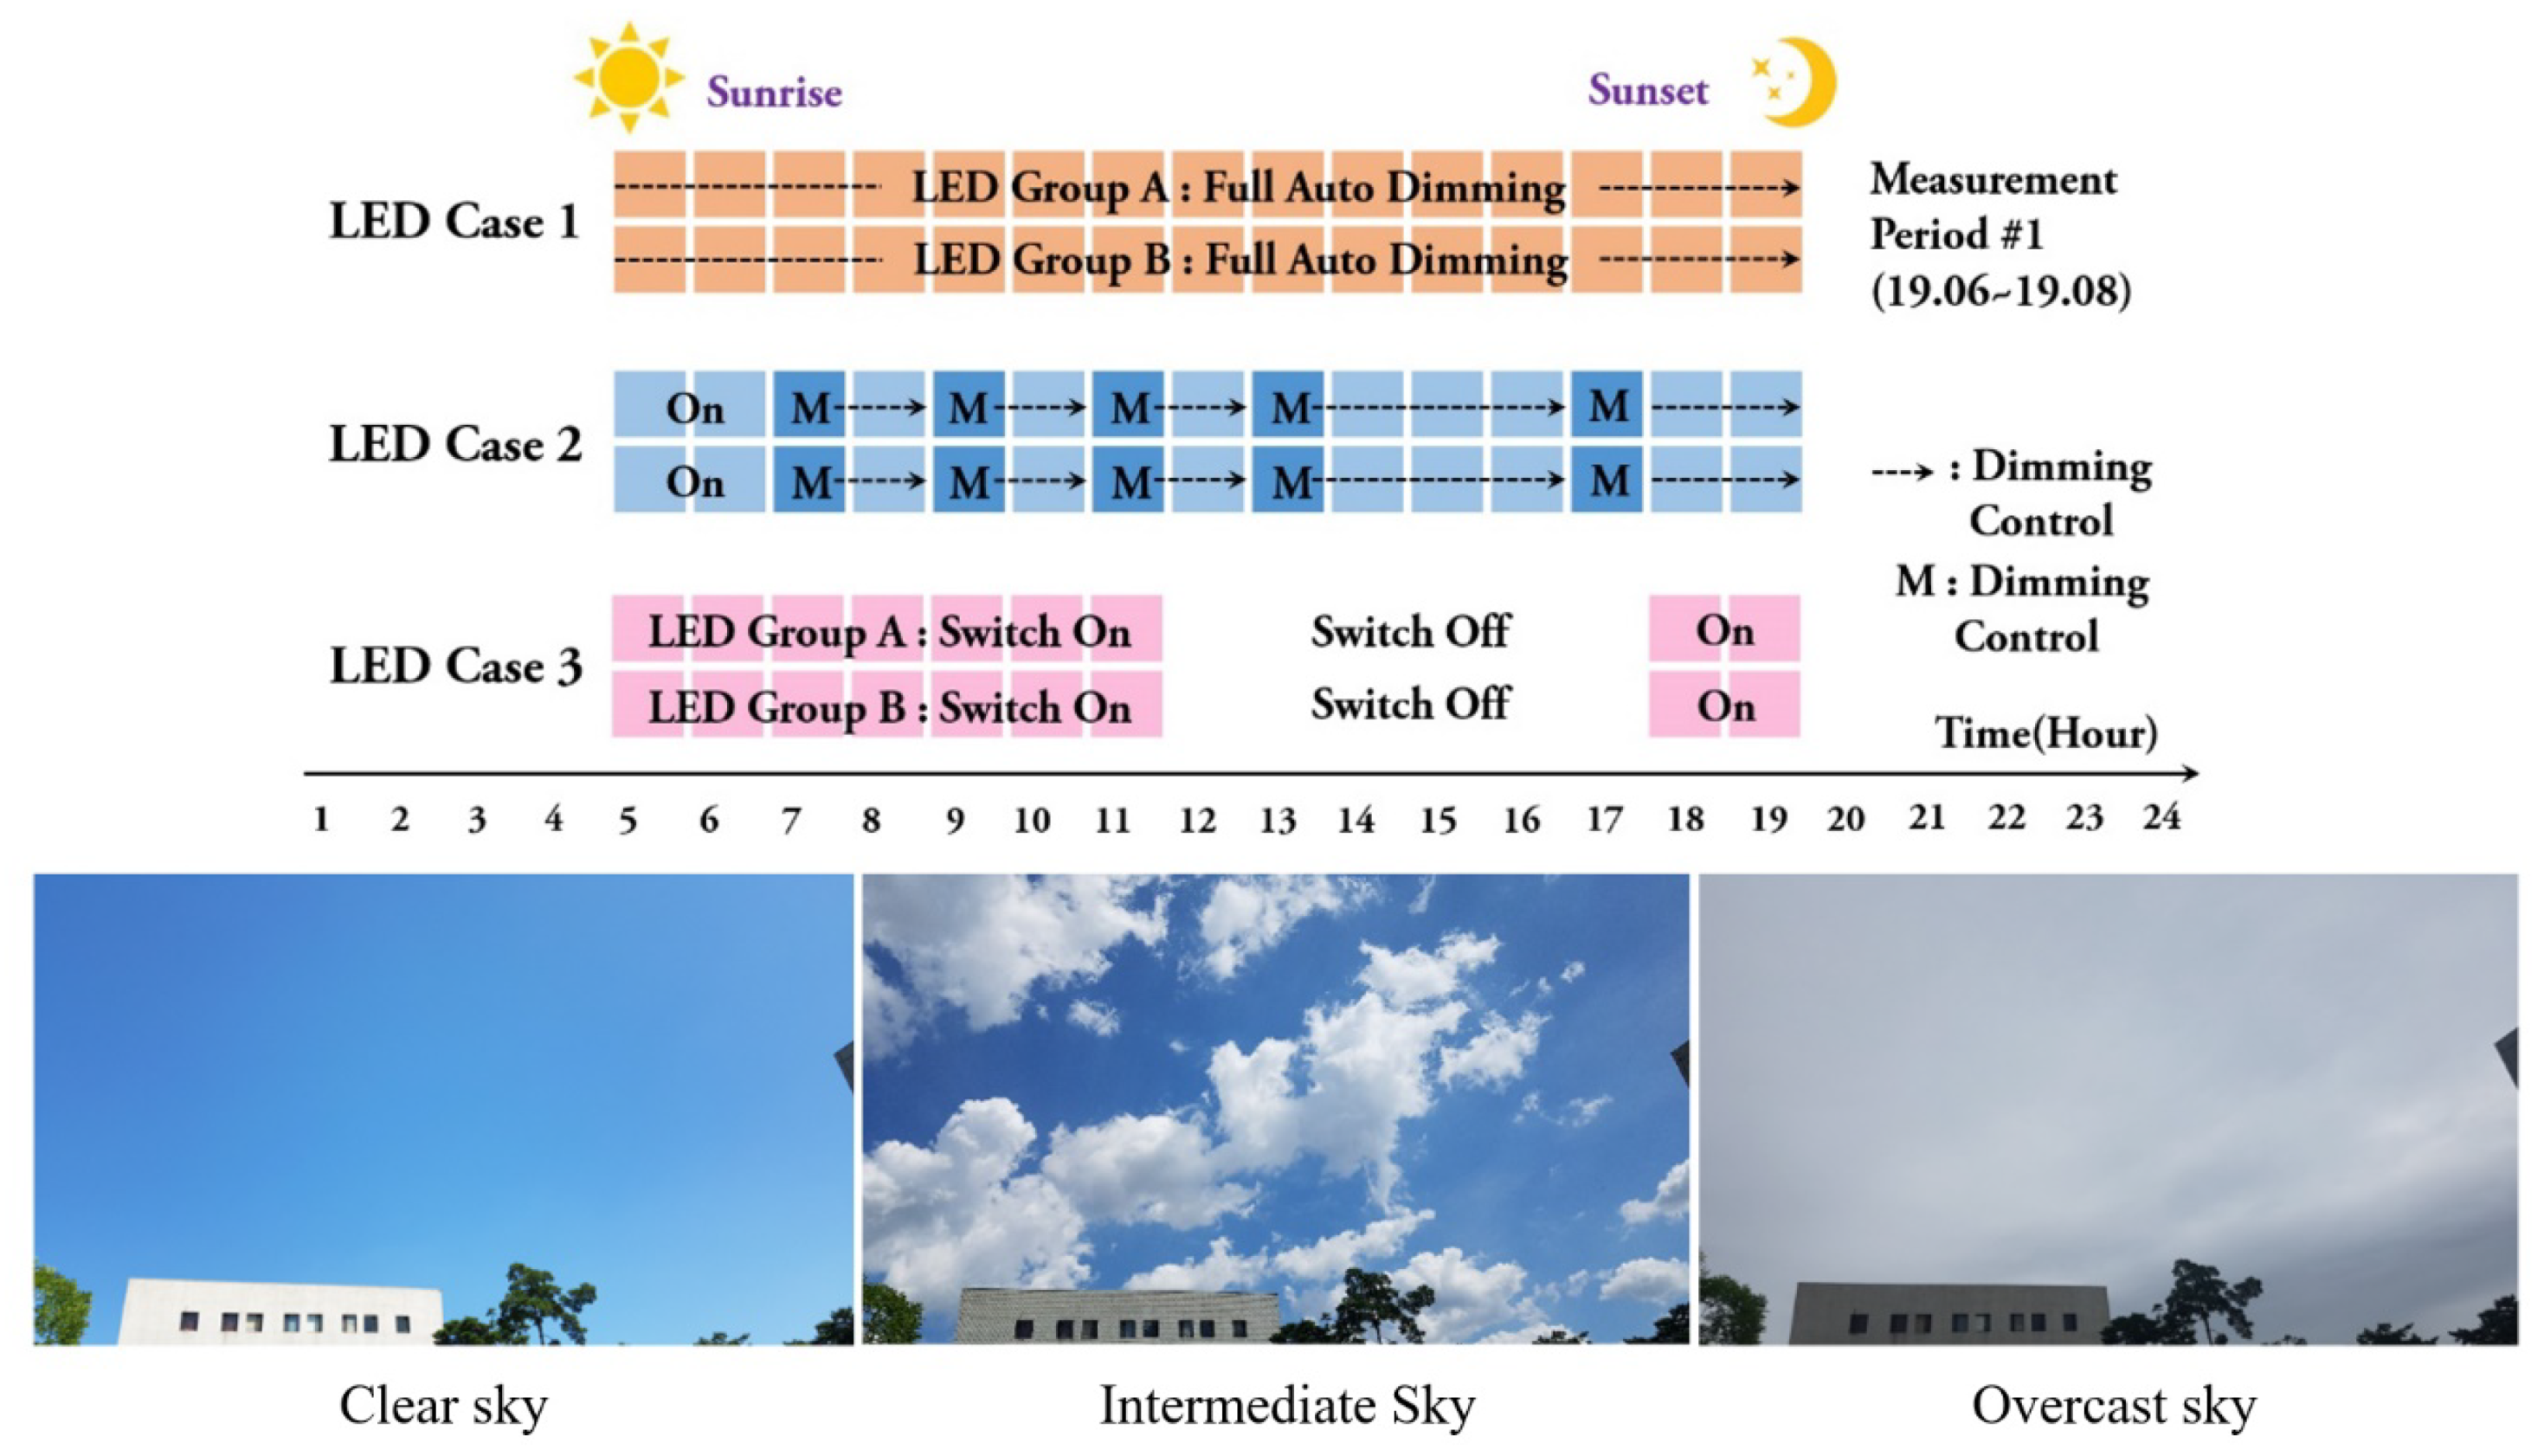
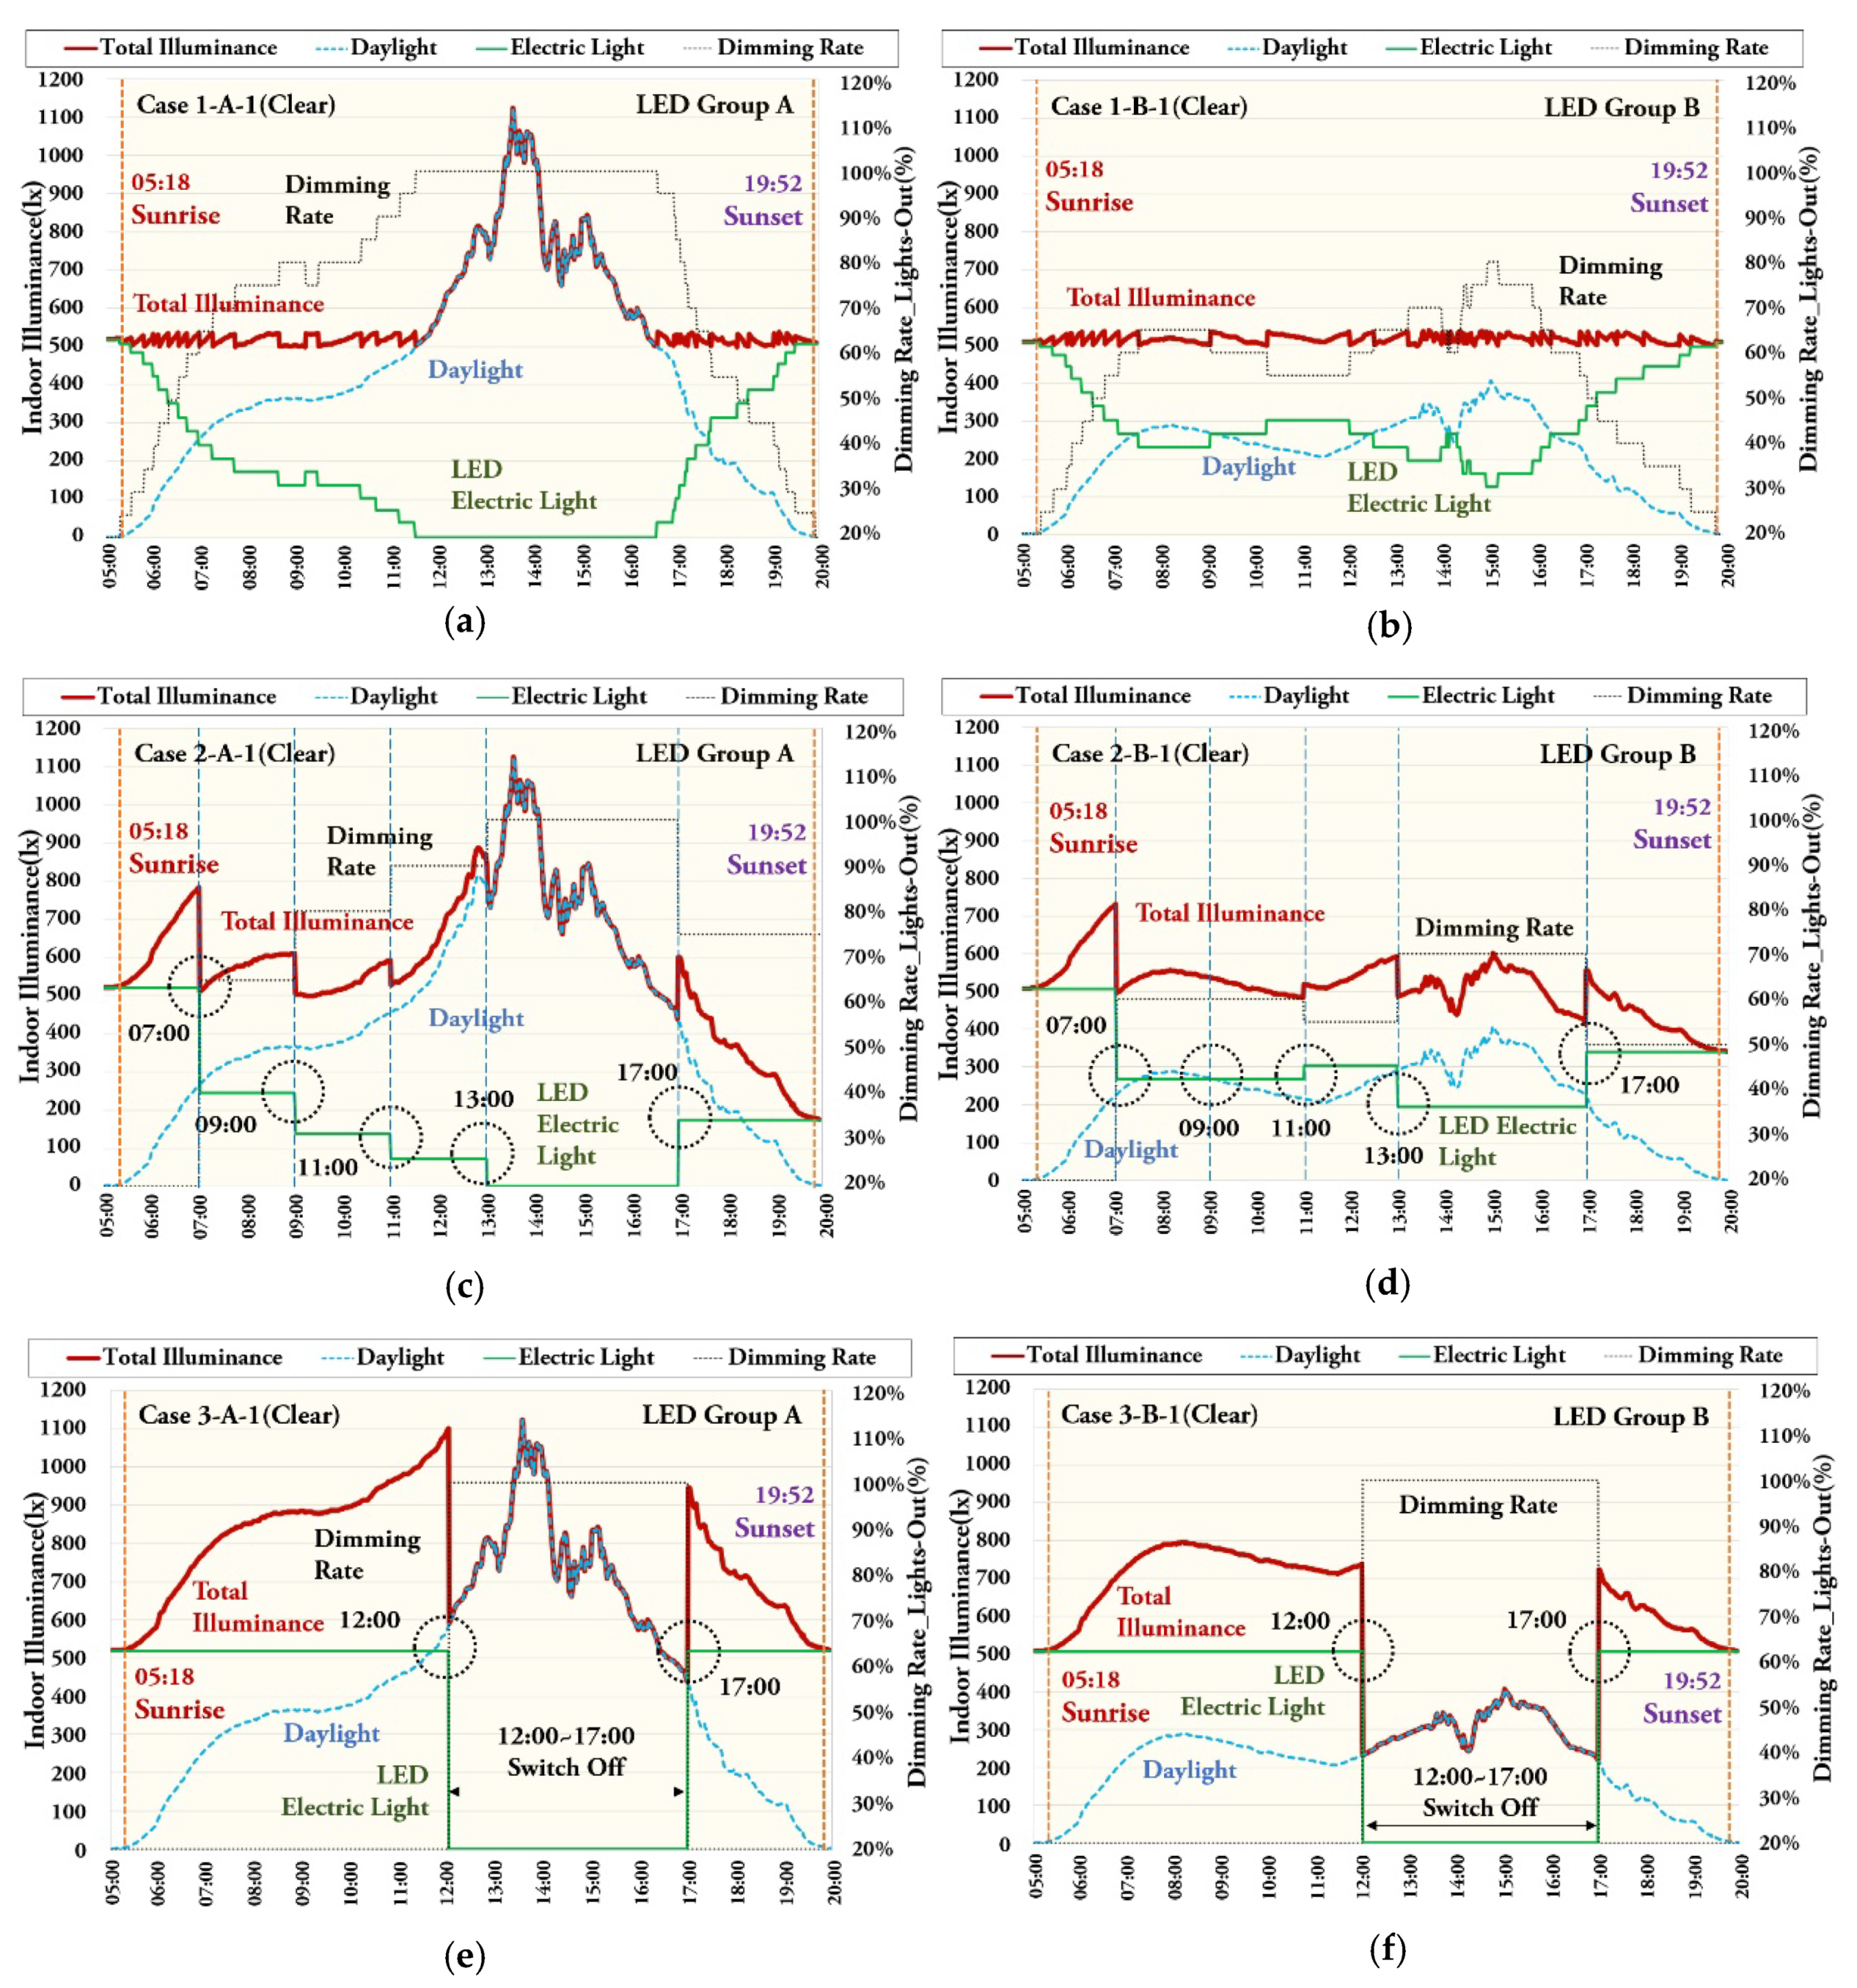
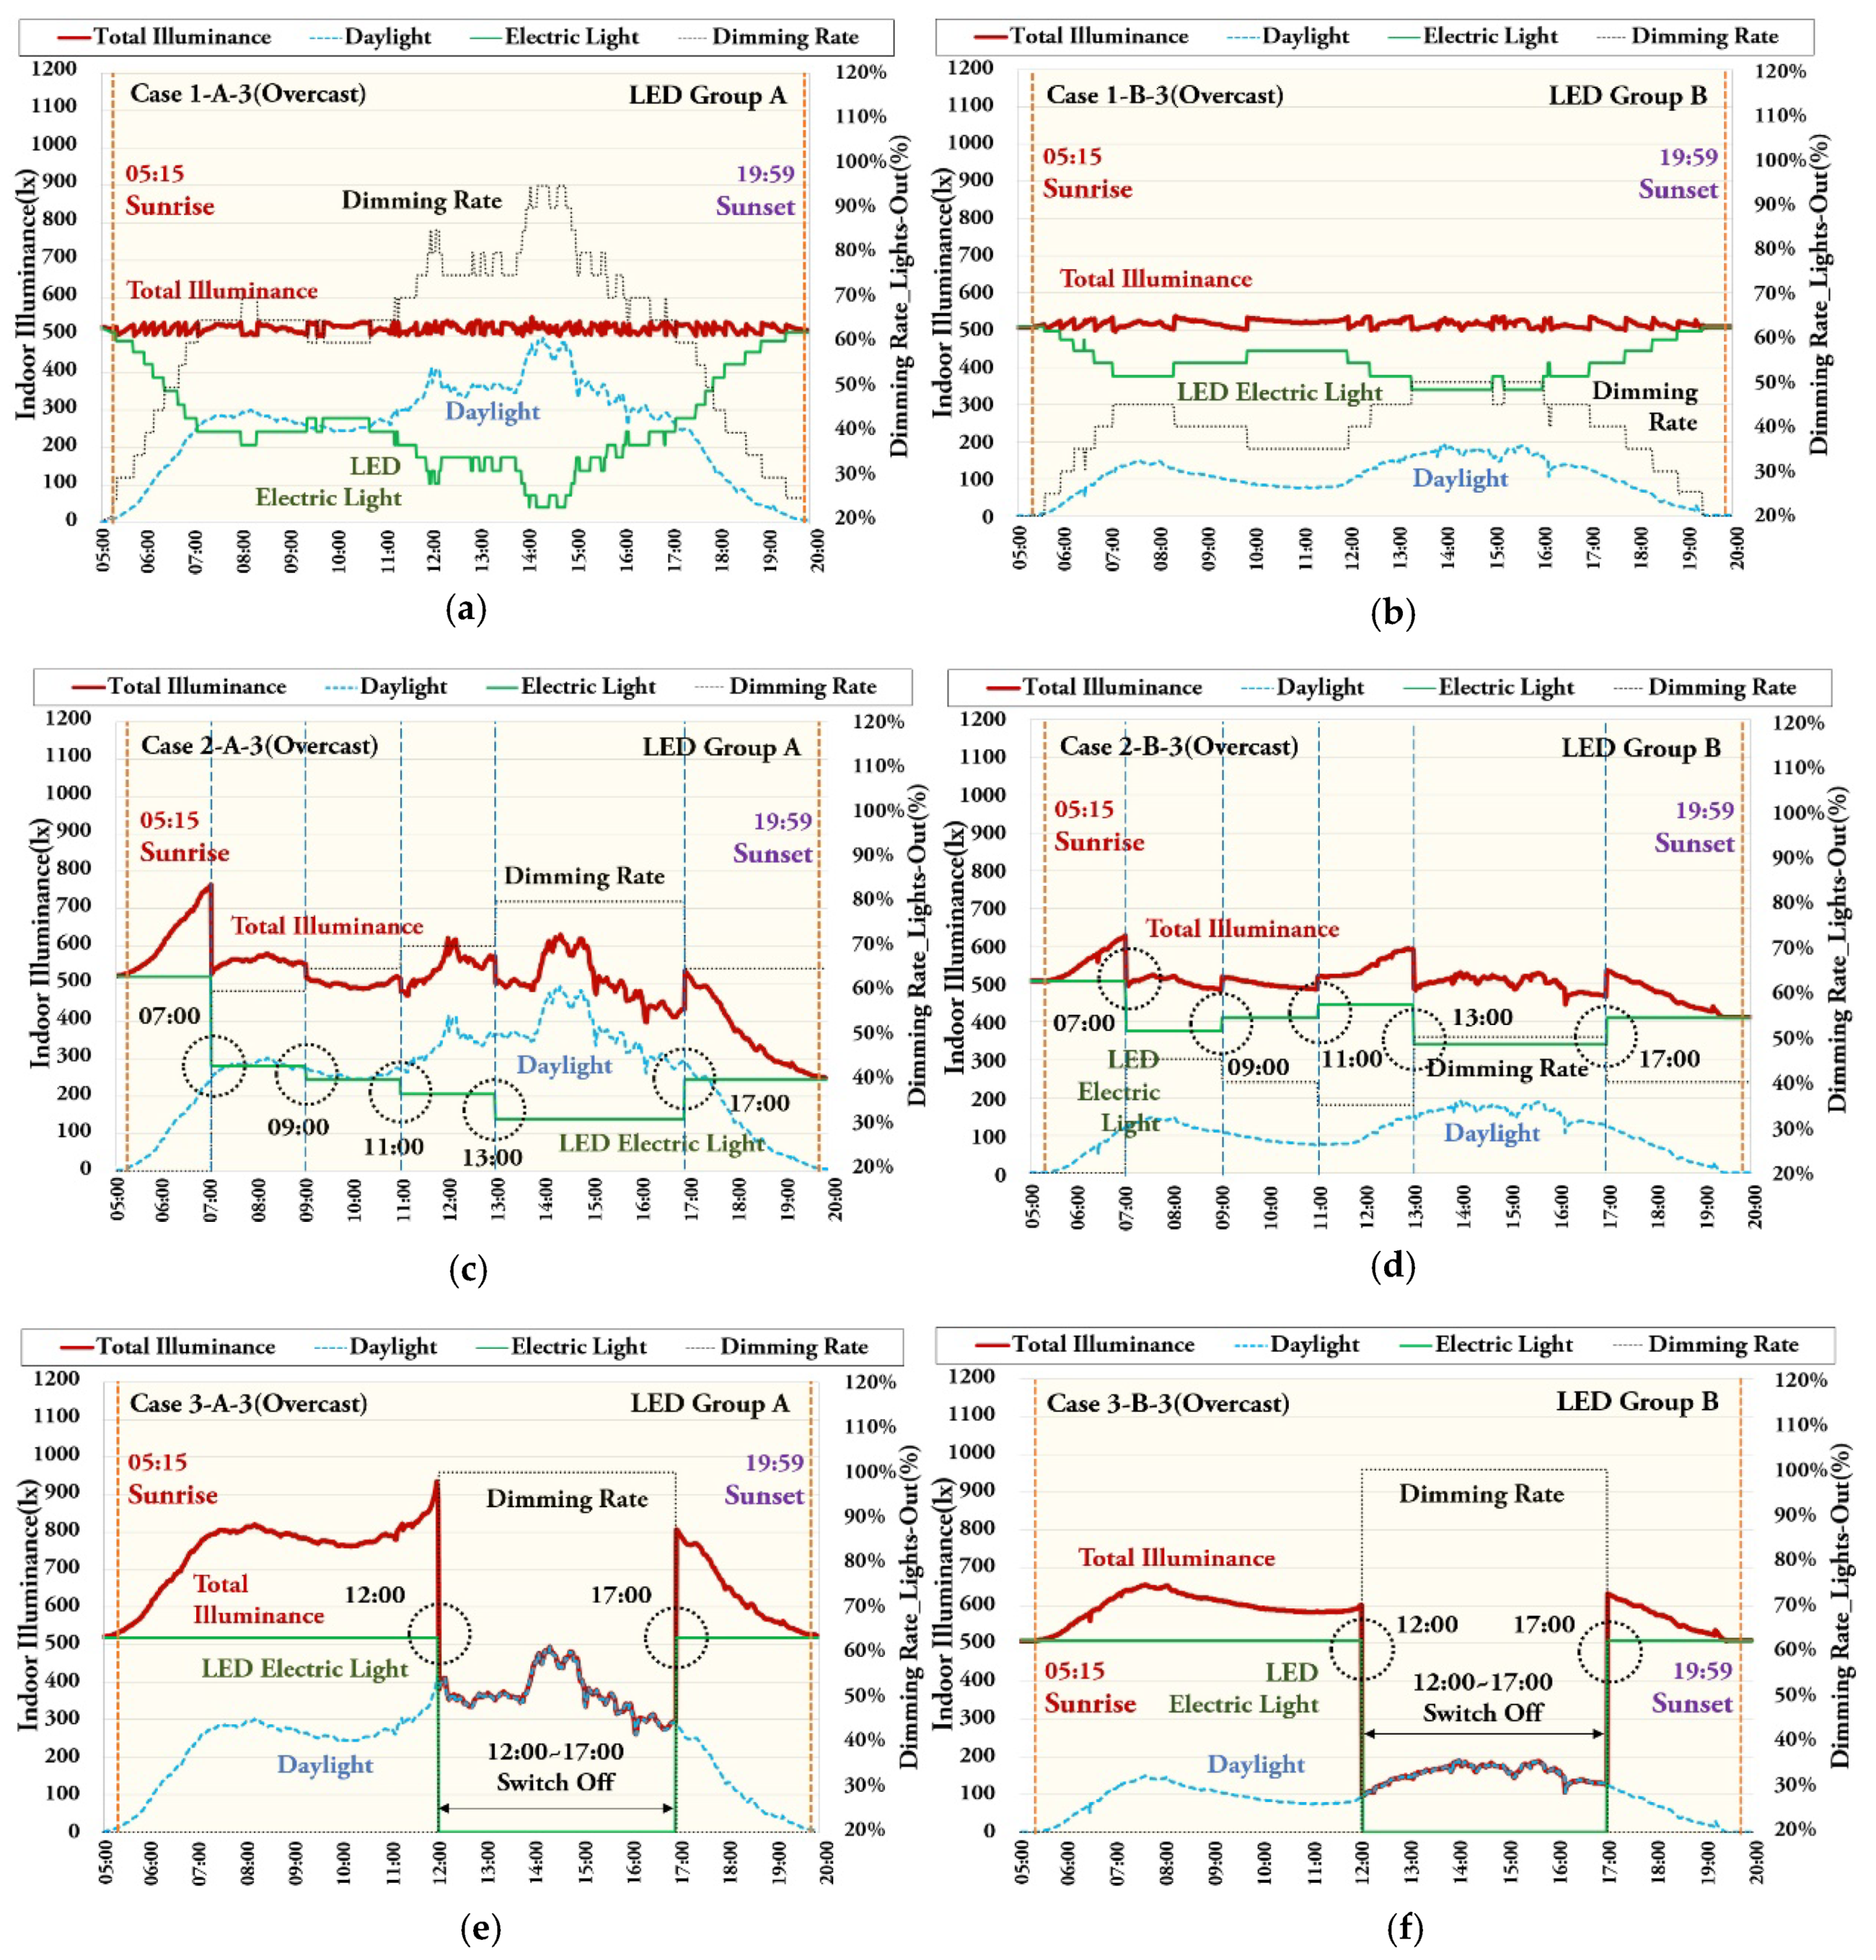
During measuring period #1 (June to August 2019), the standard illuminance (500 lx) was set based on the basic envelope conditions (low-E glazing) with no blinds in the target space prior to integrated blind controls. When dimming control was conducted under each sky condition, the indoor work plane illuminance was constantly maintained at 500 lx (±30 lx) by daylight and artificial lighting. The average dimming rates of 82% (window side) and 58% (indoor side) were observed under clear sky, and those of 69% (window side) and 51% (indoor side) were observed under intermediate sky. Under overcast sky, the average dimming rates of 57% (window side) and 46% (indoor side) were observed. These results indicate that dimming control was effective for reducing lighting energy.
(3)
However, during measuring period #2 (September to October 2019), solar radiation cut-off was required, because excessive direct sunlight was introduced to the work plane. Excessive daylight only for lighting energy reduction may cause unpleasant thermal and light environments in an indoor space. The maximum daylight illuminance of the work plane was measured to be 2860 lx. To address this problem, blinds that can cut off solar heat were required. Therefore, LED dimming controls integrated with blind controls were used in measuring period #2.
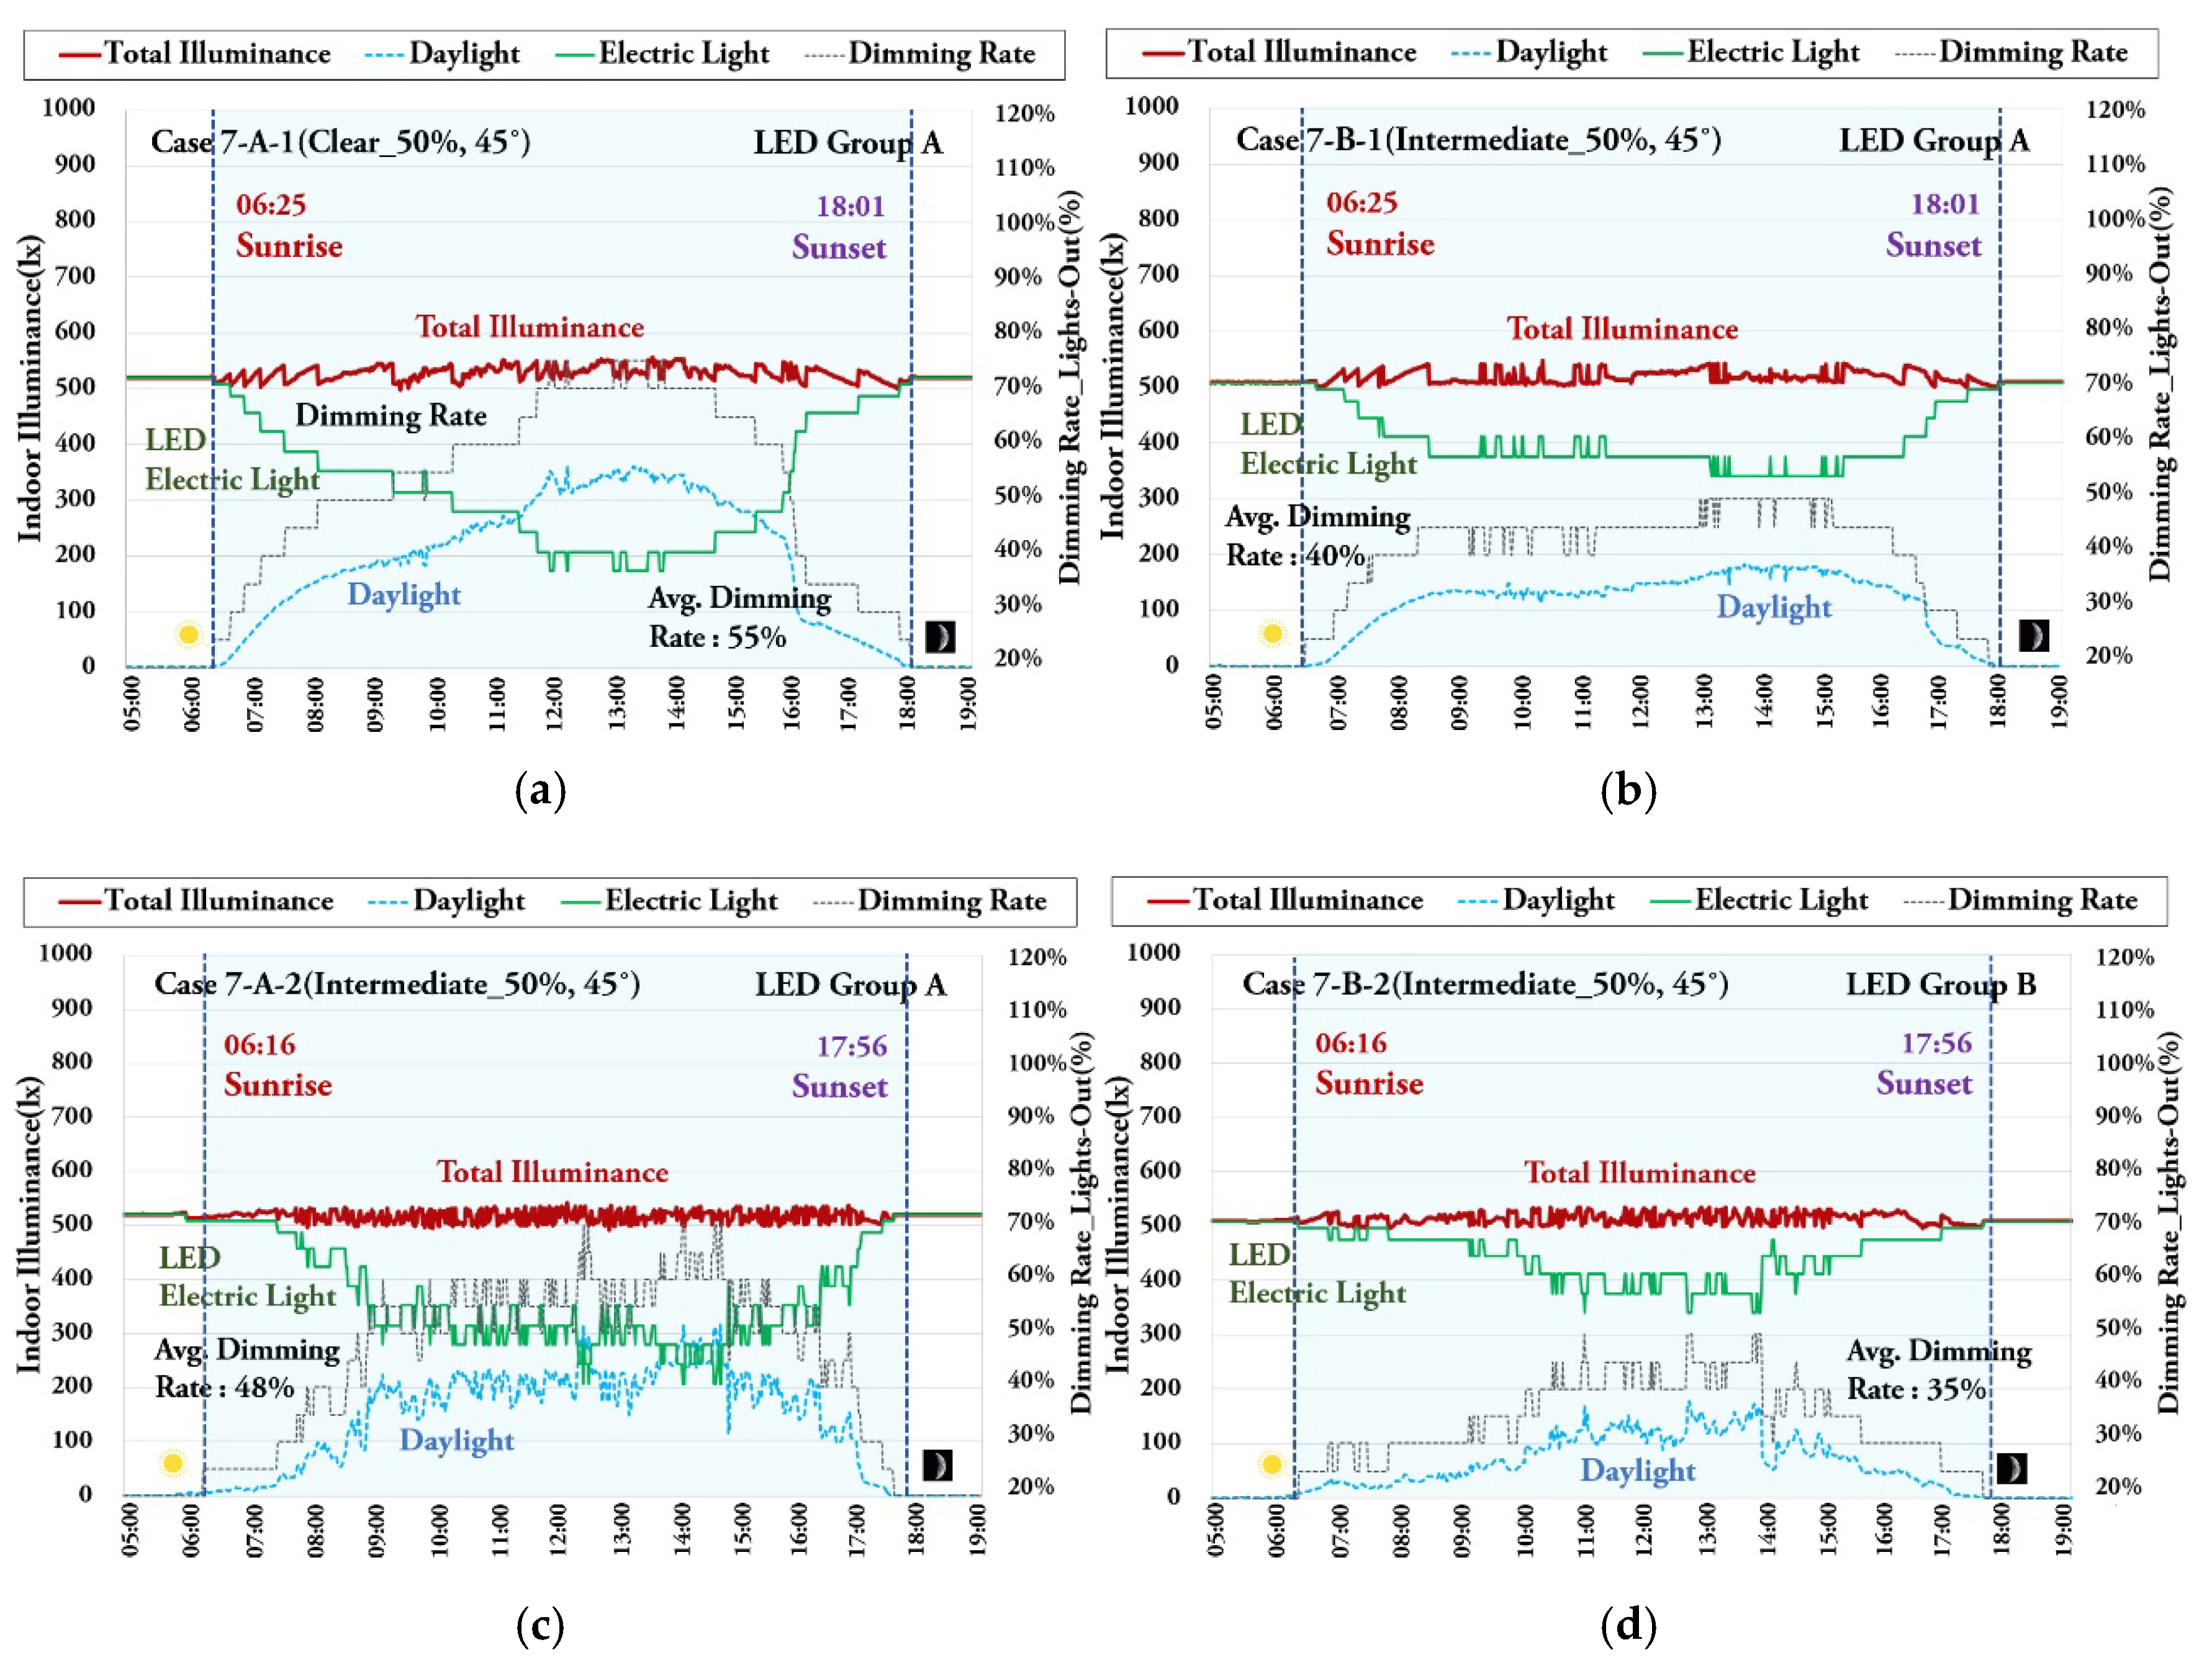
(4)
When integrated LED dimming control was conducted after the vertical position of the blind was set to 100% and its slat angle was set to 0° under clear and intermediate sky, the average dimming rates were evaluated to be 55% (window side) and 40% (indoor side). When the VP was 100% and the slat angle was 45°, the dimming rates were evaluated to be 46% (window side) and 35% (indoor side), which were the lowest dimming rates among all experimental cases. When integrated LED dimming control was performed after setting the VP to 50% and the slat angle to 0°, the average dimming rates were evaluated to be 58% (window side) and 44% (indoor side). When integrated LED dimming control was conducted after setting the VP to 50% and the slat angle to 45°, the average dimming rates were evaluated to be 52% (window side) and 38% (indoor side). It was found that manual blind control had the effect of cutting off solar radiation, but because the angle and VP were fixed, daylight could not be effectively used.
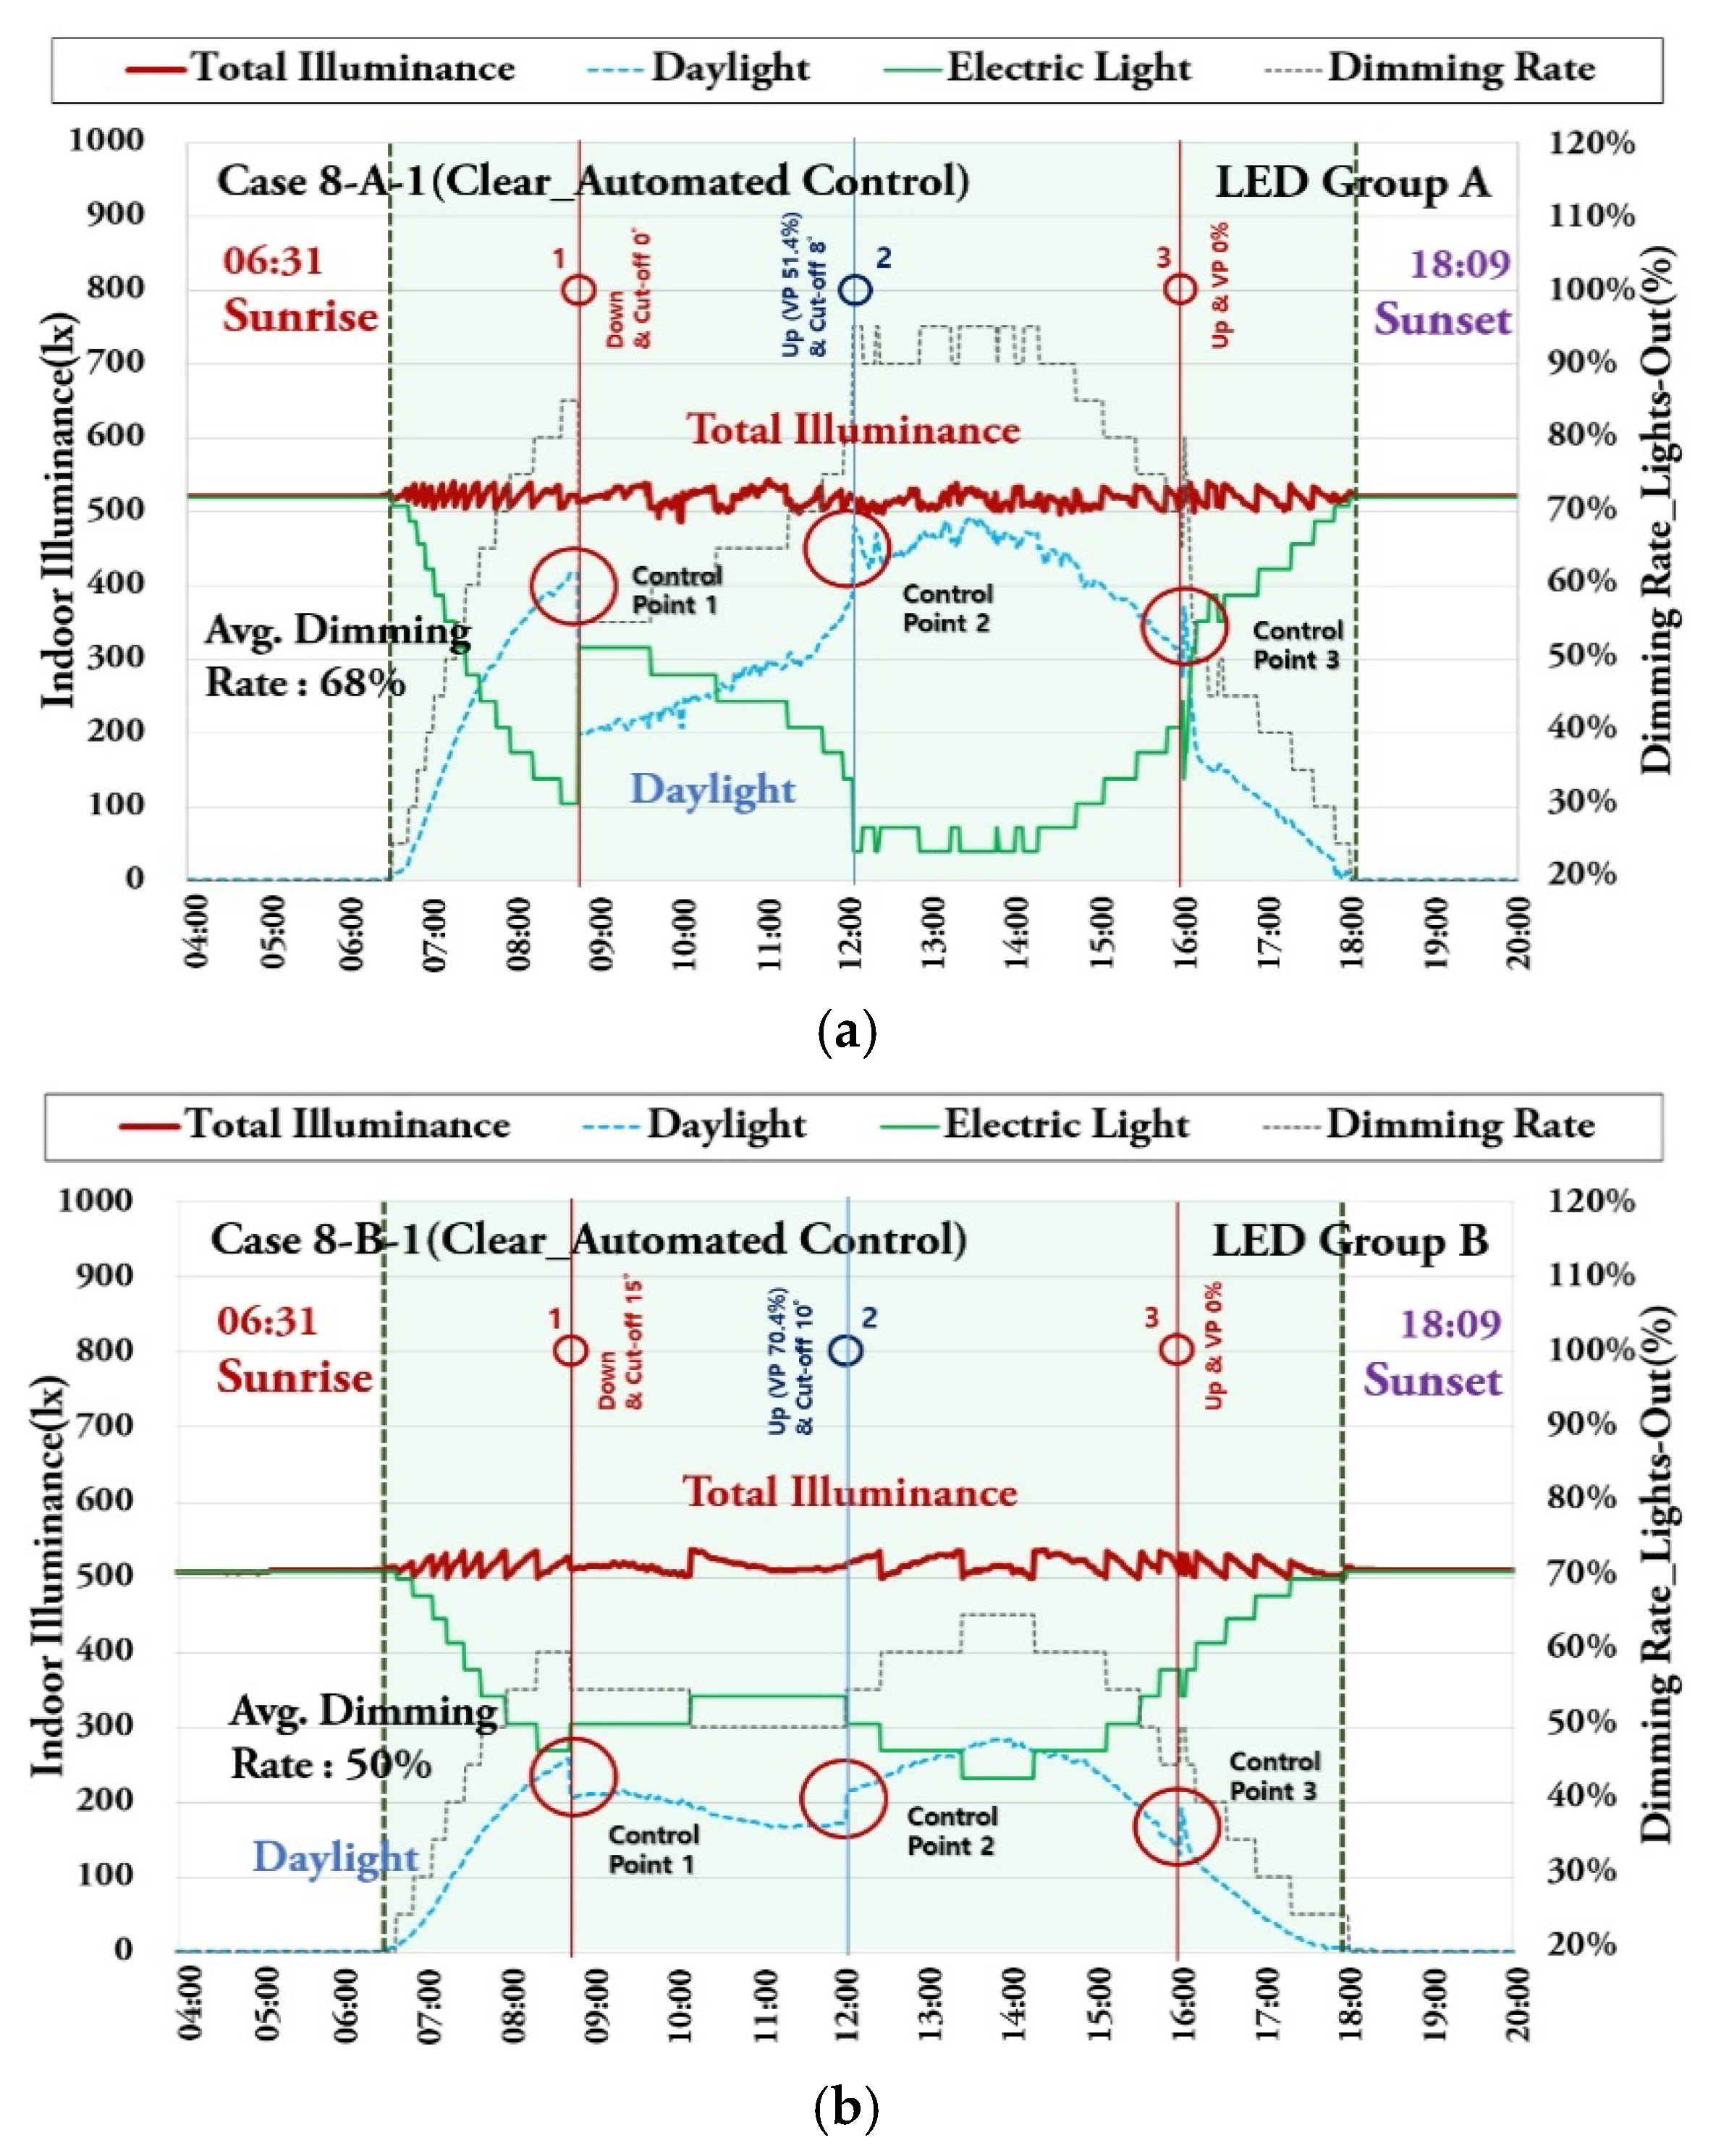
(5)
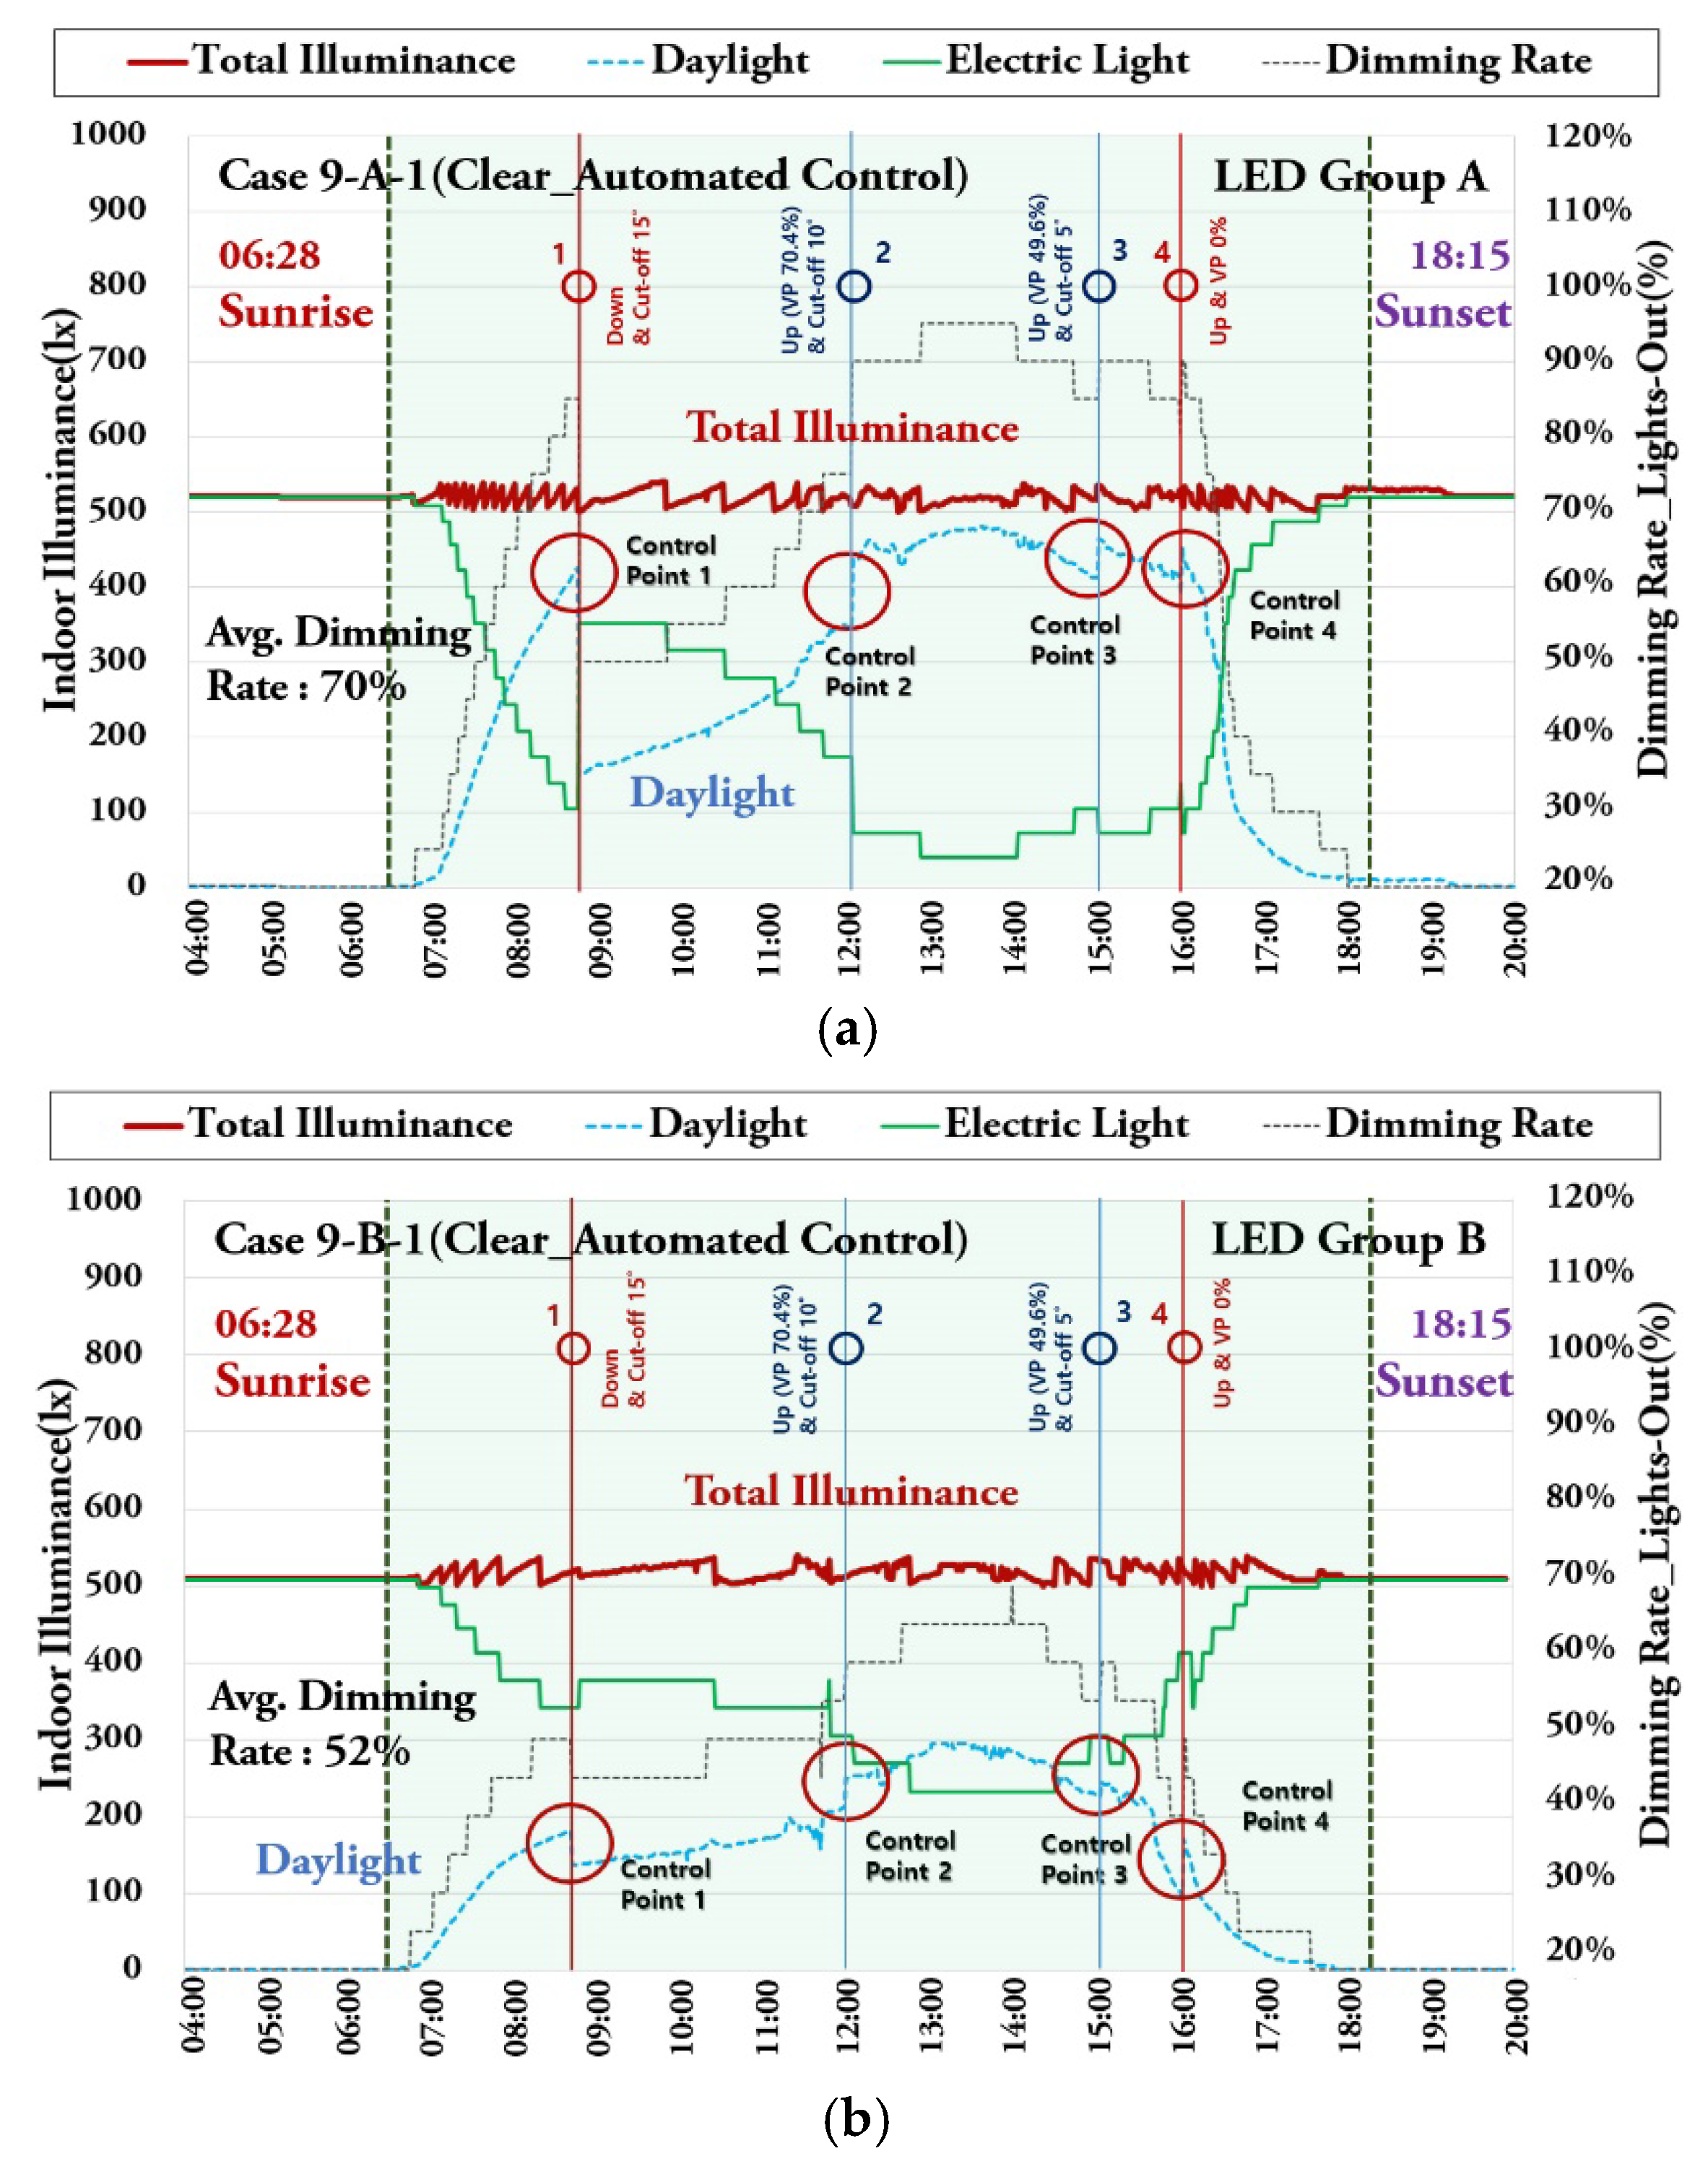
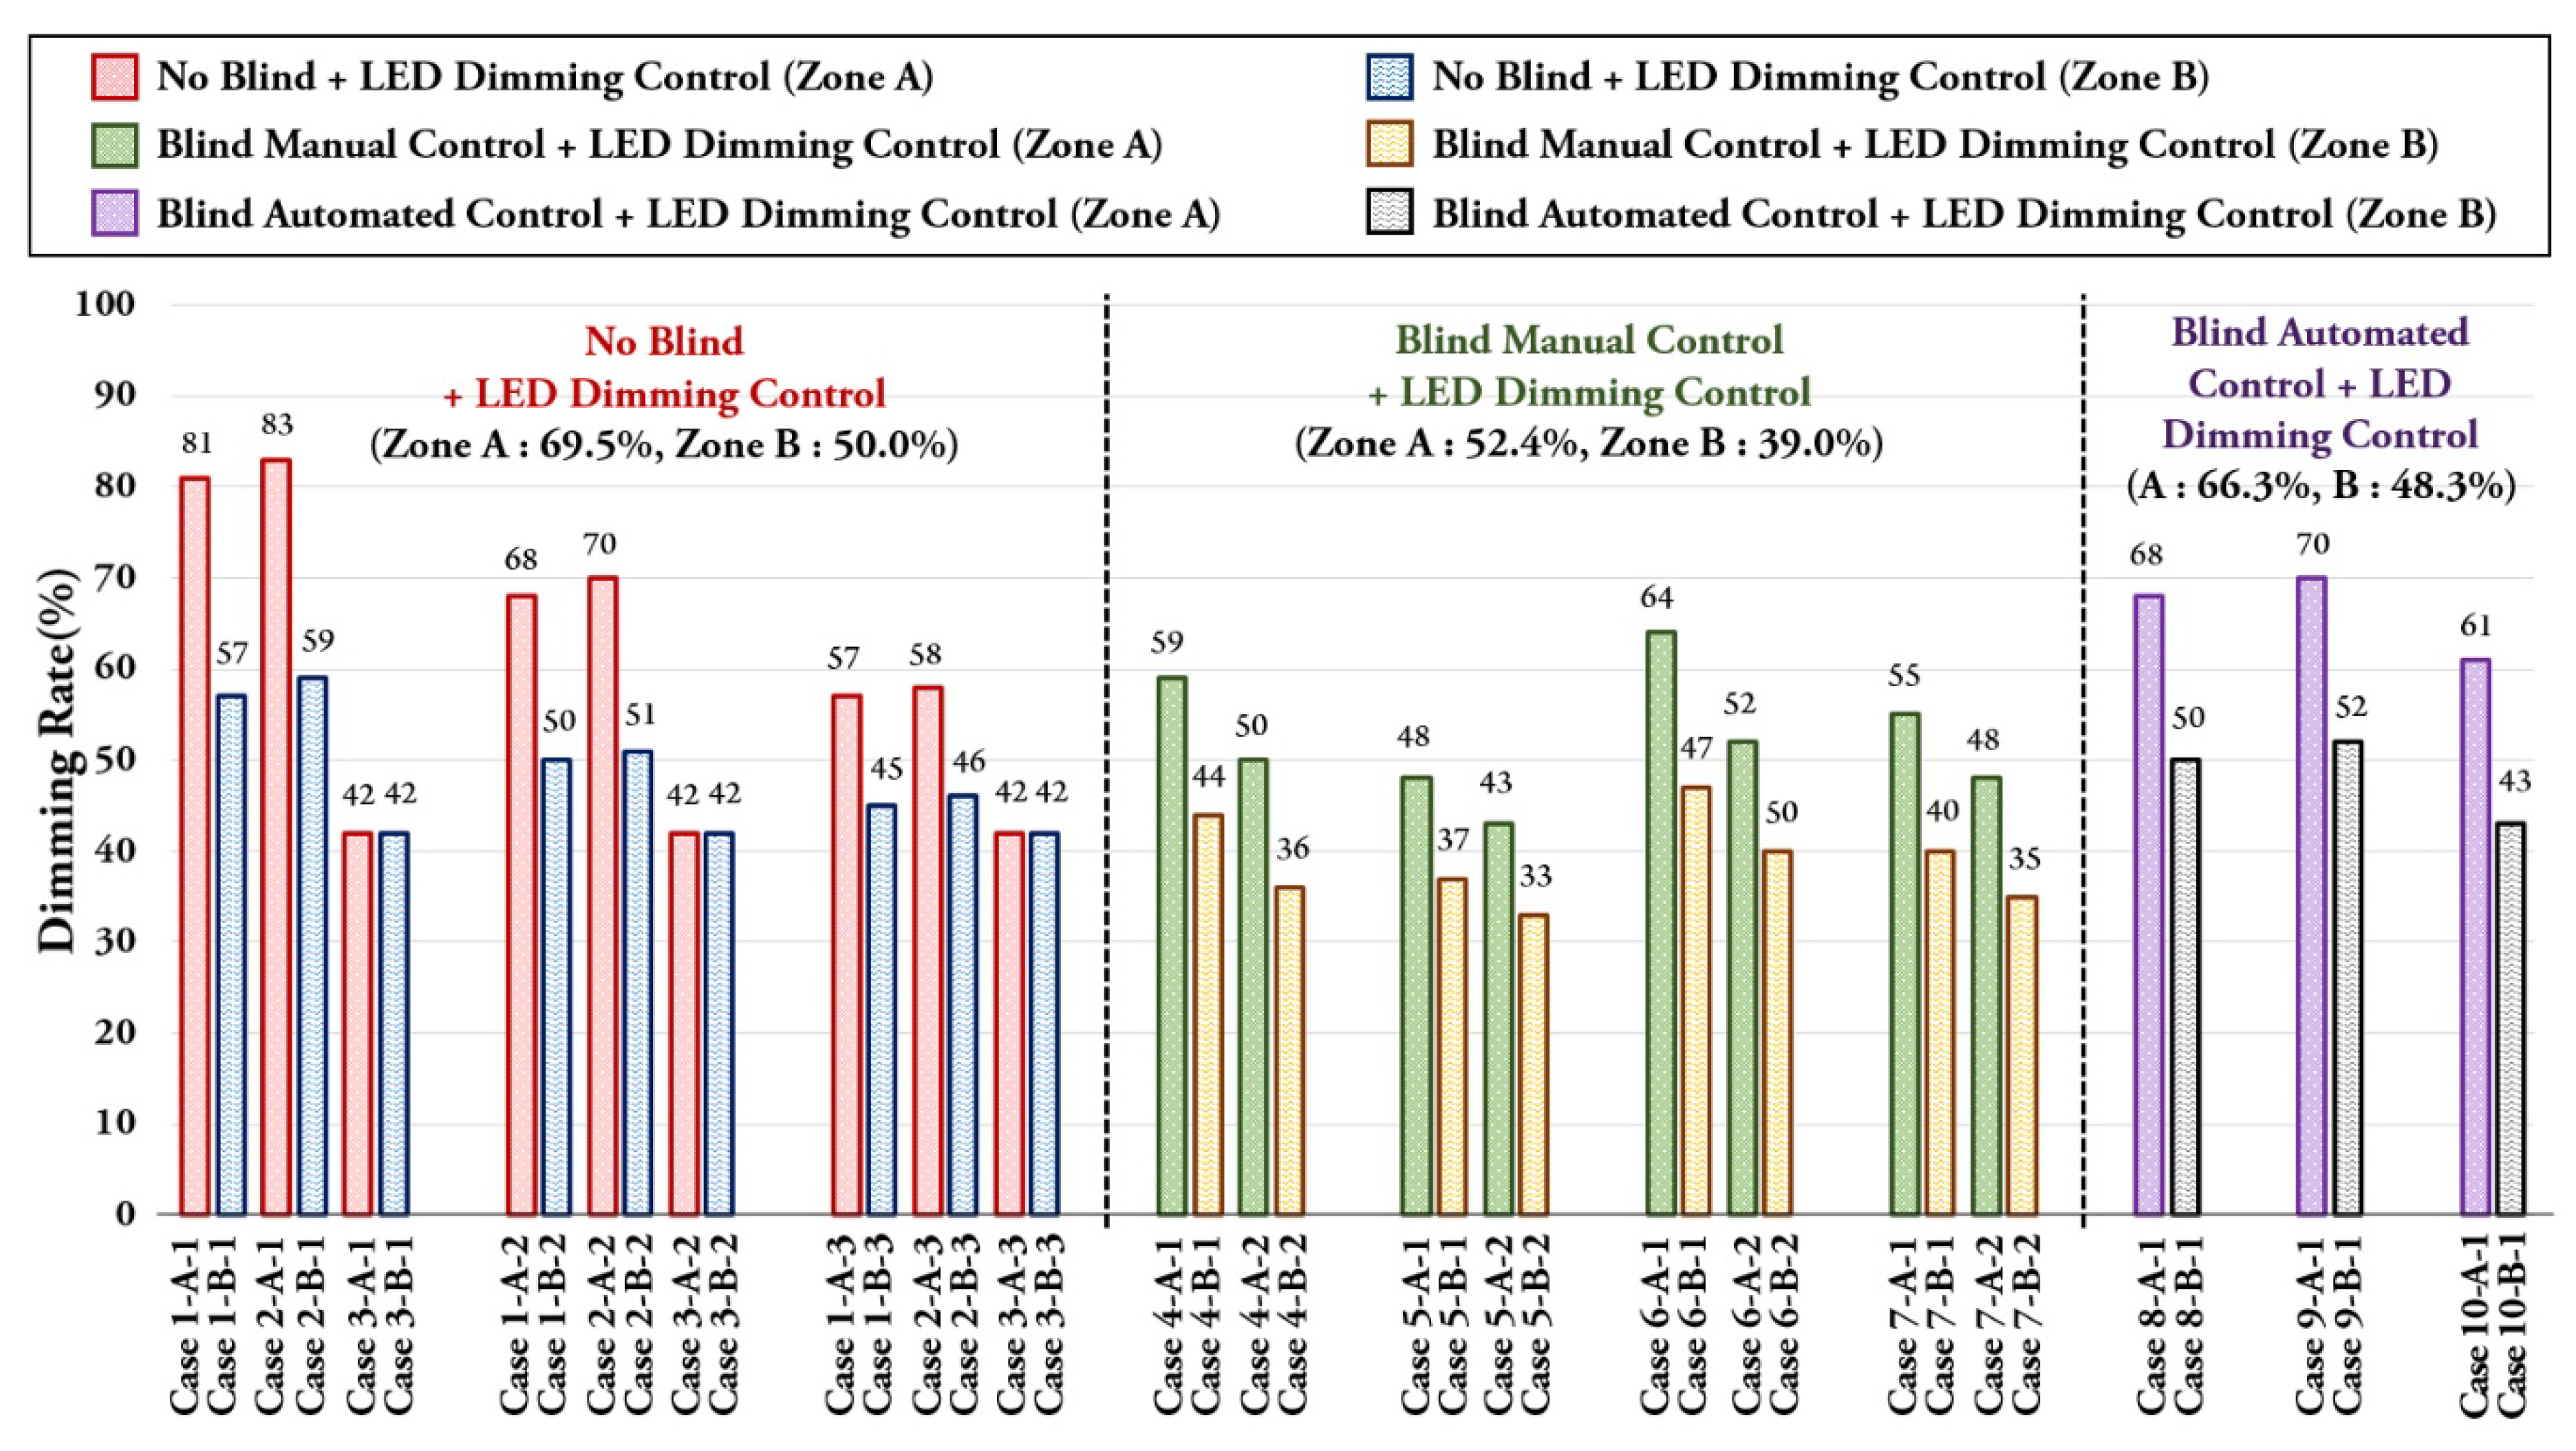
When the blinds were subjected to three-step automatic control based on the exterior vertical illuminance and LED dimming control was performed at the same time under clear sky, the indoor work plan illuminance was constantly maintained at 500 lx (±30 lx) by daylight and artificial lighting, and the dimming rates of Zone A and Zone B were found to be 68 and 50%, respectively. When both four-step automatic control and LED dimming control were utilized, the dimming rates of Zone A and Zone B were found to be 70 and 52%, respectively. Under intermediate sky, the dimming rates of Zone A and Zone B were found to be 64 and 43%, respectively. When LED dimming control integrated with automatic blind control was used, the average dimming rate was 2.1% lower in Zone A and 1.7% lower in Zone B compared to when automatic and manual LED dimming control was conducted for low-E glazing with no blinds, but excessive solar radiation could be blocked. In addition, because the dimming rate was 14.9% higher in Zone A and 9.3% higher in Zone B compared to when manual blind control was performed, it was possible to utilize more daylight, and thus to reduce lighting energy.
(6)
The experimental results showed that because the LED dimming rate changed when daylight was introduced under various external weather conditions, it was possible to secure the uniform illuminance required for the indoor space in all cases. If the VP and the slat angle can be adjusted without lowering all the blinds, considering the work plane reference position, occupants may have more external views and a better sense of openness. Moreover, because the inflow of daylight increases without the direct impact of direct sunlight and glare, it is possible to secure the work plane illuminance. It was found that integrated blinds and LED dimming controls contributed to maintaining the standard illuminance and saving lighting energy using daylight. Based on the results of this study, further research will be conducted on the comfort indicators (thermal comfort and visual comfort) and thermal environment of buildings, as well as the cooling and heating energy.

Supplementary Materials

The following are available online at https://www.mdpi.com/1996-1073/13/12/3238/s1, Table S1. Raw data for Illuminance and dimming rate under dimming control with no blinds (clear sky-1), Table S2. Raw data for Illuminance and dimming rate under dimming control with no blinds (intermediate sky), Table S3. Raw data for Illuminance and dimming rate under dimming control with no blinds (overcast sky), Table S4. Raw data for Illuminance and dimming rate under dimming control with no blinds (clear sky-2), Table S5. Raw data for Illuminance and dimming rates under dimming controls integrated with manual blind controls (100%–0°, clear sky), Table S6. Raw data for Illuminance and dimming rates under dimming controls integrated with manual blind controls (100%–0°, intermediate sky), Table S7. Raw data for Illuminance and dimming rates under dimming controls integrated with manual blind controls (100%–45°, clear sky), Table S8. Raw data for Illuminance and dimming rates under dimming controls integrated with manual blind controls (100%–45°, intermediate sky), Table S9. Raw data for Illuminance and dimming rates under dimming controls integrated with manual blind controls (50%–0°, clear sky), Table S10. Raw data for Illuminance and dimming rates under dimming controls integrated with manual blind controls (50%–0°, intermediate sky), Table S11. Raw data for Illuminance and dimming rates under dimming controls integrated with manual blind controls (50%–45°, clear sky), Table S12. Raw data for Illuminance and dimming rates under dimming controls integrated with manual blind controls (50%–45°, intermediate sky), Table S13. Raw data for Illuminance and dimming rates under dimming controls integrated with automatic blind controls (3-steps, clear sky), Table S14. Raw data for Illuminance and dimming rates under dimming controls integrated with automatic blind controls (4-steps, clear sky), Table S15. Raw data for Illuminance and dimming rates under dimming controls integrated with automatic blind controls (intermediate sky).

Author Contributions

C.-H.K. performed the experiment and data analysis, and wrote this paper based on the obtained results with the help of K.-H.L. K.-S.K. led and supervised this study. All of the authors have contributed for collecting ideas and concepts presented in the paper. All authors have read and agreed to the published version of the manuscript.

Funding

This research was funded by the Korean Ministry of Education (No. 2017R1D1A1B03028205).

Acknowledgments

This research was supported by Basic Science Research Program through the National Research Foundation of Korea (NRF) funded by the Ministry of Education (No. 2017R1D1A1B03028205).

Conflicts of Interest

The authors declare no conflict of interest.

References

  1. Amasyali, K.; El–Gohary, N.M. A review of data–driven building energy consumption prediction studies. Renew. Sustain. Energy Rev. 2018, 81, 1192–1205. [Google Scholar] [CrossRef]
  2. Kaminska, A.; Ożadowicz, A. Lighting Control Including Daylight and Energy Efficiency Improvements Analysis. Energies 2018, 11, 2166. [Google Scholar] [CrossRef] [Green Version]
  3. Kim, C.H.; Lee, S.E.; Kim, K.S. Analysis of Energy Saving Potential in High–Performance Building Technologies under Korean Climatic Conditions. Energies 2018, 11, 884. [Google Scholar] [CrossRef] [Green Version]
  4. Ministry of Land, Infrastructure and Transport (MOLIT); Korea Energy Agency (KEA). Building Energy Saving Design Standards of Korea; KEA: Gyeonggi-Do, Korea, 2018.
  5. Fontoynont, M.; Ramananarivo, K.; Soreze, T.; Fernez, G.; Skov, K.G. Economic feasibility of maximising daylighting of a standard office building with efficient electric lighting. Energy Build. 2016, 110, 435–442. [Google Scholar] [CrossRef] [Green Version]
  6. Mettanant, V.; Chaiwiwatworakul, P. Automated vertical blinds for daylighting in tropical region. Energy Procedia 2014, 52, 278–286. [Google Scholar] [CrossRef] [Green Version]
  7. Chaiwiwatworakul, P.; Chirarattananon, S.; Rakkwamsuk, P. Application of automated blind for daylighting in tropical region. Energy Convers. Manag. 2009, 50, 2927–2943. [Google Scholar] [CrossRef]
  8. Bodart, M.; De Herde, A. Global energy savings in offices buildings by the use of daylighting. Energy Build. 2002, 34, 421–429. [Google Scholar] [CrossRef]
  9. Shen, E.; Hu, J.; Patel, M. Energy and visual comfort analysis of lighting and daylight control strategies. Build. Environ. 2014, 78, 155–170. [Google Scholar] [CrossRef]
  10. Reinhart, C.F. Lightswitch-2002: A model for manual and automated control of electric lighting and blinds. Sol. Energy 2004, 77, 15–28. [Google Scholar] [CrossRef] [Green Version]
  11. Babu, S.; Zhou, J.; Wan, M.P.; Lamano, A.S.; Sarvaiya, J.N.; Zhang, Z.; Kumar, D.K.; Gao, C.P.; Valliappan, S.; Goh, A. et al.; et al. Investigation of an integrated automated blinds and dimmable lighting system for tropical climate in a rotatable testbed facility. Energy Build. 2019, 183, 356–376. [Google Scholar] [CrossRef]
  12. Meerbeek, B.W.; de Bakker, C.; De Kort, Y.A.W.; Van Loenen, E.J.; Bergman, T. Automated blinds with light feedback to increase occupant satisfaction and energy saving. Build. Environ. 2016, 103, 70–85. [Google Scholar] [CrossRef]
  13. Kim, C.H.; Lee, S.E.; Kim, K.S. Comprehensive Analysis of Energy Consumption Rate and New Technology Trend in High-Performance Buildings related with Different Climatic Zones. J. Arch. Inst. Korea Struct. Constr. 2018, 34, 63–72. [Google Scholar]
  14. Williams, A.; Atkinson, B.; Garbesi, K.; Page, E.; Rubinstein, F. Lighting controls in commercial buildings. LEUKOS J. Illum. Eng. Soc. 2012, 8, 161–180. [Google Scholar] [CrossRef]
  15. Galasiu, A.D.; Atif, M.R.; MacDonald, R.A. Impact of window blinds on daylight-linked dimming and automatic on/off lighting controls. Sol. Energy 2004, 76, 523–544. [Google Scholar] [CrossRef] [Green Version]
  16. Fernandes, L.L.; Lee, E.S.; DiBartolomeo, D.L.; McNeil, A. Monitored lighting energy savings from dimmable lighting controls in The New York Times Headquarters Building. Energy Build. 2014, 68, 498–514. [Google Scholar] [CrossRef] [Green Version]
  17. Richman, E.E.; Kinzey, B.R.; Miller, N.J. Laboratory Evaluation of LED T8 Replacement Lamp Products (No. PNNL-20404); Pacific Northwest National Lab.(PNNL): Richland, WA, USA, 2011.
  18. Al-Ashwal, N.T.; Budaiwi, I.M. Energy savings due to daylight and artificial lighting integration in office buildings in hot climate. Int. J. Energy Environ. 2011, 2, 999–1012. [Google Scholar]
  19. Caicedo, D.; Pandharipande, A.; Willems, F.M. Daylight-adaptive lighting control using light sensor calibration prior-information. Energy Build. 2014, 73, 105–114. [Google Scholar] [CrossRef]
  20. Yoo, S.; Kim, J.; Jang, C.Y.; Jeong, H. A sensor-less LED dimming system based on daylight harvesting with BIPV systems. Opt. Express 2014, 22, A132–A143. [Google Scholar] [CrossRef]
  21. Parise, G.; Martirano, L. Daylight impact on energy performance of internal lighting. IEEE Trans. Ind. Appl. 2012, 49, 242–249. [Google Scholar] [CrossRef]
  22. Gentile, N.; Dubois, M.C. Field data and simulations to estimate the role of standby energy use of lighting control systems in individual offices. Energy Build. 2017, 155, 390–403. [Google Scholar] [CrossRef]
  23. Gentile, N.; Laike, T.; Dubois, M.C. Lighting control systems in individual offices rooms at high latitude: Measurements of electricity savings and occupants’ satisfaction. Sol. Energy 2016, 127, 113–123. [Google Scholar] [CrossRef]
  24. Nagy, Z.; Yong, F.Y.; Frei, M.; Schlueter, A. Occupant centered lighting control for comfort and energy efficient building operation. Energy Build. 2015, 94, 100–108. [Google Scholar] [CrossRef]
  25. Gagne, J.M.; Andersen, M.; Norford, L.K. An interactive expert system for daylighting design exploration. Build. Environ. 2011, 46, 2351–2364. [Google Scholar] [CrossRef]
  26. Tzempelikos, A.; Athienitis, A.K. The impact of shading design and control on building cooling and lighting demand. Sol. Energy 2007, 81, 369–382. [Google Scholar] [CrossRef]
  27. Olbina, S.; Hu, J. Daylighting and thermal performance of automated split-controlled blinds. Build. Environ. 2012, 56, 127–138. [Google Scholar] [CrossRef]
  28. Chan, Y.C.; Tzempelikos, A. Efficient venetian blind control strategies considering daylight utilization and glare protection. Sol. Energy 2013, 98, 241–254. [Google Scholar] [CrossRef]
  29. Chan, Y.C.; Tzempelikos, A. A hybrid ray-tracing and radiosity method for calculating radiation transport and illuminance distribution in spaces with venetian blinds. Sol. Energy 2012, 86, 3109–3124. [Google Scholar] [CrossRef]
  30. Koo, S.Y.; Yeo, M.S.; Kim, K.W. Automated blind control to maximize the benefits of daylight in buildings. Build. Environ. 2010, 45, 1508–1520. [Google Scholar] [CrossRef]
  31. Kim, D.W.; Park, C.S. Comparative control strategies of exterior and interior blind systems. Light. Res. Technol. 2012, 44, 291–308. [Google Scholar] [CrossRef]
  32. Korean Standards Association. KS A 3011:1998, Recommended Levels of Illumination; Korean Standards Association: Seoul, Korea, 1998. [Google Scholar]
  33. Duffie, J.A.; Beckman, W.A. Solar Engineering of Thermal Processes, Fourth Edition; John Wiley & Sons, Inc.: Hoboken, NJ, USA, 2013; ISBN 9781118671603. [Google Scholar]
  34. Kim, J.H. Automatic Control Strategy of Venetian Blind for Improvement of Environmental Performance in Office Buildings. Ph.D. Thesis, Seoul National University, Seoul, Korea, 2007. [Google Scholar]
  35. Aurora Design Lab. Product. Available online: http://auroradesignlab.com/main/ko/sub03_01.html?type=1 (accessed on 13 May 2020).
  36. SOMFY. Owners manual: Somfy Animeo® IB+ Operating PC Software—English 2.1; SOMFY SAS: Cluses, France, 2006. [Google Scholar]
  37. KONICA MINLOTAL. Product. Available online: https://www.konicaminolta.co.kr/instruments/products/light/t10a/index. html (accessed on 13 May 2020).
  38. LUTRON ELECTRONIC. Solar Power Meter. Available online: http://www.sunwe.com.tw/lutron/SPM-1116SD.pdf (accessed on 13 May 2020).
  39. TES Electrical Electrronic Corp. Solar Power Meter. Available online: http://www.tes.com.tw/en/product_detail.asp?seq= 284 (accessed on 13 May 2020).
  40. Kim, C.H.; Kim, K.S. Development of Sky Luminance and Daylight Illuminance Prediction Methods for Lighting Energy Saving in Office Buildings. Energies 2019, 12, 592. [Google Scholar] [CrossRef] [Green Version]
Figure 1. Flow diagram of the methods in this study.
Energies 13 03238 g001
Figure 2. Concepts of the solar azimuth and altitude.
Energies 13 03238 g002
Figure 3. Concepts of the cut-off angle and profile angle.
Energies 13 03238 g003
Figure 4. Concept of vertical height control [33].
Energies 13 03238 g004
Figure 5. Full-scale mock-up overview and site images.
Energies 13 03238 g005
Figure 6. Full-scale mock-up drawings and experimental setup.
Energies 13 03238 g006
Figure 7. Blind diagrams and on-site installation images [40].
Energies 13 03238 g007
Figure 8. Blinds control configuration from company S.
Energies 13 03238 g008
Figure 9. Outdoor vertical Illuminance-based automatic blind control logic.
Energies 13 03238 g009
Figure 10. LED dimming schedule under no blinds and different sky models.
Energies 13 03238 g010
Figure 11. Calibration of the work plane illuminometers and LED photo sensor illuminometer.
Energies 13 03238 g011
Figure 12. Illuminance and dimming rate under dimming control with no blinds (clear sky_07.16). (a) Case 1-A-1, (b) Case 1-B-1, (c) Case 2-A-1, (d) Case 2-B-1, (e) Case 3-A-1, and (f) Case 3-B-1 in Table 5.
Energies 13 03238 g012
Figure 13. Illuminance and dimming rates under dimming control with no blinds (intermediate sky_07.24). (a) Case 1-A-2, (b) Case 1-B-2, (c) Case 2-A-2, (d) Case 2-B-2, (e) Case 3-A-2, and (f) Case 3-B-2 in Table 5.
Energies 13 03238 g013
Figure 14. Illuminance and dimming rate under dimming control with no blind (overcast sky_07.06). (a) Case 1-A-3, (b) Case 1-B-3, (c) Case 2-A-3, (d) Case 2-B-3, (e) Case 3-A-3, and (f) Case 3-B-3 in Table 5.
Energies 13 03238 g014
Figure 15. Introduction of direct sunlight to the work plane during measuring period #2 (09.08).
Energies 13 03238 g015
Figure 16. Illuminance and dimming rates under dimming controls integrated with manual blind control (Blind VP 100%, Slat angle 0°) (clear sky_09.24 and intermediate sky_09.28). (a) Case 4-A-1, (b) Case 4-B-1, (c) Case 4-A-2, and (d) Case 4-B-2 in Table 6.
Energies 13 03238 g016
Figure 17. Illuminance and dimming rates under dimming controls integrated with manual blind controls (Blind VP 100%, Slat angle 45°) (clear sky_09.09 and intermediate sky_09.12). (a) Case 5-A-1, (b) Case 5-B-1, (c) Case 5-A-2, and (d) Case 5-B-2 in Table 6.
Energies 13 03238 g017
Figure 18. Illuminance and dimming rate under dimming control integrated with manual blind control. (Blind VP 50%, Slat angle 0°). (clear sky_10.13 and intermediate sky_10.22). (a) Case 6-A-1, (b) Case 6-B-1, (c) Case 6-A-2, and (d) Case 6-B-2 in Table 6.
Energies 13 03238 g018
Figure 19. Illuminance and dimming rates under dimming controls integrated with manual blind controls. (Blind VP 50%, Slat angle 45°). (clear sky_9.25 and intermediate sky_09.17). (a) Case 7-A-1, (b) Case 7-B-1, (c) Case 7-A-2, and (d) Case 7-B-2 in Table 6.
Energies 13 03238 g019
Figure 20. Illuminance and dimming rates under dimming controls integrated with automatic blind control. (three steps, clear sky_10.03). (a) Case 8-A-1 and (b) Case 8-B-1 in Table 7.
Energies 13 03238 g020
Figure 21. Illuminance and dimming rate under dimming control integrated with automatic blind control. (four steps, clear sky_10.02). (a) Case 9-A-1 and (b) Case 9-B-1 in Table 7.
Energies 13 03238 g021
Figure 22. Illuminance and dimming rates under dimming controls integrated with automatic blind control. (intermediate sky_10.08). (a) Case 10-A-1 and (b) Case 10-B-1 in Table 7.
Energies 13 03238 g022
Figure 23. Average dimming rates of Zone A and Zone B by case under integrated blinds and dimming controls.
Energies 13 03238 g023
Table 1. Properties of experimental model.
Surface of Model.Area(m2)Reflection Rate (%)
Floor4820
Back Wall27.255
Right Side Wall20.455
Left Side Wall20.455
Ceiling4885
Front Wall (Top)14.755
Window12.55
Total178.7
Average54.1
Table 2. Characteristics of fluorescent lamps and LED lighting [35].
LampSize (mm)Activity Power (W)Luminous Flux (lm)Efficiency (lm/W) Color Temperature (K)Color Rendering Index (CRI)
Fluorescent Lamp1275 × 310 × 4064 W480075800070
LED Lamp1275 × 310 × 4535 W332595600080
Table 3. Measured parameters and sensor specifications [35,36,37,38,39].
DeviceParameterData ManagementRangeAccuracyShape
T-10MA (Konica Minolta) [37]Vertical Surface & Indoor IlluminanceUniversal Serial Bus (USB) cable with PC(0.01–299,900) lx
or
(0.001–29,990) fcd
±3~5% Energies 13 03238 i001
SPM-1116SD (Lutron Electronic) [38]Exterior Solar IrradiationSecure Digital (SD) Card with PC(0–2000) W/m2
or
(0–634) Btu/ft2
± 10 W/m2,
± 3 Btu/ft2
or ± 5%
Energies 13 03238 i002
TES-132 (TES Electronic) [39]Solar Transmission & IrradiationUSB cable and SD Card with PC(0–2000) W/m2
or
(0–634) Btu/ft2
± 10 W/m2,
± 3 Btu/ft2
or ± 5%
Energies 13 03238 i003
LED Control Program [35]LED dimming remote monitoring
and control system (Company A, Korea),
Dimming speed, Target illumination, Control mode management, LED channel and Pan ID address input
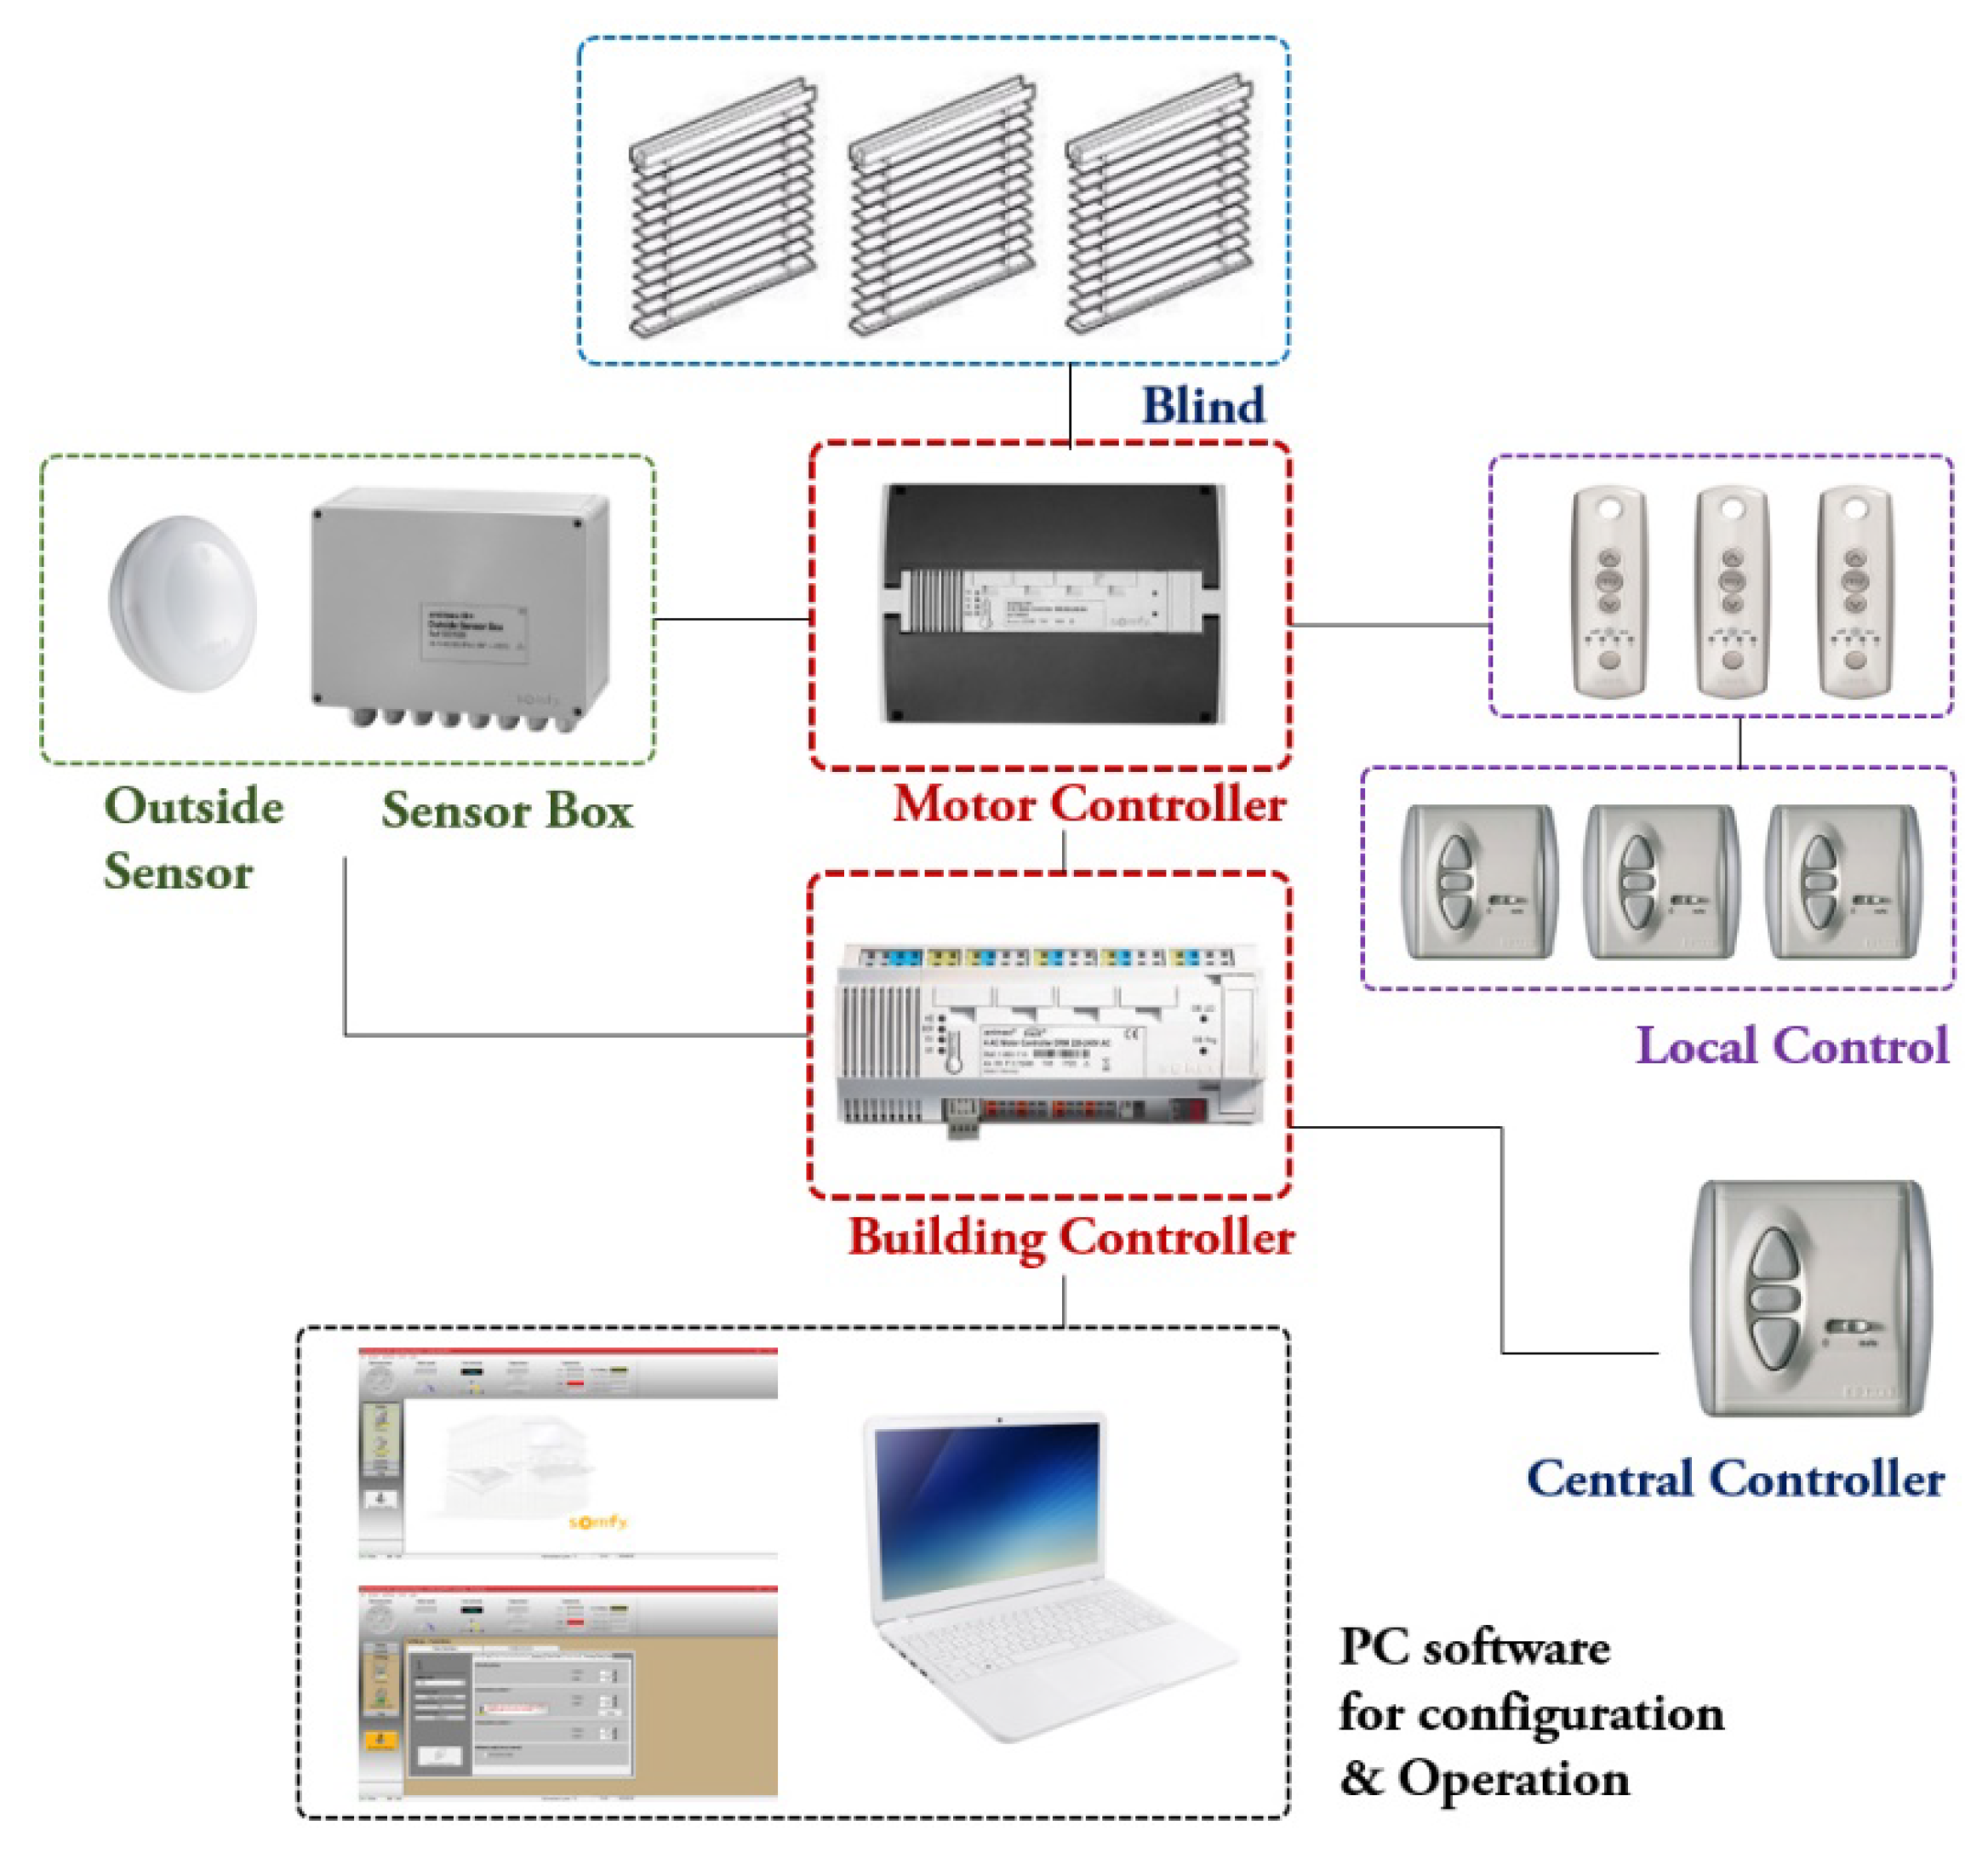
Energies 13 03238 i004
Blind Control Program [36]Animeo IB+ Operating Software (Company S, France),
Manual and automatic control mode selection,
Blind control criteria and control schedule management
Energies 13 03238 i005
Table 4. Characteristics of the blind.
Blind ConditionsExterior Blind
Slat Material and ColorAluminum Silver (A5754-H19)
Slat Width and Separation (mm)86
Slat Thickness (mm)2
Slat Conductivity (W/mk)221
Slat Beam Diffuse Solar Reflectance0.7
Slat Infrared Emissivity0.9
Blind to Glass Distance (mm)64
Table 5. LED dimming control case selection under no blind.
Zone AGlazing
Systems
LED Group A (Zone A)Zone BGlazing
Systems
LED Group B (Zone B)
LED #1LED #2LED #3LED #4LED #5LED #6
Case 1-A-1
(Clear Sky)
Low-E
Glass
+
No
Blind
Full Auto DimmingCase 1-B-1
(Clear Sky)
Low-E
Glass
+
No
Blind
Full Auto Dimming
Case 2-A-1
(Clear Sky)
Manual Dimming
(5 Times in 1 Day)
07:00, 09:00,
11:00, 13:00, 17:00
Case 2-B-1
(Clear Sky)
Manual Dimming
(5 Times in 1 Day)
07:00, 09:00,
11:00, 13:00, 17:00
Case 3-A-1
(Clear Sky)
Switch Control
12:00–17:00 (Off)
Case 3-B-1
(Clear Sky)
Switch Control
12:00–17:00 (Off)
Case 1-A-2
(Intermediate Sky)
Low-E
Glass
+
No
Blind
Full Auto DimmingCase 1-B-2
(Intermediate Sky)
Low-E
Glass
+
No
Blind
Full Auto Dimming
Case 2-A-2
(Intermediate Sky)
Manual Dimming
(5 Times in 1 Day)
07:00, 09:00,
11:00, 13:00, 17:00
Case 2-B-2
(Intermediate Sky)
Manual Dimming
(5 Times in 1 Day)
07:00, 09:00,
11:00, 13:00, 17:00
Case 3-A-2
(Intermediate Sky)
Switch Control
12:00–17:00 (Off)
Case 3-B-2
(Intermediate Sky)
Switch Control
12:00–17:00 (Off)
Case 1-A-3
(Overcast Sky)
Low-E
Glass
+
No
Blind
Full Auto DimmingCase 1-B-3
(Overcast Sky)
Low-E
Glass
+
No
Blind
Full Auto Dimming
Case 2-A-3
(Overcast Sky)
Manual Dimming
(5 Times in 1 Day)
07:00, 09:00,
11:00, 13:00, 17:00
Case 2-B-3
(Overcast Sky)
Manual Dimming
(5 Times in 1 Day)07:00, 09:00,
11:00, 13:00, 17:00
Case 3-A-3
(Overcast Sky)
Switch Control
12:00–17:00 (Off)
Case 3-B-3
(Overcast Sky)
Switch Control
12:00–17:00 (Off)
Table 6. Case selection for LED dimming control integrated with manual blind control.
Zone AGlazing & Blind Manual ControlLED Group A (Zone A)Zone BGlazing & Blind Manual ControlLED Group B (Zone B)
LED #1LED #2LED #3LED #4LED #5LED #6
Case 4-A-1
(Clear Sky)
Low-E
Glass
+
Blind
(100%, 0°)
Full Auto
Dimming
Case 4-B-1
(Clear Sky)
Low-E
Glass
+
Blind
(100%, 0°)
Full Auto
Dimming
Case 4-A-2
(Intermediate Sky)
Case 4-B-2
(Intermediate Sky)
Case 5-A-1
(Clear Sky)
Low-E
Glass
+
Blind
(100%, 45°)
Full Auto
Dimming
Case 5-B-1
(Clear Sky)
Low-E
Glass
+
Blind
(100%, 45°)
Full Auto
Dimming
Case 5-A-2
(Intermediate Sky)
Case 5-B-2
(Intermediate Sky)
Case 6-A-1
(Clear Sky)
Low-E
Glass
+
Blind
(50%, 0°)
Full Auto
Dimming
Case 6-B-1
(Clear Sky)
Low-E
Glass
+
Blind
(50%, 0°)
Full Auto
Dimming
Case 6-A-2
(Intermediate Sky)
Case 6-B-2
(Intermediate Sky)
Case 7-A-1
(Clear Sky)
Low-E
Glass
+
Blind
(50%, 45°)
Full Auto
Dimming
Case 7-B-1
(Clear Sky)
Low-E
+
Blind
(50%, 45°)
Full Auto
Dimming
Case 7-A-2
(Intermediate Sky)
Case 7-B-2
(Intermediate Sky)
Table 7. Case selection for LED dimming control integrated with automatic blind control.
Zone AGlazing & Blind Automated ControlLED Group A (Zone A)Zone BGlazing & Blind Automated ControlLED Group B (Zone B)
LED #1LED #2LED #3LED #4LED #5LED #6
Case 8-A-1
(Clear Sky)
Low-E
Glass
+
Blind
(three step automated control)
Full Auto
Dimming
Case 8-B-1
(Clear Sky)
Low-E
Glass
+
Blind
(three
step automated control)
Full Auto
Dimming
Case 9-A-1
(Clear Sky)
Low-E
Glass
+
Blind
(four
step automated control)
Full Auto
Dimming
Case 9-B-1
(Clear Sky)
Low-E
Glass
+
Blind
(four
step automated control)
Full Auto
Dimming
Case
10-A-1
(Intermediate Sky)
Low-E
Glass
+
Blind
(automated control)
Full Auto
Dimming
Case 10-B-1
(Intermediate Sky)
Low-E
Glass
+
Blind
(automated control)
Full Auto
Dimming
Table 8. Dimming rate for sky conditions with no blind (Avg.1: Case 1-A–2-A, Avg.2: Case 1-A–3-A).
Sky ConditionLED Group A (Zone A)LED Group B (Zone B)Total
Avg.1
Total
Avg.2
Case 1-ACase 2-ACase 3-AAvg.1Avg.2Case 1-BCase 2-BCase 3-BAvg.1Avg.2
Clear
Sky (1)
818342826957594258537061
Intermediate Sky (2)687042696050514251486054
Overcast Sky (3)575842575245464246445148
Avg.697042696041424251486054
Table 9. Dimming rate for sky conditions under manual blind control.
Blind VP and AngleSky ConditionCaseDimming Rate (%)CaseDimming Rate (%)Avg
100%, 0°
(4-A, B)
Clear Sky (1)Case 4-A-159Case 4-B-14451.5
Intermediate Sky (2)Case 4-A-250Case 4-B-23643
Avg54.54047.3
100%,45°
(5-A, B)
Clear Sky (1)Case 5-A-148Case 5-B-13742.5
Intermediate Sky (2)Case 5-A-243Case 5-B-23338
Avg45.53540.3
50%, 0°
(6-A, B)
Clear Sky (1)Case 6-A-164Case 6-B-14755.5
Intermediate Sky (2)Case 6-A-252Case 6-B-24046
Avg5843.550.8
50%, 45°
(7-A, B)
Clear Sky (1)Case 7-A-155Case 7-B-14047.5
Intermediate Sky (2)Case 7-A-248Case 7-B-23541.5
Avg51.537.544.5
Avg.52.43945.7
Table 10. Dimming rate for sky conditions under automatic blind control.
Blind
Control
Sky
Condition
CaseDimming Rate (%)CaseDimming Rate (%)Avg
Automated control
(3 step in clear sky)
Clear SkyCase 8-A-168Case 8-B-15059
Automated control
(4 step in clear sky)
Clear SkyCase 9-A-170Case 9-B-15242.5
Automated control
in intermediate sky
Intermediate SkyCase 10-A-161Case 10-B-14346
Avg.66.348.349.2

