Article

Systematic Investigation of Integrating Small Wind Turbines into Power Supply for Hydrocarbon Production

1
Department of Naval Architecture, Ocean and Marine Engineering, University of Strathclyde, Glasgow G4 0LZ, UK
2
James Watt School of Engineering, University of Glasgow, Glasgow G12 8QQ, UK
3
School of Mechanical Science and Engineering, Northeast Petroleum University, Daqing 163318, Heilongjiang, China
*
Authors to whom correspondence should be addressed.
Energies 2020, 13(12), 3243; https://doi.org/10.3390/en13123243
Submission received: 25 May 2020 / Revised: 12 June 2020 / Accepted: 20 June 2020 / Published: 23 June 2020
(This article belongs to the Section A: Sustainable Energy)

Abstract

:
In this paper, the technical and economic feasibility of integrating SWTs (Small Wind Turbines) into remote oil production sites are investigated. Compared to large turbines in onshore and offshore wind farms, SWTs are more suitable for individual power generations. A comprehensive approach based on wind energy assessment, wind power prediction, and economic analysis is then recommended, to evaluate how, where, and when small wind production recovery is achievable in oilfields. Firstly, wind resource in oilfields is critically assessed based on recorded meteorological data. Then, the wind power potential is numerically tested using specified wind turbines with density-corrected power curves. Later, estimations of annual costs and energy-saving are carried out before and after the installation of SWT via the LCOE (Levelized Cost of Electricity) and the EROI (Energy Return on Investment). The proposed methodology was tested against the Daqing oilfield, which is the largest onshore oilfield in China. The results suggested that over 80% of the original annual costs in oil production could be saved through the integrations between wind energy and oil production.

Graphical Abstract

1. Introduction

The oil and gas industry is not only one of the major energy suppliers, but also one of the largest customers in energy consumption. Petroleum companies [1] have realized that energy used in hydrocarbon operations has caused the increase of greenhouse gas emission, which should be minimized where possible [2]. The power supply in oil and gas extraction supports a wide range of activities, including driving pumps to produce fluids from subsurface and running turbines to generate electricity or heat for on-site operations. Mostly, the power consumed during hydrocarbon production is supplied by the nearby main grid. However, in certain scenarios, the main grid could not reach remote oil wells and operation sites. Furthermore, investments in building local grids are quite costly. Therefore, most operators choose to use diesel generator sets to supply power in remote hydrocarbon developments, which has low power efficiency and high air pollution.
Certain oil and gas wells have potential to use wind turbines as power sources, which could be used to develop more synergy between the two energy sectors. Potentials of harnessing wind energy [3,4,5] for powering oil and gas production have been identified in some studies. He et al. [6] recommended using a 20 MW offshore wind farm to power offshore platforms for reducing fuel gas consumption. Hu et al. [7] suggested to involve wind energy into isolated power systems of offshore oil platforms to lower operation and maintenance (O&M) costs as well as improve fuel saving. Haruni et al. [8] presented dynamic control strategies of an integrated wind-diesel-battery power supply system, which has the potential to be applied to offshore platforms. Stavrakais and Kariniotakis [9] introduced detailed dynamics equations to implement transient stability evaluation of stand-alone wind-diesel power system. Besides, there are other possibilities to integrate wind energy into fossil fuels production. For instance, Pierobon et al. [10] investigated the optimizations of offshore facilities through waste heat recovery, considering the organic Rankine cycle, the air bottoming cycle, and the steam Rankine cycle. Liu et al. [2] recommend recovering low-temperature waste heat from mature oil and gas reservoirs for future field developments. Additionally, Kazak et al. [11] investigated the decision-making process regarding how to select ideal installing locations for wind turbines. The authors showed a broad review of using spatial analysis and multi-criteria spatial decision support system to backing the renewable energy sector. However, there are few works of literature that mention the possibility to use Small Wind Turbines (SWTs) [12] for supporting onshore oil production.
SWTs are different in comparison with large turbines in onshore and offshore wind farms, which are more appropriate for individual power generations. Technically, there are several ways to define SWTs. One of the commonly used definition comes from the standardization body—the International Electrotechnical Commission (IEC). In the standard IEC 61400-2, SWTs should own a rotor swept area that is less than 200 m2, equivalent to a rated power of roughly 50 kW [13]. Besides, several national organizations have also identified their definitions of SWTs. The Canadian Wind Energy Association (CanWEA) described “small wind” as ranging from less than 1 kW up to 300 kW [14]. The National Renewable Energy Laboratory (NREL) defined the SWTs from the power capacity of 1 kW up to 100 kW [15]. The National Standards Authority of Ireland (NSAI) recognized wind turbines with a power capacity of less than 50 kW as SWTs [13]. American Wind Energy Association (AWEA) proposed to identify wind turbines with less than 100 kW capacity as SWTs [16]. World Wind Energy Association (WWEA) considered wind turbines with capacities of 6 W~300 kW as SWTs [17]. RenewableUK classified wind turbines into micro-wind (0–1.5 kW), small-wind (1.5–50 kW), and medium-wind (50–500 kW) [18]. All those definitions from different national organizations are summarized in Table 1. The endorsed definition, however, needs further analysis until a globally balanced agreement is achieved.
SWTs have reached a relatively mature phase in recent years. Bortolini et al. [19] assessed the economic performance of 10 commercial SWTs under the rated powers of 2.5~200 kW for major EU countries, considering their installations and operations. Tummala et al. [20] pointed out that large-scale wind farms could create a potential influence on the local climate and suggested that SWTs can be a more sustainable option.
In this study, a systematic investigation of integrating SWTs to hydrocarbon production was carried out through wind energy assessment, wind power prediction [21], and economic analysis. Initially, a completed one-year meteorological database was collected from the target oilfield. Then, the measured data of atmospheric pressure at sea level, roughness length, air temperatures and wind speeds were transported to a density correction wind power predictive model for evaluating wind power potentials. After that, the advantages of integrating wind power into oil productions are presented not only through energy return on investment (EROI) but also by levelized cost of electricity (LCOE). Daqing oilfield is selected as an example to test the proposed approach of using SWTs to support oil production. The annual electricity consumption of the entire field is nearly 3.6 billion kWh, where over 25% of them used in pumping operations. A site survey has reported that near half of these pumping units’ load utilization was below 70% [1]. Therefore, energy consumption reduction has become a significant issue that desperately needs to be solved in this oilfield.
This paper is organized as follows: Section 2 described how wind power was assessed for small wind energy systems. Section 3 presented the operating history of the target oilfield and its available wind energy potential. In Section 4, the used meteorological database was detailed introduced, including wind speed and wind direction distributions in a one-year horizon. In Section 5, the wind power model was developed along with the small wind turbine specification. Economic analysis was carried out through both EROI and LCOE in Section 6. Finally, conclusions were drawn in Section 7.

2. Methodology

It is significant to evaluate local wind resources for small wind energy systems to ensure its successful installation, operation, and overall performance. In this paper, the potential application of SWTs in remote oil wells is assessed, where an integrated approach is applied through collecting meteorological data, assessing wind resource, modelling wind power and analysing economic impacts. Wind potentials in the target oilfield are evaluated through critical resource assessment, which is significant for valuing annual wind power outputs. In general, wind resource assessment follows a few standard procedures, including site specification, evaluation of wind speed and direction, etc. [11]. Several previous investigations have claimed that the trends of wind speeds and direction variations are similar in different years [22,23,24,25]. Therefore, a completed one-year meteorological database was collected for this study.
Wind turbines generate powers by converting wind force on rotor blades into torque. The amount of generated powers varies with air density and wind speed at the target location as well as the size of the wind turbine itself. One of the most common methods to evaluate wind power outputs is to use specified power curves from commercial wind turbines. However, it is difficult to provide an accurate power curve to any locations. Air density on site is one of the impact factors that can influence the accuracy of power curves [26] and this parameter varies from one location to another. In reality, most of the wind turbine manufacturer used a compromise method, where the standard air density was applied to generate a standard power curve for a general-purpose [27]. In this paper, the measured atmospheric pressure, air temperatures, and wind speeds at the measuring height were first converted to their corresponding values at the hub height. These parameters were then further transported to a density correction model to generate a density-corrected power curve. Figure 1 presented the basic framework, indicating how to convert standard power curves to density-corrected ones.
Wind speeds at different heights could be calculated through the logarithmic wind profile law, which can be expressed as [28]:
v = v r e f l n ( z z 0 ) l n ( z r e f z 0 )
where v is the wind speed in m/s at the height of z in m; vref is the wind speed in m/s that is already known at the height of zref in m; z0 is roughness length in m at the current wind direction.
Temperatures were calculated by a linear gradient equation, varying 6.5 K per 1000 m. The equation can be expressed as [29]:
t h = t r e f 0.0065 ( z h z r e f )
where th is the temperature in K at the hub height of zh in m; tref is the reference temperature in K that is already known at the height of zref in m.
The air density at the hub height is derived from the following equation [29]:
ρ h = p h / ( R · t h )
p h = [ p r e f / 100 ( z h z r e f ) · 0.125 ] · 100
where ρh and ph are the air density in kg/m3 and the pressure in pascal at the hub height of zh; R is the specific gas constant of dry air, which is taken as 287.058 J/(kg⸱K); pref the pressure in pascal at the reference height of zref.
Then, standard wind speeds of the certificated power curve were converted to the density-corrected power curve. The used correlations can be presented as [29]:
v s = v p · ( ρ a / ρ h ) a
a = { 1 3 , v p 7.5   m / s 1 15 · v p 1 6 , 7.5   m / s < v p < 12.5   m / s 2 3 , v p 12.5   m / s
where vs is the density-corrected wind speed in m/s; vp is the standard wind speed marked in the certificated power curve from the manufacturer in m/s; ρa is the ambient density, which is taken as 1.225 kg/m3 in this study; ρh is the air density at the hub height under site conditions in kg/m3; a is an exponential constant that is related to standard wind speeds.

3. Target Oilfield

Daqing oil field, which is operated by China National Petroleum Corporation (CNPC), is one of the huge oilfields worldwide and the largest oilfield in China. The field covers a geographic area of more than 6000 km2. It was discovered in 1959 and made a tremendous contribution to the economic development of China [30]. Daqing oilfield plays a key role in the national energy supply security. In 1976, its annual oil production was over 50 million tons. Since then, this annual production record was kept for 27 years [31]. Since 1998, oil production was artificially reduced to maintain the field’s sustainable development. The peak production period has passed in Daqing and the declining phase has inevitably happened [32]. Currently, oil production has declined for years. However, it still supplies nearly one-fifth of the overall oil production in China. The oil production is maintained at a certain level through advanced Enhanced Oil Recovery (EOR) techniques, such as polymer flooding and water content control. The major grid of the oilfield is mainly supported by coal-fired power plants, producing a large number of environmental pollutions and harmful gases, such as CO, CO2, SO2, and NOx.
Besides its glorious history of oil and gas production, the Daqing area also has abundant wind resources. Geographically, Daqing city is located at the Heilongjiang province (see Figure 2, printed using the Global Wind Atlas online application owned by the Technical University of Denmark), neighbouring Inner Mongolia Autonomous Region, which is one of the most promising wind energy developing areas in China [33]. As is well known, mountains and other topographic features would have an essential impact on wind flows. Fortunately, Daqing city is positioned at the western part of the Songnen Plain, which makes the entire Daqing area relatively flat. The city also has abundant natural wetlands, which accounts for over 30% of the known wetland area in China, causing fewer surrounding trees. The city itself, which is officially established in 1979, is still young, causing fewer surrounding buildings. The wind power density map of the target area is displayed in Figure 2. As can be seen, most of wind power densities at the Daqing area are higher than 300 W/m2 at a height of 100 m, indicating considerable energy can be potentially converted at sites through wind turbines.

4. Meteorological Data

Wind data were collected from a database measured by a fixed weather station in Daqing, supplied by the National Oceanic and Atmospheric Administration (NOAA) [34]. The data points were collected daily from 1956 to the most current year (2019), including parameters like atmospheric pressure at sea level, air temperature, and wind speed and direction angle at a height of 1.5 m. The completed one-year database from the measuring year of 2018 was extracted, where the data points were collected every three hours from 01/01/2018 to 31/12/2018, indicating there were seven measuring points per day. In total, 2480 data groups were recorded, containing 54 missing groups and 2426 effective groups. To keep the internal consistency of the database, the missing records were replaced by the mean value of the measuring day.
The one-year meteorological data (from 01/01/2018 to 31/12/2018) was used as inputs in the wind power modeling. The input data of 01/04/2018 are summarized in Table 2 as an example.
Besides, the roughness length z0 (see Equation (1)) is physically significant to wind speed calculation as it represents the height at which the wind speed theoretically equals to zero. This parameter is naturally related to terrain roughness elements, such as open sea, snow, grass, crops, artificial obstacles, etc. Its value varies from 0.0002 m~0.0003 m (for calm sea) to 1 m~4 m (city) [35]. Based on Daqing oilfield’s characteristics, the value of roughness length is selected as 0.15 m to indicate a flat area with fewer surrounding buildings and trees.

4.1. Wind Rose

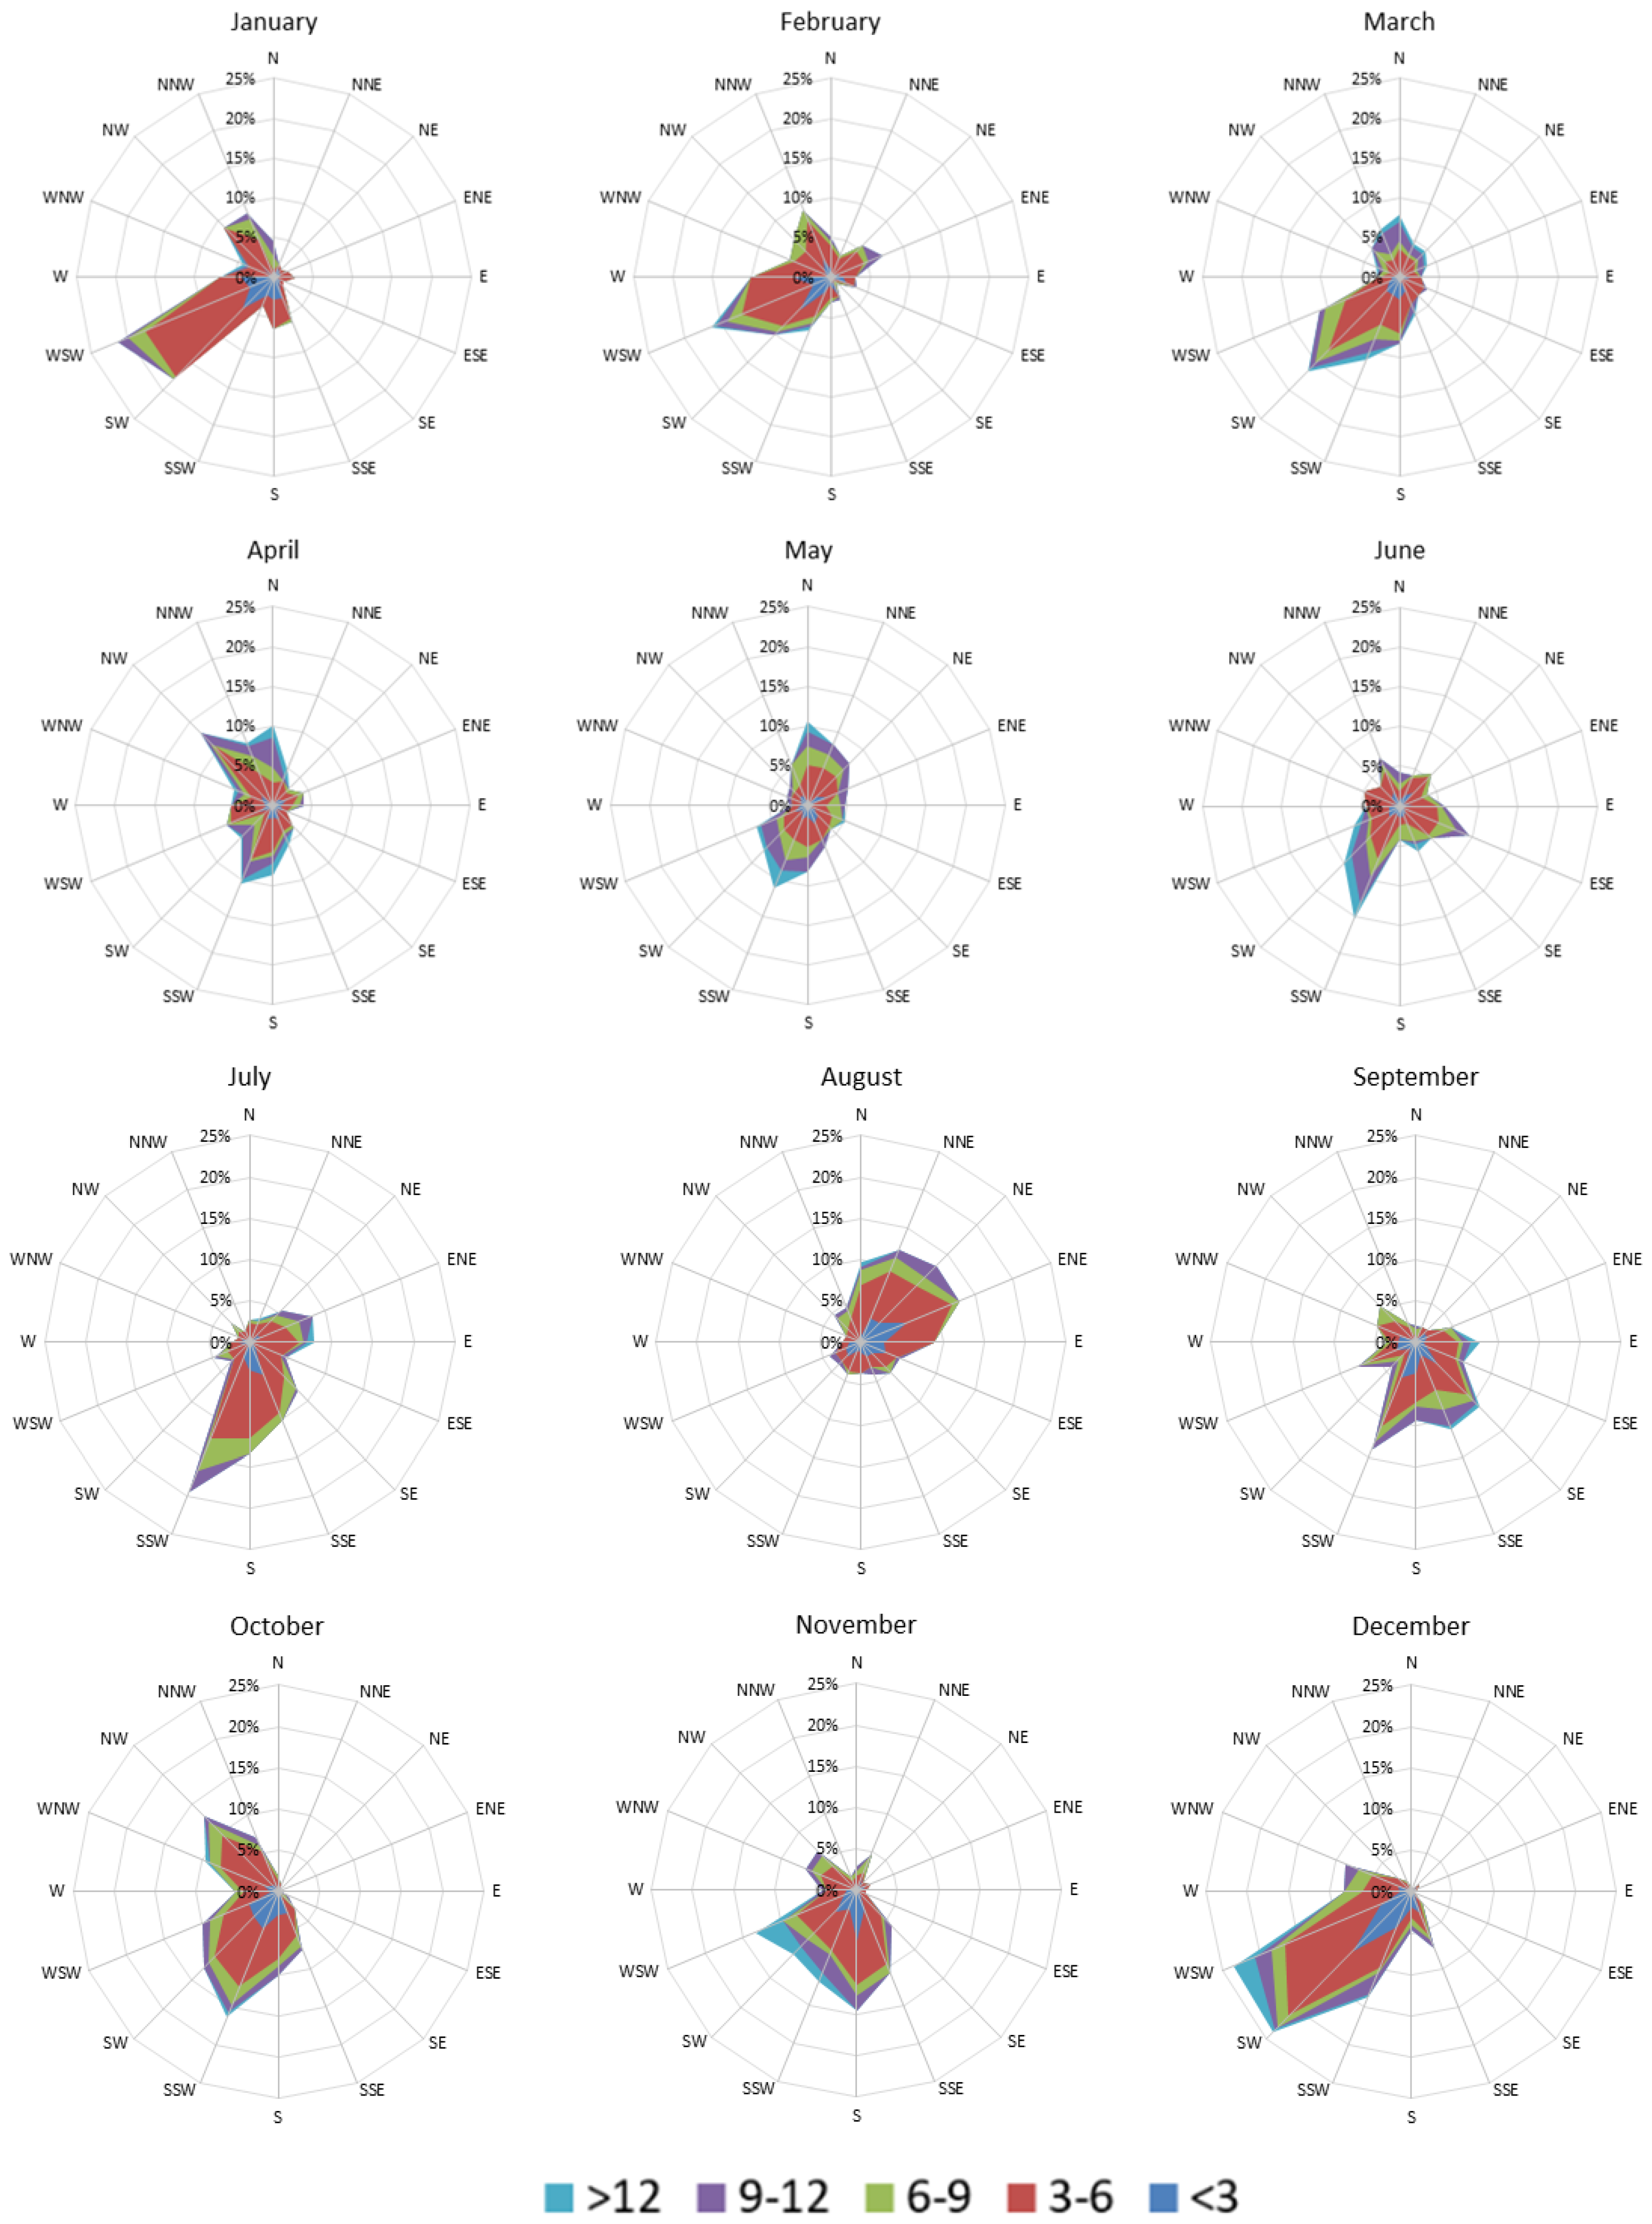
In this study, monthly wind roses at a height of 10 m are used to present the average wind speed and wind direction distributions in the Daqing area (see Figure 3). The most common wind speeds are between 3~9 m/s over the year of 2018. Wind direction is defined through the direction where the wind originates. Based on our database, wind directions are varying in different seasons of the year. In winter (from December to February), the predominant wind direction is located at the WSW~SW sector. In spring (from March to May), the most frequent wind directions occurred at the SW~SSW and N sector. In summer (from June to August), the dominant wind direction varies from SSW in June~July to NE in August. In autumn (from September to November), the dominative wind directions appear to be located in the SSW sector. The wind direction slightly alternates in winter and summer. Over the entire year, the wind direction has the most frequent occurrence of the WSW–SSW sector. The wind direction is relatively stable, which is beneficial to the layout of wind turbines.

4.2. Wind Speeds

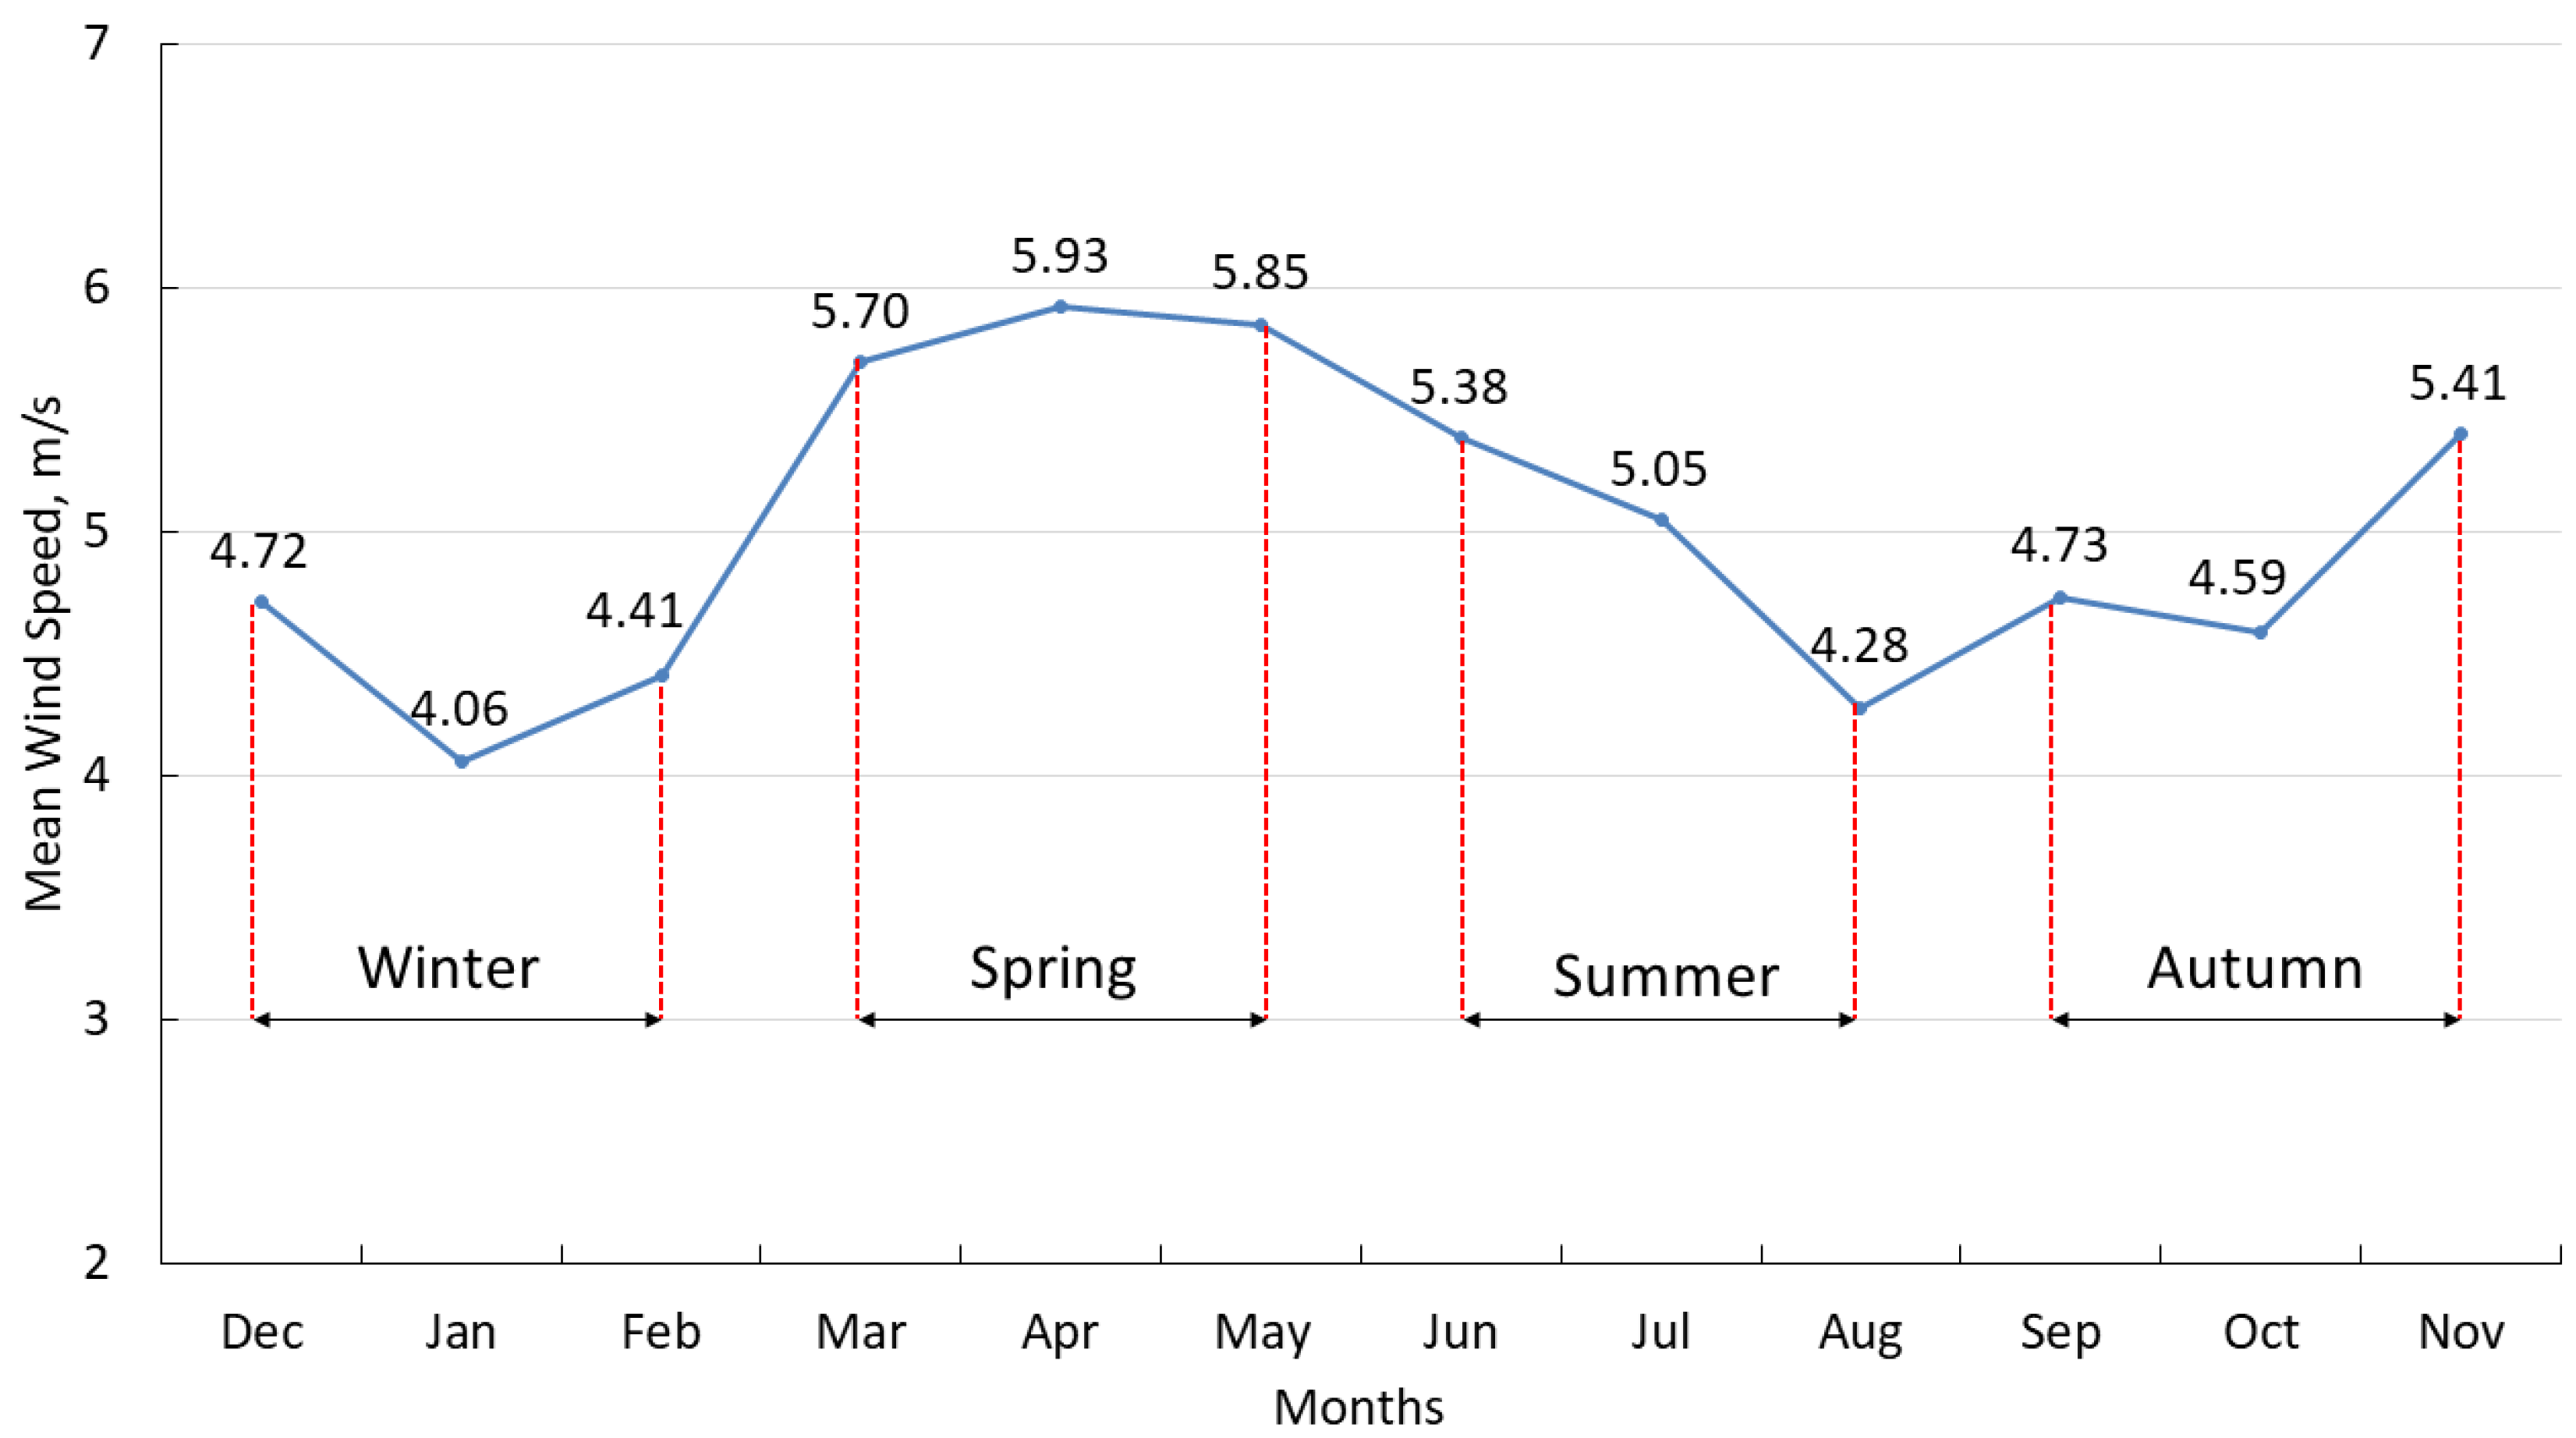
The monthly mean wind speeds were presented in Figure 4 to display the availability of wind resources in different seasons. Spring owns the highest mean wind speed among the four seasons, indicating the most abundant wind energy occurs at this period of the year. This trend happens to have the same point of view with the conclusion from Li et al. [25], where the authors claimed that the windiest season in northeast China is spring. The maximum mean wind speed raised in the middle of spring with a value of 5.93 m/s, while the minimum wind speed value of 4.06 m/s appeared in January. The histogram of the one-year wind data is presented in Figure 5, displaying the counts of wind speeds under different intervals. The annual mean wind speed is around 5.00 m/s with a standard deviation of 2.92 m/s.

5. Wind Power Modeling

In this study, the library “windpowerlib” is applied to build a wind power model in a Python 3 environment (Python 3.7, Python Software Foundation License), which provides a series of classes and functions to calculate power outputs of wind turbines/farms [36,37]. The corresponding methodology used to calculate wind power has been detailed introduced in Section 2, which takes time-series meteorological data as inputs while generating wind power as outputs. To accurately predict annual wind power outputs, air density variations on-site in the Daqing oilfield is involved in the simulation to correct the standard power curve from the manufacturer. The prediction of wind power is based on meteorological data in a certain time series and the selected wind turbine type [38,39,40].

5.1. Wind Turbine Specification

As no utility is available on remote sites, an off-grid SWT is highly recommended. The commercial off-grid wind turbine H19.2-100KW was considered as an example to evaluate wind power outputs in the Daqing oilfield, manufactured by Anhui Hummer Dynamo Co., Ltd (Anhui, China). [41]. The SWT is a horizontal, upwind wind turbine with three blades. It has a rotor diameter of about 20.8 m with a swept area of 339.80 m2, driven by direct drive with no gearbox. The hub height is 18 m. The specifications of the wind turbine are presented in Table 3. The input parameters, which were required for wind turbine initialization in the modeling effort, include rated power, hub height, rotor diameter, and the certificated power curve from the manufacturer. The power curve of the H19.2-100KW SWT is illustrated in Figure 6.

5.2. Modelling Outputs

The monthly electrical outputs of the selected off-grid wind turbine are present in Figure 7 to display potential power generations in different seasons. The general trend of electrical outputs follows the variations of mean wind speeds in Figure 4. The major monthly energy outputs came from the spring because of the highest wind speeds, where electrical generations of March, April, and May are all higher than 30 MWh. The maximum electrical output raised at the end of spring with a value of 34.99 MWh, while the minimum output of 21.21 MWh appeared in January. The annual energy output is 323.29 MWh in total.
The wind power rose is presented in Figure 8, which is consistent with the wind rose in Figure 3. The WSW–SSW sector offered the major power generation, where winds have the most frequent occurrence. The generated wind powers ranging in 20~80 kW were dominant over most of the time in 2018.

6. Economic Analysis

A remote single-well oil production station, which is far away from major grids in the Daqing field, was selected as the target to carry out the economic analysis. Currently, a diesel generator with an installed power of 90 kW is used for this single-well site. The generated power was supplied to operations of one beam-pumping unit as well as lighting and heating of a one-wellhead duty house. According to the on-site records, the effective power of the diesel generator is only 45% of the installed power. Therefore, under the consideration of 10% downtime, the annual required power is around 319.3 MWh for supporting the operation of the remote single-well oil production station.

6.1. Current Annual Cost of Diesel Generator

The daily diesel consumptions are around 220 L. The most current diesel price is 1.01 USD/L in China [42]. Hence, the daily cost of diesel fuel is about 222.2 USD. The annual cost of the diesel generator is about 8.11 × 10⁴ USD without further considerations of O&M costs.

6.2. Annual Cost of Small Wind Turbines (SWT)

The LCOE is used to calculate the annual cost of the selected SWT, which can be expressed as [25,43,44]:
L C O E = 1 A E O   P r C s ( 1 + C v ) n   ( 1 + M [ ( 1 + I c ) n 1 I c ( 1 + I c ) n ] )
where AEO is the annual energy output of the target wind turbine in kWh; Pr is the rated power in kW; Cs is the special cost in USD/kW; Cv is the variable capital cost; M is the variable O&M cost; n is the lifespan of the selected SWT; Ic is the interest rate of the located country.
In this case study, the annual energy output of the selected SWT is 3.23 × 10⁵ kWh with a rated power of 100 kW. Considering the size of the target wind turbine, the special cost is selected as 2000/kW (see Table 4). The variable capital cost is taken as 20% based on the small size of the turbine [45]. The variable O&M cost is set as 3.5% [44]. The lifetime of the SWT is defined as 20 years [46]. The latest interest rate in China is 4.35% [47]. Therefore, the LCOE of the identified SWT is around 0.044 USD/kWh. The annual cost of the target SWT is 1.75 × 10⁴ USD, which is less than one-fifth of costs in the diesel generator case.
For oilfield operators, continuous production is treated as the priority. Since the beam-pumping unit must be kept in uninterrupted operation, power needs to be supplied 24 h a day, with the exception of maintenance. Therefore, high power supply stability is required for any remote stations. It is recommended to still maintain the diesel generator on-site as a back-up. Wind power is preferentially used in this study. When the wind turbine suffers from failure or the stored energy is used up, the insufficient part will be supplemented by the diesel generator in time to maximize the continuity of power supply and overcome the shortcomings of independent operation of wind turbines.

6.3. Energy Return on Investment (EROI)

In this section, an evaluation between energy supply and demand in the remote single-well oil production station was carried out based on EROI, which is a ratio of the amount of delivered energy to the amount of energy required to obtain that energy [32]. In theory, the EROI can be described as:
E R O I = E n e r g y   D e l i v e r e d E n e r g y   R e q u i r e d   t o   D e l i v e r   t h a t   E n e r g y
Therefore, the EROIwind for wind power production can be written as:
E R O I w i n d = W i n d   E n e r g y   D e l i v e r e d E n e r g y   R e q u i r e d   t o   D e l i v e r   W i n d   E n e r g y
Correspondingly, the EROIoil for oil extraction can be expressed as:
E R O I o i l = O i l   E n e r g y   D e l i v e r e d E n e r g y   R e q u i r e d   t o   D e l i v e r   O i l   E n e r g y
In our study, it is assumed that all the delivered wind energy was used as an energy source for oil extraction. Thus:
W i n d   E n e r g y   D e l i v e r e d = E n e r g y   R e q u i r e d   t o   D e l i v e r   F o s s i l e   F u e l s   E n e r g y
Therefore, the final EROItotal for the single-well case can be written as:
E R O I t o t a l = E R O I w i n d × E R O I o i l = O i l   E n e r g y   D e l i v e r e d E n e r g y   R e q u i r e d   t o   D e l i v e r   W i n d   E n e r g y
Hu et al. [32] systematically investigated the forecasting of EROI for Daqing oilfield based on its historic production data. The authors derived the initial EROI (see back curves in Figure 9) based on existing field data from crude oil and natural gas production. After that, the obtained EROI was further extended for future forecasting (see blue curves in Figure 9) through quality-corrected heat equivalents. It was concluded that the net energy production of the Daqing oilfield would continue to decrease noticeably. As displayed in Figure 9, the black curve is representing the historic EROI in the Daqing oilfield while the blue curve is characterising the predictive values of EROI. Based on the linear regression equation of the blue curve, the EROIoil of the year 2018 is around 5.07 in the Daqing oilfield.
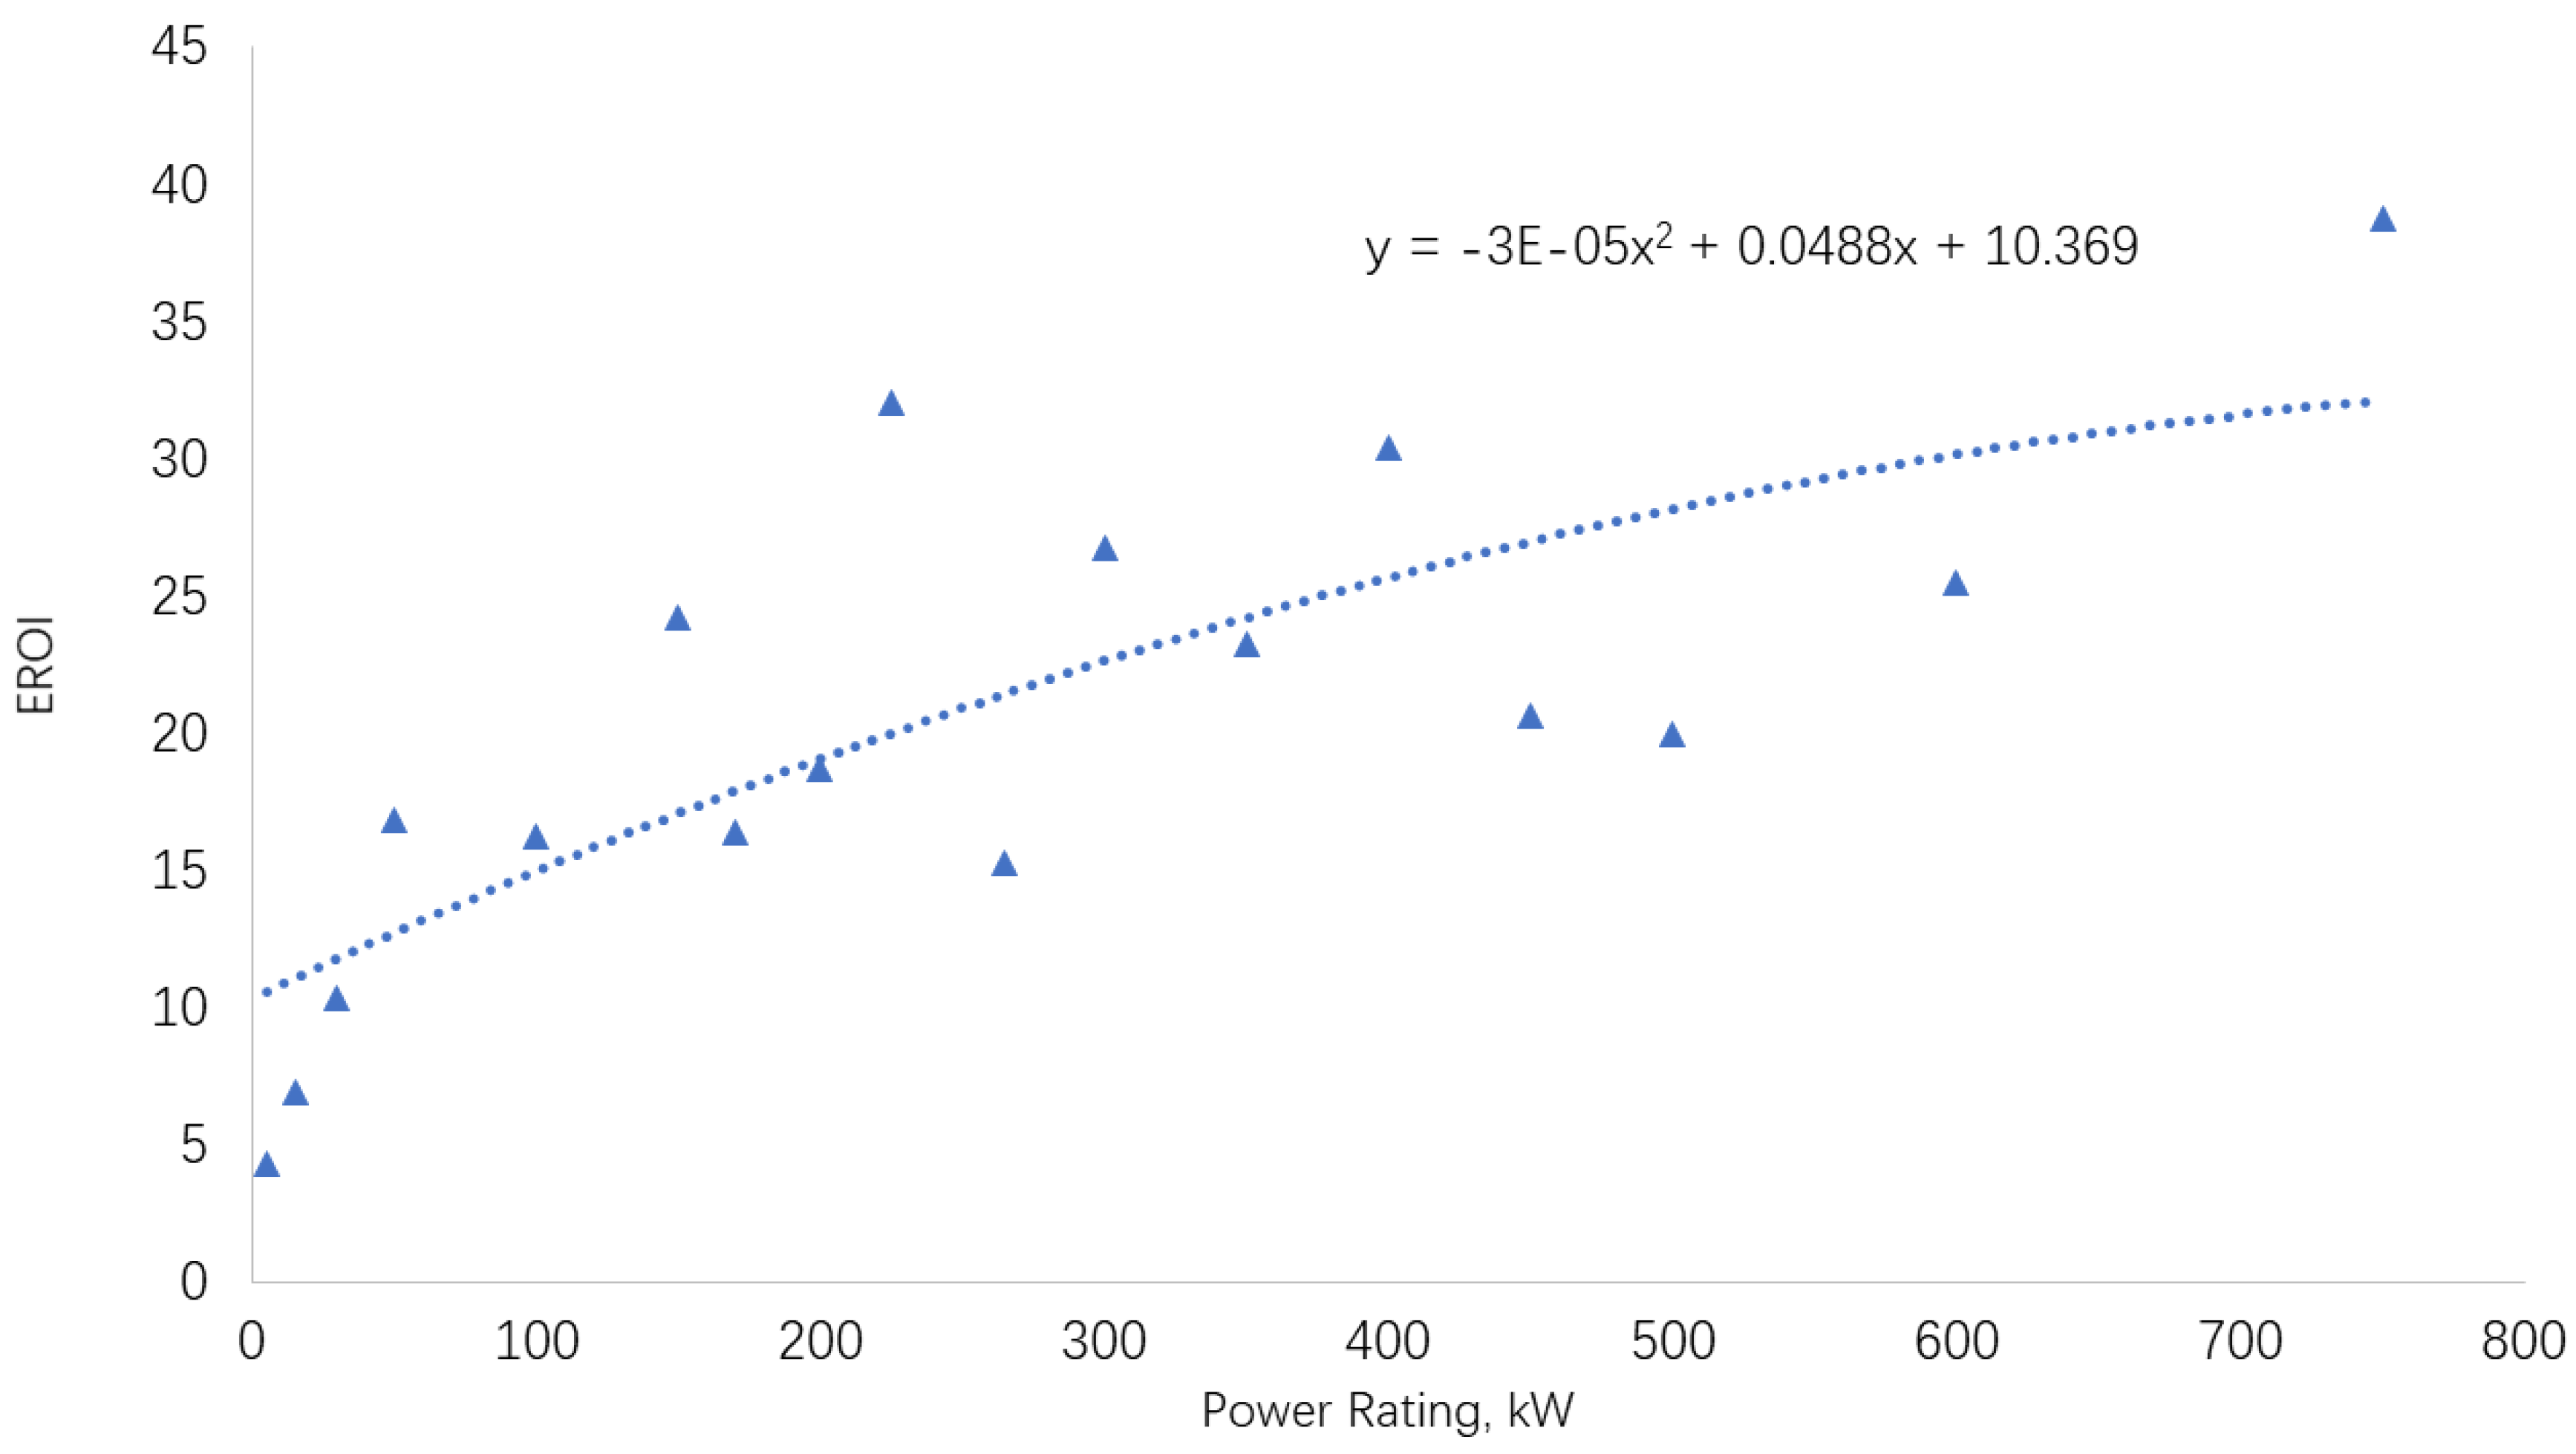
Kubiszewski et al. [48] assessed around 119 wind turbines from 50 different studies to investigate the EROI of wind energy based on a wide literature review. The correlations between the average EROI and the power rating of wind turbines are presented in Figure 10. According to this study, the EROI of a wind turbine with a rated power of 100 kW is about 16.
In summary, based on Equation (12), the EROItotal of the single-well oil production station is around 16 × 5.07 = 81.12 after the integration with small wind turbines, which is much higher than the original predicted EROI of 5.07.

7. Conclusions

An efficient methodology for integrating SWTs into oil production has been presented, using Daqing oilfield as a case study. Wind power generation of the specified SWT was predicted under the consideration of a density-corrected power curve. Wind power predictive results indicated that wind energy could supply sufficient powers to support remote wells’ hydrocarbon production by replacing the originally installed diesel generators. The proposed methodology is general in this study and can be applied to other similar studies to facilitate wind power integration in hydrocarbon production.
Through the case study in Daqing oilfield, wind potentials have been assessed through a one-year meteorological database collected from 01/01/2018 to 31/12/2018. The annual wind power output is around 323.29 MWh, which could cover the 319.3 MWh power requirements of the remote site. Economic analysis indicated that at least 80% annual costs of power generation could be saved through the installation of wind turbines. Besides, an evaluation between energy supply and demand in the remote single-well oil production station was investigated based on EROI, where the values of EROI can be increased from 5.07 to 81.12.

Author Contributions

Conceptualization, X.L. and Z.L.; methodology, Z.L.; investigation, X.L. and Z.L.; writing—original draft preparation, X.L. and Z.L.; writing—review and editing, X.L., Z.L. and Z.F.; supervision, X.L. and Z.F.; software, Z.L.; data curation, Z.F. All authors have read and agreed to the published version of the manuscript.

Funding

This research was funded by the EPSRC Doctoral Training Partnership (EP/R513222/1). This investigation was also supported by Natural Science Foundation of Heilongjiang province (No.LH2019E018) and Natural Science Foundation of China (No.51774091).

Conflicts of Interest

The authors declare no conflict of interest.

Nomenclature

aExponential constant that is related to standard wind speeds
CsSpecial cost
CvVariable capital cost
IcInterest rate
MVariable O&M cost
nLifespan of the selected SWT
pPressure
PrRated power
RSpecific gas constant of dry air
tTemperature
vWind speed
zHeight
ρAir density
Abbreviation
AEOAnnual Energy Output
AWEAAmerican Wind Energy Association
CanWEACanadian Wind Energy Association
CNPCChina National Petroleum Corporation
EOREnhanced Oil Recovery
EROIEnergy Return On Investment
IECInternational Electrotechnical Commission
LCOELevelized Cost Of Electricity
NOAANational Oceanic and Atmospheric Administration
NRELNational Renewable Energy Laboratory
NSAINational Standards Authority of Ireland
O&MOperation and Maintenance
SWTsSmall Wind Turbines
WWEAWorld Wind Energy Association

References

  1. Feng, Z.M.; Tan, J.J.; Li, Q.; Fang, X. A review of beam pumping energy-saving technologies. J. Pet. Explor. Prod. Technol. 2018, 8, 299–311. [Google Scholar] [CrossRef] [Green Version]
  2. Liu, X.; Falcone, G.; Alimonti, C. A systematic study of harnessing low-temperature geothermal energy from oil and gas reservoirs. Energy 2018, 142, 346–355. [Google Scholar] [CrossRef] [Green Version]
  3. Lin, Z.; Liu, X. Wind power forecasting of an offshore wind turbine based on high-frequency SCADA data and deep learning neural network. Energy 2020. [Google Scholar] [CrossRef]
  4. Lin, Z.; Liu, X. Assessment of wind turbine aero-hydro-servo-elastic modelling on the effects of mooring line tension via deep learning. Energies 2020, 13, 2264. [Google Scholar] [CrossRef]
  5. Lin, Z.; Sayer, P. An enhanced stiffness model for elastic lines and its application to the analysis of a moored floating offshore wind turbine. Ocean Eng. 2015, 109, 444–453. [Google Scholar] [CrossRef] [Green Version]
  6. He, W.; Jacobsen, G.; Anderson, T.; Olsen, F.; Hanson, T.D.; Korpås, M.; Toftevaag, T.; Eek, J.; Uhlen, K.; Johansson, E. The Potential of Integrating Wind Power with Offshore Oil and Gas Platforms. Wind Eng. 2010, 34, 125–137. [Google Scholar] [CrossRef]
  7. Hu, D.; Zhao, X.; Cai, X.; Wang, J. Impact of wind power on distribution system reliability. In Proceedings of the 2008 Third International Conference on Electric Utility Deregulation and Restructuring and Power Technologies, Nanjing, China, 6–9 April 2008. [Google Scholar]
  8. Haruni, A.M.O.; Gargoom, A.; Haque, M.E.; Negnevitsky, M. Dynamic operation and control of a hybrid wind-diesel stand alone power systems. In Proceedings of the 2010 Twenty-Fifth Annual IEEE Applied Power Electronics Conference and Exposition—APEC, Palm Springs, CA, USA, 21–25 February 2010; pp. 162–169. [Google Scholar]
  9. Kariniotakis, G.N.; Stavrakakis, G.S. A General Simulation Algorithm For The Accurate Assessment Of Isolated Diesel—Wind Turbines Systems Interaction, PART 2. IEEE Trans. Energy Convers. 1995, 10, 584–590. [Google Scholar] [CrossRef]
  10. Pierobon, L.; Benato, A.; Scolari, E.; Haglind, F.; Stoppato, A. Waste heat recovery technologies for offshore platforms. Appl. Energy 2014, 136, 228–241. [Google Scholar] [CrossRef] [Green Version]
  11. Kazak, J.; Van Hoof, J.; Szewranski, S. Challenges in the wind turbines location process in Central Europe—The use of spatial decision support systems. Renew. Sustain. Energy Rev. 2017, 76, 425–433. [Google Scholar] [CrossRef]
  12. Bugała, A.; Roszyk, O. Investigation of an Innovative Rotor Modification for a Small-Scale Horizontal Axis Wind Turbine. Energies 2020, 13, 2649. [Google Scholar] [CrossRef]
  13. NSAI Standards. Wind Turbines—Part 2: Small Wind Turbines; Irish Standard: Santry, Ireland, 2014.
  14. Canadian Wind Energy Association. Small Wind Turbine Purchasing Guide (Off-grid, Residential, Darm & Small Business Applications); CANWEA: Ottawa, ON, Canada, 2015. [Google Scholar]
  15. Olsen, T.; Preus, R. Small Wind Site Assessment Guidelines; NREL: Golden, CO, USA, 2015.
  16. American Wind Energy Association. Basics of Wind Energy. Available online: https://www.awea.org/wind-101/basics-of-wind-energy (accessed on 18 March 2019).
  17. Pitteloud, J.-D.; Gsanger, S. Small Wind World Report. WWEA: Bonn, Germany, 2017. [Google Scholar]
  18. Renewables UK Wind Energy. Available online: https://www.renewableuk.com/page/WindEnergy (accessed on 7 May 2019).
  19. Bortolini, M.; Gamberi, M.; Graziani, A.; Manzini, R.; Pilati, F. Performance and viability analysis of small wind turbines in the European Union. Renew. Energy 2014, 62, 629–639. [Google Scholar] [CrossRef]
  20. Tummala, A.; Kishore, R.; Kumar, D.; Indraja, V.; Krishna, V.H. A review on small scale wind turbines. Renew. Sustain. Energy Rev. 2016, 56, 1351–1371. [Google Scholar] [CrossRef]
  21. Lin, Z.; Liu, X.; Collu, M. Wind power prediction based on high-frequency SCADA data along with isolation forest and deep learning neural networks. Int. J. Electr. Power Energy Syst. 2020, 118, 105835. [Google Scholar] [CrossRef]
  22. Shu, Z.R.; Li, Q.S.; Chan, P.W. Investigation of offshore wind energy potential in Hong Kong based on Weibull distribution function. Appl. Energy 2015, 156, 362–373. [Google Scholar] [CrossRef]
  23. Shu, Z.R.; Li, Q.S.; Chan, P.W. Statistical analysis of wind characteristics and wind energy potential in Hong Kong. Energy Convers. Manag. 2015, 101, 644–657. [Google Scholar] [CrossRef]
  24. Li, M.; Li, X. Investigation of wind characteristics and assessment of wind energy potential for Waterloo region, Canada. Energy Convers. Manag. 2005, 46, 3014–3033. [Google Scholar] [CrossRef]
  25. Li, Y.; Wu, X.; Li, Q.; Tee, K.F. Assessment of onshore wind energy potential under different geographical climate conditions in China. Energy 2018, 152, 498–511. [Google Scholar] [CrossRef]
  26. Jung, C.; Schindler, D. The role of air density in wind energy assessment—A case study from Germany. Energy 2019, 171, 385–392. [Google Scholar] [CrossRef]
  27. Lasse Svenningsen Power Curve Air Density Correction And Other Power Curve Options. In WindPRO; EMD International A/S: Aalborg, Denmark, 2010.
  28. Banuelos-Ruedas, F.; Angeles-Camacho, C.; Rios-Marcuello, S. Analysis and validation of the methodology used in the extrapolation of wind speed data at different heights. Renew. Sustain. Energy Rev. 2010, 14, 2383–2391. [Google Scholar] [CrossRef]
  29. Oemof Developer Group. Windpowerlib Documentation; Oemof Developer Group: Flensburg, Germany, 2019. [Google Scholar]
  30. Tang, X.; Zhang, B.; Höök, M.; Feng, L. Forecast of oil reserves and production in Daqing oilfield of China. Energy 2010, 35, 3097–3102. [Google Scholar] [CrossRef] [Green Version]
  31. Xu, B.; Feng, L.; Wei, W.X.; Hu, Y.; Wang, J. A preliminary forecast of the production status of China’s daqing oil field from the perspective of EROI. Sustainability 2014, 6, 8262–8282. [Google Scholar] [CrossRef] [Green Version]
  32. Hu, Y.; Feng, L.; Hall, C.C.S.; Tian, D. Analysis of the energy return on investment (EROI) of the huge daqing oil field in China. Sustainability 2011, 3, 2323–2338. [Google Scholar] [CrossRef] [Green Version]
  33. Lee Kwan, C. The Inner Mongolia Autonomous Region: A major role in China’s renewable energy future. Util. Policy 2010, 18, 46–52. [Google Scholar] [CrossRef]
  34. National Oceanic and Atmospheric Administration NCEI Map Viewer. Available online: https://gis.ncdc.noaa.gov/maps/ncei#app=clim&cfg=cdo&theme=hourly&layers=1&node=gis (accessed on 8 May 2019).
  35. Infield, D. Chapter 15—Wind Energy. In Future Energy, 2nd ed.; Letcher, T.M., Ed.; Elsevier: Boston, MA, USA, 2014; pp. 313–333. ISBN 978-0-08-099424-6. [Google Scholar]
  36. Haas, S.; Schachler, B.; Krien, U.; Bosch, S. Windpowerlib: A Python Library to Model Wind Power Plants (v0.1.1); Oemof Developer Group: Flensburg, Germany, 2019. [Google Scholar]
  37. Hilpert, S.; Kaldemeyer, C.; Krien, U.; Günther, S.; Wingenbach, C.; Plessmann, G. The Open Energy Modelling Framework (oemof)—A new approach to facilitate open science in energy system modelling. Energy Strategy Rev. 2018, 22, 16–25. [Google Scholar] [CrossRef] [Green Version]
  38. Liu, J.; Duepmeier, C.; Hagenmeyer, V. A New Concept of a Generic Co-Simulation Platform for Energy Systems Modeling. In Proceedings of the Future Technologies Conference (FTC), Pan Pacific Hotel Vancouver, BC, Canada, 29–30 November 2017. [Google Scholar]
  39. Sherry, M.; Rival, D. Meteorological phenomena associated with wind-power ramps downwind of mountainous terrain. J. Renew. Sustain. Energy 2015, 7, 033101. [Google Scholar] [CrossRef] [Green Version]
  40. Che, Y.; Xiao, F. An integrated wind-forecast system based on the weather research and forecasting model, Kalman filter, and data assimilation with nacelle-wind observation. J. Renew. Sustain. Energy 2016, 8, 053308. [Google Scholar] [CrossRef]
  41. Anhui Hummer Dynamo Co., Ltd. H19.2-100KW Off Grid Wind Turbine. Available online: http://www.allwindturbine.com/products_info/H19-2-100KW-Off-Grid-Wind-Turbine-230240.html (accessed on 30 April 2019).
  42. Global Petrol Prices China Diesel Prices. Available online: https://www.globalpetrolprices.com/China/diesel_prices/ (accessed on 2 May 2019).
  43. Adaramola, M.S.; Paul, S.S.; Oyedepo, S.O. Assessment of electricity generation and energy cost of wind energy conversion systems in north-central Nigeria. Energy Convers. Manag. 2011, 52, 3363–3368. [Google Scholar] [CrossRef]
  44. Sathyajith, M. Wind Energy: Fundamentals, Resource Analysis and Economics; Springer: Berlin, Germany, 2006. [Google Scholar]
  45. International Renewable Energy Agency. Renewable Energy Technologies: Cost Analysis Series—Wind Power; IRENA: Bonn, Germany, 2012. [Google Scholar]
  46. Ziegler, L.; Gonzalez, E.; Rubert, T.; Smolka, U.; Melero, J.J. Lifetime extension of onshore wind turbines: A review covering Germany, Spain, Denmark, and the UK. Renew. Sustain. Energy Rev. 2018, 82, 1261–1271. [Google Scholar] [CrossRef] [Green Version]
  47. Trading Economics China Interest Rate. Available online: https://tradingeconomics.com/china/interest-rate (accessed on 1 May 2019).
  48. Kubiszewski, I.; Cleveland, C.J.; Endres, P.K. Meta-analysis of net energy return for wind power systems. Renew. Energy 2010, 35, 218–225. [Google Scholar] [CrossRef]
Figure 1. Scheme of generating density-corrected power curve.
Energies 13 03243 g001
Figure 2. Wind power density map of Heilongjiang province in China.
Energies 13 03243 g002
Figure 3. Monthly wind rose.
Energies 13 03243 g003
Figure 4. Monthly mean wind speeds of seasons.
Energies 13 03243 g004
Figure 5. Histogram of wind speeds.
Energies 13 03243 g005
Figure 6. Power curve of the selected off-grid wind turbine.
Energies 13 03243 g006
Figure 7. Monthly electrical outputs of seasons.
Energies 13 03243 g007
Figure 8. Wind power rose of the year 2018.
Energies 13 03243 g008
Figure 9. History and forecast of energy return on investment (EROI) in Daqing oilfield.
Energies 13 03243 g009
Figure 10. EROI of wind turbines based on power rating in kW.
Energies 13 03243 g010
Table 1. Definitions of Small Wind Turbines (SWTs) worldwide.
Organization NameHeadquarter LocationPower Capacity
Canadian Wind Energy Association (CanWEA)Canada<1~300 kW
National Renewable Energy Laboratory (NREL)USA1~100 kW
National Standards Authority of Ireland (NSAI)Ireland<50 kW
American Wind Energy Association (AWEA)USA<100 kW
World Wind Energy Association (WWEA)Germany6 W~300 kW
RenewableUKUK1.5~50 kW
Table 2. Weather data inputs.
DateTimeRoughness Length, mAtmospheric Pressure at Sea Level, PaAir Temperature at the Height of 10 m, KWind Speed at the Height of 10 m, m/s
2018-04-0100:00:000.151.01 × 105280.607.30
2018-04-0103:00:000.151.01 × 105287.2016.42
2018-04-0106:00:000.151.00 × 105291.9010.94
2018-04-0109:00:000.159.99 × 104290.7014.59
2018-04-0112:00:000.159.98 × 104288.7012.77
2018-04-0118:00:000.159.95 × 104286.609.12
2018-04-0121:00:000.159.97 × 104284.707.30
Table 3. Selected SWT specification.
ParametersValues
Configurationhorizontal axis; 3 Blades
Rated power, kW100 @ 12 m/s
Hub height, m18
Rotor diameter, m20.8
Swept area, m2339.80
Direction of rotationclockwise looking upwind
Cut-in wind speed, m/s3
Cut-out wind speed, m/s25
Drivetraindirect drive
Table 4. Special costs of wind turbines in different sizes.
Wind Turbine Size, kWMicro (<20)Small (20–200)Medium (>200)
specific cost, 1/kW2200–30001250–2300700–1600